Embed Size (px)
Citation preview

Computational Water, Energy, and Environmental Engineering, 2013, 2, 81-91 doi:10.4236/cweee.2013.22B014 Published Online April 2013 (http://www.scirp.org/journal/cweee)
Variations in the Water Quality of an Urban River in Nigeria
F. A. Oginni Department of Civil Engineering, College of Science, Engineering and Technology, Osun State University
Email: [email protected], [email protected]
Received 2013
ABSTRACT
Sango-Ota is the industrial nerve centre of Ogun State in Nigeria. River Atuara is an urbanized river in this town. The aim of this study is to assess the quality of water in the river along its 13 km urbanized stretch within Owode – Ota and Gbenga quarters of Sango – Ota in Ogun State, Nigeria. A study of some physical and chemical analysis was carried out to determine the level of pollution in the river. Total Dissolved Solids, TDS, pH, Colour and Temperature measure-ments were obtained for nine locations on the 21 km river stretch. Laboratory analyses were carried out at 4 locations along the water course for the following parameters: pH, Conductivity, Turbidity, DO, BOD, COD, TDS, TSS. Others include Phosphate, Chloride, Nitrate, Sulphate, Cadmium, Lead, Iron, Copper, Zinc, and Nickel. Results indicate that the water quality reduces downstream of the urbanized stretch. Some of the level of heavy metals in the river calls for concern. At Owode, the lead content of 0.11 mg/L is too high compared to a maximum of 0.01 mg/l permissible, which can cause cancer. This can interfere with Vitamin D metabolism, and can affect mental development in infants. It is toxic to the central and peripheral nervous systems. Cadmium is below 0.002 which is just below the 0.003 mg/l per-mitted in Nigeria. Nickel content was 0.046 mg/l between Owode and Ewupe and this is above the maximum permissi-ble level of 0.02 for Nigeria. This has the possibility of carcinogenic health impact. Owode and Ewupe have greater industrial impacts than the other two locations, Igboloye and Gbenga. The trends of each of the 21 parameters from the urbanized stretch of the river have been observed to follow a pattern that can be categorized as similar, mirrored, som-ersault and composite of mirrored and somersault. More studies were recommended in this direction as well as in de-termining the locations of factories and industries contributing to the pollution level around Ewupe and their effluent disposal programs will need to be ascertained. Keywords: Urbanized Water; Physical Chemical; Analysis; Health; Impact
1. Preamble
Sango-Otta urban community is the industrial nerve cen-tre of Ogun State. It can be regarded as an extension of Lagos. River Atuwara is the major river that drains the Sango-Otta community. The level of pollution in this urbanized stretch of the river is of concern to the com-munity because of the level of industrialization within this community. Ekweozor and Agbozu, 2001 [1] had reported how environment degradation, environmental deterioration and underdevelopment issues in Nigeria had been of concern at both national and international levels. Nasrullah et al., [2] 2006 indicated that rapid in-dustrialization is having direct and indirect adverse ef-fects on our environment. Nwidu et al.,2008 [3] showed that quality of water and prevalent water related diseases in hospitals were casually related to contamination of the river within the community. Adekunle, 2009 [4] deduced that the qualities of wells were affected by proximity to river used as disposal of industrial effluent. There is
therefore the need to carryout water quality studies on urbanized rivers within our communities. Studies on various aspects of water quality studies had been carried out on Nigerian waters. Workers in this respect include: Izonfuo and Bariweni, 2001 [5] on the Epie creek of in the Niger Delta; Wakawa et al., 2008 [6] on surface wa-ter of River Challawa Kano, Nigeria; Fakayode, 2005 [7] on Alaro River in Ibadan, Nigeria; Rim-Rukeh et al., 2006 [8] on effects of Agricultural Activities on Orogodo River, Agbor Nigeria; Ahmed and Tanko, 2000 [9] on water quality changes for irrigation within River Hadejia Catchment; and Arimoro, et al., 2007 [10] on impact of Sawmill Wood Wastes on the Water Quality and Fish Communities of Benin River, Niger Delta Area, Nigeria. Other workers in this field include Gaballah et al., 2005 [11]; Neal and Robson, 2000 [12]; FEPA,1991 [13]; USEPA,2000 [14]; WHO,2000 [15]; APHA, 2005 [16]; Robson and Neal, 1997 [17]; Inoue and Ebise, 1999 [18]; Walter, 1987 [19]; Isiorho and Oginni, 2008 [20]; Akpan,
Copyright © 2013 SciRes. CWEEE
F. A. OGINNI 82
et al., 2008 [21]; and Fawell, 2007 [22]. The aim of this study is to determine the variations in the physical- chemical parameters that can be used to determine the level of pollution along the urbanized stretch of River Atuwara. This will further be analyzed in line with the land use within the basin.
River Atuwara is located in the Ifo – Ota district of Ogun state Nigeria. It takes its source from the Adenrele area of Ifo district in Ogun state having a relief of 200m above mean sea level. The river meanders from its source to cross the old Lagos-Abeokuta express road at Owode, passing through Ewupe, Benja and Igbolye after which it crosses another major road, Idiiroko road at Iju. The flood plain of the river is observed to be swampy indi-cating abundance of loamy and sandy soils within. The natural vegetation type in the catchment area is the tropical or lowland rain forest. The river together with another river, R. Iju have a confluence point at Iju lo-cated after Canaan land on Idiroko road, Ota where it is now named river Iju.
2. Materials and Methods
2.1. Reconnaissance Survey
A reconnaissance survey of the catchment area of the Atuwara basin from the source to beyond the urbanized stretch of the river was undertaken to be able to plan and collect necessary data and information on the land and water use of the basin. A 1:50,000 topographical map of Ifo/Ota was obtained from the Ministry of Lands and Survey located in Okelewo, Abeokuta. Materials em-ployed for the reconnaissance survey include the follow-ings:
Reconnaissance survey kits Global positioning system (GPS) TDS meter Stop watch
Measuring tape (50M) pH meter and Thermometer At areas where the river had to be traversed and or
crossed in some other instances, canoes were hired. Ser-vices of some native Site assistants were also used so as to be able to create soft landing pads in possible hostile communities as well as making navigation less demand-ing.
Data collected during the reconnaissance survey in-clude the following:
Communities that use the river Economic activities Religious practices/rites in the area Usage of the river along its stretch Sources of pollution to the river Nature of pollution
2.2. Materials and Methods for the Physical Analysis
In assessing the quality of water in river channels, sev-eral physical, chemical, and biological analyses are re-quired. The most common physical analyses are pH, temperature and dissolved solids. Survival of fishes and aquatic invertebrates depend on the right pH and tem-peratures. Akpan et al., 2008 [23] used pH as criteria for evaluation in their modeling and simulation of the effect of effluent from Kaduna Refinery and Petrochemical Company, KRPC, on the quality of R. Kaduna. The physical parameters considered in this study are Tem-perature, pH, and Total Dissolved Solids (TDS). These parameters were measured in-situ for nine locations and are considered as preliminary assessment of the quality of water in the channel. The locations are:
Adenrele Onihale Owode Ewupe Mosafejo Benja Igboloye Gbenga1 Gbenga
Mosafejo and Benja are located, respectively on rivers Iju and Atuwara, at same distance from the confluence point, Igboloye. Mosafejo, though not urbanized, is con-sidered separately because of its proximity to both Ig-boloye and Benja. The urbanized stretch is from Onihale to Gbenga. Other parameters determined on the field include colour, odour, turbidity, and the velocity of flow.
Temperature was measured with the aid of a digital thermometer. Measurements of both the water tempera-ture and the ambient temperature were measured and values recorded in degrees Celsius(℃).
The pH and total dissolved solids (TDS) or electrical conductivity (EC) of the raw water samples were meas-ured with HANNA HI 9810 pH-TDS meter. The meter was standardized with a buffer solution (i.e. buffer 7 and 9). The buffer tablet was distilled in a 100ml of water in a beaker. The probe of the meter is then placed in the solution and adjusted to read 000 to standardize it. The electrode response was checked by measuring the pH of the test sample, first with distilled water and then with the sample. The system was allowed to stabilize before the final reading was made.
The velocity of the river flow was measured using the float method. The floats used were pieces of polystyrenes placed on river surface made to travel known distances along the river. The time taken to travel specific dis-tances were measured. The velocity of flow was the computed.
2.3. Raw Water Sample Collection and Preservation
The materials required for raw water sample collection and preservation are as follows:
Copyright © 2013 SciRes. CWEEE
F. A. OGINNI
Copyright © 2013 SciRes. CWEEE
83
2l-bottles De-ionized distilled water Masking tape Cooling facility Canoe Digital Camera GPS and Services of Local Assistants Water samples were collected in clean containers dur-
ing analysis and the quantity collected at any given time depends on the number of parameters wanted. In most cases 2-liter samples may be sufficient. It is essential to take the sample to the laboratory for testing immediately after collection. This is such that the parameters required are not altered due to variance in temperature or ambient condition. This could render the results from the labora-tory invalid.
The raw water samples that could not be taken to the laboratory the same day were preserved. Since our water samples were for bacteriological analysis the collection bottles were always sterilised. The samples were left in a refrigerator set at 4℃, a temperature where bacteria are inactivated. The parameters, preservation required and maximum periods are indicated in Table 1.
Raw water samples were collected from four strategic locations along the urbanized stretch of the river. These are Owode, Ewupe, Igboloye and. Gbenga. The two liters capacity bottles were washed normally using detergent and then rinsed properly with de-ionized distilled water were used for collection and storage of samples. During collection, the sample bottles were rinsed again with the water samples twice. Each bottle was tagged with differ-ent labels on masking tape for identification purposes. The samples were put in cooling facility for adequate preservation after collection in readiness for the labora-tory located some 15 km to the site. Laboratory services were provided by Messrs. Triple “E” Systems Associates Ltd. (RC No. 108,343), and with Laboratory Services
DPR Permit No. RC 0733/2008. Generally, the parameters considered are as follows: Ph; Conductivity (S/cm); Turbidity (FTU); Colour; DO(mg/L); BOD (mg/L); COD (mg/L) Total Dissolved Solids (mg/L); Total Suspended Solids(mg/L); Phosphate(mg/L); Chloride (mg/L); Nitrate (NO3-) (mg/L); Sulphate (SO4
-2) (mg/L); Cadmium (mg/L); Lead (mg/L); Iron (mg/L); Copper (mg/L); Zinc(mg/L); Nickel (mg/L)
3. River Atuwara Drainage Basin and Land Use Survey Report
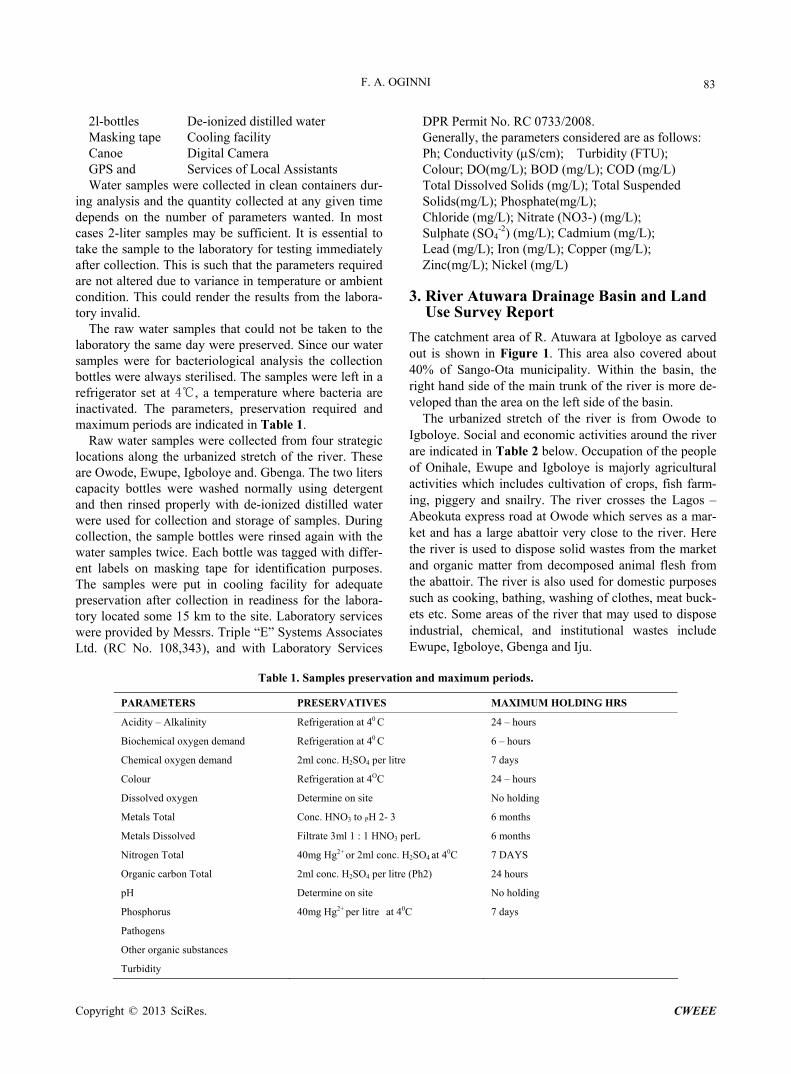
The catchment area of R. Atuwara at Igboloye as carved out is shown in Figure 1. This area also covered about 40% of Sango-Ota municipality. Within the basin, the right hand side of the main trunk of the river is more de-veloped than the area on the left side of the basin.
The urbanized stretch of the river is from Owode to Igboloye. Social and economic activities around the river are indicated in Table 2 below. Occupation of the people of Onihale, Ewupe and Igboloye is majorly agricultural activities which includes cultivation of crops, fish farm-ing, piggery and snailry. The river crosses the Lagos – Abeokuta express road at Owode which serves as a mar-ket and has a large abattoir very close to the river. Here the river is used to dispose solid wastes from the market and organic matter from decomposed animal flesh from the abattoir. The river is also used for domestic purposes such as cooking, bathing, washing of clothes, meat buck-ets etc. Some areas of the river that may used to dispose industrial, chemical, and institutional wastes include Ewupe, Igboloye, Gbenga and Iju.
Table 1. Samples preservation and maximum periods.
PARAMETERS PRESERVATIVES MAXIMUM HOLDING HRS
Acidity – Alkalinity Refrigeration at 40 C 24 – hours
Biochemical oxygen demand Refrigeration at 40 C 6 – hours
Chemical oxygen demand 2ml conc. H2SO4 per litre 7 days
Colour Refrigeration at 4OC 24 – hours
Dissolved oxygen Determine on site No holding
Metals Total Conc. HNO3 to PH 2- 3 6 months
Metals Dissolved Filtrate 3ml 1 : 1 HNO3 perL 6 months
Nitrogen Total 40mg Hg2+ or 2ml conc. H2SO4 at 40C 7 DAYS
Organic carbon Total 2ml conc. H2SO4 per litre (Ph2) 24 hours
pH Determine on site No holding
Phosphorus 40mg Hg2+ per litre at 40C 7 days
Pathogens
Other organic substances
Turbidity
F. A. OGINNI 84
LEGEND: R. Atuara Drainage Basin
Sango-Otta – Idiroko Road
Lagos – Abeokuta Express Road
Ifo Otta District Boundary Line
Canaan land, Idiroko Road
Owode
Ewupe
Igboloye
Gbenga
Adenrele
Mosafejo
Benja
Onihale
Canaanland
Gbenga1
Figure 1. R. Atuara drainage network and catchment area at igboloye.
Table 2. Location of Settlements along R. Atuwara and Land use.
S/No Sample Location Distance From Source (Km) Land / Water use
1 Adenrele 0 Fishing and domestic purposes
2 Onihale 6 Farming and waste disposal
3 Owode 8 Market, Abattoir, and Cloth washing
4 Ewupe 12 Domestic use but smelly water
5 Benja 16.8 Livestock and fishing. Bad odour
6 Igboloye 18.6 Domestic use and Shrine
7 Gbenga1 20.0 Domestic and Farming
8 Gbenga 21.0 Farming and Fishing
Copyright © 2013 SciRes. CWEEE
F. A. OGINNI
Copyright © 2013 SciRes. CWEEE
85
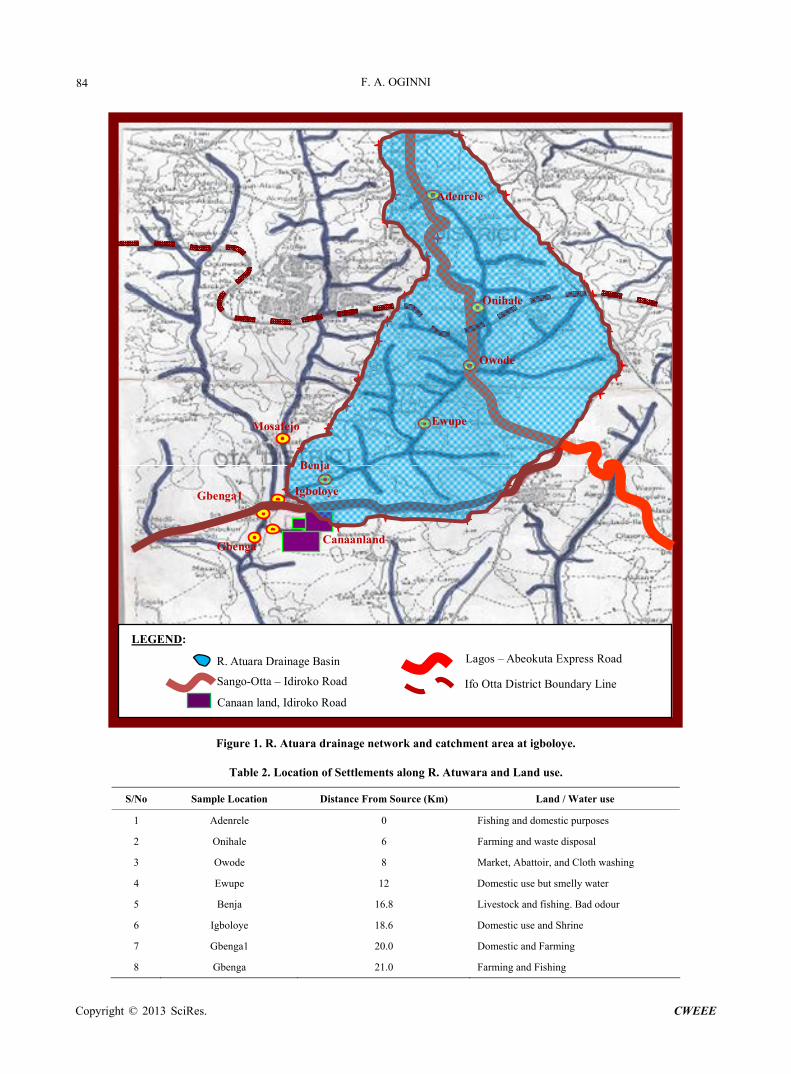
Typical uses of the urbanized river at different loca-
tions are indicated in Plates 1 - 4 below. disposal of solid wastes both organic and inorganic. It is also used for domestic purposes such as bathing, cooking, and cloth washing, (laundering),
The variations of the ambient temperature and the wa-ter temperature along the river are shown in Figure 2.
4.1. Chemical Analysis
Chemical analysis was carried out on samples from four sites because these particular sites have peculiar events occurring around them such as the presence of pharma-ceutical industries, contact with wastewater from institu-tion, mixed agricultural activities e.t.c. The analysis car- ried out on them includes Conductivity(S/cm), Turbid-ity (FTU), DO (mg/L), BOD (mg/L), COD (mg/L), Total Dissolved Solids (mg/L), Total Suspended Solids(mg/L), Phosphate (mg/L), Chloride (mg/L), Nitrate(NO3
-)(mg/L), Sulphate(SO4
2-)(mg/L), Cadmium(mg/L), Lead(mg/L), Iron(mg/L), Copper(mg/L), Zinc (mg/L), Nickel (mg/L). Results of the analysis and expected standards by Nigeria and World Health Organization, WHO, are presented in Table 4.
4. Analysis and Discussion of Results
Results of preliminary and physical assessment of nine locations around the water in the channel are presented in Table 3.
Occupation of the people around the river is majorly agricultural, including fish farming. The river is used for
Table 3. Temperature, Color, pH and Total Dissolved Solids in the Channel.
Temperature (0C) S/N Location
Ambient Water Colour pH Total Dissolved Solids (ppm) Remarks
1 Adenrele 31.5 26.7 Slightly Clear 5.5 0.49 Source
2 Onihale 32.4 26.3 Mudish brown 6.5 0.53
3 Owode 31.4 26.5 Light brown 5.8 0.52 Urbanized
4 Ewupe 30.1 26.3 Greenish but slightly clear 5.3 0.57 Urbanized
5 Mosafejo 31.5 26.7 Clear 5.4 0.28
6 Benja 28.0 26.4 Light brown 5.5 0.56 Urbanized
7 Igboloye 27.2 26.3 Light brown 5.5 0.53 Urbanized. Serves as shrine
8 Gbenga1 26.8 26.4 Light brown 5.5 0.44
9 Gbenga2 28.5 26.2 Mudish brown 6.7 0.59 Lots of dirt
Figure 3. pH and total dissolved solids (TDS) at specified Figure 2. Ambient and water temperature (˚C).
F. A. OGINNI 86
locations.
Table 4. Results of water analysis and expected standards by nigeria and WHO.
STANDARD S/No Parameter Owode Ewupe Igboloye Gbenga
NIGERIA WHO
Distance from source (km) 8.0 12.0 18.6 21.0
1 pH 7.69 7.16 7.38 7.39 6.5-8.5 6.5-7.5
2 Conductivity µS/cm 141 136 152 178 1,000 500
3 Turbidity ND 2.00 26.00 85.00 - 5.0 NTU*
4 Color Faint Yellow Faint Yellow Faint Yellow Brownish Yellow 3.0 TCU**
5 DO mg/l 4.60 0.80 7.40 3.80 - -
6 BOD mg/l 1.40 0.80 2.80 3.60 - -
7 COD mg/l 40.00 60.00 28.00 20.00 - -
8 TDS mg/l 82.00 70.00 79.00 92.00 500 1,000
9 TSS mg/l 35.00 40.00 45.00 108.00
10 Phosphate mg/l 1.133 0.981 1.140 0.812 - -
11 Chloride mg/l 3.80 4.70 6.80 3.10 250 250
12 Nitrate mg/l 0.003 0.181 0.001 0.012 50 50
13 Sulphate mg/l 10.00 13.00 17.00 14.00 100 250
14 Cadmium mg/l <0.002 <0.002 <0.002 <0.002 0.003 Not done
15 Lead mg/l 0.11 <0.01 <0.01 <0.01 0.01 Not considered
16 Iron mg/l 1.922 1.161 1.850 1.927 0.3 “
17 Copper mg/l 0.091 0.067 0.080 0.115 1 “
18 Zinc mg/l 0.0654 0.0778 <0.001 0.0240 3 “
19 Nickel mg/l 0.046 0.046 0.012 0.116 0.02 “
*Nephelometric turbidity unit; **True color unit.
The results for the 4 sites are presented graphically
from Figure 4 to Figure 21. The following are deductions from the analysis: The areas that are of concern are the concentrations of
the following parameters: (i) Conductivity (ii) Turbidity (iii) Lead at Owode (iv) Iron (v) Nickel The concentrations of these chemical parameters are
above the WHO and Nigerian standards. All the four sites except Owode, which has highest pH
value of 7.69, (Figure 4), fell within the ranges given by Nigeria and WHO standards. The pH at Owode was above the range specified by WHO.
Generally conductivity in the river channel at all the locations were below both WHO and Nigerian standards. However, conductivity fell slightly below the Owode value at Ewupe to continue rising along the urbanized
river stretch. This is shown in Figure 5.
Figure 4. pH trend urbanized stretch.
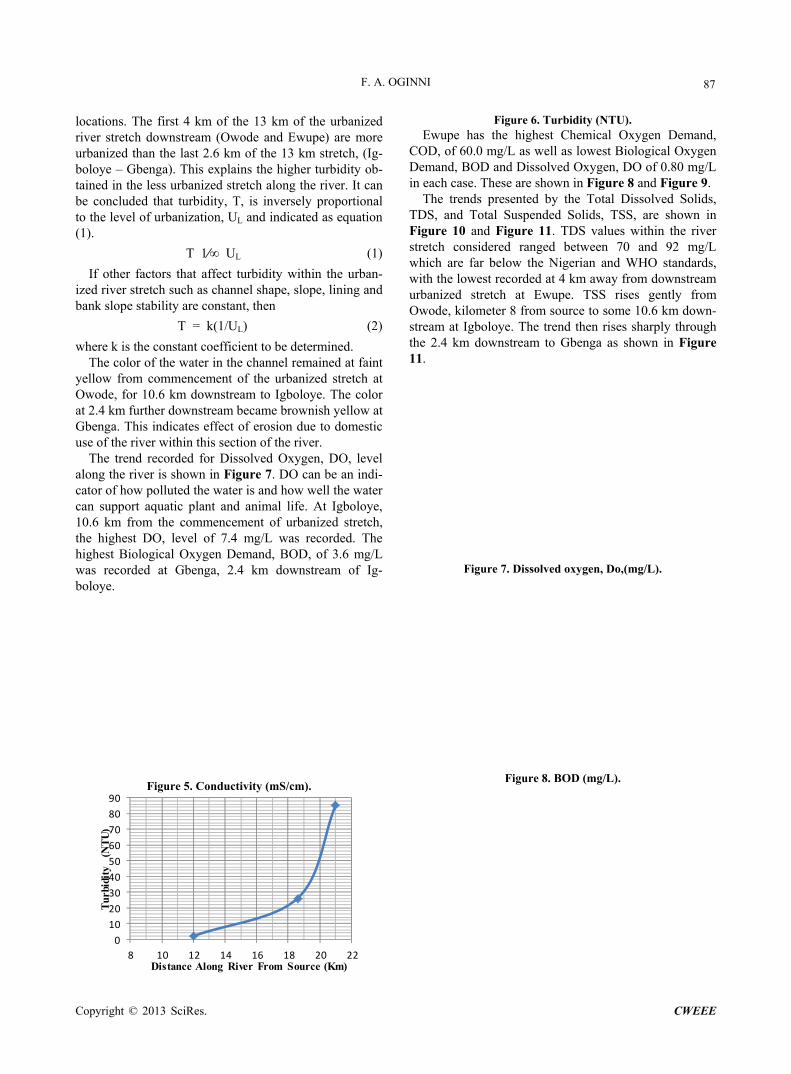
The river is more turbid at both Igboloye and Gbenga at kilometers 18.6 and 21 respectively as shown in Fig-ure 6. This can be accounted for by the use of the river for domestic purposes, like washing and farming at both
Copyright © 2013 SciRes. CWEEE
F. A. OGINNI 87
locations. The first 4 km of the 13 km of the urbanized river stretch downstream (Owode and Ewupe) are more urbanized than the last 2.6 km of the 13 km stretch, (Ig-boloye – Gbenga). This explains the higher turbidity ob-tained in the less urbanized stretch along the river. It can be concluded that turbidity, T, is inversely proportional to the level of urbanization, UL and indicated as equation (1).
T 1⁄∞ UL (1)
If other factors that affect turbidity within the urban-ized river stretch such as channel shape, slope, lining and bank slope stability are constant, then
T = k(1/UL) (2)
where k is the constant coefficient to be determined. The color of the water in the channel remained at faint
yellow from commencement of the urbanized stretch at Owode, for 10.6 km downstream to Igboloye. The color at 2.4 km further downstream became brownish yellow at Gbenga. This indicates effect of erosion due to domestic use of the river within this section of the river.
The trend recorded for Dissolved Oxygen, DO, level along the river is shown in Figure 7. DO can be an indi-cator of how polluted the water is and how well the water can support aquatic plant and animal life. At Igboloye, 10.6 km from the commencement of urbanized stretch, the highest DO, level of 7.4 mg/L was recorded. The highest Biological Oxygen Demand, BOD, of 3.6 mg/L was recorded at Gbenga, 2.4 km downstream of Ig-boloye.
Figure 5. Conductivity (mS/cm).
0
10
20
30
40
50
60
70
80
90
8 10 12 14 16 18 20 2
Tur
bidi
ty
(NT
U)
Distance Along River From Source (Km)
Figure 6. Turbidity (NTU). Ewupe has the highest Chemical Oxygen Demand,
COD, of 60.0 mg/L as well as lowest Biological Oxygen Demand, BOD and Dissolved Oxygen, DO of 0.80 mg/L in each case. These are shown in Figure 8 and Figure 9.
The trends presented by the Total Dissolved Solids, TDS, and Total Suspended Solids, TSS, are shown in Figure 10 and Figure 11. TDS values within the river stretch considered ranged between 70 and 92 mg/L which are far below the Nigerian and WHO standards, with the lowest recorded at 4 km away from downstream urbanized stretch at Ewupe. TSS rises gently from Owode, kilometer 8 from source to some 10.6 km down-stream at Igboloye. The trend then rises sharply through the 2.4 km downstream to Gbenga as shown in Figure 11.
Figure 7. Dissolved oxygen, Do,(mg/L).
Figure 8. BOD (mg/L).
2
Copyright © 2013 SciRes. CWEEE
F. A. OGINNI 88
Figure 9. COD (mg/L).
Figure 10. Total dissolved solids (mg/L).
Figure 11. Total suspended solids (mg/L).
The trends presented by Phosphate and Chloride are indicated in Figure 12 and Figure 13. The trends are similar from a distance of 12 km through downstream of the urbanized stretch. The trend presented by Nitrate, shown in Figure 14 indicates a somersault trend of that of Phosphate. At kilometer 12 from source, Ewupe has the lowest Phosphate level as well as the highest Nitrate level. Also at 18.6 km from the source, the highest phos-phate level was recorded with the lowest level for Ni-trate.
The trend for Sulphate level along the urbanized stretch is shown in Figure 15. This trend is somehow similar to that of Chloride asshown in Figure 13. Both indicate highest levels at Igboloye, 18 km from the source, although the sulphate level did not fall below the Owode level as was the case for Chloride levels.
From results, the water in the channel is free from problems that may arise through higher levels of Cad-mium, (Figure 16). At all the investigated stations, Cad-mium levels were lower than 0.002 mg/L which in turn are lower than 0.003 mg/L limit stipulated by Nigerian standard.
Figure 17 indicates that the lead level in the river at the beginning of urbanization, is of great concern at Owode, 8 km from the river source. The expected Nige-rian standard for lead is 0.01 mg/L and the levels at other locations are lower, that at Owode is 10 times greater at 0.11 mg/L.
The iron content in the river at all the locations ranged
between 1.161 mg/L and 1.927 mg/L which are far above the 0.3 mg/L standard for Nigeria. However it records the lowest level at Ewupe (Figure 18).
Figure 12. Phosphate (mg/L).
Figure 13. Chloride (mg/L).
Figure 14. Nitrate (NO-3) (mg/L).
Copyright © 2013 SciRes. CWEEE
F. A. OGINNI 89
Figure 15. Sulphate (SO4-2)(mg/L).
Figure 16. Cadmium (mg/L).
Figure 17. Lead (mg/L).
Figure 18. Iron (mg/L).
Copper contents in the river more or less followed the same trend as that of iron. This can be deduced from Figure 19. They are also below the Nigerian standard.
Zinc contents at all considered river locations fell be-low standards specified by Nigeria. Igboloye has the lowest Zinc level, as indicated by Figure 20.
The obtained result for Nickel content in the river (Figure 21) indicates that only Igboloye, 18.6 km from the source is below the standards set by Nigeria. The others are above thereby suggesting that it can possibly be carcinogenic.
Generally the quality of the water in the channel dete-riorated greatest at Ewupe, 12 km downstream of the source and 4 km downstream of the commencement of
urbanized river stretch.
Figure 19. Copper (mg/L).
Figure 20. Zinc (mg/L).
Figure 21. Nickel (mg/L).
4.2. Physical-Chemical Parameter Trend Analysis
It is observed that the results of many of the parameters along the urbanized stretch as presented by Figure 4 through Figure 21 have followed some interesting trends. The trends can be categorized as
(i) Similar trends (ii) Mirrored Trends (iii)Somersault trends (iv) Composite trends The parameters that are grouped under each category
are indicated in Table 5. The trends can be used for modeling water quality pa-
Copyright © 2013 SciRes. CWEEE

F. A. OGINNI
Copyright © 2013 SciRes. CWEEE
90
rameters.
Table 5. Grouped parameters and trend categories.
CATEGORY GROUP
SIMILAR MIRRORED SOMERSAULT COMPOSITE REMARKS
1 pH and Iron DO DO BOD
Iron Zinc Zinc COD
Chloride
Iron
Sulphate* *Apologetic
2 Conductivity COD BOD
TDS Chloride COD
Copper
3 Chloride TSS
Sulphate Lead
5. Conclusions and Recommendations
5.1. Conclusions
The urbanized stretch of R. Atuwara right from upstream at Owode to downstram at Gbenga had experienced dif-ferent levels of pollution at different points as a result of varied activities along the river. Generally the quality deteriorated downstream.
Results of the physical and chemical analyses carried out pointed to some areas of concern. These are dis-cussed below.
(i) The pH level at Owode, the beginning of the ur-banized stretch is greater than the WHO standard, though within Nigeria’s standard.
(ii) Conductivity levels are lower than both WHO and Nigerian standards. It is lowest at Ewupe, 4 km down-stream of beginning of the urbanized river stretch. The sharpness of its rise within this stretch along the stream may be of concern since sudden increases in conductivity indicate that there is a source of dissolved ions in the vicinity. It can be used as an indication of potential water quality problems.
(iii) The DO level at Ewupe shows that the water qual-ity at this point is the poorest, (ciese.org). This indicates that some fish and macro invertebrate populations will begin to decline (ciese.org). Most warm water fish need DO in excess of 2 mg/L to survive.
(iv) Lead level at Owode. (v) Iron content levels through the river stretch is
greater than recommended level. (vi) The concentration of iron rose from Ewupe down-
stream through to Gbenga. (vii) Nickel content in the river along the stretch ex-
cept at Igboloye is greater than the Nigerian standard. Nickel above this shows possible carcinogenic condition. Nickel level at Gbenga is worst.
(viii) From observations of the Figure 4 through Fig-ure 21, the trends presented by some parameters may suggest categorization of the trends into 3 or 4. Some trends are similar to themselves, some seem to be mirror images of others, while some other ones seem to follow somersault trends of some other ones. A fourth trend can be a composite of the somersault and mirrored trends. This exercise may lead to modeling of behaviors of some parameters from known parameters.
5.2. Recommendations
There is need to carry out further studies on the locations of factories and industries around Ewupe and their efflu-ent disposal programs will need to be ascertained.
2 Further studies is required in the areas of concerns highlighted in the conclusions above and necessary measures put in place to combat the problems that may result.
3 Further studies is also required to investigate the possibilities of modeling an unknown water quality from some known ones initiated by observed similarity or oth-erwise of the trends along the urbanized river.
4 The river should not be used as a source of disposal for in-habitants along its course. Rather wastes may be properly disposed using other disposal approaches to improve the river quality.
5 Government and stakeholders should put into place more stable laws and regulations with proper enforce-ment so as to guide river use and maintenance program that will incorporate users from the villages around the river course.
6 The different organizations using the river as a source of wastewater disposal should be well monitored by the concerned authorities.
7 Communities along the river course should be
F. A. OGINNI 91
enlightened on the possible consequences of pollution by introducing public awareness program.
REFERENCES [1] I. K. E. Ekweozor and I. E. Agbozu, “Surface Water Pol-
lution Studies of Etelebou Oil Field in Bayelsa State, Ni-geria,” African Journal Science, Vol. 2, 2001, pp. 246-254.
[2] R. N. Nasrullah, B. Hamida, I. Mudassar and M. I. Dur-rani, “Pollution Load in Industrial Effluent and Ground Water of Gadoon Amazai Industrial Estate (GAIE) SSWABI, NWFP,” Journal of Agricultural and Biologi-cal Science, Vol. 1, No.3, 2006, pp. 18-24.
[3] L. L. Nwidu, B. Oveh, T. Okoriye and N. A. Vaikosen, “Assessment of the Water Quality and Prevalence of Wa-ter Borne Diseases in Amassoma, Niger Delta, Nigeria,” African Journal of Biotechnology, Vol. 7, No.17, 2008, pp. 2993-2997.
[4] A. S. Adekunle, “Effects Of Industrial Effluent On Qual-ity Of Well Water Within Asa Dam Industrial Estate, Ilorin Nigeria,” Nature and Science, Vol. 7, No. 1, 2009, pp. 39-43.
[5] L. W. A. Izonfuo and P. A. Bariweni, “The Effect of Ur-ban Run-off Water and Human Activities on some Phys-ico-chemical Parameters of the Epie Creek of in the Niger Delta,” J. Appl. Sci. Environ. Manage. Vol.5, No.1, 2001, pp. 47-55.
[6] J. I. Wakawa, A. Uzairu, J. A. Kagbu, and M. L. Balarabe, “Impact Assessment of Effluent Discharge on Physico-Chemical Parameters and some Heavy Metal Concentra-tions in Surface Water of River Challawa Kano, Nigeria,” African Journal of Pure and Applied Chemistry, Vol. 2 No.10, 2008, pp. 100-106.
[7] S. O. Fakayode, “Impact Assessment of Industrial Efflu-ent on Water Quality of the Receiving Alaro River in Ibadan, Nigeria,” AJEAMRAGEE, Vol.10, 2005, pp. 1-13.
[8] A. Rim-Rukeh, O. G. khifa, and A. P. Okokoyo, “Effects of Agricultural Activities on the Water Quality of Orogodo River, Agbor Nigeria,” Journal of Applied Sci-ences Research, Vol. 2, No. 5, 2006, pp. 256-259.
[9] Ahmed K and A. I. Tanko, “Assessment of Water Quality Changes for Irrigation in the River Hadejia Catchment,” J. Arid Agriculture, Vol.10, 2000, pp. 89-94.
[10] F. O. Arimoro, R. B. Ikomi, and E. C. Osalor, “The Im-pact of Sawmill Wood Wastes on the Water Quality and Fish Communities of Benin River, Niger Delta Area, Ni-geria,” International Journal of Science & Technology, Vol. 2, No. 1, 2007, pp. 1-12.
[11] M. S. Gaballah, K. Khalaf, A. Beck, and J. Lopez, “Water Pollution in Relation to Agricultural Activity Impact in
Egypt,” Journal of Applied Sciences Research, Vol.1, 2005, pp. 9-17.
[12] C. Neal and A. J. Robson, “A Summary of River Water Quality Data Collection Within the Land-Ocean Interac-tion Study: Core Data for Eastern UK Rivers Draining to the North Sea,” Science of the Total Environment, Vol. 251/252,2000,pp.585-665. doi:10.1016/S0048-9697(00)00397-1
[13] Federal Environmental Protection Agency, (FEPA), “Guideline and Standards for Environmental Pollution in Nigeria. FEPA, Nigeria, 1991.
[14] United States Environmental Protection Agency, (USEPA), “2000 National Water Quality Inventory,” http://www.epa.gov/305b/2000report/retrieved August 6, 2003.
[15] World Health Organisation, (WHO), “WHO Guidelines for Drinking Water Quality, Training Pack, Rome: WHO, 2000.
[16] American Public Health Association, (APHA), “Standard Methods for the Examination of Water and Wastewater,” 21st Edition American Public Health Association, Ameri-can Water Works Association, and Water Pollution Con-trol Federation. Washington, DC., 2005.
[17] A. J. Robson and C. Neal, “A Summary of Regional Wa-ter for Eastern UK Rivers,” Science of the Total Envi-ronment, Vol. 194-195, 1997, pp.15-39. doi:10.1016/S0048-9697(96)05351-X
[18] T. Inoue and S. Ebise, “Run off Characteristics of COD, BOD, C. N and P Loading from Rivers to Enclosed Coastal Seas,” Marine Pollution Bulletin, Vol. 23, 1991, pp. 11-14. doi:10.1016/0025-326X(91)90641-5
[19] L. Walter, “Handbook of Water Purification,” Ellis Hor-wood, New York, 1987, pp. 85-90.
[20] S. A. Isiorho and F. A. Oginni, “Assessment of Waste-water Treatment in Canaan land, Ogun State, Nigeria,” 1st Postgraduate Researchers’ Conference on Meeting Environmental Challenges in the Coastal Region of Nige-ria, Sept.29-30, 2008. University of Abertay, Dundee, UK.
[21] U. G. Akpan, E. A. Afolabi and K. Okemini, “Modeling and Simulation of the Effect of Effluent from Kaduna Re-finery and Petrochemical Company on River Kaduna,” AU Journal of Technology, AU J. T., Vol.12, No. 2, Oct. 2008, pp. 98-106.
[22] J. Fawell, “Drinking Water Standards and Guidelines. Foundation for Water Research,” Allen House, The Lis-tons, Liston Road, Marlow, Bucks SL 7 1FD, UK. Febru-ary, 2007.
Copyright © 2013 SciRes. CWEEE