Embed Size (px)
Citation preview

Summary Somatic embryogenesis of Norway spruce (Piceaabies L.) is a versatile model system to study molecular mecha-nisms regulating embryo development because it proceedsthrough defined developmental stages corresponding to spe-cific culture treatments. Normal embryonic development in-volves early differentiation of proembryogenic masses (PEMs)into somatic embryos, followed by early and late embryogenyleading to the formation of mature cotyledonary embryos. Insome cell lines there is a developmental arrest at the PEM–so-matic embryo transition. To learn more about the molecularmechanisms regulating embryogenesis, we compared the tran-script profiles of two normal lines and one developmentally ar-rested line. Ribonucleic acid, extracted from these cell lines atsuccessive developmental stages, was analyzed on DNAmicroarrays containing 2178 expressed sequence tags (ESTs)(corresponding to 2110 unique cDNAs) from loblolly pine(Pinus taeda L.). Hybridization between spruce and pine spe-cies on microarrays has been shown to be effective (van Zyl etal. 2002, Stasolla et al. 2003). In contrast to the developmen-tally arrested line, the early phases of normal embryo develop-ment are characterized by a precise pattern of gene expression,i.e., repression followed by induction. Comparison of tran-script levels between successive stages of embryogenesis al-lowed us to identify several genes that showed unique expres-sion responses during normal development. Several of thesegenes encode proteins involved in detoxification processes,methionine synthesis and utilization, and carbohydrate metab-olism. The potential role of these genes in embryo develop-ment is discussed.
Keywords: embryo development, gene expression, hybridiza-tion, microarray, Picea abies, Pinus taeda.
Introduction
Plant embryogenesis begins with the division of the fertilizedegg or zygote and culminates with the generation of a matureembryo, comprising an embryonic axis with shoot and rootpoles and cotyledon(s). In gymnosperms, the overall embryodevelopment pathway can be divided in three distinct phases:proembryogeny, which includes stages before the elongationof a suspensor; early embryogeny, which initiates with theelongation of the suspensor and terminates with the appear-ance of the root meristem; and late embryogeny, which culmi-nates with the maturation of the embryo (Singh 1978). Despiteextensive knowledge on the physiological and molecularmechanisms regulating embryo maturation in angiosperms(Kermode 1990, Girke et al. 2000, Ruuska et al. 2002), little isknown about the mechanisms governing the early stages ofembryogenesis. In angiosperms, developmental arrest or aber-rations at the later stages of embryonic and post-embryonic de-velopment are typical consequences of disturbed regulationduring the early stages of embryo development (Dunn et al.1997, Scanlon et al. 1997, Hamann et al. 1999, Heckel et al.1999). The development of mutant analysis in Arabidopsis hasidentified several regulatory genes responsible for normal de-velopment of the suspensor (Vernon and Meinke 1994,Yadegari et al. 1994, Zhang and Sommerville 1997, Rojo et al.2001) and embryo proper (reviewed by Jurgens 2001). In gym-nosperms, long generation times make the selection of em-bryo-specific mutants practically impossible.
Somatic embryogenesis, the process in which embryos,similar in morphology to their zygotic counterparts, are in-duced to develop in culture from somatic cells, represents asuitable model system for investigating factors affecting em-bryo growth. Through this process, a large number of embryosat defined stages of development can easily be obtained. In
Tree Physiology 24, 1073–1085© 2004 Heron Publishing—Victoria, Canada
Variation in transcript abundance during somatic embryogenesis ingymnosperms
CLAUDIO STASOLLA,1,2 PETER V. BOZHKOV,3 TZU-MING CHU,4 LEONEL VAN ZYL,5
ULRIKA EGERTSDOTTER,6 MARIA F. SUAREZ,3 DEBORAH CRAIG,5 RUSS D.WOLFINGER,4 SARA VON ARNOLD3 and RONALD R. SEDEROFF5
1 Department of Plant Science, University of Manitoba, Winnipeg, MB R3T 2N2, Canada2 Corresponding author ([email protected])3 Department of Plant Biology and Forest Genetics, Uppsala Genetic Center, Swedish University of Agricultural Sciences, Box 7080, S-75007,3 Uppsala, Sweden4 SAS Institute Inc., Cary, NC 27513, USA5 Forest Biotechnology Group, Department of Forestry, North Carolina State University, Raleigh, NC 27695-7247, USA6 Institute of Paper Science and Technology, 500 10th Street NW, Atlanta, GA 30318, USA
Received January 5, 2004; accepted March 13, 2004; published online August 2, 2004
gymnosperms, the developmental pathway of somatic em-bryogenesis has been described for Norway spruce, consistingof a sequence of defined developmental stages correspondingto three specific treatments (Filonova et al. 2000a) (Fig-ure 1A). Maintenance of the embryogenic potential throughproliferation of proembryogenic masses (PEMs) occurs in thepresence of the exogenously supplied plant growth regulators(PGR) auxin and cytokinin. Removal of these PGR from themedium reduces cell proliferation in PEMs and initiates earlyembryogeny through trans-differentiation of PEMs into so-matic embryos. From this developmental stage on, the path-way of somatic embryogenesis is similar to zygotic embryodevelopment. Late embryogeny requires abscisic acid (ABA)and involves establishment of root and shoot meristems anddifferentiation of cotyledons (Figure 1A). A critical step dur-ing the overall embryogenic process appears to be the trans-differentiation of PEMs into somatic embryos, requiring theexecution of several physiological events, including program-med cell death (Filonova et al. 2000b, Bozhkov et al. 2002,Smertenko et al. 2003). Normal passage of PEMs to somaticembryos is precluded in some lines, resulting in a develop-mental arrest at the PEM stage (Filonova et al. 2000a, Smer-tenko et al. 2003). Preliminary studies on the molecular mech-anisms regulating the early phases of somatic embryogenesishave revealed several genes with differentially regulated ex-pression between embryogenic and non-embryogenic tissue(Bishop-Hurley et al. 2003, van Zyl et al. 2003). As an exten-sion of this work and to contribute to the understanding of themolecular events associated with gymnosperm embryo-genesis, this study compares the steady-state transcript levelsof more than 2000 cDNAs from loblolly pine in three cell linesof Norway spruce. Of these lines, two were able to form so-matic embryos, whereas the third line had a developmental
block at the PEM–somatic embryo transition. The employ-ment of a pine cDNA array for studies on gene expression inspruce has been documented previously (van Zyl et al. 2002)and implemented (Stasolla et al. 2003). The major objective ofthis work was to identify genes involved in physiological re-sponses, which are required for the normal progression of em-bryo development.
Materials and methods
Plant material
Three lines of Norway spruce (Picea abies L. Karst.) were uti-lized: two normal lines, 61.21 (line N1) and 88.17 (line N2),both of which passed through the PEM–somatic embryo tran-sition, and one developmentally arrested line, 88.1 (line B),where this transition was precluded (Figure 1A). All cell lineswere stored in liquid nitrogen and thawed 5 months beforestarting the experiment. Maintenance of PEMs and initiationof embryo development were performed as previously re-ported (Bozhkov et al. 2002). Briefly, proliferation of PEMswas stimulated using half-strength LP medium (modified afterBozhkov and von Arnold 1998) supplemented with PGRauxin (9.0 µM 2,4-dichlorophenoxyacetic acid (2,4-D)) andcytokinin (4.4 µM N6-benzyladenine (BA)). For maintenanceof embryogenic potential, PEMs were sub-cultured weeklyinto fresh PGR-containing medium. Trans-differentiation ofPEMs into somatic embryos was accomplished through twosuccessive washings of 3-ml settled cell aggregates with 10-mlsamples of half-strength LP medium devoid of PGR, followedby inoculation with 3 ml of washed cells into 47 ml of the samePGR-free medium for 1 week. Continuation of embryo devel-opment, i.e., generation of cotyledonary somatic embryos,
1074 STASOLLA ET AL.
TREE PHYSIOLOGY VOLUME 24, 2004
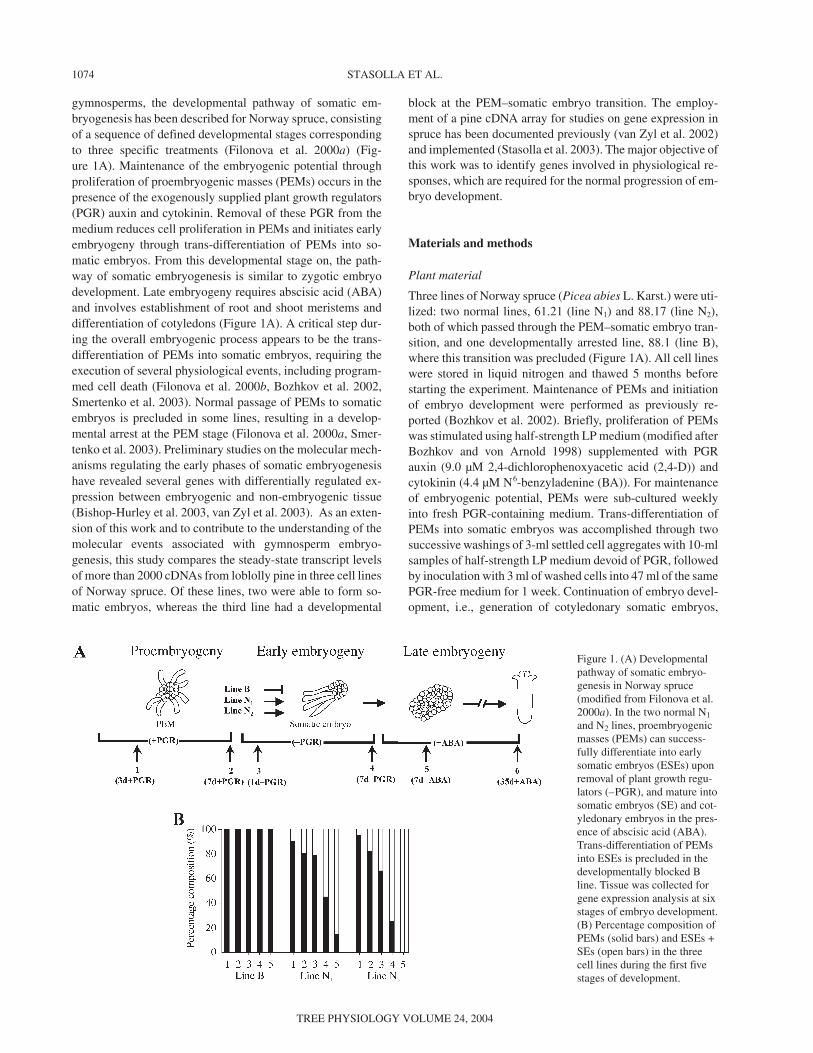
Figure 1. (A) Developmentalpathway of somatic embryo-genesis in Norway spruce(modified from Filonova et al.2000a). In the two normal N1
and N2 lines, proembryogenicmasses (PEMs) can success-fully differentiate into earlysomatic embryos (ESEs) uponremoval of plant growth regu-lators (–PGR), and mature intosomatic embryos (SE) and cot-yledonary embryos in the pres-ence of abscisic acid (ABA).Trans-differentiation of PEMsinto ESEs is precluded in thedevelopmentally blocked Bline. Tissue was collected forgene expression analysis at sixstages of embryo development.(B) Percentage composition ofPEMs (solid bars) and ESEs +SEs (open bars) in the threecell lines during the first fivestages of development.

was carried out by plating 1 ml of settled cell aggregates ontoWhatman No. 2 filter paper placed on solidified BMI-S1 mat-uration medium containing 30 µM ABA. Cotyledonary em-bryos were harvested after 35 days in culture. Sampling ofcells for morphological observations and microarray experi-ments was performed during six stages of embryo develop-ment: Stage 1 (3d+PGR); Stage 2 (7d+PGR); Stage 3(1d–PGR); Stage 4 (7d–PGR); Stage 5 (7d+ABA); and Stage6 (35d+ABA) (see Figure 1A).
Microarray procedure
The elements on the array were selected from 55,000 ex-pressed sequence tags (ESTs) grouped in 9000 contigs. TheseESTs were obtained from five different cDNA libraries:NXNV (Xylem Normal-wood Vertical); NXCI (Xylem Com-pression-wood Inclined); NXSI (Xylem Side-wood inclined);ST (Shoot Tip); and PC (Pollen Cone) (http://web.ahc.umn.edu/biodata/nsfpine/contig_dir6). The cDNAs were selectedclosest to the 3′-end of the respective contig and were run onBLASTX against the database (http://mips.gsf.de/proj/thal/db/search/blast_arabi.html). The best hit from the BLASTsearch grouped the cDNAs into functional categories, as pro-posed for Arabidopsis thaliana (http://pedant.gsf.de; see Ta-ble 1). The selected cDNAs were transformed into Escher-ichia coli XL-1 blue competent cells and the plasmids wereisolated using Qiagen kits. Probe preparation and printingwere carried out as previously described (Stasolla et al. 2003).Clone identities were confirmed by re-sequencing for 86% ofthe cDNAs, including all the clones differentially expressedamong lines.
Target preparation
For each stage of embryo development in the three cell lines(N1, N2 and B), RNA was extracted from 1 g of tissue (freshmass), as described by Chang et al. (1993). The aminoallyl
procedure developed by DeRisi (http://cmgm.stanford.edu/pbrown/protocols/index.html) was followed to label cDNAprobes. The RNA from each sample was labeled with both Cy3and Cy5 dyes and used for reciprocal hybridizations. Hybrid-ization and stringency washes were performed applying theprotocol from the Institute of Genomic Research (TIGR)(Hegde et al. 2000). The slides were scanned with a ScanArray4000 Microarray Analysis System (GSI Lumonics, Ottawa,ON, Canada). Raw, non-normalized intensity values were col-lected with QUANTARRAY software (GSI Lumonics). Usingthe quantification option, spots were visually inspected formorphology and background. A few spots were flagged as un-acceptable and excluded from further analysis.
Experimental design and statistical analysis
A fully balanced, incomplete loop experimental design wasused for each of the three lines, as proposed by Kerr and Chur-chill (2001) and as employed in previous studies (Stasolla etal. 2003). Gene significance was estimated with a mixedmodel analysis of variance (ANOVA) as described by Wol-finger et al. (2001), Jin et al. (2001) and Chu et al. (2002). Thismodeling approach is highly sensitive and shows that changesof less than twofold in gene expression can be statistically sig-nificant. Two linear mixed models were applied in succession:the normalization model (1) and the gene model (2). The nor-malization model was applied for global normalization at theslide level, whereas the gene model was applied separately toeach gene using residuals (observed minus fitted values) frommodel (1).
log ( ) = + + + +2 ijklsY D S DSijkls ij k l klθ ω (1)
R D S DS SSijklsg
ijg
kg
lg
klg
lsg( ) ( ) ) ( ) ( ) ( )= + + + +(µ + ε ijkls
g( ) (2)
where Yijkls represents the intensity of the sth spot in the lth
TREE PHYSIOLOGY ONLINE at http://heronpublishing.com
EMBRYOGENESIS REGULATION IN GYMNOSPERMS 1075
Table 1. Functional grouping of the expressed sequence tags present on the array and of those differentially expressed (P < 0.05) in three cell linesduring the first five stages of embryo development. Numbers in brackets indicate percentage values.
Category Code Array Cell line B Cell line N1 Cell line N2
Metabolism M 430 (19.7) 16 (42.1) 14 (15.2) 5 (16.1)Protein synthesis and destination PS 455 (20.9) 6 (15.8) 17 (18.5) 5 (16.1)Cell rescue CR 218 (10.0) 3 (7.9) 15 (16.3) 9 (29.0)Transcription T 196 (9.0) 2 (5.3) 3 (3.3) 1 (3.2)Cell growth CG 196 (9.0) 2 (5.3) 13 (14.1) 2 (6.5)Energy E 159 (7.3) 2 (5.3) 7 (7.6) 1 (3.2)Cellular biogenesis CB 137 (6.3) 0 (0) 6 (6.5) 6 (19.4)Cellular transport CT 109 (5.0) 0 (0) 5 (5.4) 1 (3.2)Transport facilitation TF 109 (5.0) 3 (7.9) 4 (4.3) 0 (0)Cellular communication CC 105 (4.8) 2 (5.3) 2 (2.2) 0 (0)Ionic homeostasis IO 15 (0.7) 0 (0) 0 (0) 0 (0)Transposable elements TE 15 (0.7) 0 (0) 0 (0) 0 (0)Development D 12 (0.3) 0 (0) 0 (0) 0 (0)Unknown function U 22 (1.0) 2 (5.3) 6 (6.5) 1 (3.2)
Total 2178 (100) 38 (100) 92 (100) 31 (100)

slide with the kth dye applying the jth stage for the ith cell line.The mean effect of the jth stage in the ith cell line, the kth dyeeffect, the lth slide random effect and the random interactioneffect of the kth dye in the lth slide is represented by ij, Dk, Sl,and DSkl. The stochastic error term is ωijkls and Rijkls
g( ) representsthe residual of the gth gene from Model 1. Parameters µ ijkls
g( ) ,Dk
g( ), Sl and DSkl represent similar roles as ij, Dk, Sl and DSkl,except that they are specific for the gth gene. The spot-by-sliderandom effect for the gth gene is represented by SSls. The sto-chastic error term is represented by ε ijkls
g( ) . All random effectswere assumed to be normally distributed and mutually inde-pendent within each model. These models were fitted by usingSAS Proc Mixed (SAS Institute, Cary, NC). In the gene model(2), R2 values (representing the percentage of total variabilityexplained by the model) were calculated to evaluate model fit-ness. Only two R2 values < 0.9 among all 2178 ESTs were ob-served, implying that the models fit well. Also, nearly all of thestandardized residuals from model (2) had absolute values < 3,indicating excellent array data quality. Using these fitted mod-els, statistical comparisons of gene expression at neighboringstages within each cell line were achieved by testing the fol-lowing hypothesis (3).
H H jj(g)
j(g)
jg
jg
0 +1 1: = vs. : , + 1µ µ µ µ+ ≠1( ) ( ) ≠ j (3)
Results from these hypothesis tests are shown in volcano plots(Figure 2) generated with JMP software (SAS Institute). Dif-ferences in transcript levels between neighboring stageswithin each line were considered significant if higher than aBonferroni cutoff, which conservatively controls the family-wise false positive rate across all hypothesis tests to be < 0.05.The horizontal line in the volcano plot represents the negativelogarithm cutoff point (–log10(0.05/2178/N), where 0.05 is thenominal significance level, 2178 is the number of ESTs on thearray, and N is the number of comparisons for one specific hy-pothesis test). To identify developmentally regulated genes in-volved in the progression of embryo development, we com-pared the transcript level response of each gene in the two nor-mal lines N1 and N2 with that of the same element in the devel-opmentally arrested B line by two-way ANOVA, as previouslyreported by van Zyl et al. (2003). We also used fitted meansfrom the mixed models to construct expression profiles (seeFigures 3– 5). These were displayed both as colored heat mapsand in parallel coordinate plots. The profiles were clustered hi-erarchically using Ward’s distance metric as implemented inJMP.
The transcript levels of eight cDNAs, which appeared dif-ferentially expressed between the N1 and B lines in the mi-croarray experiments were confirmed by real time reversetranscription polymerase chain reaction (RT-PCR). Real timeRT-PCR analysis was carried out as previously described (Sta-solla et al. 2003).
Results
Developmental pathways of somatic embryogenesis inNorway spruce
Time-lapse tracking experiments have revealed that the nor-mal developmental pathway in Norway spruce can be concep-tually divided in three distinct phases corresponding to regula-tory treatments (Filonova et al. 2000a) (Figure 1A). In thepresence of auxin and cytokinin, proliferating PEMs were vis-ible. Removal of PGR triggered the trans-differentiation ofPEMs into somatic embryos (Figure 1B), which were com-posed of an organized embryo proper subtended by an elon-gated suspensor. Further development of somatic embryos waspromoted by ABA (for a detailed description, see Filonova etal. 2000a) (Figure 1A).
In the B line, withdrawal of PGR did not trigger the differen-tiation of PEMs into somatic embryos, thus precluding subse-quent embryonic growth (Filonova et al. 2000a) (Figure 1A).Formation of somatic embryos, which was observed in in-creasing frequency during development of lines N1 and N2,was not observed in the B line (Figure 1B).
Functional grouping and hierarchical clustering ofdifferentially abundant genes in the three cell lines
Functional grouping of differentially abundant genes duringthe first five stages of development in the three lines and com-
1076 STASOLLA ET AL.
TREE PHYSIOLOGY VOLUME 24, 2004
Figure 2. Volcano plot comparing the developmentally arrested B lineto the normal lines N1 and N2 at Stage 2 of development (7d+PGR).Each value represents a gene. The x-axis is the estimated fold change(log 2 scale) and the y-axis is the – log10(P-value) of the comparison.The horizontal reference line was obtained from a Bonferroni correc-tion across multiple hypothesis tests. Genes above this line are statisti-cally significant under strict control of the false positive rate.

parison with the percentages of genes belonging to distinctfunctional categories in the array are shown in Table 1. Com-pared to the developmentally arrested B line, the percentage ofdifferentially abundant genes involved in metabolic processeswas lower in both normal lines (42.1% in the B line, comparedwith 15.2 and 16.1% in the N1 and N2 lines, respectively). Anopposite tendency was observed for genes included in the cate-gory of cell rescue (7.9% in the B line and 16.3 and 29% in N1
and N2) and cellular biogenesis (0% in the B line and 6.5 and19.4% in N1 and N2). Altogether, more genes (92) were differ-entially expressed in the N1 line compared with the other twolines (Table 1).
To assess typical transcript level patterns during develop-ment of the three lines, differentially abundant genes for eachline were selected and grouped in hierarchical clusters. Thesegenes were then divided into eight groups, having distincttranscription patterns during embryo development, and furtherclassified in functional categories (Figures 3–5). A large num-ber of genes of the developmentally arrested line (clusters A,B, D and F; Figure 3) had similar transcription patterns duringearly development, showing general up-regulation betweenStages 1 and 2, followed by repression (Stages 2 and 3) and in-duction (Stages 3 and 4). In cluster B, more than half of thegenes belonged to the category “Metabolism.” In the linesshowing a normal embryonic development, two clusters ofgenes (cluster D for N1 and cluster H for N2) showed a similartranscript level pattern characterized by an up-regulation be-
tween Stages 5 and 6 (Figures 4 and 5). The majority of thegenes within both clusters belonged to the categories of “Me-tabolism” and “Cell rescue.” Several other genes displayedstage-specific patterns of transcript levels, including those ofclusters G and H for N1 and cluster C for N2, which were up-regulated between Stages 3 and 4 (Figures 4 and 5). Eight ofthese genes were involved in metabolic processes. Similaritiesin transcript abundance were also observed for clusters C andF, in lines N1 and N2, respectively. The transcript levels ofthese genes, mainly belonging to the categories “Cell rescue,”“Cellular biogenesis” and “Protein synthesis and destination”decreased during the initial phases of development.
Validation of the microarray experiment was confirmed byRT-PCR studies of eight cDNAs that were differentially ex-pressed between the N1 line and the B line at Stages 1 and 5 ofdevelopment. The same trends for up- and down-regulationwere observed (Table 2), although variations in fold changeswere obtained using two hybridization techniques, as reportedpreviously (Stasolla et al. 2003).
Analysis of gene expression during proembryogeny and earlyembryogeny
In the developmentally arrested line, only four genes were dif-ferentially abundant between Stages 1 and 2. This number in-creased during the subsequent phases and reached a maximumof 23 genes between Stages 3 and 4 before declining betweenStages 4 and 5 (Figure 6A). The number of differentially ex-
TREE PHYSIOLOGY ONLINE at http://heronpublishing.com
EMBRYOGENESIS REGULATION IN GYMNOSPERMS 1077
Figure 3. Expression profiles and hierarchical clustering of differentially expressed genes in the developmentally blocked (B) line. On the basis ofthe constructed tree (left), the genes were clustered in eight groups (A–H), based on their expression pattern during the first five stages of develop-ment (center), and classified in functional categories (right). See Table 1 for definitions of functional category codes.

1078 STASOLLA ET AL.
TREE PHYSIOLOGY VOLUME 24, 2004
Figure 5. Expression profiles and hierarchical clustering of differentially expressed genes in the normal (N2) line. On the basis of the constructedtree (left), the genes were clustered in eight groups (A–H), based on their expression pattern during the first six stages of development (center), andclassified in functional categories (right). See Table 1 for definitions of functional category codes.
Figure 4. Expression profiles and hierarchical clustering of differentially expressed genes in the normal (N1) line. On the basis of the constructedtree (left), the genes were clustered in eight groups (A–H), based on their expression pattern during the first six stages of development (center), andclassified in functional categories (right). See Table 1 for definitions of functional category codes.
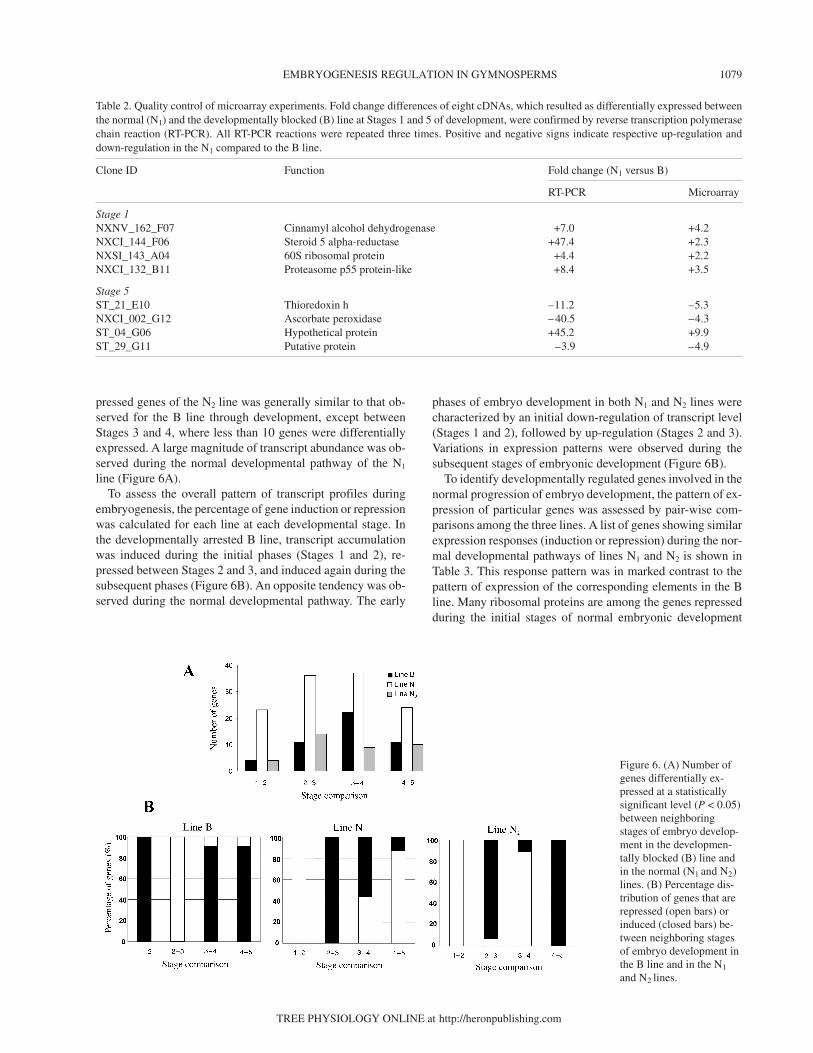
pressed genes of the N2 line was generally similar to that ob-served for the B line through development, except betweenStages 3 and 4, where less than 10 genes were differentiallyexpressed. A large magnitude of transcript abundance was ob-served during the normal developmental pathway of the N1
line (Figure 6A).To assess the overall pattern of transcript profiles during
embryogenesis, the percentage of gene induction or repressionwas calculated for each line at each developmental stage. Inthe developmentally arrested B line, transcript accumulationwas induced during the initial phases (Stages 1 and 2), re-pressed between Stages 2 and 3, and induced again during thesubsequent phases (Figure 6B). An opposite tendency was ob-served during the normal developmental pathway. The early
phases of embryo development in both N1 and N2 lines werecharacterized by an initial down-regulation of transcript level(Stages 1 and 2), followed by up-regulation (Stages 2 and 3).Variations in expression patterns were observed during thesubsequent stages of embryonic development (Figure 6B).
To identify developmentally regulated genes involved in thenormal progression of embryo development, the pattern of ex-pression of particular genes was assessed by pair-wise com-parisons among the three lines. A list of genes showing similarexpression responses (induction or repression) during the nor-mal developmental pathways of lines N1 and N2 is shown inTable 3. This response pattern was in marked contrast to thepattern of expression of the corresponding elements in the Bline. Many ribosomal proteins are among the genes repressedduring the initial stages of normal embryonic development
TREE PHYSIOLOGY ONLINE at http://heronpublishing.com
EMBRYOGENESIS REGULATION IN GYMNOSPERMS 1079
Table 2. Quality control of microarray experiments. Fold change differences of eight cDNAs, which resulted as differentially expressed betweenthe normal (N1) and the developmentally blocked (B) line at Stages 1 and 5 of development, were confirmed by reverse transcription polymerasechain reaction (RT-PCR). All RT-PCR reactions were repeated three times. Positive and negative signs indicate respective up-regulation anddown-regulation in the N1 compared to the B line.
Clone ID Function Fold change (N1 versus B)
RT-PCR Microarray
Stage 1NXNV_162_F07 Cinnamyl alcohol dehydrogenase +7.0 +4.2NXCI_144_F06 Steroid 5 alpha-reductase +47.4 +2.3NXSI_143_A04 60S ribosomal protein +4.4 +2.2NXCI_132_B11 Proteasome p55 protein-like +8.4 +3.5
Stage 5ST_21_E10 Thioredoxin h –11.2 –5.3NXCI_002_G12 Ascorbate peroxidase – 40.5 –4.3ST_04_G06 Hypothetical protein +45.2 +9.9ST_29_G11 Putative protein –3.9 –4.9
Figure 6. (A) Number ofgenes differentially ex-pressed at a statisticallysignificant level (P < 0.05)between neighboringstages of embryo develop-ment in the developmen-tally blocked (B) line andin the normal (N1 and N2)lines. (B) Percentage dis-tribution of genes that arerepressed (open bars) orinduced (closed bars) be-tween neighboring stagesof embryo development inthe B line and in the N1
and N2 lines.

1080 STASOLLA ET AL.
TREE PHYSIOLOGY VOLUME 24, 2004
Table 3. List of genes showing an expression response (repression = R and induction = I) during consecutive stages of embryo development in thenormal lines N1 and N2. This pattern of expression is in marked contrast to that of the corresponding genes in the developmentally arrested line(two-way ANOVA P = 0.05).
Function Clone ID E-value Stages of development
1–2 2–3 3– 4 4–5
Protein synthesis and destinationAt3g04920 ribosomal protein s24 NXSI_136_B08 1.00E-31 RAt3g04920 ribosomal protein s24 NXSI_064_H06 9.00E-34 RAt2g40010 60S acidic ribosomal protein P0 NXSI_058_B04 4.00E-42 RAt2g09990 40S ribosomal protein S16 NXSI_055_E09 7.00E-49 RAt4g36130 ribosomal protein L8 NXSI_045_A04 4.00E-85 RAt4g17390 60S ribosomal protein L15 NXSI_044_C06 2.00E-65 RAt1g61580 60s ribosomal protein L3 NXSI_040_H10 9.00E-50 RAt4g22380 ribosomal protein L7Ae-like NXSI_036_B05 2.00E-08 RAt1g69620 60S ribosomal protein L34 NXSI_024_H04 2.00E-27 RAt5g45775 ribosomal protein L11-like ST_23_F10 6.00E-31 RAt4g00100 ribosomal protein S13 NXNV_151_F01 3.00E-50 RAt3g27850 50S ribosomal protein L12-C NXNV_103_G03 9.00E-06 RAt5g56940 30S ribosomal protein S16 ST_19_D12 7.00E-24 IAt3g56340 40S ribosomal protein S26 homolog ST_09_F05 2.00E-23 RAt3g48930 cytosolic ribosomal protein S11 ST_07_D12 2.00E-61 RAt2g27530 60S ribosomal protein L10A NXNV_083_E06 4.00E-50 RAt1g74270 ribosomal protein AT_29_F11 7.00E-55 RAt4g17390 60S ribosomal protein L02 NXNV_077_G03 4.00E-85 RAt2g44120 60S ribosomal protein L7 NXNV_069_D04 9.00E-27 RAt3g04400 ribosomal protein L17, putative ST_07_A07 2.00E-64 RAt4g39200 ribosomal protein S25 NXNV_044_D09 1.00E-28 RAt5g39850 40S ribosomal protein S9-like NXNV_022_C10 7.00E-18 IAt2g39390 60S ribosomal protein L35 NXCI_152_B06 2.00E-37 RAt5g45775 ribosomal protein L11 NXCI_132_E06 1.00E-63 RAt3g09680 40S ribosomal protein S23 NXCI_060_B03 2.00E-46 RAt5g39740 ribosomal protein L5-like ST_34_E12 5.00E-35 RAt3g10610 putative 40S ribosomal protein S17 ST_33_G08 2.00E-39 RAt1g26880 60s ribosomal protein L34 ST_32_C07 2.00E-20 RAt3g10410 carboxypeptidase type III NXNV_063_B09 3.00E-44 IAt1g17370 putative oligouridylate binding protein NXSI_052_A11 1.00E-27 RAt3g61140 fusca protein (FUS6) NXNV_083_G07 2.00E-23 RAt1g18540 hypothetical protein ST_25_C01 5.00E-41 RAt3g13920 initiation factor 4A-15 NXSI_065_C08 4.00E-63 RAt1g54270 initiation factor 4A-9 NXSI_057_C07 1.00E-139 R
MetabolismAt1g17880 hypothetical protein NXSI_136_E08 4.00E-34 RAt5g45880 SAH7 protein NXSI_100_F12 1.00E-13 RAt4g38440 cysteine protease inhibitor NXSI_080_C08 2.00E-28 IAt5g15490 UDP-glucose dehydrogenase NXNV_132_G09 1.00E-165 RAt2g36530 enolase NXCI_122_A09 3.00E-72 RAt3g03780 putative methionine synthase NXCI_055_C01 7.00E-14 I RAt4g13940 adenosylhomocysteinase NXCI_053_F03 2.00E-23 IAt1g20630 hypothetical protein NXCI_044_F09 4.9 RAt2g26080 glycine dehydrogenase NXCI_026_F05 1.00E-159 RAt3g51240 flavanone 3-hydroxylase (FH3) ST_28_B11 1.00E-40 RAt3g13790 beta-fructofuranosidase 1 ST_27_A08 2.6 RAt4g10960 UDP-galactose 4-epimerase-like protein ST_21_A06 4.00E-63 R RAt4g18590 pollen-specific protein-like ST_15_D07 3.00E-16 RAt1g78430 hypothetical protein ST_07_D02 1.1 RAt2g48070 unknown protein ST_06_C04 2.00E-38 RAt4g26450 putative protein ST_04_F02 2.7 RAt4g18590 pollen-specific protein-like ST_03_D08 2.00E-11 RAt3g57880 anthranilate phosphoribosyltransferase NXSI_062_A03 1.00E-74 R R
Continued on facing page.
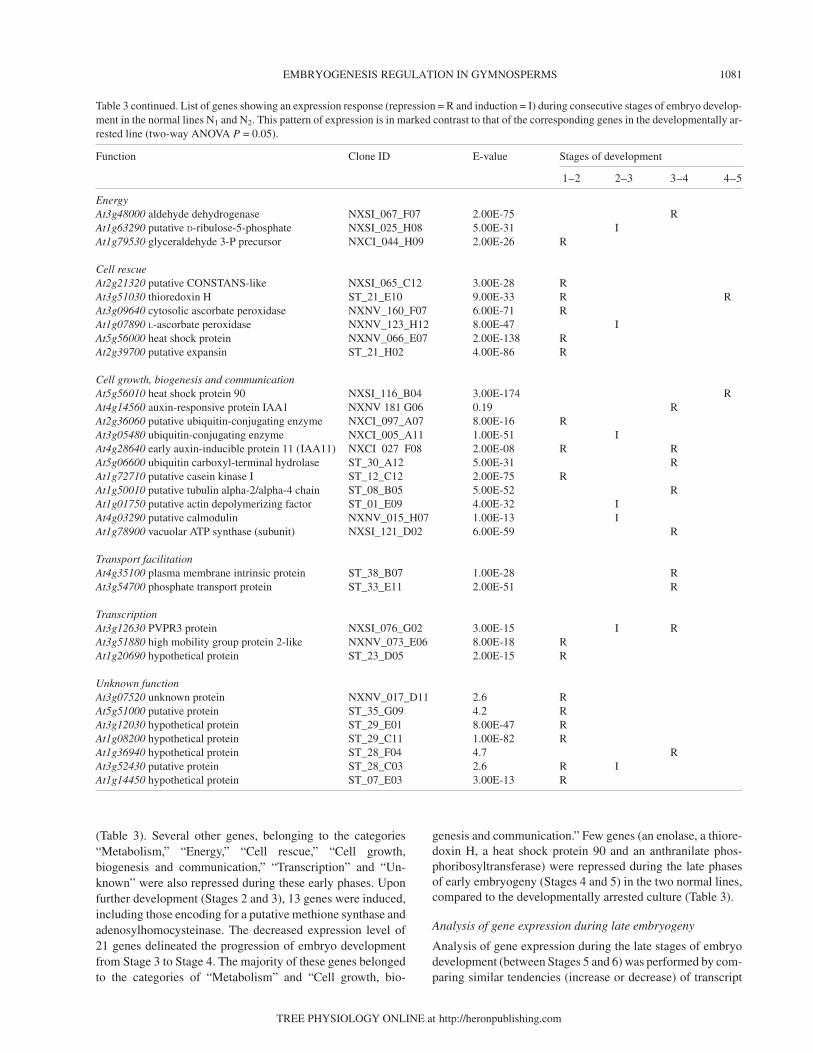
(Table 3). Several other genes, belonging to the categories“Metabolism,” “Energy,” “Cell rescue,” “Cell growth,biogenesis and communication,” “Transcription” and “Un-known” were also repressed during these early phases. Uponfurther development (Stages 2 and 3), 13 genes were induced,including those encoding for a putative methione synthase andadenosylhomocysteinase. The decreased expression level of21 genes delineated the progression of embryo developmentfrom Stage 3 to Stage 4. The majority of these genes belongedto the categories of “Metabolism” and “Cell growth, bio-
genesis and communication.” Few genes (an enolase, a thiore-doxin H, a heat shock protein 90 and an anthranilate phos-phoribosyltransferase) were repressed during the late phasesof early embryogeny (Stages 4 and 5) in the two normal lines,compared to the developmentally arrested culture (Table 3).
Analysis of gene expression during late embryogeny
Analysis of gene expression during the late stages of embryodevelopment (between Stages 5 and 6) was performed by com-paring similar tendencies (increase or decrease) of transcript
TREE PHYSIOLOGY ONLINE at http://heronpublishing.com
EMBRYOGENESIS REGULATION IN GYMNOSPERMS 1081
Table 3 continued. List of genes showing an expression response (repression = R and induction = I) during consecutive stages of embryo develop-ment in the normal lines N1 and N2. This pattern of expression is in marked contrast to that of the corresponding genes in the developmentally ar-rested line (two-way ANOVA P = 0.05).
Function Clone ID E-value Stages of development
1–2 2–3 3–4 4–5
EnergyAt3g48000 aldehyde dehydrogenase NXSI_067_F07 2.00E-75 RAt1g63290 putative D-ribulose-5-phosphate NXSI_025_H08 5.00E-31 IAt1g79530 glyceraldehyde 3-P precursor NXCI_044_H09 2.00E-26 R
Cell rescueAt2g21320 putative CONSTANS-like NXSI_065_C12 3.00E-28 RAt3g51030 thioredoxin H ST_21_E10 9.00E-33 R RAt3g09640 cytosolic ascorbate peroxidase NXNV_160_F07 6.00E-71 RAt1g07890 L-ascorbate peroxidase NXNV_123_H12 8.00E-47 IAt5g56000 heat shock protein NXNV_066_E07 2.00E-138 RAt2g39700 putative expansin ST_21_H02 4.00E-86 R
Cell growth, biogenesis and communicationAt5g56010 heat shock protein 90 NXSI_116_B04 3.00E-174 RAt4g14560 auxin-responsive protein IAA1 NXNV 181 G06 0.19 RAt2g36060 putative ubiquitin-conjugating enzyme NXCI_097_A07 8.00E-16 RAt3g05480 ubiquitin-conjugating enzyme NXCI_005_A11 1.00E-51 IAt4g28640 early auxin-inducible protein 11 (IAA11) NXCI 027 F08 2.00E-08 R RAt5g06600 ubiquitin carboxyl-terminal hydrolase ST_30_A12 5.00E-31 RAt1g72710 putative casein kinase I ST_12_C12 2.00E-75 RAt1g50010 putative tubulin alpha-2/alpha-4 chain ST_08_B05 5.00E-52 RAt1g01750 putative actin depolymerizing factor ST_01_E09 4.00E-32 IAt4g03290 putative calmodulin NXNV_015_H07 1.00E-13 IAt1g78900 vacuolar ATP synthase (subunit) NXSI_121_D02 6.00E-59 R
Transport facilitationAt4g35100 plasma membrane intrinsic protein ST_38_B07 1.00E-28 RAt3g54700 phosphate transport protein ST_33_E11 2.00E-51 R
TranscriptionAt3g12630 PVPR3 protein NXSI_076_G02 3.00E-15 I RAt3g51880 high mobility group protein 2-like NXNV_073_E06 8.00E-18 RAt1g20690 hypothetical protein ST_23_D05 2.00E-15 R
Unknown functionAt3g07520 unknown protein NXNV_017_D11 2.6 RAt5g51000 putative protein ST_35_G09 4.2 RAt3g12030 hypothetical protein ST_29_E01 8.00E-47 RAt1g08200 hypothetical protein ST_29_C11 1.00E-82 RAt1g36940 hypothetical protein ST_28_F04 4.7 RAt3g52430 putative protein ST_28_C03 2.6 R IAt1g14450 hypothetical protein ST_07_E03 3.00E-13 R

levels between lines N1 and N2. As shown in Table 4, 31 genesshowed similar expression patterns during the late events ofembryo development in the normal lines. These included sev-eral stress-related proteins, such as five heat shock proteins(HSPs) and one late embryogenic abundant (LEA) protein,which had increased transcript levels in cotyledonary emb-ryos, and other genes with different functions, e.g., methioninesynthase, S-adenosylmethionine and malate dehydrogenase,which were repressed in cotyledonary embryos (Table 4).
Discussion
Normal embryonic growth is accompanied by a defined pat-tern of transcript levels: down-regulation during the progres-sion from Stage 1 to Stage 2, and up-regulation from Stage 2 toStage 3, resulting in the formation of somatic embryos (Fig-ures 1 and 6). This tendency appears to be critical for normaltrans-differentiation of PEMs into somatic embryos, becauseit is reversed in the developmentally arrested B line, where thistransition is precluded. A decrease in transcript levels towardthe end of subculture in proliferation medium was also ob-served, albeit to a lesser extent than that seen in previousmicroarray work conducted on a similar system (van Zyl et al.2003). A transcriptional repressive state, followed by activegene expression, is a pattern that has also been observed dur-ing early embryogenesis in a variety of animal systems. Per-turbation of this pattern through experimental manipulationsresults in inhibition of further embryonic growth (Ma et al.2001). Although the role of the initial transcriptional silencingis poorly understood, it may delay embryo differentiation untilthe appropriate stage (Forlani et al. 1998). A similar controlmay operate in Norway spruce where maximum competenceof PEMs to differentiate into somatic embryos is reached whendefined physiological and molecular conditions are met.Failure to meet these conditions may affect further develop-ment, as observed in the developmentally arrested line.
Comparisons of changes in transcript levels between nor-mal and developmentally blocked lines during the transitionfrom Stage 1 to Stage 2 revealed that, among the differentiallyexpressed genes identified, several encode ribosomal proteins(Table 3). The down-regulation of these genes in the normallines suggests that repression of protein synthesis may repre-sent a physiological switch that initiates those morphogenicevents, leading to proper embryo development. The activationof programmed cell death is well documented and crucial forthe trans-differentiation of PEMs into somatic embryos (Filo-nova et al. 2000b).
Rapid cell proliferation and active aerobic metabolism,which occur mainly in the presence of auxin and cytokinin, areoften associated with the production of reactive oxygen spe-cies, including hydrogen peroxide. In marked contrast to thedevelopmentally arrested line, the transcript levels of onecytosolic ascorbate peroxidase and one thioredoxin H, both in-volved in detoxification mechanisms (Mouaheb et al. 1998,Potters et al. 2002), were repressed in the two normal lines be-tween Stages 1 and 2 (Table 3). The higher numbers of these
transcripts in the developmentally arrested line suggest thatoxidative stress is high in this line, and may contribute to theembryonic block at the PEM stage. Besides their role in detox-ification, both ascorbate peroxidase and thioredoxin have amajor function in the control of cellular redox state, which iscritical for normal development. Alterations in the activity ofascorbate peroxidase, for example, affect the ascorbate/de-hydroascorbate ratio, which appears to have a regulatory rolein the balance between cell proliferation and differentiationduring embryogenesis of both gymnosperms (Stasolla andYeung 2001) and angiosperms (Arrigoni et al. 1992). Thisfinding is in line with the concept that the cellular redox state isa generic sensor that controls the early developmental eventsof embryogenesis (Stasolla et al. 2002) and may be critical inthe trans-differentiation of PEMs into somatic embryos.
Generation of somatic embryos in the two normal lines is in-duced by removal of PGR and is accompanied by an increaseof transcript levels. This tendency was reversed in the develop-mentally blocked line, where this transition was precluded.Two differentially abundant transcripts, induced in normallines between Stage 2 and Stage 3, encode enzymes involvedin methionine metabolism: adenosylhomocysteinase andmethionine synthase (Table 3), responsible for the productionof homocysteine and methionine, respectively. Both enzymes,together with S-adenosylmethionine (SAM) synthase, whichshowed higher transcript levels in normal lines than in the de-velopmentally arrested line at Stage 3 (data not shown), arepart of the SAM-dependent transmethylation system (Were-tilnyk et al. 2001, Moffatt et al. 2002). In this system, high ac-tivity of these enzymes guarantees continuous production ofmethyl groups to be utilized by SAM-dependent methyl-transferases. High levels of methylation during developmenthave been implicated with numerous events, including chrom-atin modeling, selective gene expression and embryonicgrowth in both animals and plants. Mice embryos expressinglow levels of the maintenance methyltransferase do not de-velop properly and abort prematurely (Razin and Shemer1995). In carrot, normal progression of somatic embryo devel-opment is associated with increasing levels of endogenousSAM and high levels of DNA methylation (Munksgaard et al.1995). Sustainability of the SAM-mediated transmethylationsystem is also strictly dependent on adenosine kinase, whichthrough the removal of free adenosine, favors the conversionof S-adenosylhomocysteine to homocysteine (Weretilnyk etal. 2001, Moffatt et al. 2002). The high activity of adenosinekinase in white spruce tissue cultured in PGR-containing me-dium (Ashihara et al. 2001) further supports the importance oftransmethylation events during the initial phases of embryo-geny.
A possible increase in DNA methylation between Stages 2and 3 may contribute to the transcriptionally repressive stateobserved for all differentially abundant transcripts during thesubsequent stages of embryo development (i.e., Stages 3 to 4and Stages 4 to 5) (Table 3). Active DNA methylation contrib-utes to transcriptional repression both directly, by interferingwith the binding of transcription factors to DNA, or indirectly,
1082 STASOLLA ET AL.
TREE PHYSIOLOGY VOLUME 24, 2004

by recruiting proteins that block access to other factors re-quired for gene induction (see Curradi et al. 2002). Among thegenes that showed a transcript reduction during normal devel-opment, several are involved in auxin metabolism. These in-clude an anthranilate phosphoribosyltransferase, the enzymewhich participates in the formation of the indole group duringindole-3-acetic acid biosynthesis (reviewed by Bartel et al.2001), and two auxin-regulated proteins (Figure 7). Auxinsynthesis, transport and utilization are involved in a variety ofregulatory pathways during embryo development. One criticalevent observed during early embryogenesis in plants, includ-ing gymnosperms, is the establishment of an apical–basal axis,which is dictated by the polar transport of auxin in developingembryos (Liu et al. 1993). In angiosperms, experimental inhi-bition of auxin flow both in vivo (Steinmann et al. 1999,Mayer et al. 1993) and in vitro (Ramesar-Fortner and Yeung2001) has profound effects on the establishment of the embry-onic polar axis. Although no related information is currentlyavailable for gymnosperms, it is tempting to speculate that asimilar control, altered in the developmentally blocked line, is
required for normal embryonic growth.Proper embryo differentiation depends on the ability of the
cells to differentiate according to their position and to give riseto a series of tissues organized into patterns. In several sys-tems, including carrot (McCabe et al. 1997) and spruce (Eg-ertsdotter and von Arnold 1995), cell differentiation, and ulti-mately cell fate, are affected by cell wall components. Thus,alterations in wall composition of the embryonic cells may beimportant for proper growth. During normal development, therepression of UDP-glucose dehydrogenase, the enzyme in-volved in the channeling of UDP-glucose to hemicellulose andpectin synthesis (Hertzberg et al. 2001), and UDP-galactose4-epimerase, utilized in the biosynthesis of low molecularweight galactosides and cell wall polymers, (Joersbo et al.1999) (Table 3) support this notion. A reorganization of cellwall architecture, possibly underlined by alterations in cyto-skeletal organization, as suggested by the repression of a tubu-lin gene (Table 3), may be the effect of several physiologicalevents, including alterations in auxin metabolism. The auxin-mediated effect on wall loosening and reorganization is well
TREE PHYSIOLOGY ONLINE at http://heronpublishing.com
EMBRYOGENESIS REGULATION IN GYMNOSPERMS 1083
Table 4. Fold changes of differentially expressed genes (P < 0.05) that show a similar expression pattern (up- or down-regulation) during lateembryogenesis in both N1 and N2 lines. Positive and negative values indicate respective up-regulation and down-regulation of gene expression be-tween Stages 5 and 6 of development.
Function Clone ID E-value Fold change
N1 N2
Plastid protein ST_06_F07 2.00E-08 +2.0 +2.1Delta tonoplast integral protein (delta-TIP) ST_07_A03 8.00E-43 +1.6 +1.4No hit ST_18_B12 1.00E-32 +1.7 +1.7Late embryogenic abundant protein (LEA) NXCI_021_G04 4.00E-30 +1.9 +1.5Heat shock protein NXCI_002_G06 4.00E-31 +2.3 +2.3Translation initiation factor 3 subunit NXCI_096_A09 1.00E-40 +2.3 +2.3Putative auxin transport protein NXNV_129_F06 2.00E-31 +1.5 +1.5Heat shock protein NXSI_011G01 4.00E-77 +1.9 +1.9Heat shock protein NXSI_074_H11 9.00E-13 +2.3 +2.3Hypothetical protein NXSI_076_G02 1.00E-17 +2.0 +2.7Putative isoprenylated protein NXSI_085_B02 4.00E-23 +1.7 +1.7Myo-inositol-1-phosphate synthase NXSI_103_A10 1.00E-45 +2.1 +2.3Heat shock protein NXSI_116_B04 3.00E-57 +1.6 +1.6Phosphoenolpyruvate decarboxylase NXSI_129_F07 1.00E-84 +2.5 +2.5Heat shock protein 18 NXSI_139_G02 7.00E-33 +1.7 +1.5MADS box protein AGL 2 ST_06_D02 3.00E-54 –1.7 –1.9Pollen specific protein-like ST_15_D07 3.00E-16 –1.5 –1.7GAST 1-Like protein ST_34_B04 2.00E-32 –1.5 –1.6Laccase NXCI_046_E05 4.00E-34 –1.5 –1.6Putative methionine synthase NXCI_055_C01 7.00E-14 –2.4 –3.0Farnesyl-pyrophosphate synthetase NXCI_055_E11 5.00E-34 –2.0 –2.9Putative ubiquitin-conjugating enzyme NXCI_097_A07 3.00E-29 –1.4 –1.4S-Adenosylmethionine NXCI_133_B03 3.00E-29 –1.9 –2.1Histone H3 protein NXCI_153_H12 7.00E-29 –1.4 –1.540S Ribosomal protein S9-like NXNV_022_C10 7.00E-18 –1.7 –2.1Actin (ACT3) NXNV_047_D05 2.00E-75 –2.0 –2.6UDP-Glucose dehydrogenase NXNV_132_G09 2.00E-67 –1.9 –2.1Putative malate dehydrogenase NXSI_048_D06 4.00E-68 –1.5 –2.714-3-3-Like protein NXSI_048_D06 1.00E-33 –1.5 –1.5Ole I allergen NXSI_100_F12 6.00E-06 –1.4 –1.5Putative cytochrome P450 NXCI_104_E01 2.00E-80 –1.5 –1.4

established (Cosgrove 1997).During the last phase of embryo development (Stages 5
and 6), a set of 31 genes showed similar transcription level pat-terns (up- or down-regulation) in both N1 and N2 lines andserve as molecular markers for late embryogenesis and em-bryo maturation (Table 4). Six of these elements, includingone LEA protein and five HSPs, were induced in cotyledonaryembryos. Accumulation of both LEA proteins and HSPs,which protect cellular components from severe dehydration, isoften observed in fully developed embryos during the latestages of maturation (reviewed by Kermode 1990). An in-crease in the transcript levels of these classes of proteins wasalso observed in white spruce somatic embryos cultured in thepresence of the osmoticum, polyethylene glycol (Dong andDunstan 1996a, 1996b, Stasolla et al. 2003). Among the 31marker genes, there are several participating in diverse cellularprocesses (Table 4), indicating that a large number of regula-tory pathways contribute to the formation of the mature em-bryos.
This work provides detailed information on changes in tran-script levels occurring during successive stages of embryo de-velopment in gymnosperms. Beside extending our knowledgeon the molecular mechanisms governing gymnosperm em-bryogenesis, as the patterning of embryo formation in vivo issimilar to that observed in vitro (Yeung et al. 1998, Filonova etal. 2000a), this work may assist in developing methods for theproduction of high-quality somatic embryos in conifers.
Acknowledgments
The authors thank Prof. E.C. Yeung, University of Calgary for valu-able suggestions and discussions. The help of Mr. Matias Kirst is alsoacknowledged. This work was supported by a Natural Sciences andEngineering Research Council of Canada Grant to C.S., a NationalScience Foundation (USA) Grant DBI, 9975806 to R.S., and by theNCSU Forest Biotechnology Industrial Research Consortium.
References
Arrigoni, O., L. De Gara, F. Tommasi and R. Liso. 1992. Changes inthe ascorbate system during seed development in Vicia faba L.Plant Physiol. 99:235–238.
Ashihara, H., C. Stasolla, N. Loukanina and T.A. Thorpe. 2001. Pu-rine metabolism during white spruce somatic embryo develop-ment: salvage of adenine, adenosine, and inosine. Plant Sci. 160:647–657.
Bartel, B., S. LeClere, M. Magidin and B.K. Zolman. 2001. Inputs tothe active indole-3-acetic acid pool: de novo synthesis, conjugatehydrolysis, and indole-3-butyric acid β-oxidation. J. Plant GrowthRegul. 20:198–216.
Bishop-Hurley, S., R.C. Gardner and C. Walter. 2003. Isolation andmolecular characterization of genes expressed during somatic em-bryo development in Pinus radiata. Plant Cell Tiss. Org. Cult. 74:267–281.
Bozhkov, P.V. and S. von Arnold. 1998. Polyethylene glycol promotesmaturation but inhibits further development of Picea abies somaticembryos. Physiol. Plant 104:211–224.
Bozhkov, P.V., L.H. Filonova and S. von Arnold. 2002. A key devel-opmental switch during Norway spruce somatic embryogenesis isinduced by withdrawal of growth regulators and is associated withcell death and extracellular acidification. Biotechnol. Bioeng. 77:658–667.
Chang, S., J. Puryear and J. Cairney. 1993. A simple and efficientmethod for isolating RNA from pine trees. Plant Mol. Biol. Rep.11:113–116.
Chu, T.-M., B.Weir and R. Wolfinger. 2002. A systematic statisticallinear modeling approach to oligonucleotide array experiments.Math. Biosci. 176:35–51.
Cosgrove, D. 1997. Relaxation in a high-stress environment: the mo-lecular bases of extensible cell walls and cell enlargement. PlantCell 9:1031–1041.
Curradi, M., A. Izzo, G. Badaracco and N. Landsberger. 2002. Molec-ular mechanisms of gene silencing mediated by DNA methylation.Mol. Cell. Biol. 22:3157–3173.
Dong, J.-Z. and D.I. Dunstan. 1996a. Expression of abundant mRNAsduring somatic embryogenesis of white spruce (Picea glauca(Moench) Voss). Planta 200:459– 466.
Dong, J.-Z. and D.I. Dunstan. 1996b. Characterization of three heat-shock-protein genes and their developmental regulation during so-matic embryogenesis in white spruce (Picea glauca (Moench)Voss). Planta 200:85–91.
Dunn, S.M., G.N. Drews, R.L. Fischer, J.J. Harada, R.B. Goldbergand A.M. Koltunow. 1997. fist: an Arabidopsis mutant with alteredcell division planes and radial pattern disruption during embryo-genesis. Sex. Plant Reprod. 10:358–367.
Egertsdotter, U. and S. von Arnold. 1995. Importance of arabino-galactan proteins for the development of somatic embryos of Piceaabies. Physiol. Plant. 93:334–345.
Filonova, L.H., P.V. Bozhkov and S. von Arnold. 2000a. Develop-mental pathway of somatic embryogenesis in Picea abies as re-vealed by time-lapse tracking. J. Exp. Bot. 51:249–264.
Filonova, L.H., P.V. Bozhkov, V.B. Brukhin, G. Daniel, B. Zhovo-tovsky and S. von Arnold. 2000b. Two waves of programmed celldeath occur during formation and development of somatic embryosin the gymnosperm Norway spruce. J. Cell Sci. 113: 4399– 4411.
Forlani, S., C. Bonnerot, S. Capgras and J.F. Nicolas. 1998. Relief of arepressed gene expression state in the mouse 1-cell embryo re-quires DNA replication. Development 125:3153–3166.
Girke, T., J. Todd, S.A. Ruuska, J. White, C. Benning and J. Ohl-rogge. 2000. Microarray analysis of developing Arabidopsis seeds.Plant Physiol. 124:1570–1581.
Hamann, T., U. Mayer and G. Jurgens. 1999. The auxin-insensitivebodenlos mutation affects primary root formation and apical-basal patterning in the Arabidopsis embryo. Development 126:1387–1395.
Heckel, T., K. Werner, W.F. Sheridan, C. Dumas and P.M. Rogowsky.1999. Novel phenotypes and developmental arrest in early embryospecific mutants of maize. Planta 210:1–8.
Hegde P., R. Qi, K. Abernathy et al. 2000. A concise guide to cDNAmicroassay analysis. Biotechniques 29:548–550.
Hertzberg, M., H. Aspeborg, J. Schrader et al. 2001. A transcriptionalroadmap to wood formation. Proc. Nat. Acad. Sci. 98:14,732–14,737.
Jin, W., R.M. Riley, R.D. Wolfinger, K.P. White, G. Passador-Gurgeland G. Gibson. 2001. The contributions of sex, genotype and age totranscriptional variance in Drosophila melanogaster. NatureGenet. 29:389–395.
Joersbo, M., G. Pedersen, J.E. Nielsen, J. Marcussen and J. Brunstedt.1999. Isolation and expression of two cDNA clones encodingUDP-galactose epimerase expressed in developing seeds of theendospermous legume guar. Plant Sci. 142:147–154.
Jurgens, G. 2001. Apical-basal pattern of embryo formation in Arab-idopsis embryogenesis. EMBO J. 20:3609–3616.
1084 STASOLLA ET AL.
TREE PHYSIOLOGY VOLUME 24, 2004

Kermode, A.R. 1990. Regulatory mechanisms involved in the transi-tion from seed development to germination. CRC Crit. Rev. PlantSci. 9:155–195.
Kerr, M.K. and G.A. Churchill. 2001. Statistical design and the analy-sis of gene expression microarray data. Gen. Res. 77:123–128.
Liu, C.-M., Z.-H. Xu and N.H. Chua. 1993. Auxin polar transport isessential for the establishment of bilateral symmetry during plantembryogenesis. Plant Cell 5:621–630.
Ma, J., P. Svoboda, R.M. Schultz and P. Stein. 2001. Regulation of zy-gotic gene activation in the preimplantation mouse embryo: globalactivation and repression of gene expression. Biol. Reprod. 64:1713–1721.
Mayer, U., G. Buttner and G. Jurgens. 1993. Apical-basal pattern for-mation in the Arabidopsis embryo: studies on the role of the gnomgene. Development 117:149–162.
McCabe, P.F., T.A. Valentine, L.S. Forsberg and R.I. Pennell. 1997.Soluble signals from cells identified at the cell wall establish a de-velopmental pathway in carrot. Plant Cell 9:2225–2241.
Moffatt, B.A., Y.Y. Stevens, M.S. Allen et al. 2002. Adenosine kinasedeficiency is associated with developmental abnormalities and re-duced transmethylation. Plant Physiol. 128:812–821.
Mouaheb, N., D. Thomas, L. Verdoucq, P. Monfort and Y. Meyer.1998. In vivo functional discrimination between plant thioredoxinsby heterologous expression in the yeast Saccharomyces cerevisiae.Proc. Nat. Acad. Sci. 95:3312–3317.
Munksgaard, D., O. Mattsson and F.T. Okkels. 1995. Somatic embryodevelopment in carrot is associated with an increase in the level of5-adenosylmethionine, 5-adenosyl-homocysteine and DNA-meth-ylation. Physiol. Plant 93:5–10.
Potters, G., L. De Gara, H. Asard and N. Horemans. 2002. Ascorbateand glutathione: guardians of the cell cycle, partners in crime?Plant Physiol. Biochem. 40:537–548.
Ramesar-Fortner, N.S. and E.C. Yeung. 2001. Tri-iodobenzoic acidaffects shoot apical meristem formation and function in zygoticembryos of Brassica napus cv. Topas. Can. J. Bot. 79:265–273.
Razin, A. and R. Shemer. 1995. DNA methylation in early develop-ment. Hum. Mol. Genet. 4:1751–1755.
Rojo, E., G.S. Gillmor, V. Kovaleva, C.R. Somerville and N.V. Raik-hel. 2001. The mutant Arabidopsis vacuoleless1 links vacuole for-mation and embryo morphogenesis. Dev. Cell. 1:303–310.
Ruuska, S.A., T. Girke, C. Benning and J. Ohlrogge. 2002. Contra-puntal networks of gene expression during Arabidopsis seed fill-ing. Plant Cell 14:1191–1206.
Scanlon, M.J., A.M. Myers, R.G. Schneeberger and M. Freeling.1997. The maize gene empty pericarp-2 is required for progressionbeyond early stages of embryogenesis. Plant J. 12:901–909.
Singh, H. 1978. Embryology of gymnosperms. Bortrager, Berlin,177 p.
Smertenko, A.P., P.V. Bozhkov, L.H. Filonova, S. von Arnold andP. Hussey. 2003. Re-organization of the cytoskeleton during devel-opmental programmed cell death in Picea abies embryos. Plant J.33: 813–824.
Stasolla, C. and E.C. Yeung. 2001. Ascorbic acid metabolism duringwhite spruce somatic embryo maturation and germination. Physiol.Plant 111:196–205.
Stasolla, C., L. Kong, E.C. Yeung and T.A. Thorpe. 2002. Somaticembryogenesis in conifers: morphogenesis, physiology, biochem-istry, and molecular biology. In Vitro Cell. Dev. Biol. 38:93–105.
Stasolla, C., L. van Zyl, U. Egertsdotter, D. Craig, W. Liu and R.R.Sederoff. 2003. The effects of polyethylene glycol on gene expres-sion of developing white spruce somatic embryos. Plant Physiol.131:49–60.
Steinmann, T., N. Geldner, M. Grebe et al. 1999. Coordinated polarlocalization of auxin efflux carrier PIN1 by GNOM ARF GEF. Sci-ence 286:316–318.
van Zyl, L., S. von Arnold, P.V. Bozhkov et al. 2002. Heterologous ar-ray analysis in Pinaceae: hybridization of high density arrays ofPinus taeda cDNA with cDNA from needles and embryogenic cul-tures of P. taeda, P. sylvestris, or Picea abies. Comp. Funct. Gen-omics 3:306–318.
van Zyl, L., P.V. Bozhkov, D. Chapham, R.R. Sederoff and S.von Ar-nold. 2003. Up, down and up again is a signature global gene ex-pression pattern at the beginning of gymnosperm embryogenesis.Gene Expr. Patterns 3:83–91.
Vernon, D.M. and D.W. Meinke. 1994. Embryogenic transformationof the suspensor in twin, a polyembryonic mutant of Arabidopsis.Dev. Biol. 165:566–573.
Weretilnyk, E.A., K.J. Alexander, M. Drebenstedt, J.D. Snider, P.S.Summers and B.A. Moffatt. 2001. Maintaining methylation activi-ties during salt stress. The involvement of adenosine kinase. PlantPhysiol. 125:856–865.
Wolfinger, R.D., E. Gibson, L. Wolfinger, H. Bennett, P. Hamadeh,C. Bushel, C. Afshari and R.S. Paules. 2001. Assessing gene sig-nificance from cDNA microarray expression data via mixed mod-els. J. Comp. Biol. 8:625–637.
Yadegari, R., G. Pavia, T. Laux et al. 1994. Cell differentiation andmorphogenesis are uncoupled in Arabidopsis embryos. Plant Cell6:1713–1729.
Yeung, E.C., C. Stasolla and L.S. Kong. 1998. Apical meristem for-mation during zygotic embryo development of white spruce. Can.J. Bot. 76:751–761.
Zhang, J.Z. and C.R. Somerville. 1997. Suspensor-derived poly-embryony caused by altered expression of valyl-tRNA synthetasein the twn2 mutant of Arabidopsis. Proc. Nat. Acad. Sci 94:7349–7355.
TREE PHYSIOLOGY ONLINE at http://heronpublishing.com
EMBRYOGENESIS REGULATION IN GYMNOSPERMS 1085


![Suspensor Length Determines Developmental Progression of the Embryo in Arabidopsis1[W]](https://img.dokumen.tips/doc/110x75/61fb44a92e268c58cd5c28b7/suspensor-length-determines-developmental-progression-of-the-embryo-in-arabidopsis1w.jpg)