Embed Size (px)
Citation preview
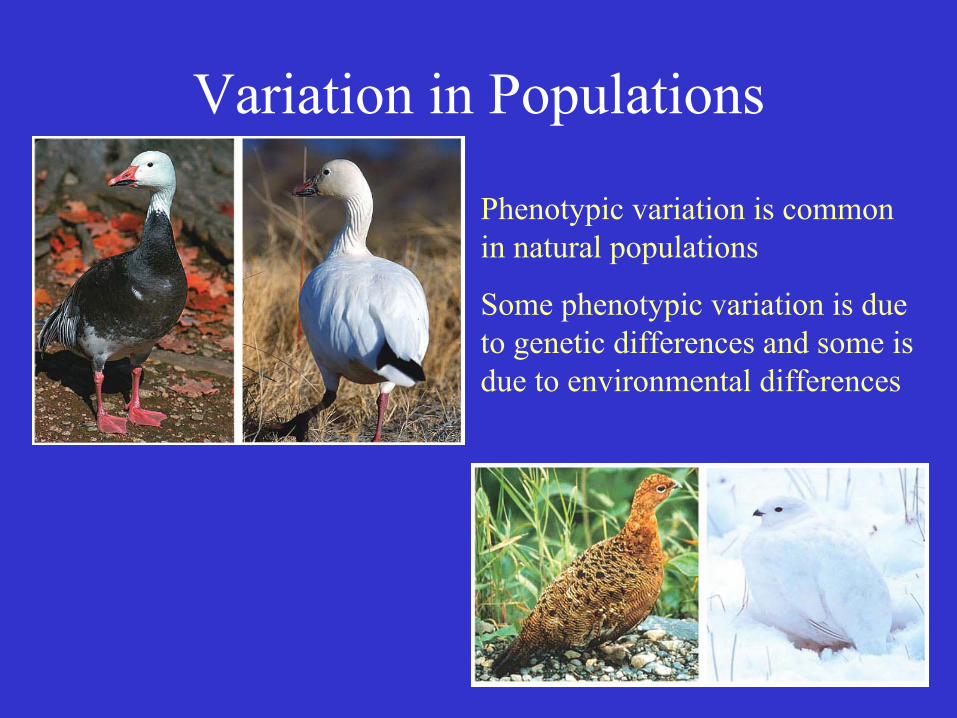
Variation in Populations
Phenotypic variation is commonin natural populations
Some phenotypic variation is dueto genetic differences and some isdue to environmental differences

Commonly, phenotypicvariation has anunderlying genetic basisbut is polygenic withmany genes influencingthe phenotype.
Variation that has anunderlying genetic basisis importantevolutionarily. Thefrequency of differentforms of a gene canchange.
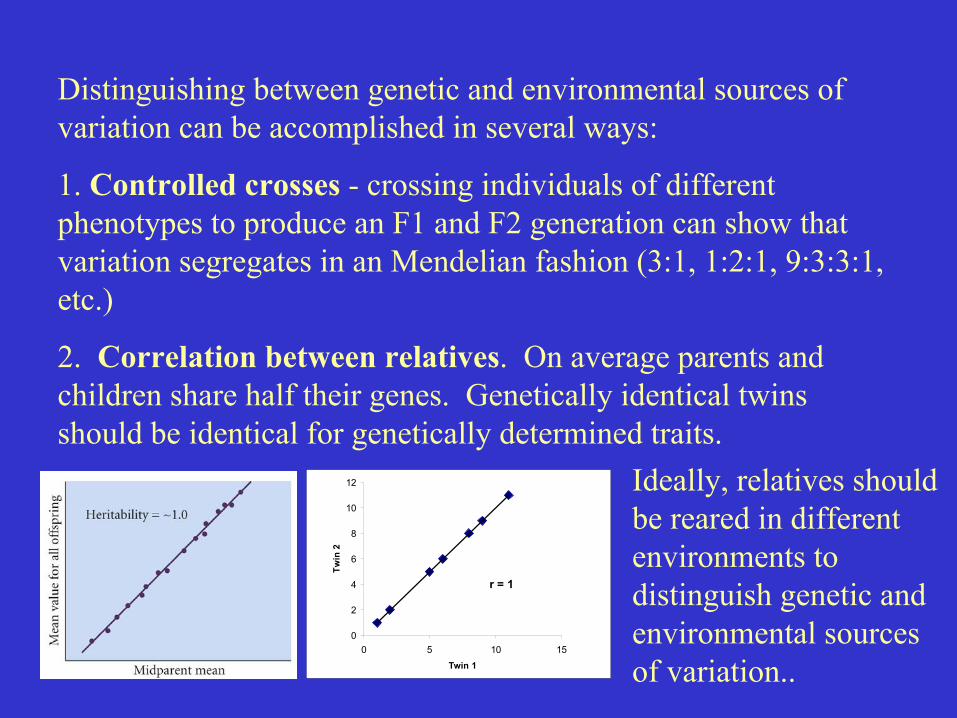
Distinguishing between genetic and environmental sources ofvariation can be accomplished in several ways:
1. Controlled crosses - crossing individuals of differentphenotypes to produce an F1 and F2 generation can show thatvariation segregates in an Mendelian fashion (3:1, 1:2:1, 9:3:3:1,etc.)
2. Correlation between relatives. On average parents andchildren share half their genes. Genetically identical twinsshould be identical for genetically determined traits.
0
2
4
6
8
10
12
0 5 10 15Twin 1
Twin
2
r = 1
Ideally, relatives shouldbe reared in differentenvironments todistinguish genetic andenvironmental sourcesof variation..

3. Common garden study - variation seen between two differentnatural populations could be due to genetic differences or due tothe differences in the environments that influence the phenotype.
To distinguish between them, individuals from both populationscan be reared in a common environment.
Lake Verret Reelfoot Lake
Wild Offspring Mass 0.81 mg 0.93 mgCommon Garden Mass 0.66 mg 0.79 mg
The difference in offspring sizeremains (there is a genetic basisfor the difference) but theoffspring were not as large asfound in natural populations (thereis also a environmental effect onoffspring size).

How Genetic Variation Behaves in Natural Populations - theHardy Weinberg Principle.
Regardless of the initial distribution of genotypes, one generationof random mating will produce a binomial distribution of allelesamong genotypes - and this distribution will persist indefinitely ...

… so long as mating is random, the population is very large, thereis no input of alleles from other populations, there is nomutational change in alleles, and there is no differential survivalor reproduction of different genotypes.
Violation of any of these requirements can result in a distribution ofgenotypes other than binomial or can result in a change in thefrequencies of alleles from one generation to the next, i.e. evolution.
Non-random mating can take several forms - like mating with like,like mating with non-like, or any active preference of certainphenotypes for mates.
Inbreeding - the mating of close relatives - is a type of nonrandommating that can be detected by examining genotypic frequencies - thefrequency of heterozygotes is less than expected for a randomlymating population.

The difference between the observed frequency of heterozygotes(H) and the expected frequency of heterozygotes (H0 - if matingwas random) relative to the expected frequency (H0) is a measureof inbreeding - the inbreeding coefficient (F).
0
0
H HFH−
=
If inbreeding isthe cause of theheterozygotedeficiency, thenF should benearly the samefor all genes.

Studies of inbred lines of Drosophila revealed that heterozygotesoften have higher viability than homozygotes. There is a large ofamount of deleterious genetic variation in natural populations thatis not expressed in heterozygotes.
Other studies haveconfirmed the highdegree of deleteriousrecessive geneticvariation in wildpopulations of otherorganisms.

Inbreeding results in greater expression of deleterious recessivealleles than would be seen in randomly mating populations. Theoverall reduction of the average fitness of individuals in thepopulation is called “inbreeding depression.”
From a study of humans inItaly 1903-1907.
Viability was increased in a smallpopulation of adders in Swedenwhen individuals from outside wereintroduced in 1992.

Although genetically based phenotypic variation is common, itonly accounts for a small fraction of the total genome. Proteinvariation - the product of genes - can be assessed using gelelectrophoresis.
Lewontin & Hubby (1966) first assessed protein variation inDrosophila using gel electrophoresis. They assayed enzymaticvariation. Different forms of an enzyme are called allozymes.Allozymes differ by one or more amino acids and thus migrate atdifferent rates when placed in an electric field.
Their study and similar studiesin other organisms have shownthat on average individuals areheterozygous for 10% or moreof their genes. There is a lot ofgenetic variation in populations.

Although random mating among any distribution of genotypesproduces a binomial distribution of genotypes in just one generation,the variation at two different genes does not mix as quickly.
For two genes, A and B, each with two alleles (A1, A2, B1, B2) andwith each allele in equal frequency [f(A1)=p, f(A2)=q, f(B1)=r,f(B2)=s] we should expect each to have a binomial distribution andbe present in all possible combinations in proportion to theirfrequencies.
For the A gene:
f(AA) = p2, f(Aa) = 2pq, f(aa) = q2
For the B gene:
f(BB) = r2, f(Bb) = 2rs, f(bb) = s2
For both genes togetherf(AABB) = p2 * r2
f(AABb) = p2 * 2rsf(AAbb) = p2 * s2
f(AaBB) = 2pq * r2
f(AaBb) = 2pq * 2rsf(Aabb) = 2pq * s2
f(aaBB) = q2 * s2
f(aaBb) = q2 * 2rsf(aabb) = q2 * s2
Substituting a for A2 and b for B2:

Equilibrium at 2 genes can takeseveral generations to achieve.
When a population is not atequilibrium for multiple genes it is in“linkage disequilibrium.”
Disequilibrium can be measured asd = f(AB)*f(ab) – f(Ab)*f(aB)
d0 = 0.5*0.5 - 0*0= 0.25
d1 = 0.375*0.375 - 0.125*0.125 = 0.125
d2 =0.3075*0.3075 - 0.1875*0.1875 =0.0594
with continued random matingdisequilibrium decreases to 0.

Even though it is called linkage disequilibrium it occurs with linkedor nonlinked genes. The example above assumed the genes were ondifferent chromosomes, assorting independently. If the genes are onthe same chromosome, crossing-over is required to produce therecombinant gametes (Ab, and aB in this case). The more closelylinked the genes are the less will be the frequency of crossing-overand it will take longer to achieve linkage equilibrium.
Most populations exhibitequilibrium for multiple genes,but there are some exceptions.
Inversion heterozygotes don’tproduce recombinant gametes -preserving the original genecombinations and linkagedisequilibrium. G and A are closely linked
PrimrosePrimula vulgaris

Polygenic inheritance - for many traits,phenotypic variation is due to multiplegenes that each have small effects onthe phenotype - quantitative variation.

The environment can also influence the phenotype. Phenotypicvariation that is due to different environmental conditions iscalled environmental variation (Ve)

Variation in phenotypes is dueto the environment (Ve) and dueto genetic differences (Vg). Thecontributions of each can bequantified.
Within genetically identicallines the only phenotypicvariation is environmentalvariation.
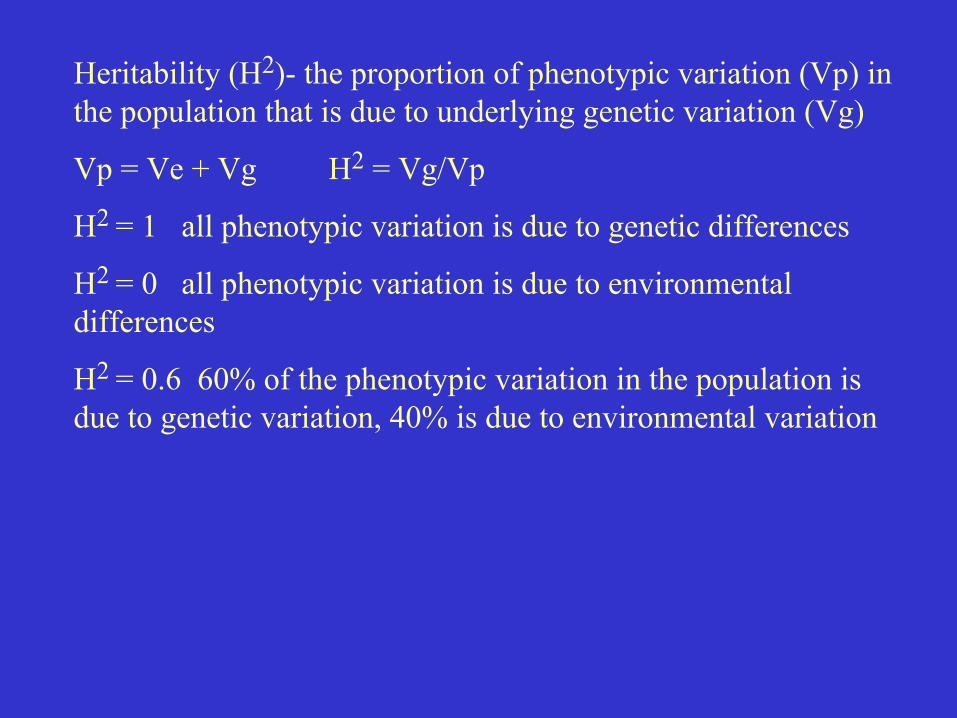
Heritability (H2)- the proportion of phenotypic variation (Vp) inthe population that is due to underlying genetic variation (Vg)
Vp = Ve + Vg H2 = Vg/Vp
H2 = 1 all phenotypic variation is due to genetic differences
H2 = 0 all phenotypic variation is due to environmentaldifferences
H2 = 0.6 60% of the phenotypic variation in the population isdue to genetic variation, 40% is due to environmental variation

Measurement of Heritability
twin studies - a large set of identical twins reared apart canindicate the how much variation is due to environmentaldifferences since there are no genetic differences betweenidentical twins.
0
2
4
6
8
10
12
0 5 10 15Twin 1
Twin
2
r = 1
0
2
4
6
8
10
12
0 5 10 15Twin 1
Twin
2
r = 0.5
0
2
4
6
8
10
12
0 5 10 15Twin 1
Twin
2
r = 0
For identical twins reared apart, thecorrelation coefficient (r) is equal to theheritability of the phenotypic trait.


Correlation between close relatives - the correlation statistic (r)between the phenotypes of close relatives should reflect their degreeof genetic relatedness if the trait has heritability near 1. Acorrelation less than expected based on genetic relatedness indicatesthat some of the phenotypic difference between relatives is due toenvironmental differences. Most often parents and offspring arecompared using the parental mean phenotype of the offspring meanphenotype.
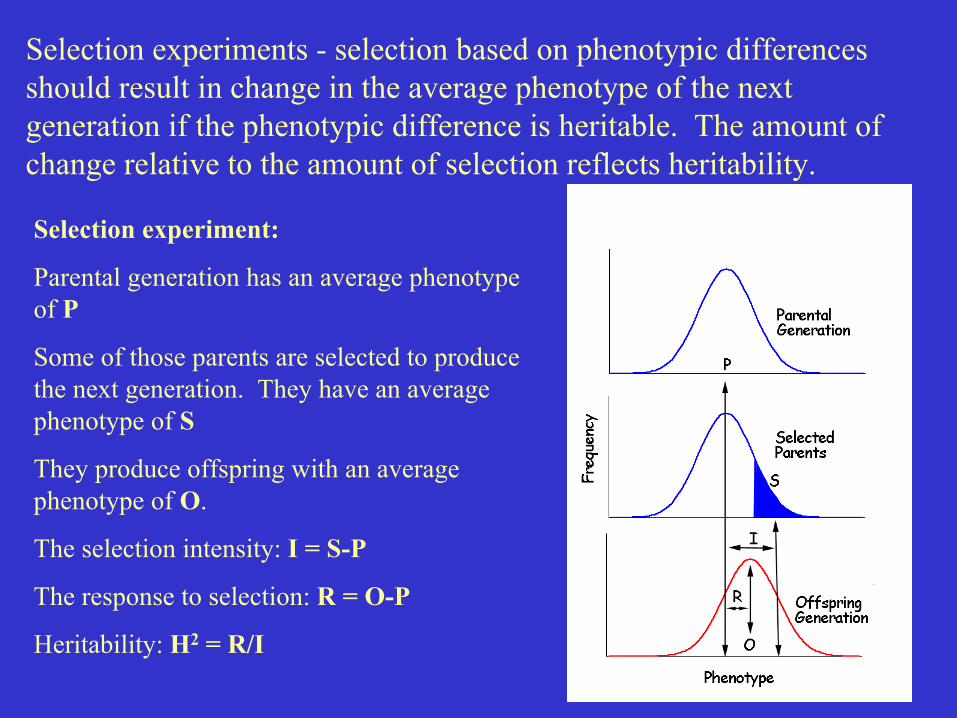
Selection experiment:
Parental generation has an average phenotypeof P
Some of those parents are selected to producethe next generation. They have an averagephenotype of S
They produce offspring with an averagephenotype of O.
The selection intensity: I = S-P
The response to selection: R = O-P
Heritability: H2 = R/I
Selection experiments - selection based on phenotypic differencesshould result in change in the average phenotype of the nextgeneration if the phenotypic difference is heritable. The amount ofchange relative to the amount of selection reflects heritability.

Flies with no overall preference for flyingtoward or away from the light can be selectedfor positive phototaxis or negative phototaxis.
H2 = 0.09
After many generations of selection theresponse to selection decreases.
Pure-bred lines have little geneticvariation for responding to selection.
Variation within pure-bred lines ismostly or entirely environmental -heritability is very low.

All estimates of heritability apply only to the environment inwhich they were measured.
Vp = Ve + Vg H2 = Vg/Vp
If the study is done in an environment that varies little, then littlephenotypic variation will result from environmental variation andthe estimate of heritability will be high.
If the study is done in an environment that varies greatly, thenthere may be a large amount of phenotypic variation that is due toenvironmental variation and the estimate of heritability will below.
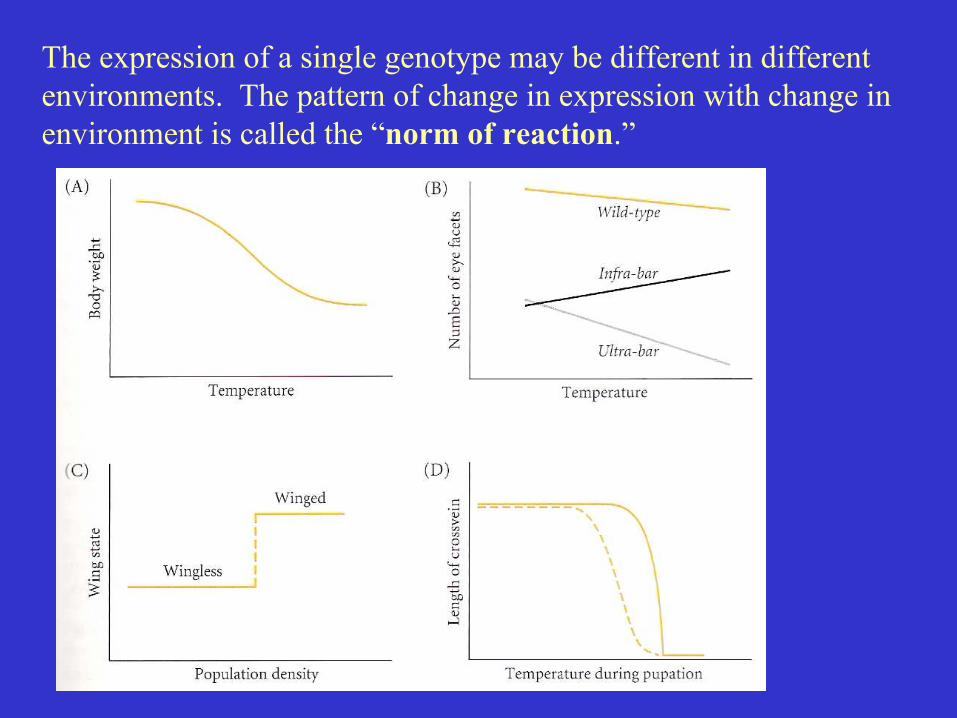
The expression of a single genotype may be different in differentenvironments. The pattern of change in expression with change inenvironment is called the “norm of reaction.”

When the norm of reaction differs betweendifferent genotypes there is agenotype x environment interaction
The measurement of heritability oftendepends on the environment in which themeasurement is made.
Vp large and Ve small -> H2 high
Vp small and Ve larger -> H2 low

Migration (gene flow) and genetic variation.
Gene flow has a homogenizing effect on populations
The amount of gene flow depends on species mobility and barriersto dispersal.

Read: Variation among Populations (p 212-216)