Embed Size (px)
Citation preview

U.S. Department of Health and Human Services
Assistant Secretary for Planning and Evaluation
Office of Health Policy
ASPE REPORT
Variation and Trends in Medigap Premiums
December 2011

Office of the Assistant Secretary for Planning and Evaluation
The Office of the Assistant Secretary for Planning and Evaluation (ASPE) is the principal advisor to the Secretary of the Department of Health and Human Services (HHS) on policy development issues. It is responsible for major activities in the areas of legislative and budget development, strategic planning, policy research and evaluation, and economic analysis.
ASPE plans and conducts evaluations and research—both in‐house and through support of projects by external researchers—of current and proposed programs and of topics of particular interest to the Secretary, the Administration, and the Congress.
Office of Health Policy
The Office of Health Policy (HP) in ASPE focuses on health‐related issues, including public health, health care delivery, health insurance, and health care financing programs in the public (e.g., Medicare, Medicaid, State Children’s Health Insurance Program) and private sectors. It is responsible for health‐related policy development and analysis, budget review, assisting with the development of legislation, and review of regulations.
2

Table of Contents Executive Summary .................................................................................................................................................... 4
Background ................................................................................................................................................................ 6
Description of Market .............................................................................................................................................. 11
Trends in Medigap Enrollment ................................................................................................................... 11
Medical Loss Ratios ..................................................................................................................................... 19
Variation in Premiums across States and Plan Types ................................................................................. 21
Trends in Medigap Premiums .................................................................................................................................. 22
Factors Affecting Premium Growth ............................................................................................................ 26
Analysis of Medigap Policies with Large Premium Increases ..................................................................... 26
Conclusions and Implications ................................................................................................................................... 29
Appendix A: Medicare Benefits for Parts A and B and Cost Sharing Requirements, 2011 ......................... 31
Appendix B: Distribution of Medigap Plans by State and Rating Characteristics, 2010 ............................. 32
Appendix C: Methodology .......................................................................................................................... 33
Appendix D: Enrollment‐Weighted Medical Loss Ratios, Average Monthly Premiums, and Average Annual Percent Change for All Medigap Plan Types, by State, 2007‐2010 ............................................ 34
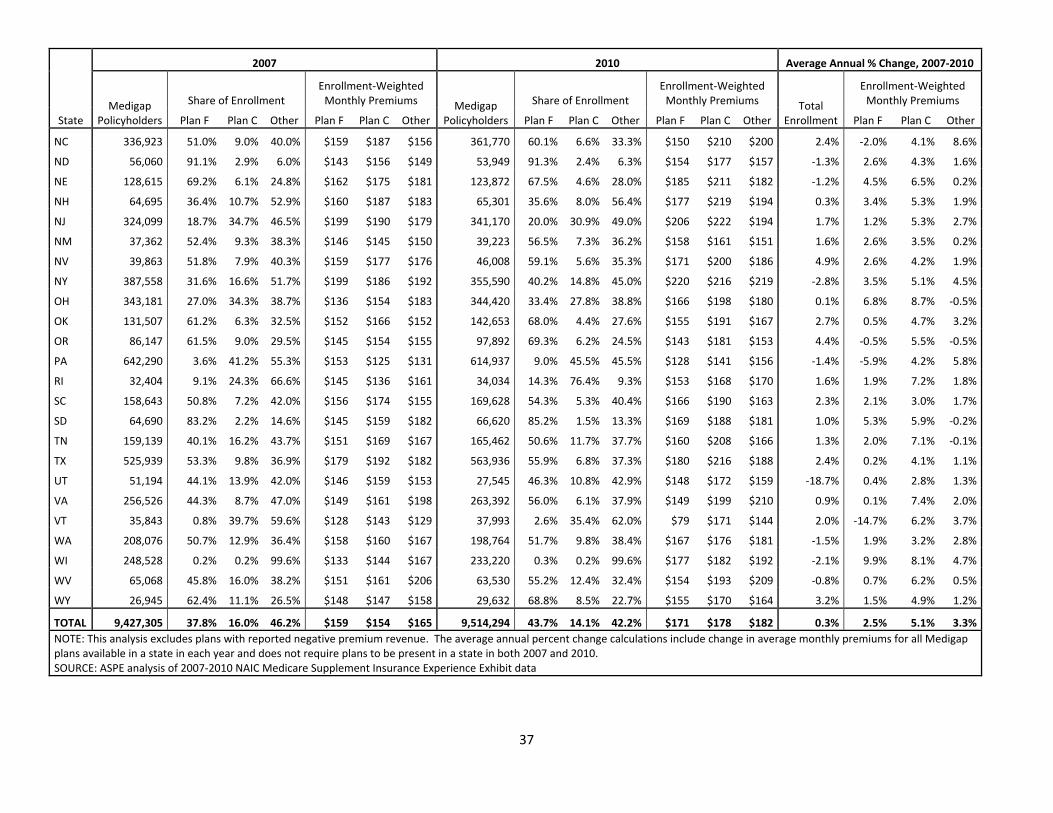
Appendix E: Average Enrollment‐Weighted Monthly Premium for Plans C, F, and Other Medigap Plans, 2007 and 2010 ........................................................................................................................................ 36
3

Executive Summary
In response to a letter from Senators Reid, Baucus, and Kerry,1 the Office of the Assistant Secretary for Planning and Evaluation of the U.S. Department of Health and Human Services has prepared this report. The report describes the market in Medigap insurance (also known Medicare Supplemental Health Insurance policies), analyzes trends in Medigap premiums, and explores factors that may be associated with Medigap policies that have significantly higher than average increases in premiums.
We find that:
1. Overall, Medigap premiums have risen moderately over the past decade, and significantly more slowly than the growth in Medicare spending per beneficiary. Between 2001 and 2010, the average annual increase in Medigap premiums was 3.8 percent, compared to a 5.4 percent average annual increase in total Medicare spending per beneficiary (excluding Part D spending).
2. In 2010, 9.6 million Medicare beneficiaries – approximately 20% of all beneficiaries ‐ purchased Medigap coverage. The share of Medicare beneficiaries purchasing Medigap coverage has declined from approximately 26 percent in 2001.
3. Medigap premiums vary by plan type. The most popular plan types (F and C) had average enrollment‐weighted monthly premiums of $171 and $178 respectively in 2010. Plans M and N, which cover a smaller share of Medicare out‐of‐pocket costs, had the lowest average premiums at $47 and $28 per month in 2010, but together these relatively‐new plans covered fewer than 2 percent of total Medigap enrollees.2
1 Reid H, Baucus M, Kerry J. “Reid, Baucus, Kerry Pen Letter To Secretary Sebelius Requesting More Cost‐Control Protections For Seniors Who Obtain Medigap Supplemental Coverage.” 2010. http://reid.senate.gov/newsroom/pr_101006_medigapcoverage.cfm. 2 Plan M covers 50 percent of the Part A deductible ($1,132 in 2011), and Plan N covers 100 percent of the deductible with $20 copays for doctors office visits.
4

4. There is significant variation across states in average enrollment‐weighted monthly Medigap premiums, from a low of $129 in Michigan to a high of $219 in New York in 2010. One explanation for this range could be the mix of different plan types within a state, but variation in premiums persists even when looking only at Plan F or Plan C. Average Medicare spending per capita at the state level is a strong predictor of Medigap premiums – a ten percent difference in Medicare spending per beneficiary at the state level is associated with a six percent difference in Medigap premiums.
5. Variation at the state level in Medigap premium growth is significantly related to state trends in Medicare spending per beneficiary.
6. The rapid increase in Medicare Advantage (MA) enrollment that began in 2006 is associated with reduced rates of growth in Medigap premiums.
7. Although the increase in Medigap premiums was generally moderate over the past decade, premiums for some beneficiaries increased at rates that were substantially greater than average. About ten percent of Medigap policies, accounting for approximately 3 percent of enrollment, had average annual premium increases of more than 20 percent during the 2007‐2010 period. These “outlier” policies tended to be newer and were more likely to be experiencing large positive or negative changes in enrollment.
5
Background
While Medicare covers many services, it does not cover them in full. Individuals with Medicare coverage are responsible for some out‐of‐pocket expenses such as copayments, coinsurance, and deductibles (see Appendix A for more information). Fee‐for‐service Medicare also does not include a cap on out‐of‐pocket payments. Medigap (also called “Medicare Supplemental Health Insurance”) is a form of private health insurance designed to “supplement” Medicare by filling in these “gaps” in Medicare payment.
These gaps in acute care coverage fall into two main categories:3
1. Cost‐sharing provisions for Medicare‐covered services, including annual deductibles and copayments for expenses covered by Part A and Part B; and
2. Limitations on Medicare‐covered services (e.g. skilled nursing facility care and home health care are only covered partially or with severe restrictions) or non‐covered services (e.g. outpatient prescription drugs before 2006).
Section 1882 of the Social Security Act pertains to Medigap plans and establishes standards for the various types of plans offered. The standard Medigap plans can be identified by the letters A through N.4, 5 Each standardized Medigap plan must offer the same basic benefits no matter which insurance company sells it (see Figure 1). Therefore, cost and administrative features such as customer service are the primary differences between standardized Medigap plans with the same letter.
3 Finkelstein A. “Minimum standards, insurance regulation and adverse selection: evidence from the Medigap market.” Journal of Public Economics. 2004; 88: 2515‐2547. 4 Centers for Medicare and Medicaid Services (CMS). “Choosing a Medigap Policy: A Guide to Health Insurance for People with Medicare.” 2011. http://www.medicare.gov/publications/pubs/pdf/02110.pdf. 5 Note that in Massachusetts, Minnesota, and Wisconsin, Medigap policies are standardized in a different way. See CMS, “Choosing a Medigap Policy”, for more details. The Medigap market also includes some “pre‐standardized” policies that were in force prior to the effective date of the Omnibus Budget Reconciliation Act (OBRA) of 1990.
6

Figure 1: Medigap Plan Types
*Plan F also offers a high‐deductible plan. If you choose this option, this means that you must pay for Medicare‐covered costs up to the deductible amount of $2,000 in 2011 before your Medigap plan pays anything. **After you meet your out‐of‐pocket yearly limit and your yearly Part B deductible ($162 in 2011), the Medigap plan pays 100% of covered services for the rest of the calendar year. ***Plan N pays 100% of the Part B coinsurance, except for a copayment of up to $20 for some office visits and up to a $50 copayment for emergency room visits that don’t result in an inpatient admission. Source: CMS, “Choosing a Medigap Policy: A Guide to Health Insurance for People with Medicare.” 2011. http://www.medicare.gov/publications/pubs/pdf/02110.pdf.
Federal statute establishes that there are two periods during which a Medigap insurer may not deny a beneficiary age 65 or over the right to purchase a Medigap policy:
1. During the beneficiary’s open enrollment period (prior to or during the six month period beginning with the first month of the first day on which the beneficiary is 65 or older and is enrolled in Medicare Part B).
2. A guaranteed issue (GI) period, which covers seven scenarios (generally when a beneficiary’s current source of coverage no longer participates in the Medicare program).6
6 These seven scenarios include instances when a beneficiary: 1) is enrolled in Medicare Advantage (MA) and the plan is leaving Medicare, or the beneficiary is no longer in the plan’s service area; 2) has supplemental coverage through an employer or union group that is ending; 3) has a Medicare SELECT policy and moves out of the policy’s service area; 4) enrolls in MA or PACE when first eligible at age 65 and decides within 1 year to switch to Original
7

Outside of these two periods, a Medigap insurer may choose whether to accept an application from a beneficiary who is seeking an initial policy or one who is looking to switch to another insurer (as in shopping for price).
Medicare beneficiaries purchase Medigap policies primarily for two reasons: 1) to protect themselves from potentially high out‐of‐pocket costs and 2) to eliminate the hassle and confusion of handling complex medical bills.7 Medicare Advantage plans and other forms of supplemental insurance such as Medicaid and retiree coverage also provide protection against Medicare cost sharing requirements. In 2009, about 8 percent of Medicare beneficiaries were enrolled in fee‐for‐service only (Table 1) meaning they did not have any supplemental coverage.
Table 1: Supplemental Coverage of Medicare Beneficiaries, by Income Range, 2009 Annual Income
Coverage Type $10,000 or
less $10,001 to $20,000
$20,001 to $40,000
More than $40,000 Overall
Medigap* 7% 16% 21% 23% 18% Medicaid 48% 20% 2% 1% 14% Employer‐Based 8% 18% 36% 48% 30% Medicare Advantage 25% 32% 32% 24% 29% Other 0% 1% 0% 0% 1% Fee for Service Only 10% 12% 8% 4% 8% Total Beneficiaries 6,193,586 12,859,747 13,217,472 10,760,737 43,031,542 Source: ASPE Analysis of 2009 Medicare Current Beneficiary Survey, Access to Care file Note: supplemental coverage is coded in the following mutually exclusive, hierarchical manner: 1) Medicare Advantage, 2) Medicaid, 3) Employer Sponsored (ESI), 4) Medigap/self purchase, and 5) no other coverage. * The Medigap data in this table exclude group Medigap policies (which are included in the employer‐sponsored category). Overall, approximately 4.2 percent of Medicare beneficiaries are enrolled in group Medigap policies. The estimated total Medigap enrollment based on the MCBS Access to Care file is slightly higher than than the estimated enrollment based on ASPE’s analysis of NAIC Medicare Supplement Insurance Experience Exhibit data (9.68 million vs. 9.59 million, respectfully). The MCBS data are based on the “always‐enrolled” population (i.e., beneficiaries who were always enrolled in Medicare Part A and/or B for 12 months); conversely, the NAIC data are based on the “ever‐enrolled” population (i.e., beneficiaries who were enrolled in a Medigap plan for at least one month during the year), and exclude data for companies that are regulated by the California Department of Managed Health Care (DMHC).
Medicare; 5)switches from Medigap to Medicare Advantage or a Medicare SELECT policy for the first time and decides to switch back within one year; 6) is enrolled in Medigap and the insurance company goes bankrupt, or Medigap coverage otherwise ends through no fault of the beneficiary; or 7) leaves a MA plan or drops a Medigap policy because the company did not follow rules or misled the beneficiary. (CMS, “Choosing a Medigap Policy.”) 7 Lemieux J, Chovan T, and Heath K. (2008) “Medigap Coverage and Medicare Spending: A Second Look.” Health Affairs 27(2):469‐77.
8

State departments of insurance or other state agencies have the authority to approve insurance policy forms and oversee all other regulation with regard to Medigap policies.8 Medigap policies are priced by insurance companies in 3 ways (subject to state regulations):
1. Community rated (also called “no‐age‐rated”); 2. Issue‐age rated (also called “entry‐age‐rated”); and 3. Attained‐age rated.
In community rating, the same monthly premium is charged to everyone who has the Medigap plan, regardless of age. Premiums may rise due to inflation, but not due to the beneficiary aging. Issue‐age rated premiums depend on the age of the beneficiary when purchased, but again, they do not rise due to aging. Attained‐age rated premiums, conversely, rise as the beneficiary ages.9 Rating rules differ from state to state (see Appendix B). In 2010, seven states (CT, ME, MA, MN, NY, VT, and WA) required community rating for all Medigap policies. In Idaho, all Medigap policies were issue‐age rated, and about 80 percent or more of the available policies in Florida, Georgia, Missouri, and New Hampshire were issue‐age rated. However, the most common form of rating is attained‐age rating, which allows insurers to increase premiums almost every year. Nationally, 69 percent of available Medigap plans in 2010 used attained age rating while 12 percent used community‐rating and 19 percent used issue‐age rating.10
Furthermore, Medigap premiums can also be affected by several insurance company practices, including:
1. Geographical rating (charging different areas different prices); 2. Medical underwriting (charging different prices based on medical history); 3. Discounts (such as discounts for non‐smokers or for women).11
8 The Secretary is required to periodically review the States’ regulatory programs to determine if they continue to meet applicable statutory requirements, such as providing for the application and enforcement of standards that are equal to or more stringent than the National Association of Insurance Commissioners (NAIC) Model Standards. 9 CMS, “Choosing a Medigap Policy.” 10 ASPE analysis of the 2010 CMS Medigap planfinder database. 11 CMS, “Choosing a Medigap Policy.” Community‐rated policies (also called no‐age rated) do not vary by age, but premiums may increase because of inflation or the other factors listed above, depending on state requirements.
9

The remainder of this report describes the market in Medigap insurance, analyzes trends in Medigap premiums, and examines factors that are associated with Medigap policies that have significantly higher than average increases in premiums.
10

Description of Market Trends in Medigap Enrollment In 2010, according to data filed by insurers with the National Association of Insurance Commissioners, 9.6 million Medicare beneficiaries (about 20 percent of all beneficiaries) purchased supplemental coverage through Medigap.12 As displayed in Figure 2, the percentage of Medicare beneficiaries enrolled in Medigap plans declined over the past decade. At the beginning of the decade more than a quarter of Medicare beneficiaries had a Medigap policy, but this percentage has steadily declined to about 20 percent in 2010. This decline in enrollment has occurred in both the individual and group markets, although in both relative and absolute terms the drop has been greater in the individual market.
Figure 2: Percent of Medicare Beneficiaries Covered by Medigap, 2001‐2010
0
5
10
15
20
25
30
2001 2002 2003 2004 2005 2006 2007 2008 2009 2010
Individual (%) Group (%) Total (%)
Notes: “Group” refers to Medigap policies purchased through a former employer or union. Source: ASPE analysis of 2001‐2010 NAIC Medicare Supplement Insurance Experience Exhibit data.
12 Estimates from the most recent 2009 Medicare Current Beneficiary Survey suggest that 18% of 43 million beneficiaries, or approximately 7.8 million Medicare beneficiaries, purchased Medigap in 2009. It is not clear whether the NAIC data for some reason overcounts Medigap enrollment (for example, policy switchers may be counted twice), or whether, as seems more likely, some beneficiaries who purchase Medigap fail to report that coverage when interviewed by the MCBS.
11

As displayed in Figure 3, much of the decline in Medigap enrollment has coincided with the rapid increase in Medicare Advantage enrollment that occurred after 2006. Medicare beneficiaries can choose between a Medicare Advantage (MA) plan (such as an HMO or PPO) or the traditional Medicare program, the latter with the additional option of purchasing a Medigap plan. Both MA and Medigap cover some of Medicare’s cost sharing requirements, and MA enrollees cannot be sold a Medigap policy. Enrolling in MA can be a direct substitute for purchasing Medigap. Since related provisions of the Medicare Modernization Act of 2003 were implemented, Medicare’s payments to MA plans have been substantially above the payment that would be made for a similar beneficiary in traditional Medicare. Thus, MA plans have been able to offer benefits above and beyond traditional Medicare. For example, many MA plans offer prescription drug coverage at no additional cost—52 percent of MA enrollees with drug coverage are in plans that charge no additional premium beyond the Part B premium required of all Medicare beneficiaries.13 In contrast, Medigap enrollees who want drug coverage must purchase a separate prescription drug plan.
Figure 3: Medicare Advantage and Medigap Enrollment, 2001‐2010
0
5
10
15
20
25
30
35
40
45
50
2001 2003 2005 2007 2009
Percent of Medicare Beneficiaries (%):
Medicare Advantage enrollment Medigap enrollment Medigap + MA Enrollment
Source: ASPE analysis of 2001‐2010 NAIC Medicare Supplement Insurance Experience Exhibit data; CMS State‐County‐Plan Files, State‐County‐Contract Files, and Medicare Advantage, Cost, PACE, Demo, and Prescription Drug Plan Contract Reports; and 2011 Medicare Trustees Report, Table III.A3.
13 Kaiser Family Foundation Program on Medicare Policy, ‘Data Spotlight: Medicare Advantage Market Enrollment Update,” September 2011. http://www.kff.org/medicare/upload/8228.pdf
12

Medicare beneficiaries can purchase Medigap coverage on their own or through a group policy, such as through a former employer or union.14 Unlike the private insurance market for persons under 65, the Medigap market is dominated by individual, not group, policies. Over three‐quarters of persons with a Medigap policy have an individual policy.
Figure 4: Distribution of Medigap Policies between Group and Individual Market Policies in 2010
Group, 21.8%
Individual, 78.2%
Market share (%) by number of lives covered :
Total Enrollment: 9.6 Million
Notes: Market share is calculated by number of lives covered. “Group” refers to Medigap policies purchased through a former employer or union. Source: ASPE analysis of 2010 NAIC Medicare Supplement Insurance Experience Exhibit data
The two most popular Medigap plan types, F (44 percent) and C (14 percent), are also the most comprehensive ones (Figure 5). Plans F and C cover 100 percent of the deductibles and coinsurance charged by Medicare. Plan F, but not plan C, also covers Part B excess charges.15
In recent years, Congress has discontinued some of the standardized plan types, authorized new plan types, and allowed new versions of original standardized
14 While some employers or unions offer supplemental retiree coverage that wraps around Medicare Parts A and B, others offer enrollment in a group Medigap plan to protect against Medicare’s cost sharing requirements. 15 These charges are the difference between the price (“allowed charge”) Medicare will cover (80 percent of the allowed charge) and what a physician not accepting Medicare assignment (“nonparticipating provider”) can charge (which can be up to 15 percent higher than the allowed charge).
13

plan types to be sold. Plan F is now authorized to be sold as a high deductible plan. The Medicare Modernization Act of 2003 (MMA) created two new plan types, K and L, which were introduced in 2006. These new plan types included more cost sharing to address longstanding concerns about overutilization of services by those with Medigap relative to fee‐for‐service only Medicare beneficiaries.16 Because beneficiaries with these plan types have higher out‐of‐pocket costs on Medicare‐covered expenditures, their premiums are generally lower than for the other plan types.17 These two plan types do not cover the Part B deductible and, unlike the other Medigap plan types, also have a limit on annual out‐of‐pocket costs—$4,640 and $2,320 for plans K and L respectively, in 2011.18
The MMA also required the Secretary of Health and Human Services to request NAIC to revise the standard plans under its Medigap model law and regulations. NAIC issued its recommendations in March 2007 and received Congressional approval through the Medicare Improvements for Patients and Providers Act of 2008 (MIPPA). These changes were effective in June 2010. New plans M and N also became available; plan M covers 50 percent of the Medicare Part A deductible, and plan N includes 100 percent coverage for the deductible with $20 copays for physician office visits. In addition, plans D and G sold after June 2010 have different benefits than D or G plans purchased before that date. Also, plans E, H, I and J are no longer sold, but beneficiaries with those plans can keep their coverage. Further changes to standardized plans are expected in the future; the Affordable Care Act of 2010 requires the NAIC to revise standards for Plans C and F to include nominal cost sharing for Part B physician services beginning in 2015.
16 For example, the Physician Payment Review Commission (PPRC) showed that 1995 Medicare spending for FFS‐only Medicare beneficiaries was less than 75% of that for beneficiaries with Medigap. (Physician Payment Review Commission, Annual Report to Congress, 1997). Another study of 1994 data reported that Medicare enrollees with Medigap used 28% more services than those with no supplementary coverage, while those with employer‐based coverage used 17% more. The authors attributed the differences to the fact that Medigap plans often covered all of Medicare’s cost‐sharing charges, while employer‐based plans typically did not. (Sandra Christensen, and Judy Shinogle, “Effects of Supplemental Coverage on Use of Services by Medicare Enrollees,” Health CareFinancing Review, vol. 19, no. 1 [fall 1997], 5‐17). 17 America’s Health Insurance Plans (AHIP). “Trends in Medigap Policies, December 2004 to December 2006.” 2008. www.ahipresearch.org/pdfs/MedigapTrendReport.pdf. 18 CMS, “Choosing a Medigap Policy.”
14

Participation in new plan types (K‐N) continues to be extremely low. In 2006, plans K and L combined to cover less than 0.1 percent of Medigap enrollees (0.04 percent and 0.04 percent for plans K and L, respectively).19 In 2010, participation had only marginally increased in these two plans. Plan K accounted for 0.3 percent of Medigap policies in 2010, while plan L accounted for only 0.4 percent. More recent data from the first quarter of 2011 suggests that plan N, with its predictable cost sharing, is the most popular choice among new plan types and represented 15 percent of all new Medigap policies issued or sold during that quarter, though its share among all Medigap policies is still quite low.20
Figure 5: Market Share by Medigap Plan Type, 2010
A, 2.0%B, 4.6%
C, 14.1%
D, 3.5%
E, 1.6%
F, 43.6%
G, 3.5%
H, 0.7%
I, 1.5% J, 9.0%
K, 0.3%
L, 0.4%
M, 0.0% N, 1.5%Other, 5.7%
Pre‐standardized, 8.0%
Market share (%) by number of lives covered
Total Enrollment: 9.6 Million
Notes: Plan type refers to the standard plans A‐N as required by Section 9E of the Model Regulation to Implement the NAIC Medicare Supplement Insurance Minimum Standards Model Act. This includes all plans identified as A‐N issued prior to a State’s revisions to its regulatory program and identified as a standard plan at the time of issue. Policies issued prior to the effective date of the State’s revisions to its Medicare supplement regulatory program pursuant to the Omnibus Budget Reconciliation Act (OBRA) of 1990, and no longer offered in a State, are designated here as “pre‐standardized.” Policies not meeting either of these definitions are designated here as “other.” Source: ASPE analysis of 2010 NAIC Medicare Supplement Insurance Experience Exhibit data
19 AHIP, “Trends in Medigap policies.” 20 America’s Health Insurance Plans, Center for Policy and Research (2011). “Trends in Medigap Coverage and Enrollment, 2010‐2011”. http://www.ahipresearch.org/pdfs/Medigap2011.pdf
15

This distribution of participation in plan types reflects a continued preference for lower out‐of‐pocket spending despite higher premiums. The more comprehensive and more popular plans, C and F, cost an average of $178 and $171 per month, respectively, while the plans with higher out‐of‐pocket spending, K and L, cost an average of $82 and $121 per month, respectively (Table 2).21
Table 2: Average Enrollment‐Weighted Monthly Premiums by Medigap Plan Type in 2010
Plan type Average monthly premium/member in 2010 ($)
Market share (%) by number of covered lives
A 146 2.0 B 161 4.6 C 178 14.1 D 190 3.5 E 183 1.6 F 171 43.7 G 166 3.5 H 193 0.7 I 202 1.6 J 190 9.0 K 82 0.3 L 121 0.4 M 47 0.00 N 28 1.6
Other 202 5.7 Pre‐standardized 218 8.0
Notes: Plan type classification here follows NAIC guidance, which means “the standard plans A‐N as required by Section 9E of the Model Regulation to Implement the NAIC Medicare Supplement Insurance Minimum Standards Model Act. This includes all plans identified as A‐N issued prior to a State’s revisions to its regulatory program and identified as a standard plan at the time of issue. Policies issued prior to the effective date of the State’s revisions to its Medicare supplement regulatory program pursuant to the Omnibus Budget Reconciliation Act (OBRA) of 1990, and no longer offered in a State, should be designated as ‘pre‐standardized.’ Policies not meeting either of these definitions should be designated as ‘other.’” Source: ASPE analysis of 2010 NAIC Medicare Supplement Insurance Experience Exhibit
21 Table 2 does not adjust for variation in Medigap premiums across States or variation due to the characteristics (i.e. health status) of beneficiaries in individual plans.
16

Premiums vary widely across states. The average enrollment‐weighted monthly premium in 2010 at the state level ranged from $129 in Michigan to $219 in New York. These averages do not take into account the distribution of plan types within a state, so a higher average premium might be due to a higher proportion of enrollment in more comprehensive, and therefore more expensive, plan types. However, looking at premiums for only plans C and F, there still was considerable variation across states. Tables with average enrollment‐weighted premiums by state are included in the Appendices.
Figure 6: Average Enrollment‐Weighted Monthly Medigap Premiums for All Plan Types, 2010
Note: This map does not weight by distribution of plan types. Source: ASPE analysis of 2010 NAIC Medicare Supplement Insurance Experience Exhibit data
17

The Medigap market is dominated by relatively few insurers. In 2010, two insurers accounted for 40 percent of the Medigap market. UnitedHealth Group is the largest insurance carrier for Medigap policies, covering about a third of all Medigap enrollees. Mutual of Omaha Group and the rest of the top 10 insurers cover another third of beneficiaries with Medigap coverage.
Figure 7: Market Share of Top 10 Insurers Selling Medigap Policies in 2010
BCBS of FL Group, 1.7%
BCBS of MA Group, 1.8%
Wellmark Inc Group, 1.8%Highmark Group,
2.0%BCBS of MI Group, 2.3%
CNO Financial Grp , 3.6%
Health Care Services Corp Group, 5.0%Wellpoint Inc
Grp, 6.1%
Mutual of Omaha Group, 10.7%
UnitedHealth Group, 31.0%
Other, 33.9%
Market share (%) by number of lives covered
Total Enrollment: 9.6 Million
Notes: Organizations are identified based on NAIC insurer group code. Source: ASPE analysis of 2010 NAIC Medicare Supplement Insurance Experience Exhibit data
18

The Medigap market is very concentrated in most states. The top two insurers account for more than half of the Medigap market in 45 states and more than 80 percent of the market in 12 states (Figure 8).
Figure 8: Percent of Lives Covered by Top 2 Medigap Insurance Groups, 2010
Source: ASPE analysis of 2010 NAIC Medicare Supplement Insurance Experience Exhibit data
Medical Loss Ratios
Medical Loss Ratios (MLRs) are one measure used to gauge the performance of insurance markets. High ratios mean that a large share of premium revenues is paid out for medical care services provided to enrollees. On the other hand, low ratios can mean either very large administrative costs or high profit rates. Under the Affordable Care Act, issuers offering comprehensive major medical coverage in the large group market must attain a minimum MLR of 85 percent, while issuers offering coverage in the small group and individual markets must attain a minimum MLR of 80 percent.22
22 The Affordable Care Act’s minimum MLR standard measures the proportion of premium dollars that issuers spend on clinical services and activities that improve quality.
19
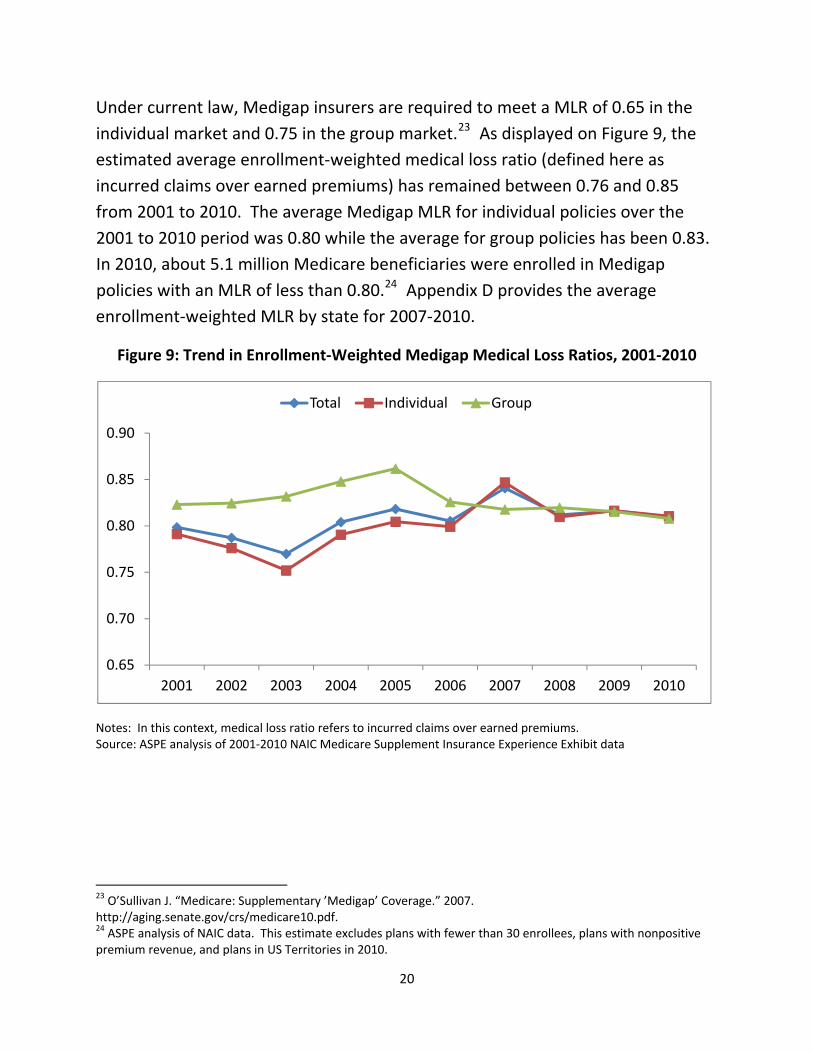
Under current law, Medigap insurers are required to meet a MLR of 0.65 in the individual market and 0.75 in the group market.23 As displayed on Figure 9, the estimated average enrollment‐weighted medical loss ratio (defined here as incurred claims over earned premiums) has remained between 0.76 and 0.85 from 2001 to 2010. The average Medigap MLR for individual policies over the 2001 to 2010 period was 0.80 while the average for group policies has been 0.83. In 2010, about 5.1 million Medicare beneficiaries were enrolled in Medigap policies with an MLR of less than 0.80.24 Appendix D provides the average enrollment‐weighted MLR by state for 2007‐2010.
Figure 9: Trend in Enrollment‐Weighted Medigap Medical Loss Ratios, 2001‐2010
0.65
0.70
0.75
0.80
0.85
0.90
2001 2002 2003 2004 2005 2006 2007 2008 2009 2010
Total Individual Group
Notes: In this context, medical loss ratio refers to incurred claims over earned premiums. Source: ASPE analysis of 2001‐2010 NAIC Medicare Supplement Insurance Experience Exhibit data
23 O’Sullivan J. “Medicare: Supplementary ’Medigap’ Coverage.” 2007. http://aging.senate.gov/crs/medicare10.pdf. 24 ASPE analysis of NAIC data. This estimate excludes plans with fewer than 30 enrollees, plans with nonpositive premium revenue, and plans in US Territories in 2010.
20

Variation in Premiums across States and Plan Types
Using data from all Medigap policies in 2008, we estimated models to explain variation in Medigap premiums. The key results are:
1. Medicare spending per beneficiary at the state level is an important factor: a 10 percent increase in Medicare spending per capita at the state level was associated with a 6 percent higher Medigap premium.
2. Older and individual policies were on average more expensive than newer and group policies, respectively.
3. Policies with a greater number of covered lives were on average less expensive.
4. Our measure of insurance market concentration was not a significant predictor in general, but was positively associated with premiums for C plans. That is, C plan premiums were higher in more concentrated markets.
5. Premiums for plans in states where the majority of policies were issue‐age rated were about 7 percent lower than plans in states where the majority of plans were attained‐age rated.
21

Trends in Medigap Premiums
Average Medigap premiums rose from $127 in 2001 to $177 in 2010, an average annual increase of approximately 3.8 percent. As displayed on Figure 10, annual growth rates were higher early in this decade then in more recent years. As a point of comparison, the average annual change in Medicare spending per beneficiary (without Part D spending) was 5.4 percent during the same time period. In six of the nine years the percent change in Medigap premiums from the previous year was lower than the percent change in Medicare spending per beneficiary (Figure 11).
Figure 10: Overall Trend of Average Monthly Medigap Premiums (2001‐2010)
100
110
120
130
140
150
160
170
180
2001 2002 2003 2004 2005 2006 2007 2008 2009 2010
Average Monthly Premium per Beneficary ($):
Source: ASPE analysis of 2001‐2010 NAIC Medicare Supplement Insurance Experience Exhibit data.
22

Figure 11: Difference in Trends between Medigap Premiums and Medicare Spending , 2001‐2010
0
1
2
3
4
5
6
7
8
9
10
2002 2003 2004 2005 2006 2007 2008 2009 2010
Percent change in average Medigap premiums/member (%)
Percent change in average Medicare spending/beneficiary (%)
Notes: Graph plots percent change from the previous year. Estimates exclude spending on Part D prescription drugs. 2001‐2010 annual average for Medigap premiums per member: 3.8 percent; 2001‐2010 annual average for Medicare spending per beneficiary: 5.4% Source: ASPE analysis of 2001‐2010 NAIC Medicare Supplement Insurance Experience Exhibit data.
Monthly premiums for group and individual policies have tracked closely for the past decade. Between 2001 and 2010, the average annual increase in premiums for individual and group policies was 3.8 percent and 4.06 percent, respectively.
There is a wider disparity in the average annual increase in premiums between newer and older policies. Older policies (defined here as policies issued three or more years before the reporting year) increased by an average of 4.7 percent each year, while newer policies (defined here as policies issued fewer than three years before the reporting year) increased by an average of 2.4 percent each year. This difference may reflect the desire of insurance companies to use low premiums to gain new customers. It may also represent the age‐adjustment of premiums, as those in older policies would on average be older and less healthy.
23
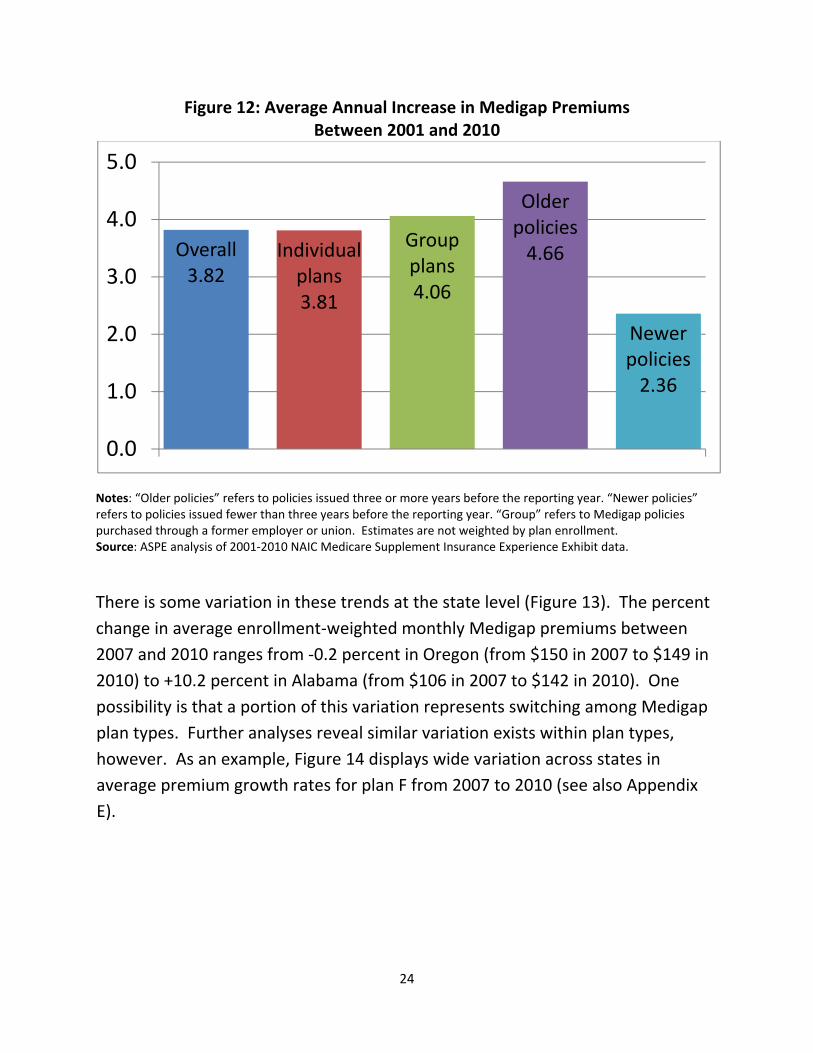
Figure 12: Average Annual Increase in Medigap Premiums Between 2001 and 2010
Overall3.82
Individual plans3.81
Group plans4.06
Older policies4.66
Newer policies2.36
0.0
1.0
2.0
3.0
4.0
5.0
Notes: “Older policies” refers to policies issued three or more years before the reporting year. “Newer policies” refers to policies issued fewer than three years before the reporting year. “Group” refers to Medigap policies purchased through a former employer or union. Estimates are not weighted by plan enrollment. Source: ASPE analysis of 2001‐2010 NAIC Medicare Supplement Insurance Experience Exhibit data.
There is some variation in these trends at the state level (Figure 13). The percent change in average enrollment‐weighted monthly Medigap premiums between 2007 and 2010 ranges from ‐0.2 percent in Oregon (from $150 in 2007 to $149 in 2010) to +10.2 percent in Alabama (from $106 in 2007 to $142 in 2010). One possibility is that a portion of this variation represents switching among Medigap plan types. Further analyses reveal similar variation exists within plan types, however. As an example, Figure 14 displays wide variation across states in average premium growth rates for plan F from 2007 to 2010 (see also Appendix E).
24

Figure 13: Percent Change in Enrollment‐Weighted Medigap Premiums by State (2007‐2010)
Source: ASPE analysis of 2007‐2010 NAIC Medicare Supplement Insurance Experience Exhibit data.
Source: ASPE analysis of 2007‐2010 NAIC Medicare Supplement Insurance Experience Exhibit data
‐15%
‐13%
‐11%
‐9%
‐7%
‐5%
‐3%
‐1%
1%
3%
5%
7%
9%
WI
KS OH
MS
MA SD IN IA ME
NE
AK
GA
MO DC
CA IL AR
NY
NH CT MN CO DE
NM ID NV
ND
MT KY MD SC TN RI
WA LA AZ HI
WY FL NJ
WV
OK
UT TX VA AL
OR MI
NC PA VT
Figure 14: Average Annual % Change in Medigap Plan F Monthly Premiums, by State, 2007‐2010
25
Factors Affecting Premium Growth Using all Medigap plans that had usable data in each of the four years from 2007 and 2010, we estimated a model to predict annual changes in premiums within plans. Important findings are:
1. Medicare per capita spending trend within states was a significant and positive predictor of increases in Medigap premiums.
2. Both the level and change in Medicare Advantage penetration within a state were associated with lower rates of growth of Medigap premiums during the 2007‐2010 period.
3. Older and individual policies experienced larger increases in Medigap premiums than newer and group policies, respectively.
4. In general, plans with the largest number of covered lives had smaller premium increases
5. Plans in states with issue‐age rating requirements had smaller rates of premium increase than plans states with attained‐age rating.
Analysis of Medigap Policies with Large Premium Increases While overall Medigap premium increases have been moderate over the past ten years, some policies have had much larger than average increases. These increases may cause concern among enrollees and policy makers. To examine potential factors that may be associated with high premium growth, we examined plans that appeared to be “outliers” in terms of Medigap premium increases. We defined outliers as policies in the top 10 percent of premium increases over the period between 2007 and 2010. At minimum, these policies experienced approximately a 65 percent increase in Medigap premiums over the three years, or an average of more than 20 percent annually over these years. In total these plans accounted for 4.5 percent of Medigap enrollment in 2007 and 2.7 percent in 2010. We restrict our analysis to policies that existed in both 2007 and 2010.
One way of examining factors associated with these large premium increases is to analyze whether particular policy characteristics are disproportionately
26

represented in the outlier group. Table 3 below compares a policy type’s share among all policies to its share among outliers. In general, the two distributions of policies are similar. One factor does stand out, however: while newer policies comprise 26 percent of the total sample, they comprise 53 percent of all outliers. Thus, newer Medigap policies that remained in the market during 2007‐2010 were more likely than older policies to be in the outlier group.
Table 3: Distribution of Medigap Policies with the Highest Increases in Premiums Between 2007 and 2010
Percent of all policies (row # policies/total # policies)
Percent of policies with the highest increases in premiums
(row# in top 10%/all top 10% policies) Newer policies 26% 53% Older policies 74% 47%
Individual policies 84% 90% Group policies 16% 10% Plan type A 7% 5% Plan type B 6% 3% Plan type C 13% 9% Plan type D 8% 12% Plan type E 3% 4% Plan type F 28% 34% Plan type G 9% 14% Plan type H 2% 1% Plan type I 3% 1% Plan type J 4% 8% Plan type K 1% 1% Plan type L 1% 2%
Other 2% 2% Pre‐standardized 13% 2%
Notes: “Older policies” refers to policies issued three or more years before the reporting year. “Newer policies” refers to policies issued fewer than three years before the reporting year. “Group” refers to Medigap policies purchased through a former employer or union. Plan type classification follows NAIC guidance, which means “the standard plans A‐N as required by Section 9E of the Model Regulation to Implement the NAIC Medicare Supplement Insurance Minimum Standards Model Act. This includes all plans identified as A‐N issued prior to a state’s revisions to its regulatory program and identified as a standard plan at the time of issue. Policies issued prior to the effective date of the state’s revisions to its Medicare supplement regulatory program pursuant to the Omnibus Budget Reconciliation Act (OBRA) of 1990, and no longer offered in a state, should be designated as ‘pre‐standardized.’ Policies not meeting either of these definitions should be designated as ‘other.’” Source: ASPE analysis of 2007‐2010 NAIC Medicare Supplement Insurance Experience Exhibit data
27
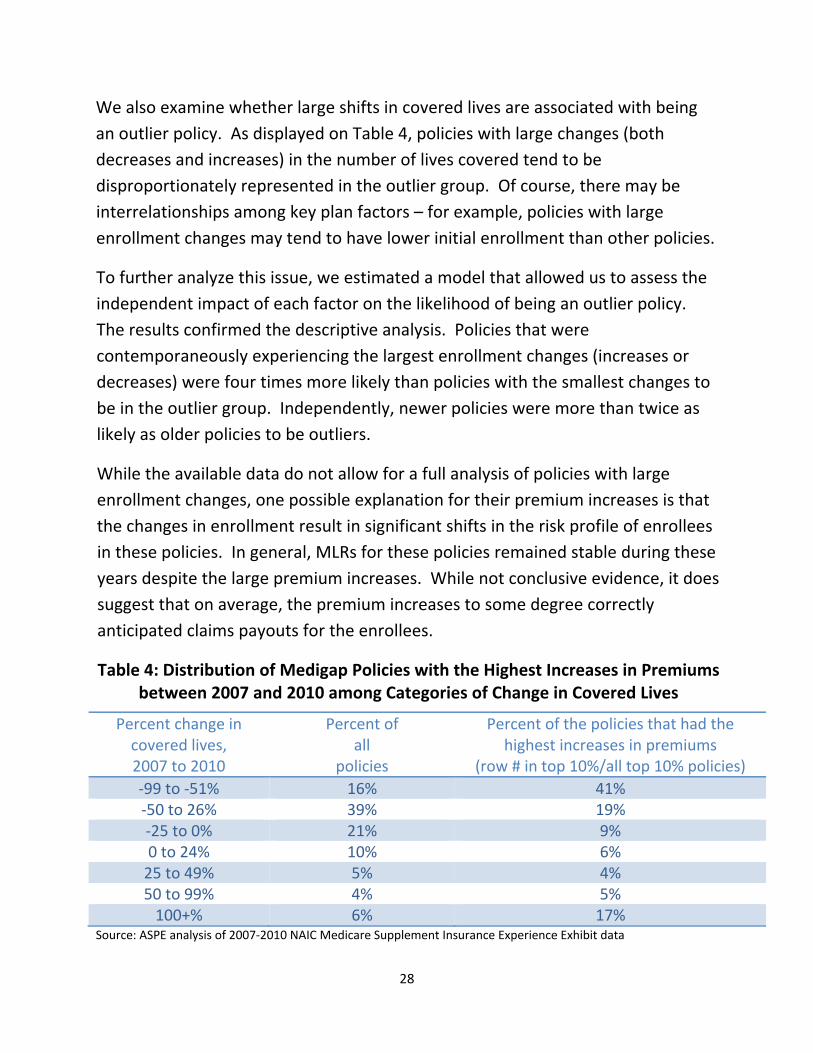
We also examine whether large shifts in covered lives are associated with being an outlier policy. As displayed on Table 4, policies with large changes (both decreases and increases) in the number of lives covered tend to be disproportionately represented in the outlier group. Of course, there may be interrelationships among key plan factors – for example, policies with large enrollment changes may tend to have lower initial enrollment than other policies.
To further analyze this issue, we estimated a model that allowed us to assess the independent impact of each factor on the likelihood of being an outlier policy. The results confirmed the descriptive analysis. Policies that were contemporaneously experiencing the largest enrollment changes (increases or decreases) were four times more likely than policies with the smallest changes to be in the outlier group. Independently, newer policies were more than twice as likely as older policies to be outliers.
While the available data do not allow for a full analysis of policies with large enrollment changes, one possible explanation for their premium increases is that the changes in enrollment result in significant shifts in the risk profile of enrollees in these policies. In general, MLRs for these policies remained stable during these years despite the large premium increases. While not conclusive evidence, it does suggest that on average, the premium increases to some degree correctly anticipated claims payouts for the enrollees.
Table 4: Distribution of Medigap Policies with the Highest Increases in Premiums between 2007 and 2010 among Categories of Change in Covered Lives
Percent change in covered lives, 2007 to 2010
Percent of all
policies
Percent of the policies that had the highest increases in premiums
(row # in top 10%/all top 10% policies) ‐99 to ‐51% 16% 41% ‐50 to 26% 39% 19% ‐25 to 0% 21% 9% 0 to 24% 10% 6% 25 to 49% 5% 4% 50 to 99% 4% 5% 100+% 6% 17%
Source: ASPE analysis of 2007‐2010 NAIC Medicare Supplement Insurance Experience Exhibit data
28

Conclusions and Implications
We find that Medigap premiums have risen moderately on average over the past decade and in particular since 2007. From 2001 to 2010 Medigap premiums increased at an average annual rate of 3.8 percent, while Medicare spending per beneficiary increased by 5.4 percent. In six of the past nine years, Medigap premium increases have been smaller than the average increases in Medicare spending per beneficiary.
The Medigap market has been contracting over the past decade, declining from approximately 26 percent of beneficiaries in 2001 to approximately 20 percent in 2010. The decline in the Medigap market is associated with the increasing attractiveness of MA plans. Following the expansion of MA that resulted in large part from the payment increases legislated in the 2003 Medicare Modernization Act, enrollment in MA has grown from 14 percent of beneficiaries in 2001 to 25 percent of beneficiaries in 2010.
There is large variation across states and across plan types in monthly Medigap premiums. This variation in monthly Medigap premiums across states largely reflects state variation in Medicare spending per capita. This variation may also reflect unmeasured differences in the risk profile of enrollees. Other factors that explain variation in premiums among plans include whether it is an old or new plan and whether premiums are rated based on attained age or age at issue.
Variation in premium increases, as opposed to premium levels, is explained by similar factors. As would be expected, the trend in Medicare spending per beneficiary by state is a significant predictor of Medigap premium changes. In addition, increased Medicare Advantage penetration is associated with smaller increases in monthly Medigap premiums. That is the availability of attractive MA options as a direct competitor to Medigap holds down premium increases.
Despite the moderate Medigap premium increases on average, some policies experienced increases that were significantly larger. These policies tended to be
29

newer policies and policies undergoing large changes in covered lives. Further research is needed to examine the underlying reasons for such changes.
One implication of these finding is that significant premium increases that cause concerns for both beneficiaries and policymakers are associated with a minority of Medigap policies. The Affordable Care Act authorized a rate review program for comprehensive health insurance that focuses on potentially unjustified premium increases. Under current law, this program does not include rate review for Medigap policies. Encouraging states to expand their programs to examine large increases in Medigap premiums may be an option to increase the value of policies to enrollees.
30

PART A Deductible $1,132 per benefit period Inpatient hospital
Days 1‐60 Days 61‐90 Days 91‐150 After 150 Days
No coinsurance $283per day $566 per day (for up to 60 lifetime reserve days) Not covered
Skilled nursing facility Days 1‐20 Days 21‐100 After 100 Days
No coinsurance $141.50 per day Not covered
Home Health No coinsurance; no limit on number of visits Hospice No coinsurance for hospice care; copayment of up to $5 for outpatient
drugs and 5% coinsurance for inpatient respite care Inpatient psychiatric hospital Up to 190 days in a lifetime
PART B Deductible $162 Premium
Most beneficiaries pay $96.40/month or $110.50/month (for new beneficiaries in 2010)*
Physician and other medical services MD accepts assignment MD does not accept assignment
20 % coinsurance 20% coinsurance, plus up to 15% above the Medicare‐approved fee
Outpatient hospital care 20% coinsurance Ambulatory surgical services 20% coinsurance Diagnostic tests, X‐rays, and lab services 20% coinsurance Durable medical equipment 20% coinsurance Physical, occupational, and speech therapy 20% coinsurance; certain limits may apply Clinical laboratory services No coinsurance Home health care No coinsurance; no limit on number of visits Outpatient mental health services 45% coinsurance (gradually decreasing to 20% in 2014) Preventive Visits
One‐time "Welcome to Medicare" visit Annual “Wellness” visits
$0 copay, Part B deductible does not apply $0 copay, Part B deductible does not apply
Preventive services** Abdominal aortic aneurysm screening Bone mass measurement Breast cancer screening/mammograms Cardiovascular screening tests Certain types of colorectal cancer screenings Diabetes screening tests Flu shots & Hepatitis B shots HIV screening tests Medical nutrition therapy services for certain individuals Pap tests and pelvic exams Pneumococcal shot Prostate cancer screening Smoking cessation counseling
Beginning in 2011, preventive services ranked “A” or “B” by the US Preventive Services Task Force are g enerally covered with no cost sharing (if the doctor accepts assignment), and the Part B deductible does not apply. Beneficiaries may have to pay 20% of the Medicare‐approved amount for the doctor’s visit for certain preventive services.
*Medicare Part B premiums vary with income and are higher for those with incomes above $85,000 (filing individually) /$170,000(filing jointly). For more information, see https://questions.medicare.gov/app/answers/detail/a_id/2306/~/2011‐part‐b‐premium‐amounts‐for‐persons‐with‐higher‐income‐levels *This table does not include all Medicare‐covered benefits or preventive services; for a complete listing, see http://www.medicare.gov/Coverage/Home.asp and http://www.medicare.gov/Health/Overview.asp. SOURCE: CMS, “Your Medicare Benefits, 2011” http://www.medicare.gov/Publications/Pubs/pdf/10116.pdf
Appendix A: Medicare Benefits for Parts A and B and Cost Sharing Requirements, 2011
31

State
Total # of Plans
Community Rated
Issue‐Age Rated
Attained‐Age Rated
Alabama 44 36% 16% 48% Alaska 48 15% 6% 79% Arizona 220 6% 93% 0% Arkansas 178 96% 4% 0% California 172 8% 18% 74% Colorado 216 4% 13% 84% Connecticut 41 100% 0% 0% Delaware 69 10% 14% 75% District of Columbia 27 26% 11% 63% Florida 42 5% 95% 0% Georgia 70 10% 90% 0% Hawaii 29 31% 21% 48% Idaho 98 0% 100% 0% Illinois 329 0% 17% 82% Indiana 245 4% 15% 81% Iowa 183 4% 6% 90% Kansas 183 5% 9% 86% Kentucky 298 6% 14% 80% Louisiana 260 3% 17% 80% Maine 51 100% 0% 0% Maryland 74 9% 7% 84% Massachusetts 6 100% 0% 0% Michigan 215 6% 12% 82% Minnesota 10 100% 0% 0% Mississippi 56 13% 9% 79% Missouri 118 10% 88% 2% Montana 105 7% 10% 83% Nebraska 130 5% 15% 79% Nevada 148 5% 7% 88% New Hampshire 49 14% 82% 4% New Jersey 66 15% 0% 85% New Mexico 196 4% 10% 86% New York 42 100% 0% 0% North Carolina 206 4% 9% 86% North Dakota 131 5% 15% 80% Ohio 189 4% 11% 85% Oklahoma 139 6% 11% 83% Oregon 194 5% 12% 83% Pennsylvania 219 5% 32% 63% Rhode Island 53 23% 15% 62% South Carolina 216 5% 13% 83% South Dakota 167 5% 7% 89% Tennessee 247 0% 18% 82% Texas 173 3% 0% 97% Utah 126 7% 3% 90% Vermont 50 100% 0% 0% Virginia 76 12% 9% 79% Washington 53 100% 0% 0% West Virginia 34 26% 9% 65% Wisconsin 90 2% 9% 89% Wyoming 49 18% 31% 51% US TOTAL 6430 12% 19% 69%
Appendix B: Distribution of Medigap Plans by State and Rating Characteristics, 2010
SOURCE: ASPE analysis of the 2010 Medigap Planfinder database, Centers for Medicare & Medicaid Services
32

Appendix C: Methodology Data for this study was provided by the National Association of Insurance Commissioners (NAIC). The data are based on reporting by insurers to state departments of insurance, and exclude data for companies that are regulated by the California Department of Managed Health Care (DMHC).
For regression analysis of the predictors of Medigap monthly premiums in 2008, we specify a model in which the premium in 2008 is regressed on state‐level Medicare spending per beneficiary in 2008, percent of the Medigap market at the state level accounted for by the top two Medigap insurers in 2008, state‐level percentage of beneficiaries with Medicare Advantage in 2008, variables to reflect state rating requirements, an individual market vs. group policy variaible, Medigap plan type variables, and the number of covered lives in 2008.
For regression analysis of the predictors of the annual increase in Medigap monthly premiums we included all plans that had data for each of the four years, 2007 ‐2010. We used a fixed effects method to analyze within plan premium increases over that time period. We specify a model in which current year’s monthly premium is regressed on the previous year’s premium, the previous year’s medical loss ratio, the state‐level percent change in Medicare Advantage enrollment in the previous year, the state‐level percent of Medicare beneficiaries with Medicare Advantage in the previous year, number of covered lives in the previous year, state rating requirement variables, an individual market vs. group policy variable, Medigap plan type variables, and year variables.
We used a logisitic regression model to examine predictors of plans having very large premium increases over the 2007‐2010 time period (being “outlier” plans). The model estimated the likelihood of being an outlier is predicted by the number of covered lives, the state‐level Medicare spending per beneficiary, the State‐level percent of Medicare beneficiaries with Medicare Advantage in the previous year, change in medical loss ratio, state rating requirement variables, an individual vs. group policy variable, Medigap plan type variables, a newer vs. older policy variable and variables reflecting the annual change in enrollment.
33
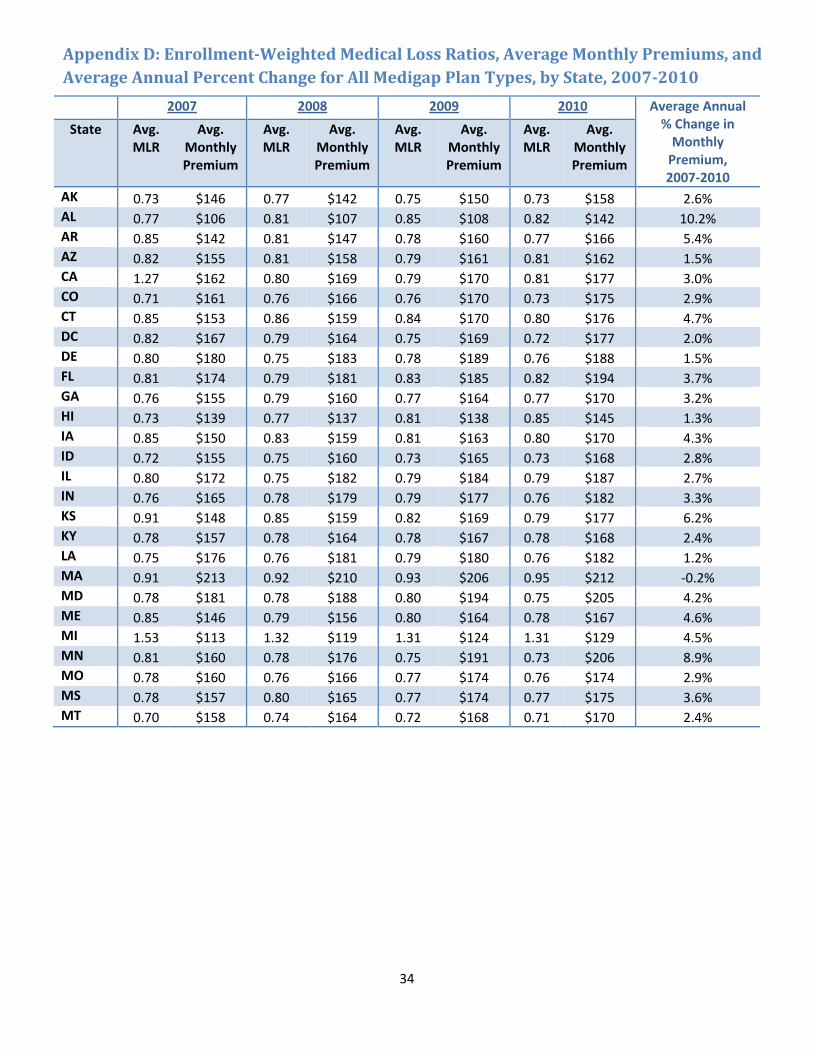
2007 2008 2009 2010 Average Annual % Change in Monthly Premium, 2007‐2010
State Avg. MLR
Avg. Monthly Premium
Avg. MLR
Avg. Monthly Premium
Avg. MLR
Avg. Monthly Premium
Avg. MLR
Avg. Monthly Premium
AK 0.73 $146 0.77 $142 0.75 $150 0.73 $158 2.6% AL 0.77 $106 0.81 $107 0.85 $108 0.82 $142 10.2% AR 0.85 $142 0.81 $147 0.78 $160 0.77 $166 5.4% AZ 0.82 $155 0.81 $158 0.79 $161 0.81 $162 1.5% CA 1.27 $162 0.80 $169 0.79 $170 0.81 $177 3.0% CO 0.71 $161 0.76 $166 0.76 $170 0.73 $175 2.9% CT 0.85 $153 0.86 $159 0.84 $170 0.80 $176 4.7% DC 0.82 $167 0.79 $164 0.75 $169 0.72 $177 2.0% DE 0.80 $180 0.75 $183 0.78 $189 0.76 $188 1.5% FL 0.81 $174 0.79 $181 0.83 $185 0.82 $194 3.7% GA 0.76 $155 0.79 $160 0.77 $164 0.77 $170 3.2% HI 0.73 $139 0.77 $137 0.81 $138 0.85 $145 1.3% IA 0.85 $150 0.83 $159 0.81 $163 0.80 $170 4.3% ID 0.72 $155 0.75 $160 0.73 $165 0.73 $168 2.8% IL 0.80 $172 0.75 $182 0.79 $184 0.79 $187 2.7% IN 0.76 $165 0.78 $179 0.79 $177 0.76 $182 3.3% KS 0.91 $148 0.85 $159 0.82 $169 0.79 $177 6.2% KY 0.78 $157 0.78 $164 0.78 $167 0.78 $168 2.4% LA 0.75 $176 0.76 $181 0.79 $180 0.76 $182 1.2% MA 0.91 $213 0.92 $210 0.93 $206 0.95 $212 ‐0.2% MD 0.78 $181 0.78 $188 0.80 $194 0.75 $205 4.2% ME 0.85 $146 0.79 $156 0.80 $164 0.78 $167 4.6% MI 1.53 $113 1.32 $119 1.31 $124 1.31 $129 4.5% MN 0.81 $160 0.78 $176 0.75 $191 0.73 $206 8.9% MO 0.78 $160 0.76 $166 0.77 $174 0.76 $174 2.9% MS 0.78 $157 0.80 $165 0.77 $174 0.77 $175 3.6% MT 0.70 $158 0.74 $164 0.72 $168 0.71 $170 2.4%
Appendix D: EnrollmentWeighted Medical Loss Ratios, Average Monthly Premiums, and Average Annual Percent Change for All Medigap Plan Types, by State, 20072010
34
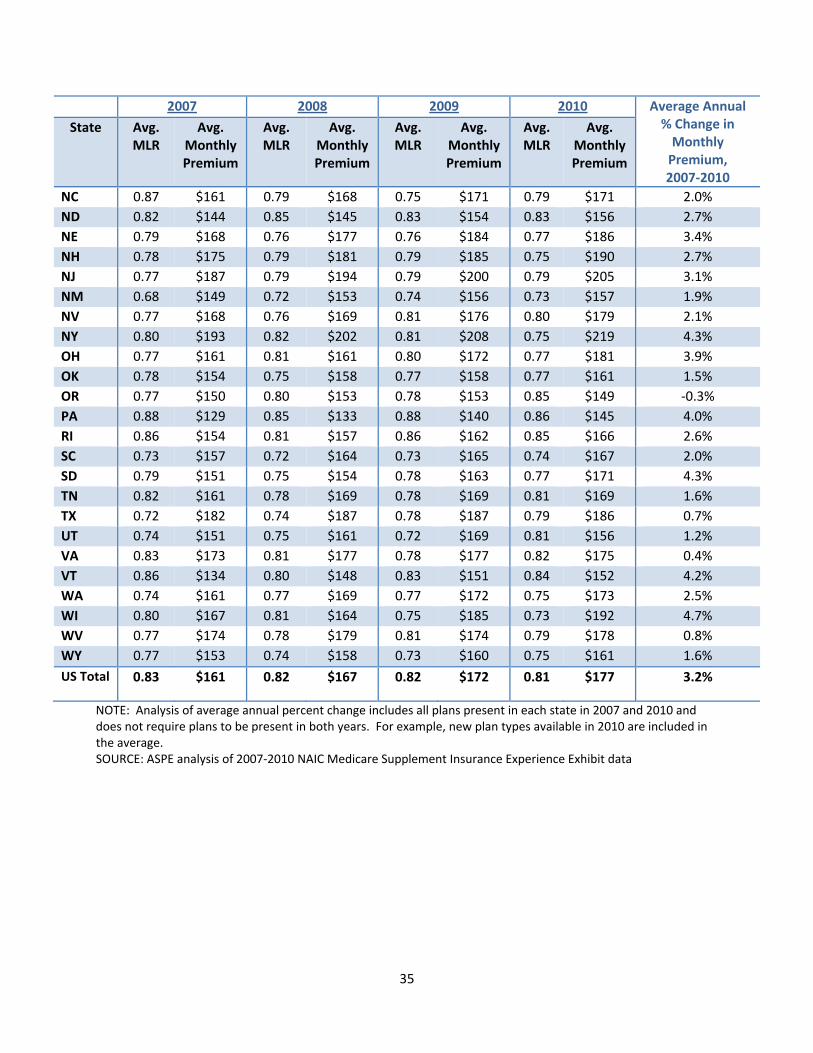
35
2007 2008 2009 2010 Average Annual % Change in Monthly Premium, 2007‐2010
State Avg. MLR
Avg. Monthly Premium
Avg. MLR
Avg. Monthly Premium
Avg. MLR
Avg. Monthly Premium
Avg. MLR
Avg. Monthly Premium
NC 0.87 $161 0.79 $168 0.75 $171 0.79 $171 2.0% ND 0.82 $144 0.85 $145 0.83 $154 0.83 $156 2.7% NE 0.79 $168 0.76 $177 0.76 $184 0.77 $186 3.4% NH 0.78 $175 0.79 $181 0.79 $185 0.75 $190 2.7% NJ 0.77 $187 0.79 $194 0.79 $200 0.79 $205 3.1% NM 0.68 $149 0.72 $153 0.74 $156 0.73 $157 1.9% NV 0.77 $168 0.76 $169 0.81 $176 0.80 $179 2.1% NY 0.80 $193 0.82 $202 0.81 $208 0.75 $219 4.3% OH 0.77 $161 0.81 $161 0.80 $172 0.77 $181 3.9% OK 0.78 $154 0.75 $158 0.77 $158 0.77 $161 1.5% OR 0.77 $150 0.80 $153 0.78 $153 0.85 $149 ‐0.3% PA 0.88 $129 0.85 $133 0.88 $140 0.86 $145 4.0% RI 0.86 $154 0.81 $157 0.86 $162 0.85 $166 2.6% SC 0.73 $157 0.72 $164 0.73 $165 0.74 $167 2.0% SD 0.79 $151 0.75 $154 0.78 $163 0.77 $171 4.3% TN 0.82 $161 0.78 $169 0.78 $169 0.81 $169 1.6% TX 0.72 $182 0.74 $187 0.78 $187 0.79 $186 0.7% UT 0.74 $151 0.75 $161 0.72 $169 0.81 $156 1.2% VA 0.83 $173 0.81 $177 0.78 $177 0.82 $175 0.4% VT 0.86 $134 0.80 $148 0.83 $151 0.84 $152 4.2% WA 0.74 $161 0.77 $169 0.77 $172 0.75 $173 2.5% WI 0.80 $167 0.81 $164 0.75 $185 0.73 $192 4.7% WV 0.77 $174 0.78 $179 0.81 $174 0.79 $178 0.8% WY 0.77 $153 0.74 $158 0.73 $160 0.75 $161 1.6% US Total 0.83 $161 0.82 $167 0.82 $172 0.81 $177 3.2%
NOTE: Analysis of average annual percent change includes all plans present in each state in 2007 and 2010 and does not require plans to be present in both years. For example, new plan types available in 2010 are included in the average. SOURCE: ASPE analysis of 2007‐2010 NAIC Medicare Supplement Insurance Experience Exhibit data

Appendix E: Average EnrollmentWeighted Monthly Premium for Plans C, F, and Other Medigap Plans, 2007 and 2010
2007 2010 Average Annual % Change, 2007‐2010
Medigap Policyholders
Share of Enrollment Enrollment‐Weighted Monthly Premiums Medigap
Policyholders
Share of Enrollment Enrollment‐Weighted Monthly Premiums Total
Enrollment
Enrollment‐Weighted Monthly Premiums
State Plan F Plan C Other Plan F Plan C Other Plan F Plan C Other Plan F Plan C Other Plan F Plan C Other
AK 6,411 46.1% 9.9% 44.0% $131 $140 $156 7,796 53.9% 7.9% 38.1% $148 $166 $164 6.7% 4.1% 5.8% 1.7%
AL 226,606 6.5% 16.9% 76.6% $154 $37 $117 161,724 12.4% 3.9% 83.7% $154 $179 $137 ‐10.6% 0.1% 69.7% 5.6%
AR 154,069 19.6% 2.7% 77.8% $142 $176 $139 152,824 20.3% 1.9% 77.8% $158 $206 $167 ‐0.3% 3.5% 5.4% 6.1%
AZ 127,848 57.8% 12.2% 30.0% $149 $158 $163 161,708 67.5% 8.5% 24.0% $155 $187 $169 8.1% 1.5% 5.9% 1.2%
CA 281,959 40.6% 9.6% 49.8% $152 $162 $170 323,567 45.0% 6.7% 48.3% $169 $195 $181 4.7% 3.7% 6.4% 2.0%
CO 91,434 59.9% 6.8% 33.3% $155 $164 $170 103,507 64.3% 4.8% 30.9% $170 $194 $182 4.2% 3.2% 5.6% 2.3%
CT 179,884 31.6% 13.2% 55.2% $165 $176 $140 153,523 31.8% 11.5% 56.7% $182 $214 $163 ‐5.1% 3.3% 6.7% 5.1%
DC 5,955 37.3% 11.6% 51.1% $152 $165 $173 6,697 41.8% 9.5% 48.7% $170 $220 $171 4.0% 3.8% 10.0% ‐0.5%
DE 27,353 19.4% 9.8% 70.8% $152 $170 $190 31,993 27.2% 7.9% 64.9% $167 $191 $196 5.4% 3.1% 3.9% 1.2%
FL 629,062 21.3% 20.8% 57.9% $188 $190 $163 641,212 25.8% 16.7% 57.5% $195 $209 $190 0.6% 1.2% 3.2% 5.2%
GA 224,784 48.1% 15.2% 36.7% $147 $164 $161 238,078 55.5% 11.8% 32.7% $166 $188 $171 1.9% 4.0% 4.7% 2.1%
HI 3,570 32.4% 19.7% 47.9% $126 $167 $131 3,925 45.5% 14.4% 40.0% $131 $174 $147 3.2% 1.5% 1.3% 3.8%
IA 249,285 72.8% 2.8% 24.4% $146 $182 $157 252,236 76.0% 1.9% 22.1% $169 $212 $171 0.4% 5.0% 5.1% 2.9%
ID 54,581 73.4% 6.9% 19.6% $159 $159 $137 53,895 72.7% 5.1% 22.3% $172 $187 $150 ‐0.4% 2.6% 5.5% 3.1%
IL 578,753 64.1% 6.2% 29.7% $164 $173 $189 606,853 68.8% 5.2% 26.0% $183 $199 $193 1.6% 3.6% 4.8% 0.7%
IN 288,901 52.6% 9.8% 37.6% $151 $176 $181 290,549 58.4% 7.6% 34.0% $176 $212 $184 0.2% 5.3% 6.4% 0.7%
KS 188,294 73.8% 9.7% 16.5% $138 $164 $180 195,318 74.8% 10.9% 14.3% $172 $195 $192 1.2% 7.6% 5.9% 2.2%
KY 169,602 36.0% 23.5% 40.5% $148 $152 $167 167,360 46.0% 19.1% 34.9% $159 $176 $174 ‐0.4% 2.5% 5.0% 1.3%
LA 118,738 63.6% 8.2% 28.2% $169 $184 $187 114,895 71.6% 4.6% 23.7% $178 $229 $178 ‐1.1% 1.8% 7.5% ‐1.6%
MA 207,361 0.5% 0.3% 99.2% $166 $159 $214 210,493 0.5% 0.7% 98.7% $194 $147 $212 0.5% 5.5% ‐2.5% ‐0.2%
MD 154,588 36.9% 21.2% 42.0% $180 $203 $172 163,207 46.4% 17.6% 36.0% $193 $248 $199 1.8% 2.3% 6.9% 4.8%
ME 83,177 34.1% 32.1% 33.8% $130 $159 $147 73,979 42.8% 26.5% 30.7% $150 $182 $176 ‐3.8% 4.9% 4.5% 6.2%
MI 302,889 11.9% 55.3% 32.9% $159 $98 $120 355,105 21.5% 52.1% 26.4% $155 $117 $130 5.4% ‐0.9% 5.8% 2.6%
MN 222,270 0.2% 0.1% 99.6% $127 $126 $160 165,529 0.6% 0.2% 99.2% $140 $157 $207 ‐9.4% 3.3% 7.6% 8.9%
MO 270,385 55.1% 10.9% 34.0% $154 $180 $163 265,465 58.8% 7.9% 33.3% $173 $207 $169 ‐0.6% 4.0% 4.8% 1.3%
MS 115,990 51.7% 6.2% 42.0% $147 $179 $166 121,790 70.9% 4.9% 24.3% $174 $208 $168 1.6% 5.8% 5.2% 0.3%
MT 52,261 58.1% 17.9% 24.0% $155 $149 $174 50,525 60.3% 15.1% 24.5% $167 $174 $173 ‐1.1% 2.5% 5.3% ‐0.1%
37
2007 2010 Average Annual % Change, 2007‐2010
Medigap Policyholders
Share of Enrollment Enrollment‐Weighted Monthly Premiums Medigap
Policyholders
Share of Enrollment Enrollment‐Weighted Monthly Premiums Total
Enrollment
Enrollment‐Weighted Monthly Premiums
State Plan F Plan C Other Plan F Plan C Other Plan F Plan C Other Plan F Plan C Other Plan F Plan C Other
NC 336,923 51.0% 9.0% 40.0% $159 $187 $156 361,770 60.1% 6.6% 33.3% $150 $210 $200 2.4% ‐2.0% 4.1% 8.6%
ND 56,060 91.1% 2.9% 6.0% $143 $156 $149 53,949 91.3% 2.4% 6.3% $154 $177 $157 ‐1.3% 2.6% 4.3% 1.6%
NE 128,615 69.2% 6.1% 24.8% $162 $175 $181 123,872 67.5% 4.6% 28.0% $185 $211 $182 ‐1.2% 4.5% 6.5% 0.2%
NH 64,695 36.4% 10.7% 52.9% $160 $187 $183 65,301 35.6% 8.0% 56.4% $177 $219 $194 0.3% 3.4% 5.3% 1.9%
NJ 324,099 18.7% 34.7% 46.5% $199 $190 $179 341,170 20.0% 30.9% 49.0% $206 $222 $194 1.7% 1.2% 5.3% 2.7%
NM 37,362 52.4% 9.3% 38.3% $146 $145 $150 39,223 56.5% 7.3% 36.2% $158 $161 $151 1.6% 2.6% 3.5% 0.2%
NV 39,863 51.8% 7.9% 40.3% $159 $177 $176 46,008 59.1% 5.6% 35.3% $171 $200 $186 4.9% 2.6% 4.2% 1.9%
NY 387,558 31.6% 16.6% 51.7% $199 $186 $192 355,590 40.2% 14.8% 45.0% $220 $216 $219 ‐2.8% 3.5% 5.1% 4.5%
OH 343,181 27.0% 34.3% 38.7% $136 $154 $183 344,420 33.4% 27.8% 38.8% $166 $198 $180 0.1% 6.8% 8.7% ‐0.5%
OK 131,507 61.2% 6.3% 32.5% $152 $166 $152 142,653 68.0% 4.4% 27.6% $155 $191 $167 2.7% 0.5% 4.7% 3.2%
OR 86,147 61.5% 9.0% 29.5% $145 $154 $155 97,892 69.3% 6.2% 24.5% $143 $181 $153 4.4% ‐0.5% 5.5% ‐0.5%
PA 642,290 3.6% 41.2% 55.3% $153 $125 $131 614,937 9.0% 45.5% 45.5% $128 $141 $156 ‐1.4% ‐5.9% 4.2% 5.8%
RI 32,404 9.1% 24.3% 66.6% $145 $136 $161 34,034 14.3% 76.4% 9.3% $153 $168 $170 1.6% 1.9% 7.2% 1.8%
SC 158,643 50.8% 7.2% 42.0% $156 $174 $155 169,628 54.3% 5.3% 40.4% $166 $190 $163 2.3% 2.1% 3.0% 1.7%
SD 64,690 83.2% 2.2% 14.6% $145 $159 $182 66,620 85.2% 1.5% 13.3% $169 $188 $181 1.0% 5.3% 5.9% ‐0.2%
TN 159,139 40.1% 16.2% 43.7% $151 $169 $167 165,462 50.6% 11.7% 37.7% $160 $208 $166 1.3% 2.0% 7.1% ‐0.1%
TX 525,939 53.3% 9.8% 36.9% $179 $192 $182 563,936 55.9% 6.8% 37.3% $180 $216 $188 2.4% 0.2% 4.1% 1.1%
UT 51,194 44.1% 13.9% 42.0% $146 $159 $153 27,545 46.3% 10.8% 42.9% $148 $172 $159 ‐18.7% 0.4% 2.8% 1.3%
VA 256,526 44.3% 8.7% 47.0% $149 $161 $198 263,392 56.0% 6.1% 37.9% $149 $199 $210 0.9% 0.1% 7.4% 2.0%
VT 35,843 0.8% 39.7% 59.6% $128 $143 $129 37,993 2.6% 35.4% 62.0% $79 $171 $144 2.0% ‐14.7% 6.2% 3.7%
WA 208,076 50.7% 12.9% 36.4% $158 $160 $167 198,764 51.7% 9.8% 38.4% $167 $176 $181 ‐1.5% 1.9% 3.2% 2.8%
WI 248,528 0.2% 0.2% 99.6% $133 $144 $167 233,220 0.3% 0.2% 99.6% $177 $182 $192 ‐2.1% 9.9% 8.1% 4.7%
WV 65,068 45.8% 16.0% 38.2% $151 $161 $206 63,530 55.2% 12.4% 32.4% $154 $193 $209 ‐0.8% 0.7% 6.2% 0.5%
WY 26,945 62.4% 11.1% 26.5% $148 $147 $158 29,632 68.8% 8.5% 22.7% $155 $170 $164 3.2% 1.5% 4.9% 1.2%
TOTAL 9,427,305 37.8% 16.0% 46.2% $159 $154 $165 9,514,294 43.7% 14.1% 42.2% $171 $178 $182 0.3% 2.5% 5.1% 3.3%NOTE: This analysis excludes plans with reported negative premium revenue. The average annual percent change calculations include change in average monthly premiums for all Medigap plans available in a state in each year and does not require plans to be present in a state in both 2007 and 2010. SOURCE: ASPE analysis of 2007‐2010 NAIC Medicare Supplement Insurance Experience Exhibit data