Embed Size (px)
Citation preview

Variance & mean deviationFrequency Distribution
Golden RatioDot Plots
How do you calculate the variance and mean
deviation for a data set?
Unit 4
M2 Unit 4: Day 4

Variance Variance can be found by squaring the
standard deviation. If you have a sample of data:
If you have data for a population:
2variance = S2variance = s

Variance Example 1A sample of test scores is as follows:
67, 95, 74, 86, 80, 70
Find the variance.
10.5388xS »
2variance = S 210.5388= 111.066»

Variance Example 2A sample of driving speeds is as follows:
55, 62, 59, 68, 75, 70
Find the variance.2variance = S
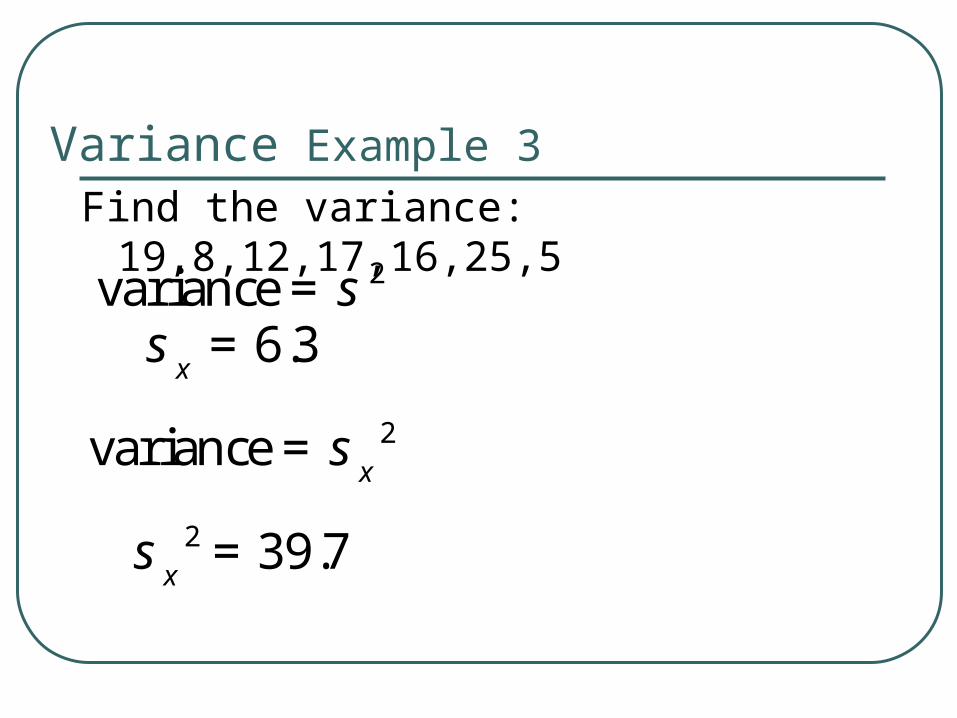
Variance Example 3Find the variance: 19,8,12,17,16,25,5 2variance = s6.3xs =
2 39.7xs =
2variance = xs

Variance Example 4Find the variance: 38,42,40,37,28,39,40 2variance = s

Using Variance to find Standard Deviation
If you know the variance
then you can find the s.d.
by taking the square root.
2 2 or Ss
or Ss

Example 1If the Variance = 125. Find the standard deviation.
125SD= 11.1803SD»
variance 125=

Example 2If the Variance = 52. Find the standard deviation.
7.2111SD»
variance 52=
52SD=

Mean Deviation
The Mean Deviation (MD) is the mean of the distances between each value and the mean.
It gives us an idea of how spread out from
the center the set of values is.
1n
ii x xMD n=
-=
åACTUAL VALUE - MEAN NOT IN CALCULATOR;ON FORMULA SHEET

Watch me as I work one…
The ECHS soccer team played 3 games last weekend. The number of points scored in each game was 11, 8, 8. Find the mean deviation.
• First, find the mean,
• Then, find the difference of each data value and the mean
• Last, find the sum of the numbers you just found and divide by the number of terms in the data set.
x
11 9 2
8 9 1
8 9 1
- =
- =
- =
2 1 1 4 1.33 3+ += = MD = 1.3
9x =

Let’s try one together…
1. The ECHS baseball team played 4 games last week. The number of points scored in each game was 8, 12, 10, 7. Find the mean deviation.
• First, find the mean,
• Then, find the difference of each data value and the mean
• Last, find the sum of the numbers you just found and divide by the number of terms in the data set.
x8 9.25 1.25
12 9.25 2.75
10 9.25 .75
7 9.25 2.25
- =
- =
- =
- =
1.25 2.75 .75 2.25 71.75
4 4
+ + += = MD = 1.75
9.25x =

You try…
2. A student took 5 exams in a class and had scores of 92, 75, 95, 90, and 98. Find the mean deviation for her test scores.
We can conclude that on average, this student’s scores deviated by 6 points from the mean.
90x =51 5ii x xMD =
-=
å 2 15 5 0 85+ + + +=
305= 6=
You try…
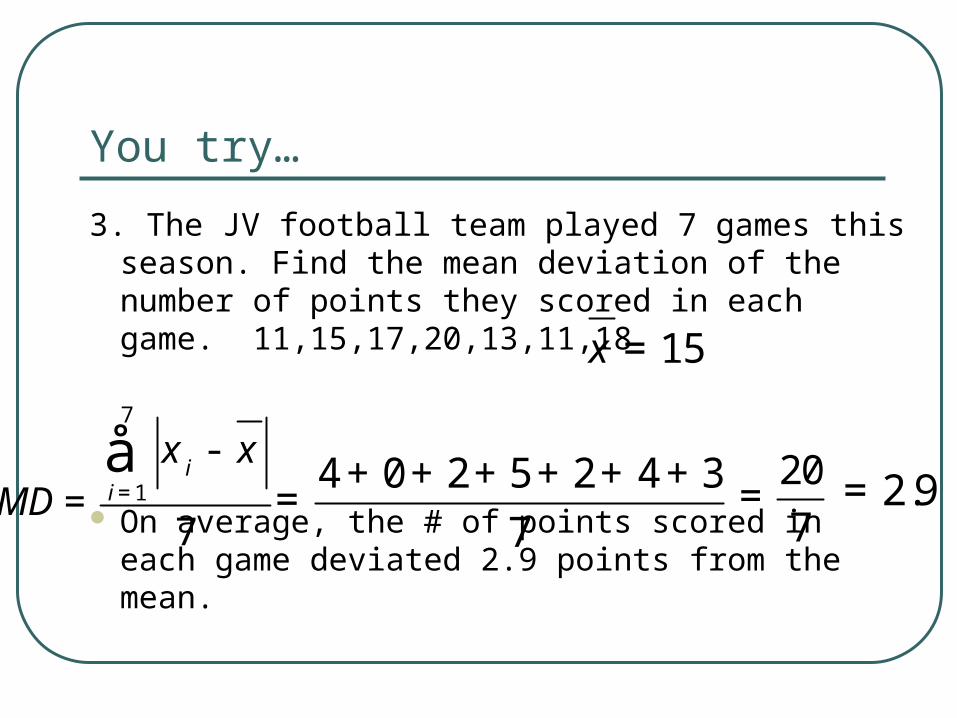
3. The JV football team played 7 games this season. Find the mean deviation of the number of points they scored in each game. 11,15,17,20,13,11,18
On average, the # of points scored in each game deviated 2.9 points from the mean.
71 7ii x xMD =
-=
å 4 0 2 5 2 4 37+ + + + + +=
207= 2.9=
15x =

Frequency Distribution A frequency distribution lists the value with
its associated frequency. EX 1: The following is the number of hours students
study per night: 1,1,1,1,2,2,2,3,3,3,4,4,5 Create a frequency distribution.

Create a frequency distribution
2. Use the following data:8, 7, 5, 8, 5, 7, 6, 5, 5, 8, 6, 7, 8
Mark Tally Count5678
IIIIIIIIIIIII
4234

Use the frequency table below to find the mean and standard deviation
Mark Tally Count3591013
IIIIIIIIIIIII
33421
7.15x=3.16s =
Dot Plot
A dot plot is a type of graphic display used to compare frequency counts within categories or groups.
As you might guess, a dot plot is made up of dots plotted on a graph. Here is how to interpret a dot plot.

#1 - find the mean, standard deviation and mode for the given data
mean:_______
standard deviation:_________
Mode: _______
10.68
4.49
x0 2 4 6 8 10 12 14 16 18 20 22
Collection 1 Dot Plot
10

#2 – find the mean, standard deviation and mode for the given data , then create a frequency table
mean:_______
standard deviation:_________
Mode: ________Co
un
t
1
2
3
4
5
6
data38 40 42 44 46 48 50 52 54 56
Collection 1 Histogram43.81
4.05
39, 40

Golden Ratio The golden ratio is
Artists and architects deem this ratio as being the most aesthetically pleasing and have used it as a basis for their art and buildings for years.
Famous examples: Mona Lisa, Sacrament of the Last Supper, and the Parthenon in Athens.
1.6181 5 03398872r+
= »
(phi) is pronounced "fee" or "fi"r

Handout Review sheet STUDY FOR TEST Tuesday