Embed Size (px)
Citation preview

Variable-Rate N Fertilization of Wheat and
Corn in the Mid-Atlantic
Variable-Rate N Fertilization of Wheat and
Corn in the Mid-Atlantic
Wade Thomason, VTSteve Phillips, IPNIPaul Davis, VCE retiredMark Alley, VTMark Reiter, VT
Wade Thomason, VTSteve Phillips, IPNIPaul Davis, VCE retiredMark Alley, VTMark Reiter, VT

• Match Timing of Fertilization with Crop Demand But… if it’s been a wet early summer…
… if it’s been a dry early summer…• More Knowledge of Crop N Need
– 1 lb N/bu of expected yield
INCREASING N FERTILIZER EFFICIENCYINCREASING N FERTILIZER EFFICIENCY

TEMPORAL VARIABILITYTEMPORAL VARIABILITY
1990
1992
1994
1996
1998
2000
2002
2004
2006
2008
0
20
40
60
80
100
120
140
160S
tate
wid
e A
ve
rag
e G
rain
Y
ield
, b
u/a
c

TEMPORAL VARIABILITYTEMPORAL VARIABILITY

60 acre field in Caroline County
Wheat yields: 44 to 80 bu/acre
Corn yields: 85 to 178 bu/acre
Bojac 2AWickham 3A
Wickham 4ABojac 1A
SPATIAL VARIABILITYSPATIAL VARIABILITY

ADDRESSING THIS VARIABILITYADDRESSING THIS VARIABILITY• Temporal
– Shoot from the hip– PSNT– Tissue tests– Chlorophyll meter– Precision Ag Technologies
• Spatial– Soil map– Yield/History map

Why?


RED light absorbed = Green light reflected

Normalized Difference Vegetative Index
NDVI => Calculated from Red and NIR Reflectance

Sensor Function
Lightgeneration
Light signal
Lightdetection
Valve settings
? Calculate NDVI? Lookup valve setting? Apply valve setting? Send data to UI
“Sensor”
Valves and
Nozzles

Measures spectral reflectance in a 3/8” x 24” area
Samples at a frequency of 60 times/sec
Average reflectance measurements calculated every second
OPTICAL SENSORSOPTICAL SENSORS

The vigor of the leaves and the ratio of plant to soil affect NDVI values
The vigor of the leaves and the ratio of plant to soil affect NDVI values
What the Sensor “Sees”What the Sensor “Sees”

Note that the biomass of each plant is observable in NDVI value
0
0.1
0.2
0.3
0.4
0.5
0.6
0.7
0.8
0.9
NDVI

~60 sites across Virginia since 2000
Irrigated and non-irrigated Conventional and no till Various rotations, hybrids,
varieties, and soil types
BACKGROUNDBACKGROUND
Wide range of preplant, starter, and in-season N rates (including VR)
Collected spectral measurements and an assortment of plant physical and chemical characteristics at various growth stages
Determine grain yield

VIRGINIA APPROACHVIRGINIA APPROACH
Generated calibration model for Mid-Atlantic wheat
0
1
2
3
4
5
6
7
8
0 0.002 0.004 0.006 0.008
Gra
in Y
ield
, Mg
ha-1
YPI
Painter, VA, 2000
Painter, VA, 2001
Suffolk, VA, 2001
New Kent, VA, 2001
Culpeper, VA, 2001
Stuarts Draft, VA, 2001
Port Royal, VA, 2000
New Kent, VA, 2000
Warsaw, VA, 2000
Charles City, 2002
Painter, VA, 2002
Suffolk, VA, 2002
Painter, VA, 2003
New Kent, VA, 2003
Oklahoma
y = 0.74076 + .1021e 577.66x Oklahoma, Lukina et al., 2001Virginia, 2000-2003, y = 0.512 + .104e 579.45x

VIRGINIA APPROACHVIRGINIA APPROACH
Generated calibration models for wheat and corn grown in the Mid-Atlantic
Developed N fertilization algorithms for both crops

In-season N management
1st topdress based on estimated tiller #
2nd topdress based on Tissue N concentration
30 to 40 lb N/ac preplant

Zadoks stage, in parenthesis
In-season N timing
Days From Planting
1st topdress based on estimated tiller #
2nd topdress based on NDVI and DFP

Wheat N Rate Algorithm
Rate (kg/ha) vs. NDVI
0.0000
20.0000
40.0000
60.0000
80.0000
100.0000
120.0000
140.0000
0.00 0.20 0.40 0.60 0.80 1.00
N Rate, kg/ha
Constrained NRate, kg/ha

What’s Needed
• Reference Strips– Difference between:
• High N reference (best possible with more than adequate N)
• Low N reference (0 N applied)
And• Area currently in sensor’s view.

VIRGINIA APPROACH - WheatVIRGINIA APPROACH - WheatTARGET NDVI
LOW REFERENCE HIGH REFERENCE GS 25 N DAP MAX YIELD MAX N NUE N RATE
0.60 0.50 0.80 50 150 85 80 50 80lbs/N dap bushels max constraint% lb/ac
87.1361 N fertilizer required23.5681 N required for additional grain46.0133 Bushel/A expected yield increase due to fertilizer
coefficients Define these units SI units ?ka 0.74076kb 577.66kc 1000kd
NUE 50%CONVERSION 0.0149
0.220.230.240.250.260.270.28
Rate (LB/ac) vs. NDVI
0.0000
20.0000
40.0000
60.0000
80.0000
100.0000
120.0000
140.0000
0.00 0.20 0.40 0.60 0.80 1.00
N Rate
Constrained

VIRGINIA APPROACH - CornVIRGINIA APPROACH - CornNDVI Low_Ref Hi_Ref N_preplant DFP MAX YIELD MAX N N RATE
0.82 0.50 0.90 60 63 175 100 85lbs/N dap bushels max constraintgal/acre
kg/ha85.27
coefficients Define these units SI units ?ka 56.479kb 67.626kc 56kd
NUE 60%Pn 0.0125
0.220.230.240.250.260.270.28
Rate (gal/ac) vs. NDVI
0.0
20.0
40.0
60.0
80.0
100.0
120.0
140.0
0.00 0.20 0.40 0.60 0.80 1.00
N Rate
Constrained

Entering Required InformationEntering Required Information

VIRGINIA APPROACHVIRGINIA APPROACH
Generated calibration models for wheat and corn grown in the Mid-Atlantic
Developed N fertilization algorithms for both crops
Validated these rate equations for performance

EXPERIMENTAL PROCEDURES
EXPERIMENTAL PROCEDURES
Spra Coupe 220 w/ 60 ft boom and GreenSeeker RT200 Raven 440 flow rate controller
Diverse locs; RCBD; 3-8 reps
Plot size: 60 by 250 to 500 ft
In-season N:4-5 Fixed Rates1 Standard Rate1 Variable Rate
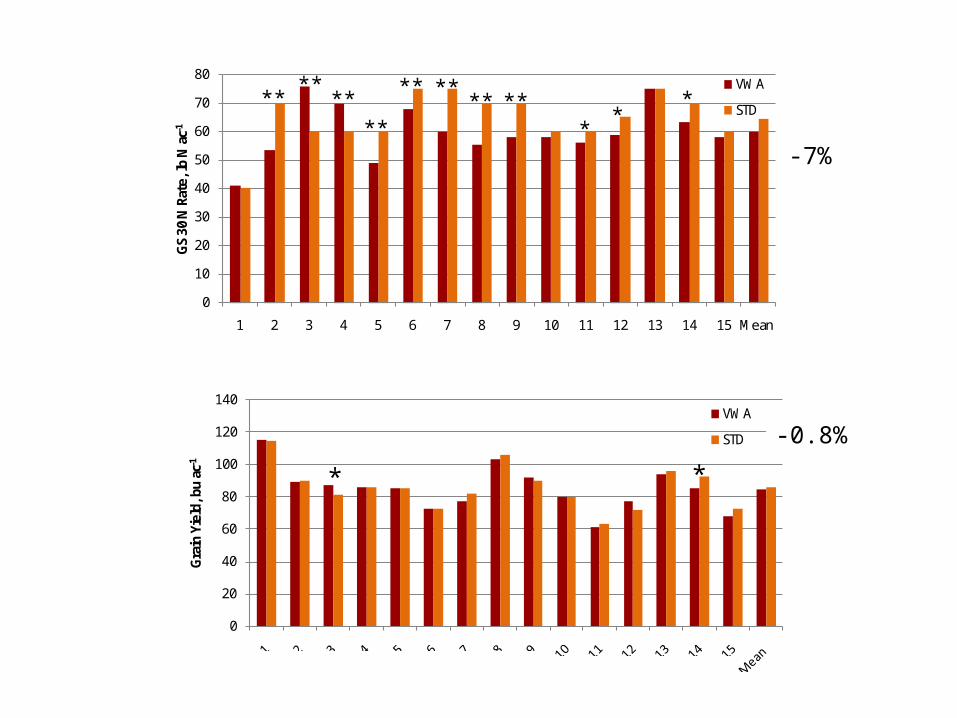
Grain Yield

0 – 75 N kg/ha: (numerical rates): Predetermined Nitrogen rates applied in lb/acres
Average: Single N rate determine using Greenseeker® (VA algorithm)
Variable: Variable Nitrogen rate determined using Greenseeker® Virginia Algorithm
Standard: Nitrogen rate determined based on GS 30 tissue test ( Standard Virginia recommendation system )
Greenseeker ® : Variable N rates determined using default Greenseeker ® wheat algorithm
0
10
20
30
40
50
60
70
80
1 2 3 4 5 6 7 8 9 10 11 12 13 14 15 Mean
GS
30 N
Rat
e, lb
N a
c-1
VWA
STD
0
20
40
60
80
100
120
140
Gra
in Y
ield
, bu
ac-1
VWA
STD
****
****
** **** **
**
*
-7%
* *
-0.8%

Comparison with Economically Optimum N Rate
-100
-80
-60
-40
-20
0
20
40
60
VWA -EONR
STD-EONR
** ** **

The Rx rate prediction map and real time map demonstrate the small trend in values – SW to NW values almost normal distributed: in the real time map those values ranged from 17 to 20 in the prediction map (interpolation) the recommended rate in that area still normal but decrease to 10 – 12 gal/acres

Corn Algorithm Performance
0
20
40
60
80
100
120
1 2 3 4 5 6 7 8 9 10 11
N R
ate,
lb
/ac
STDGS
162
120
176
95
151134
155
126
173184
151161
119
184
92
157
132150
136
163
191
148
0
50
100
150
200
250
1 2 3 4 5 6 7 8 9 10 11
Yie
ld,
bu
/ac
STDGS

0
20
40
60
80
100
120
140
160
STD
GS
Corn Algorithm Performance
Grain Yield, bu/ac Sidedress N, lb/ac
NS
21 % (21 lb/ac) less N with GS

Ridge and Valley Sites
2008 20090
50
100
150
200
250223
159
232
169
Farmer Practice
GreenSeeker
Gra
in Y
ield
, b
u a
c-1

InjectedManure
Surface-appliedManure
47
60
63
75
78
70
70
72
61 lb N/ac
72 lb N/ac

Challenges
• Timing– Size of the corn

RX vs. Applied Rates
0
5
10
15
20
25
30
1 201 401 601 801 1001 1201 1401 1601
gal/a
cre
Prescribed
As Applied

Challenges
• N rich strips– Timing– Same Field– Same Hybrid/Variety– Mark it!
• N “poor” strips
NDVI Low_Ref Hi_Ref
0.65 0.60 0.79

Challenges
• Herbicide Applications

Challenges
• Skepticism• How to tell if the system
was “right”• Risk• Cost
– EQIP cost share– Tax credits

Questions?


![Leaching of amylose from wheat and corn starch · Q-^^ AllEOfi31Sfl3E]](https://img.dokumen.tips/doc/110x75/5e83b0df0da5934e304d5a7c/leaching-of-amylose-from-wheat-and-corn-starch-q-alleofi31sfl3e.jpg)

