Embed Size (px)
Citation preview
Variability of European Black Poplar (Populus nigra L.) in the Danube Basin / 1

2 / Variability of European Black Poplar (Populus nigra L.) in the Danube Basin Variability of European Black Poplar (Populus nigra L.) in the Danube Basin / 1
Variability of European Black Poplar (Populus nigra L.) in the Danube Basin
Novi Sad 2014
Branislav Šiler PhD, Marijana Skorić PhD, Danijela Mišić PhD, Branislav Kovačević PhD, Mihailo Jelić PhD, Aleksandra Patenković, Zorana Kurbalija Novičić PhD

2 / Variability of European Black Poplar (Populus nigra L.) in the Danube Basin Variability of European Black Poplar (Populus nigra L.) in the Danube Basin / 3
1. General considerations of the European black poplar biology, significance and conservation prospects 08 Branislav Šiler, Marijana Skorić, Danijela Mišić
1.1. Taxonomic position of the genus Populus and the European black poplar (Populus nigra L.) 091.2. Distribution, ecology and life history of the European black poplar 111.3. Reproductive biology of the European black poplar 14
1.3.1. Hybridization between cultivated poplars and their wild relatives: evidence and consequences for native poplar populations 17
1.4. Scientific and economic considerations of Populus spp. with special attention on P. nigra 231.5. Conservation of the European black poplar in the Danube floodplains 281.6. DANUBEPARKS viewpoints on the Danube floodplain forests 35
2. Variability of leaf morphometric characters in Populus nigra populations in the Danube Basin 52Branislav Kovačević
2.1. Morphological characters as a tool to assess the variability within the genus Populus 532.2. Assessment of the variability of the European black poplar’s leaf morphometric
characters in the Danube Basin 552.2.1. Leaf sampling 552.2.2. Examined leaf characters 562.2.3. Descriptive statistics 562.2.4. Analysis of variance and coefficient of correlation 572.2.5. Principal component analysis (PCA) 582.2.6. Discrimination analysis 592.2.7. Cluster analysis 61
2.3. Variability and discriminative power of leaf morphometric characters 622.3.1. Descriptive statistics and analysis of variance 622.3.2. Principal component analysis 672.3.3. Discrimination analysis 69
2.4. Relationship between the populations of Populus nigra 732.4.1. Implications of alternative standardization of data by standard deviation
within population 772.5. Concluding remarks 81
3. Genetic variability of Populus nigra L. in the Danube Basin 86Mihailo Jelić, Aleksandra Patenković, Zorana Kurbalija Novičić
3.1. Genetic variability in natural populations 873.1.1. Factors that shape genetic variability in natural populations 883.1.2. Genetic adaptation to changing environment 903.1.3. Genetic variability and molecular markers 91
3.2. Overview of Populus nigra L. genetic variability in Europe 933.3. Assessment of microsatellite variability of the European black poplar
in the Danube Basin 963.3.1. Pattern and amount of genetic variation 983.3.2. Population differentiation (F statistics) 1033.3.3. Population bottleneck 1063.3.4. Metapopulation structure 1083.3.5. Testing selective neutrality 1103.3.6. Genetic distances between populations 112
3.4. Implications for conservation and restoration of the European black poplar i n the Danube Basin 113
CONTENTSPublisher:Public Enterprise “Vojvodinašume”
Compiled and edited by:Zoran Tomović, PhDIvana Vasić, MSc
Techical Editors:Zoran Tomović, PhDIvana Vasić, MScRadmila Šakić Peurača, MSc
Reviewers:Anders Kjaersgaard, PhD – Aarhus University, Department of Bioscience, DenmarkCino Pertoldi, PhD - The Faculty of Engineering and Science, Department of Biotechnology, Chemistry and Environmental Engineering, Section of Biology and Environmental Science, Aalborg, DenmarkMiroslava Mitrović, PhD – Department of Ecology Institute for Biological Research “Siniša Stanković”, University of Belgrade, Belgrade, Serbia
Proofreading:Aleksandra Kukolj
Design:AvantGuarde Design
Photo:Cover photo: Zoran Tomović, PhD
Print:AvantGuarde Design
Circulation:1.500

4 / Variability of European Black Poplar (Populus nigra L.) in the Danube Basin Variability of European Black Poplar (Populus nigra L.) in the Danube Basin / 5
Due to habitat loss in last few decades the Black Poplar (Populus nigra) become an endangered tree species. It serves as indicator species for sustainable floodplain forest management.
DANUBEPARKS STEP 2.0 project (“Anchoring the Danube River Network of Protected Areas as Platform for Preservation of Danube Natural Heritage”) aims to promote Black Poplar as flagship species. Implementation of conservation activities, within the project, for this species will contribute to improve forest habitat management practice but at the same time stressing the role of Danube Protected Areas for its preservation.
Public Enterprise “Vojvodinašume” within the mentioned project took very ambitious tasks to lead the activity entitled as “Black Poplar conservation”. Having the most experience in this tree species PE “Vojvodinašume” additionally played an important role in bringing together protected areas with forestry agencies along the Danube. PE “Vojvodinasume” become an important bridge builder between various sectors and a key for the implementation of the “DANUBEPARKS Guidelines for Ecological Forestry in Danube Riparian Woodland” adopted as draft version in first DANUBEPARKS project.
As a leading partner for Black Poplar conservation, numerous results have been foreseen: Danube wide Black poplar cadastre which will give the insight in online database showing the distribution of the stands and individuals of Black Poplar in twelve project protected areas; Implementation of the concrete pilot conservation actions, including labeling of the most valuable and characteristic old single trees, promoting their protection together with forest companies, including them in public awareness campaigns etc; Danube wide genetic map e.g. genetic analysis of the Black poplar variability along the Danube; Promotion of the cultivation and propagation of these identified local genotypes in nurseries; International Danubeparks Conference on floodplain forest management; Implementation a pilot Black poplar reforestation.
This monograph presents the results of a survey of the European Black poplar (Populus nigra L.) genetic diversity status in the Danube and partly Sava region. Diversity surveys were conducted by analysis of molecular markers and morphological parameters. The main reason for conducting the survey of the existing Black poplar diversity was a need to have an overview diversity situation of this highly endangered species in very reduced natural populations.
With a special satisfaction we present this monograph which is result of extensive work of numerous scientists from Institute for biological research “Siniša Stanković” and Institute for lowland forestry and environmental protection. Monograph readers can have comprehensive insight in the analysis of the genetic and morphological variability of Black poplar populations in 12 protected areas in 8 countries. The results of the study will form the basis for the definition of long-term strategies for protection and conservation of the significant part of the gene pool of European Black poplar.
Also we want to thank to all monograph contributors: Nikolai Stoanov, Yancho Naidenov, Tsonka Hristova, Milko Belberov (on behalf of Directorate of Nature Park “Rusenski Lom”), Dr. Barbara Stammel, Daniel Neumaier, Eva Habichler, Jonas Liegl, Hubert Krenzler, Thomas Schneider (on behalf of administrative district Neuburg-Schrobenhausen and City of Ingolstadt), Darko Krsmanović, Levente Čapo, Robert Šafthauzen, Predrag Stanković, Rade Čortan, Đuro Ratković, (on behalf of Forest Estate “Sombor”), Valerija Hima, Dražen Ivaštinović, Dejan Sablić, Denis Stojsavljević, Ivan Grubišić (on behalf of Nature park „Lonjsko Polje“),dr. Sándor Bordács, dr. István Bach, Ferenc Várhídi, Péter Proksza, Attila Szokolai (on behalf of NP Duna Ipoly), Dr. Yancho Stoyanov Naydenov, Nikolay Yanchev Stoyanov, Hristofor Ivanov Georgiev, Stanimira Valentinova Shuleva, Svetoslava Zarkova Stoyanova (on behalf of Persina Nature Park), Sándor Kövesi, Attila Mórocz, Imre Dombi, Attila Kovács, Zoltán Hüber (on behalf of NP Duna-Drava), Pavol Surovec, Tomáš Kušík, Matúš Kúdela, Martina Maczalová, Lucia Senková (on behalf of BROZ), Dragomir Pfeifer, Zoran Šarac, Darko Cvijić, Vlatko Rožac, Davor Mikulić (on behalf of JUPP Kopački Rit), Karoline Zsak, Ronald Hillerbrand, Marina Gvozdenovic (on behalf of NP Doanu Auen), Dr. Borovics Attila, Benke Attila, Takács Roland, Toldi Valter and Tölgyesi Árpádné (on behalf of NP Ferto Hansag).
Monograph which is in front of you present solid ground for cooperation between two sectors: forestry and nature conservation and in the same time presents valuable literature for upcoming scientific researches. We are convinced that monograph will contribute to the education of the upcoming generations which will no matter on the professional education dedicate own work for the common goal – conservation and sustainable use of forests.
FOREWORD

6 / Variability of European Black Poplar (Populus nigra L.) in the Danube Basin Variability of European Black Poplar (Populus nigra L.) in the Danube Basin / 7
“According to Greek mythology, the poplars emerged
from the Heliades, the sisters of Phaeton, the son of
the sun god Helios. As he was not able to rein in the
horses after they bolted with their father’s sun coach,
he was hit with a punishing lightning bolt by Zeus.
Out of grief over their dead brother the Heliades
turned into black poplars.”
Häne, K. (2007): The black poplar (Populus nigra)
www.forestknowledge.netThe Heliades, by Virgil Solis, 1581

8 / Variability of European Black Poplar (Populus nigra L.) in the Danube Basin Variability of European Black Poplar (Populus nigra L.) in the Danube Basin / 9
The European black poplar (Populus nigra L.) is a native European tree species, which forms floodplain forests along riversides in riparian ecosystems. This pioneer species plays a central role in the initial phase of the development of riparian forests contributing to the natural control of flooding and water quality, and serving as a natural corridor that facilitates gene flow for many riparian species. It sustains viability, stability and specificity of ecosystems along river flow. Once widespread, and now considered threatened, P. nigra deserves special attention in terms of conservation. Here we present an introduction into the biology of European black poplar and its significance for science and industry. Particular attention is dedicated to the conservation of this species along the Danube River, included in the activities of the DANUBEPARKS Network.
1.1. Taxonomic position of the genus Populus and the European black poplar (Populus nigra L.)
Poplars (genus Populus) and willows (genus Salix) have traditionally been considered the only two genera in the Salicaceae family (Eckenwalder, 1996). However, a number of genera formerly included in the Flacourtiaceae are now assigned to Salicaceae sensu lato, within the Malpighiales order of the “Eurosid I” clade (Chase et al., 2002; Angiosperm Phylogeny Group, 2003). The closest genera to Populus and Salix within the Salicaceae sensu lato are mostly woody tropical species, including the genera: Chosenia, Idesia, Itoa, Carrierea, Bennettiodendrion, and Poliothyrsis, all native to the Asian subcontinent (Cronk, 2005), which is apparently the center of diversity for the Salicaceae. Recent molecular phylogenetic studies in the Salicaceae (Leskinen and Alstrm-Rapaport, 1999; Cervera et al., 2005; Hamzeh et al., 2006) have shown that Populus and Salix clearly form two separate groups. Interestingly, in one of these studies presumably the most ancient species of Populus, P. mexicana showed higher similarity to Salix than to any other species of Populus (Cervera et al., 2005). It still remains an open question whether Populus and Salix are truly monophyletic.
According to the most commonly used classification (Eckenwalder, 1996), the genus Populus consists of 29 species divided into six sections based on relative morphological similarity and crossability (sect. Abaso Eckenwalder, sect. Turanga Bunge, sect. Leucoides Spach, sect. Aigeiros Duby, sect. Tacamahaca Spach, and sect. Populus Duby), but a number of phylogenetic inconsistencies remain. The difficulties in taxonomy arise because of the extensive phenotypic variation observed within broadly distributed Populus species, as well as the existence of many hybrids, which blur the lines between some species, and which themselves are sometimes misclassified as separate species (Eckenwalder, 1996). Extensive natural hybridization, both within and among sections, is believed to have played a major role in the evolution of extant species of Populus.
1. General considerations of the European black poplar biology, significance and conservation prospectsBranislav Šiler, Marijana Skorić, Danijela Mišić
Institute for Biological Research “Siniša Stanković”, University of Belgrade, Bulevar despota Stefana 142, 11060 Belgrade, Serbia

10 / Variability of European Black Poplar (Populus nigra L.) in the Danube Basin Variability of European Black Poplar (Populus nigra L.) in the Danube Basin / 11
There is also some ambiguity about the taxonomic position of the European black poplar (Populus nigra L). Analyses based on chloroplast DNA clearly group P. nigra within section Populus (Smith and Sytsma, 1990; Hamzeh and Dayanandan, 2004), yet analyses based on nuclear DNA and morphology clearly place P. nigra (2n=38 chromosomes) in the section Aigeiros (Eckenwalder, 1996; Hamzeh and Dayanandan, 2004; Cervera et al., 2005).
A wide range and a clear human responsibility in the diffusion of the species make the taxonomy of the species particularly complex: there are often different synonyms for the same variety and intermediate forms from spontaneous hybridization among varieties which are difficult to classify in an unequivocal way (Cagelli and Lefèvre, 1995). Based on morphological characteristics, Zsuffa (1974) proposed the following classification:
• P. nigra var. typica L. is the most widespread variety of P. nigra. The branches are irregularly distributed along the stem and wide spreading. Young leaves, petioles and twigs are glabrous.
• P. nigra var. italica Duroi is the oldest variety described. Although the name seems to indicate an Italian origin, its real origin is unknown. It probably derives from a spontaneous mutation of P. nigra, which occurred in the central Asia (Cagelli and Lefèvre, 1995). It was introduced in Italy in the 18th century and from the Po Valley it was spread all over the world (from which derives the English common name “Lombardy Poplar”). This variety is characterized by a fastigiate habit, closely ascending branches and dark and furrowed bark.
• P. nigra var. betulifolia (Pursh) Torr. described in France and Great Britain and P. nigra var. caudina Ten. (= P. nigra var. pubescens Parl.) described in Spain, North Africa, central and southern Italy, the Balkans and Iran, possess xeromorphic characteristics like pubescent twigs, petioles and young leaves.
• P. nigra var. thevestina Dode, originated in central Asia, was spread in southern Italy, North Africa, western Asia and in the Near East. It has a typically columnar habit and greyish smooth bark.
• P. nigra var. neapolitana Ten. described in North Africa, southern Italy, the Balkans, Syria and Iraq is characterized by a yellow furrowed bark, almost angular twigs and fairly large leaves. According to some authors (Allegri, 1956; Gellini, 1975), this variety is considered a hybrid (P. × euramericana (Dode) Guinier).
1.2. Distribution, ecology and life history of the European black poplar
P. nigra (Figure 1.1.) is a Eurasian native species, which probably evolved in fluvial corridors at least 58 million years ago (Eckenwalder, 1996). The spatial pattern of P. nigra fluctuated during the Quaternary in response to successive ice ages (Bennett et al., 1991). Cottrell et al. (2005) showed that during the last ice age, populations of P. nigra remained in southern Spain, southern Italy and the Balkans. The species recolonized the North and Central European fluvial corridors during the Holocene. Populus nigra is nowadays distributed within fluvial corridors in lowland, piedmont and mountainous zones of the
Figure 1.1. Populus nigra L. Habitus, Gornje Podunavlje (photo: Z. Tomović)

12 / Variability of European Black Poplar (Populus nigra L.) in the Danube Basin Variability of European Black Poplar (Populus nigra L.) in the Danube Basin / 13
northern hemisphere from North Africa and Ireland in the west, to Russia and China in the east (Zsuffa, 1974; Vanden Broeck, 2003) (Figure 1.2.). The European black poplar is characterized by a great diversity of population types, from isolated trees to pure or mixed stands. The abundance of European black poplar trees is decreasing due to the loss of its natural habitat as a result of urbanization, drainage of wetlands for agricultural use and canalization of rivers for flood prevention. Human mediated propagation of the species declined in the 19th century when the faster growing hybrid P. × euramericana was introduced to northern Europe. Genetic integrity of P. nigra is now recognized to be endangered and therefore the European black poplar has been listed as one of the important species in need of conservation in the Strasbourg resolution of 1990 for the protection of forest trees in Europe (Arbez and Lefèvre, 1997). The European black poplar is an important component of interspecific poplar breeding programmes and both conservationists and tree breeders are aware of how important it is to protect the species.
Figure 1.2. Geographic distribution range of P. nigra (published in Vanden Broeck, 2003)
Life history and ecology of the European black poplar is specifically and closely related to river patterns and processes (Lytle, 2001; Karrenberg et al., 2002), and is considered a pioneer species of riparian ecosystems growing in riparian mixed forests together with P. alba L., willows (Salix spp.), alders (Alnus spp.), maple (Acer spp.), elm (Ulmus spp.), ash (Fraxinus spp.) and, in more evolved forests, with oaks (Quercus spp.); in the colonization phases it follows the hygrophilous pioneer forests characterized by willows
(Figure 1.3.). The dynamics of the populations and the different phases of colonization are directly related to the dynamics of the rivers and have been extensively described by Herpka (1986). Riparian areas and wetlands are characterized by seasonal flooding and high water levels, with optimal establishment conditions occurring on fresh silt and sand, immediately following the recession of water from point bars and gravel bars. Populus nigra has evolved to take advantage of hydrogeomorphological flows within fluvial corridors through multiple adaptations related to these disturbances (Braatne et al., 1996). Its life cycle, from pollination, seed formation, dispersal and germination or vegetative propagation through mature growth, is well synchronized with the natural flow regime, notably the frequency and timing of periodic and repeated droughts and
floods (Hupp, 1992; Iwasa and Levin, 1995; Braatne et al., 1996; Mahoney and Rood, 1998; Lytle and Poff, 2004; Stella et al., 2006). The physiology, morphology and biomechanics of P. nigra are adapted to resist hydraulic forces and prolonged submersions (Figure 1.4.). The size, shape and biomechanical properties of its root and aerial structures are well adapted to cope with hydraulic constraints (Karrenberg et al., 2003; Lytle and Poff, 2004). It is a fast-growing and opportunistic species with a good tolerance to high water levels, sediment burial and high temperatures in summer, especially on bare alluvial bars (Chamaillard, 2011). The European black poplar is shade and drought-intolerant, and seed establishment typically depends on major disturbances, such as fire, floods, or ice scours (Romme et al., 1997; Rood et al., 2007). Individual trees may live over 400 years (Popivshchy et al., 1997).
Figure 1.3. Riparian mixed forest (photo: Geißler / Donauauwald Neuburg-Ingolstadt)

14 / Variability of European Black Poplar (Populus nigra L.) in the Danube Basin Variability of European Black Poplar (Populus nigra L.) in the Danube Basin / 15
Figure 1.4. Flooded forest in Gemenc area (photo:Attila Mórocz / Duna-Dráva National Park)
Populus nigra has a high phenotypic plasticity encompassing flood-induced changes and allocation of biomass to different parts of the plant. Many studies detail the impacts of river management on Populus spp. which are common components of riparian woodlands (Reily and Johnson, 1982; Rood and Heinz-Milne, 1989; Mahoney and Rood, 1991; Busch and Smith, 1995). During the last 20 years, views on river management have changed and now the aim is to give rivers more space and to restore floodplain woodlands (Hughes et al., 2001). Remaining European black poplar stands may act as source populations for recolonization in the newly created riparian ecosystems. These new populations should contain sufficient genetic diversity to allow them to adapt to changing environmental conditions and for long-term survival of the populations (Booy et al., 2000).
1.3. Reproductive biology of the European black poplar
P. nigra is a dioecious plant (male and female flowers carried on separate plants) and an obligatory outcrosser. Both sexes flower in early spring prior to leaf initiation. Their flowers occur in pendent catkins with strongly reduced perianths (Figure 1.5.). P. nigra trees reach reproductive maturity within 10–15 years under favorable conditions in natural populations (Stanton and Villar, 1996). Individual trees flower for 1–2 weeks (Stanton and Villar, 1996), but the pollination period in a population can exceed one or even two months (Braatne et al., 1996). Pollen is dispersed by wind, and effective pollination distances can be extensive (Tabbener and Cottrell, 2003; Lexer et al.,
2005; Pospíšková and Šálková, 2006; Vanden Broeck et al., 2006; Slavov et al., 2009). Rathmacher et al. (2010) reported that both reproductively effective pollen and seed were predominantly dispersed over short distances. Fertilization occurs within 24 hours after a viable pollen grain has landed on a receptive stigma (Braatne et al., 1996). Mature capsules typically dehisce 4–6 weeks after fertilization, and release seeds embedded in significant quantities of pappus (i.e. long, white, silky hairs attached to the seed) (Figure 1.5.). The pappus of the seed could promote wind dispersal over great distances, which might result in high rates of migration and high gene flow and genetic diversity. Poplars are prolific seed producers. Typically, they produce large quantities of airborne seeds in the spring, which coincide with an immediate post-flood period when freshly deposited, moist, but well-drained sediments are available for colonization on the active channel edge (Rood and Heinz-Milne, 1989; Niiyama, 1990). Old trees can produce over 50 million of seeds in a single season.
The viability of small European black poplar seeds is known to be extremely short lived and seeds have very exacting germination requirements found only along river valleys, which are flooded in winter (Barsoum and Hughes, 1998). Seeds normally retain viability for only 1–2 weeks in natural systems, and germination occurs within 24 hours under warm, moist conditions.
Figure 1.5. Male (left) and female (right) catkins of P. nigra (photo: Branislav Šiler)
Successful regeneration of poplar species occurs in years when soil moisture remains high enough for roots to grow down at the same rate as the receding saturated water front, but not so high that anoxic conditions prevail (Bradley and Smith, 1986; Scott et al., 1997). It follows that in many years successful sexual regeneration does not occur, and that in naturally occurring stands of poplars on flood plains a strong age

16 / Variability of European Black Poplar (Populus nigra L.) in the Danube Basin Variability of European Black Poplar (Populus nigra L.) in the Danube Basin / 17
structure frequently exists, reflecting the history of flooding. Stands of even-aged trees can sometimes be correlated with particular years in the hydrological record and the age-structure of floodplain woodland may then indicate the flood magnitude and hydrograph shape favorable to successful regeneration. The European black poplar has been a prominent early successional species on European floodplains and its absence indicates reduced geomorphological activity following river control (Decamps, 1993; Pautou and Arens, 1994; Pautou and Girel, 1994; Van Splunder et al., 1995).
The European black poplar is also capable of vegetative propagation with root-borne sucker shoots (soboles) and it can regenerate from fragments after breakage as an alternative to sexual reproduction in highly dynamic hydrogeomorphic conditions (Barsoum et al., 2004; Francis et al., 2004). Vegetative propagation of European black poplar often occurs, and vegetative propagules (branches, roots, broken stems, etc.) are disseminated both by water and by human activities (Figure 1.6.). Evidence of spontaneous vegetative propagation is commonly found at a juvenile stage in this species: fallen trees, broken roots and branches transported by the rivers can root very easily when partly planted in the soil; root suckers are also found. However, the relative contribution of vegetative vs. sexual propagation to the adult stage remains undetermined. Asexual reproduction is promoted only by flood disturbances when through extended periods of submergence and/or mechanical damage to parent plants, dormant primordia in roots and shoots are stimulated to produce new shoots and roots.
There is also evidence of cladoptosis, in which short shoots abscise and can be carried long distances on watercourses and subsequently take root. Thus, poplar genotypes can persist on sites for long time periods beyond the longevity of single trees. Furthermore, vegetative propagation is one of the traits that enable P. nigra to occupy tumultuous habitats along river banks and to persist long term in landscapes that are frequently reset by large-scale fires. P. nigra shows higher levels of vegetative propagation than North American cottonwoods from section Aigeiros, sprouting extensively from branches, roots, and broken stems (Legionnet et al., 1997; Arens et al., 1998; Barsoum et al., 2004).
Generally, the ratio of vegetative to sexual regeneration in European black poplar is strongly influenced by hydrological and sedimentological conditions (Barsoum and Hughes, 1998). High genetic diversity of European black poplar populations might suggest that sexual reproduction could be more frequent than vegetative propagation, and that its impact on the genetic structure might be predominant. Genetic diversity enhanced by regeneration from seed favors adaptation in unpredictable environments. On the other hand, short distance pollen and seed dispersal can produce spatial genetic subdivision. As a result, genetic variability may be lost and a small effective pollination neighborhood area can create the opportunity for genetic drift. Similarly, predominant vegetative propagation can lead to the genetic diversity loss.
The sex ratios in natural P. nigra populations are highly variable. Although no consistent pattern has emerged, it has been suggested that biases in sex ratio may be driven by differential responses of the sexes to environmental conditions. There is evidence in some dioecious species that male and female individuals might differ in their response to environmental conditions and habitat requirements (Hughes et al., 2000). Therefore, estimation of genetic diversity in natural populations has to take into account developmental differences between the two genders (e.g. male trees may reach reproductive maturity before female trees, thus possibly skewing sex ratios; etc.) and the effects of clonality, which can greatly reduce genotypic sampling and therefore yield apparently skewed sex ratios due to sampling error.
1.3.1. Hybridization between cultivated poplars and their wild relatives: evidence and consequences for native poplar populations
In view of the fact that habitat reduction followed by introgressive hybridization can lead to the extinction of rare plant species, the European black poplar is believed to be one of the most threatened forest tree species of old, natural floodplain forests in the temperate zones (Lefèvre et al., 1998, 2001).
Reproductive isolating mechanisms are generally divided into two categories based on whether they act before or after fertilization. Mechanisms that act to prevent mating are referred to as prezygotic, whereas those that act to reduce the viability or fertility of the hybrid zygote or later generation hybrid offspring are referred to as postzygotic. Pre-fertilization incompatibility barriers in Populus sp. are known to be located primarily in the stylar tissues (Vanden Broeck et al., 2005), and special emphasis has been made on pollen tube-pistil interaction in P. nigra, revealing precise growth of pollen tube within the ovary, role of abscisic acid in flower pedicel abscission due to zygotic interspecific incompatibility and role of β-galactosidase activity associated with conspecific polen
Figure 1.6: Populus nigra, Gornje Podunavlje (photo: Radmila Šakić Peurača)
18 / Variability of European Black Poplar (Populus nigra L.) in the Danube Basin Variability of European Black Poplar (Populus nigra L.) in the Danube Basin / 19
tube growth. Common post-mating reproductive barriers include hybrid sterility, hybrid weakness or inviability, and hybrid breakdown in which first-generation (F1) hybrids are vigorous (hybrid superiority due to heterosis), robust and fertile, but later-generation hybrids are weak or inviable. Poplar hybrids are not uniformly unfit, but rather are genotypic classes that possess lower, equivalent or higher levels of fitness relative to their parental taxa. Extensive variability in viability and fertility is also observed within and between hybrid generations from the same interspecific cross. Therefore, extremely low fertility or viability of early-generation hybrids (e.g. F1, F2, BC1) does not necessarily prevent extensive gene flow. Species genomes are often differentially permeable to introgression, where certain portions of the genome are open to the incorporation of alien alleles, but introgression is restricted in other parts of the genome. If hybrid populations act as evolutionary filters, there are several important implications. First, species barriers are maintained in the face of hybridization. Second, a strong filter should prevent the introgression of deleterious genes while allowing introgression of beneficial ones. Finally, a filter help explain the existence and long-term persistence of hybrid zones.
Artificially produced hybrids involving P. nigra and several other poplar species including P. deltoides, P. trichocarpa, P. maximowiczii and P. laurifolia have been planted throughout Europe. Such crosses have been made with P. nigra acting as either male or female parent. According to the literature (Cagelli and Lefèvre, 1995) P. nigra takes part in natural crosses: P. nigra × laurifolia and P. nigra × P. deltoides, and artifical crosses: P. nigra × P. tremuloides; P. nigra × balsamifera; P. nigra × koreana; P. nigra × maximowiczii; P. nigra × P. simonii; P. nigra × P. suaveolens; P. nigra × P. trichocarpa. In addition, natural backcrossing of hybrids with the European black poplar is known to occur (Cottrell et al., 2005). Although gene exchange between species represents a major event for evolution, the problem, in this case, is the fact that the genetic “pollutants” (pure exotic species, their hybrids or P. nigra var. italica) possess a very narrow genetic base spread on a very wide scale. Additionally, there are concerns that massive introduction of genes of foreign species into the native P. nigra (i.e. introgression or introgressive hybridization) could lower the effective population size and reduce the overall fitness of seedlings of the native P. nigra (e.g. Cagelli and Lefèvre, 1995).
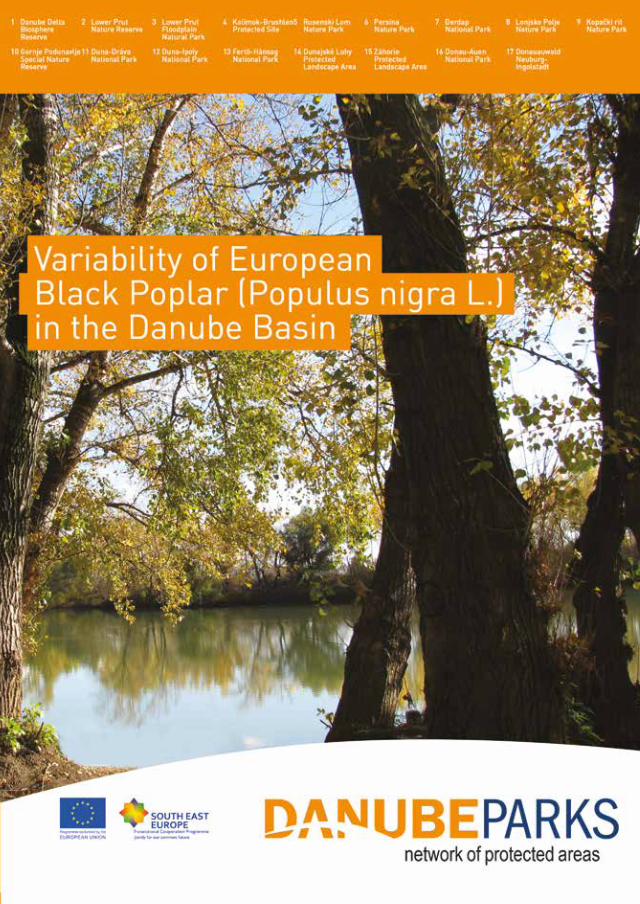
Native poplar stands were displaced by agriculture or by cultivated poplar plantations consisting of a narrow range of euramerican (P. × canadensis, i.e. P. × euramericana) and interamerican (P. interamericana = P. deltoides × P. trichocarpa) hybrids (Vanden Broeck et al., 2004). P. nigra has many desirable characteristics that determined its inclusion as parent in several improvement programs going on in Europe: wide adaptability to many environments and different kinds of soil, excellent rooting ability of stem cuttings, fair resistance to Marssonina brunnea (Ell. et Ev. ) P. Magn., high level of resistance to bacterial canker (Xanthomonas populi Ridé) and mistletoe (Viscum album L. ) (Avanzo et al., 1985; Pichot and Teissier du Cros, 1988; Sallé et al., 1991). P. × euramericana is the most common hybrid of P. nigra. It was the result of spontaneous hybridization that occurred in Europe in the 18th century, between the American P. deltoides (Figure 1.7.) and the European P. nigra. This hybrid combines some favorable characteristics of the American species (fast growth, good wood quality, resistance to relevant leaf diseases) with the above-mentioned favourable traits of the European species. Their success in commercial culture was tremendous, especially in Southern Europe. Figure 1.7. Populus deltoides (photo: PE Vojvodinašume, Serbia)

20 / Variability of European Black Poplar (Populus nigra L.) in the Danube Basin Variability of European Black Poplar (Populus nigra L.) in the Danube Basin / 21
The introduction of a small number of P. × euramericana clones and P. nigra varieties, which will likely intercross with wild P. nigra trees, is another concern for the genetic diversity of P. nigra germplasm (Cagelli and Lefèvre, 1995; Frison et al., 1995; Lefèvre et al., 1998), even though recent results suggest this may not be the major threat for the species (Tabbener and Cottrell, 2003). Low levels of introgression are expected in natural populations of the European black poplar where male trees grow in close proximity to female trees. However, caution should be exercised when isolated female poplar trees are surrounded by
interspecific hybrid males, which may be a source for introgression in the native populations (Vanden Broeck et al., 2004). The fact that hybridization in controlled conditions between P. deltoides and P. nigra is only possible when P. deltoides is the female parent (Zsuffa, 1974) is often discussed as a possible reason for the lack of introgression of genes of P. deltoides in open-pollinated progenies of P. nigra (Rajora, 1986; Benetka et al., 1999).
Not only introgression of genes from exotic species (mainly Populus deltoides and P. trichocarpa) via genetically narrow-based hybrid cultivars constitutes a potential threat, but also from ubiquitous as ornamental, non-hybrid P. nigra cultivars like the Lombardy poplar (P. nigra cv. ‘Italica’) (Figure 1.7.). This cultivar is represented by a large number of individuals with identical genotype which may, under certain circumstances, swamp the gene pool of native European black poplar, thereby reducing genetic diversity of the native poplars (Cagelli and Lefèvre, 1995).
The introduction of large numbers of some P. × canadensis clones (offspring of Populus deltoides × P. nigra crosses), and Populus nigra cv. ‘Italica’, which have the possibility to intercross with wild P. nigra trees, has raised concern about the genetic diversity and integrity of P. nigra in Europe (Frison et al., 1995; Heinze, 1997; Lefèvre et al., 1998, 2002; Arens et al., 1998; Vanden Broeck et al., 2006). The genes of foreign species have been introduced into the gene pool of P. nigra as there are no apparent crossing barriers between hybrids and native poplars. Heinze and Lickl (2002) doubted whether the genomes of P. deltoides and P. nigra were sufficiently congruent to allow F2 and BC in all directions, but some researchers found evidence for gene flow between cultivated hybrid poplars and native European black poplar. Populus × canadensis trees produce seeds sired by either P. × canadensis or P. nigra (Heinze and Lickl, 2002). P. nigra produces seeds sired by P. × canadensis if no P. nigra pollen is available (Vanden Broeck et al., 2004).Today, many native populations of P. nigra have been replaced or fragmented by the widespread cultivation of commercially exploited hybrid poplars. An alternative view is that the establishment of hybrid and mixed origin offspring on natural locations that used to be exclusively for P. nigra is something that started with human activity (planting of hybrid poplars by man) but that now occurs spontaneously (Smulders et al., 2008). Therefore, the presence of poplar artificial plantations poses a severe potential threat for the diversity and the regeneration of native indigenous poplars (Vanden Broeck et al., 2005). Furthermore, forest fragmentation by artificial hybrid poplars plantations leads to a breakup of pollen- and seed-mediated gene flow (Jump and Penuelas, 2006). Limitations of pollen and seed dispersal result in spatial aggregation of related individuals that is called ‘‘isolation by distance’’ (Hardy and Vekemans, 1999; Born et al., 2008).
To date, the knowledge about gene flow patterns in P. nigra is only fragmentary. On the other hand, knowledge about the genetic variation and the gene flow inside remaining populations provides key information for managing their population dynamics (Lowe et al., 2005). In this context, influences on spatial genetic patterns and genetic diversity of regenerating P. nigra populations can be discussed and implications for in situ conservation measures can be deduced.
A major problem in identifying hybrid offspring is the sensitivity of the methods used, especially if further-generation hybrids such as F2 or backcrosses have to be identified. Although the morphological plant descriptor for P. nigra (Van Slycken, 1996) was suitable Figure 1.8. Populus nigra cv. ‘Italica’ (photo: PE Vojvodinašume, Serbia)

22 / Variability of European Black Poplar (Populus nigra L.) in the Danube Basin Variability of European Black Poplar (Populus nigra L.) in the Danube Basin / 23
to distinguish mature P. nigra from hybrids in genebank collections (Storme et al., 2002; 2004), its resolution is limited for (repeated) backcrosses between the hybrid and either parent. Identification of young seedlings is even more difficult, as features such as catkin and fruit morphology, bark structure and canopy shape are not present yet, and some leaf characters are of no use for identifying young trees. A cuneate leaf base is typical for P. nigra (Figure 1.9.), but small leaves of seedlings and young trees of P. × canadensis also have a more cuneate base than leaves of vigorous longshoots on older trees. Glands near the top of the petiole are characteristic for P. deltoides and P. × canadensis, but these glands are mostly absent on leaves of young trees and seedlings. Environmental influences on the morphology and the phenotypic differences between juvenile and mature characters make it difficult to discriminate between genetically different individuals on the basis of morphological traits alone and may result in genetic duplications within a collection, leading to increased space requirement and maintenance time (van Hintum et al., 1996; van Treuren et al., 2001). In addition, a number of hybrids with characteristics similar to those of P. nigra may have remained undetected. The characterization of species and interspecific hybrids and studies of introgression was largely based in the past on morphological features (Ronald et al., 1973a; Eckenwalder, 1984a,b). Biochemical markers also permit the discrimination of species and hybrids (Bortitz, 1962; Ronald et al., 1973b; Ronald and Steel, 1974; Boccone, 1975; Baiocchi et al., 1990; Greenway et al., 1991a,b). Several molecular techniques have been used with poplars:
Figure 1.9. Leaves and a leaf-bud (lower right corner) of the European black poplar
ribosomal DNA (D’Ovidio et al., 1990, 1991; Faivre-Rampan et al., 1992a, b), mitochondria1 DNA (Barrett et al., 1993), chloroplast DNA (Smith and Sytsma, 1990), RFLP of genomic DNA (Keim et al., 1989). Since the late 1980s, isozyme and random amplified polymorphic DNA (RAPD) markers also have been successfully used for identification of clones and determination of the interrelationships among various species (Skorić et al., 2012a; Živković et al., 2012) including poplars (Rajora, 1989; Castiglione et al., 1993; Janssen, 1997). Ribosomal DNA polymorphisms have been suggested as suitable tools for detecting introgression of foreign germplasm into P. nigra (Faivre-Rampan et al., 1992a,b). AFLP markers are considered appropriate for hybrid detection because of the large number of loci sampled across the whole genome (Arens et al., 1998), where hybrids usually have an intermediate position between the two parents (van Raamsdonk et al., 2000), but the position may become more complicated once F2 and backcrosses occur. Microsatellites or simple sequence repeats (SSRs) are stretches of a variable number of tandem repeats with a core repeat of two to six base pairs (Hamada and Kakunaga, 1982; Tautz and Renz, 1984; Chambers and MacAvoy, 2000; Schlötterer, 2000) that can be amplified as single-locus, multi-allelic, and co-dominant markers using the unique flanking sequences obtained by sequencing genomic DNA (Smulders et al., 1997). Microsatellites are ideal markers for estimating the level of heterozygosity (Rogić et al., 2011; Stamenković-Radak et al., 2012; Kurbalija Novičić et al., 2013). They are excellent markers for clone and cultivar identification in poplars (Storme et al., 2004), and some loci contain species-specific alleles (Fossati et al., 2003). In addition, because they are robust when used across laboratories, they are the most appropriate markers for establishing databases of germplasm collections in several different countries (Bredemeijer et al., 2002; Röder et al., 2002).
Molecular genetics is a keystone to assess the genetic diversity of P. nigra populations, and a better knowledge of its genome is needed for an effective protection and use of the remaining genetic resources. It is not always possible to detect introgressed genes in the offspring of P. nigra on the basis of morphological traits alone (e.g. Heinze, 1997). Hence, Vanden Broeck et al. (2004) claim that at least a part of the genetic information from the seedlings from the gravel banks of the river Meuse originates from non-native poplar species. Molecular markers based on isozymes, the codominant nuclear Sequence Tagged Site (STS) marker win3 (Bradshaw et al., 1994) and nuclear microsatellite markers (SSR) (Fossati et al., 2003) provide powerful new tools which can be used to assess the extent of (introgressive) hybridization between introduced and wild relatives in open pollinated (OP) progenies of P. nigra. When used independently, these markers have the power to detect all F1 hybrids between P. nigra and P. deltoides, but can fail to detect further generations of hybrids and backcrosses.
1.4. Scientific and economic considerations of Populus spp. with special attention on P. nigra
Ease of vegetative propagation, rapid juvenile growth, high biomass yields, good coppice ability, and high plasticity in response to environmental changes, are the main characteristics that have promoted poplars as superior trees for silviculture. Due to their impressive growth rates, poplar species have become some of the most extensively cultivated trees in temperate latitudes around the world, and have been incorporated into managed systems including traditional, wide-spaced plantations, and short-

24 / Variability of European Black Poplar (Populus nigra L.) in the Danube Basin Variability of European Black Poplar (Populus nigra L.) in the Danube Basin / 25
rotation coppice systems. Their vigorous growth performance can be partly explained by high photosynthetic carbon uptake, efficient leaf area development, production of sylleptic branches, appropriate seasonal coordination of growth through phenological adaptations and regulation by phytohormones.
Poplars have long been valued by the agroforestry industry for their use as windbreaks and shelterbelts, as well as timber belts from which farmers get wood resources. Environmental management applications also regularly include poplar planting for erosion control near streams, rivers, and reservoirs, as well as for riparian buffer zones (Figure 1.10. and Table 1.1.). The light-weighted wood has been used for various commercial purposes or as a source of carbon neutral renewable energy. Poplars are a source of fuel energy and an agriculture feedstock for ruminant pellet manufacture. They have been identified as a key fiber crop because of its rapid growth, inherent lower age of maturity, perennial nature, and limited fertilizer requirements. Poplars are currently employed primarily as a feedstock for pulp and paper production – the inherently small diameter fibers with thin walls, which are ideal for producing high-density paper sheets with very good optical properties (Mansfield and Weineisen, 2007).
The whole section Aigeiros is low in lignin and high in carbohydrate, which makes them amenable to a variety of pulping regimes. The wood is well-suited for particle, flake, and strand-based composite boards because of its low density and ease of flaking, low cost, and availability. Poplars have also traditionally been used in the manufacture of specialty products such as chopsticks and pallets. In addition to its value for wood products, P. nigra provides a range of ecological services, including carbon sequestration,
bioremediation, nutrient cycling, biofiltration, etc. (Table 1.1.). P. nigra trees underpin vital ecosystems and provide unique habitats and symbiotic relationships. Increase in CO2 in the earth’s atmosphere causes temperature changes, directly and indirectly influencing atmospheric, terrestrial and aquatic, abiotic and biotic processes within a complex web of interactions, and is leading to major climatic changes. However, the European black poplar is likely to profit from a rising atmospheric CO2 concentration with a mean biomass stimulation of 33% (Liberloo et al., 2006). Leaf area is also stimulated under enriched CO2 through increased cell expansion and proliferation (Ferris et al., 2001). Such responses to rising atmospheric CO2 might have implications for forest management and the expected forest carbon sequestration. Furthermore poplars have been studied for cleaning up contaminated soils (bioremediation) and water with organic pollutants such as herbicides, and diesel fuel (Tesar et al., 2002; Komives et al., 2003). Investigations have been conducted, or are in progress, on the use of poplars for the extraction or immobilization (phytostabilization) of heavy metals present in contaminated soils, and for on-site remediation. Recent studies have compared the potentiality to tolerate and accumulate heavy metals in various poplar species, and most authors proved that P. nigra has a good potential for phytoremediation (Laureysens et al., 2004, 2005; Dos Santos Utmazian et al., 2007; Stobrawa and Lorenc-Plucinska, 2008; Zacchini et al., 2009; Gaudet et al., 2011; Kovačević et al., 2013; Jakovljević et al., 2014).
Poplars are also widely used model organisms for tree molecular biology and biotechnology. Since the emergence of Populus spp. as the model tree species, there has been a steady and rapid development of resources enabling the use of new technologies and approaches for answering biological questions. The poplar genomics resources have been, and will continue to be, instrumental in addressing biological questions pertinent to perennial growth habits (e.g., lignocellulosic cell wall biogenesis and dormancy cycles). A number of bioinformatics resources have become available for species from the genus Populus alongside greater integration of the species in centralized sequence data sources, such as Joint Genomes Initiative (JGI), NCBI Populus Genome Database, the extensive GRAMENE resource, and Populus Integrative Genome Browser (Sjödin et al., 2008). These developments are rapidly advancing the ability to use poplars as model systems for the study of developmental, ecological and comparative genomics questions. They also represent an ideal model system in which genetic and genomic studies can be conducted in an ecological key-stone species as well in a commercially important forest tree crop.
Poplar species and hybrids are intensively cultivated as sources of woody biomass for wood industry products (Figure 1.11.) and for reforestation of lowlands in temperate regions of the world (Confalonieri et al., 2003). However, the long generation time of trees, the presence of seasonal dormancy and the prolonged period required for evaluation of mature traits are strong limitations for classical breeding and selection. The development of methods for in vitro culture and genetic engineering has
increased the possibility of producing poplar genotypes improved in insect pest resistance, herbicide tolerance, growth rate and wood quality, or reduction in undesirable traits. Sophisticated in vitro methods can allow ex situ conservation of important genotypes. Many economically relevant traits can be improved by the careful choice of the parental lines and through the clonal selection of desired individuals. The biodiversity preservation in basal populations and the selection for clones with different genotypes Figure 1.10. Riparian buffer zone in Persina Nature Park (photo: Persina Nature Park Bulgaria)

26 / Variability of European Black Poplar (Populus nigra L.) in the Danube Basin Variability of European Black Poplar (Populus nigra L.) in the Danube Basin / 27
are fundamental priorities. In vitro conservation has been previously reported as an efficient alternative for the preservation of the genetic diversity of rare and endangered plants (Mišić et al., 2005; Mišić et al., 2006; Skorić et al., 2012b; Perić et al., 2012), including P. nigra (Naujoks and von Wühlish, 2004). A major task in genetic resource conservation in vitro is the maintenance of genetic stability of propagated genotypes. Another advantage of in vitro culture is the possibility to investigate intraspecific and interspecific hybridization (Confalonieri et al., 2003; Banjanac et al., 2014). In vitro culture of ovaries, ovules and/or embryos might improve the plant production efficiency from particular compatible crosses, and/or rescue aborting embryos. Transformation is a major tool for genetic research in poplars that is valuable for leveraging the genome sequence, and for linking physiology to gene function. Because of the power of transformation, it will remain a major genetic research tool for dissection of gene function in P. nigra for many years to come. It is the key biological attribute that makes poplars the most powerful model organisms for genetic analysis of woody plant growth, adaptation, and development (Busov et al., 2010).
More recently,an emphasis has been placed on the study of metabolomic data and particularly in linking metabolic changes to both development and ecosystem functioning (Street and Tsai, 2010). Apical tissues of poplars, such as young leaves and buds, are characterized by a rich diversity of phenolics. In these tissues, flavonoids are thought to function both as sunscreens and as defense compounds against herbivores and pathogens (Dixon et al., 2002; Tsai et al., 2006). Poplar buds (Figure 1.9.) are coated with a viscous substance, an exudate, which was reported to contain different varieties of phenolic compounds: terpenoids, flavonoid aglycons and their chalcones, and phenolic acids and their esters. Bud exudates of P. nigra contain caffeic, p-coumaric and isoferulic acids with their esters, chalcones, flavanones (eriodictyol, pinocembrin, and pinostrobin), flavones (chrysin, apigenin), flavonols (galangin, kaempherol, quercetin,
rutin, quercetin 3-methyl ether) as the major components (Egger and Tissut, 1968; Wollenweber and Egger, 1971; Bankova et al., 1988; Greenaway and Whatley, 1991a,b; Morreel et al., 2006; Dudonné et al., 2011; Rubiolo et al., 2013).
Features
Morphological and physiological characteristics
(e.g. vigorous growth, high biomass production, light-weighted wood)
Reproductive characteristics and genetic diversity
Biochemical and molecular characteristics
(e.g various secondary metabolites; EST, genome, and microarray sequence databases)
Benefits
• Windbreaks, shelterbelts and timber belts• River management and restoration of floodplain
woodlands• Erosion control near streams, rivers, and reservoirs• Source of carbon neutral renewable energy and fuel
energy• Feedstock for pulp, paper, particle, flake, strand-
based composite boards, chopsticks, and pallets production
• Vital ecosystems that provide unique habitats and symbiotic relationships
• Carbon sequestration and nutrient cycling• Bioremediation and biofiltration
• Colonization of new wetlands along river banks• Spontaneous and/or artificial restoration of
disturbed habitats• Adaptation to changing environmental conditions• Interspecific poplar breeding programs• In situ and/or ex situ conservation practices• Taxonomy studies based on morphological,
biochemical and molecular markers• Production of hybrids with favorable characteristics
(fast growth, good wood quality, resistance to pests and diseases, etc.)
• Cultivation of commercially exploited hybrid poplars
• Studying adaptations and tolerance in response to changing environments and to various herbivores and pathogens
• Chemotaxonomy studies of the genus Populus• Comparative metabolomics studies explaining
linkages between metabolic changes and both development and ecosystem functioning
• Traditional medicine (anti-inflamatory, antimicrobial, antioxidant properties)
• Excretions of the European black poplar buds are the main sources of propolis in Europe
• Model organism for tree biology - answering developmental, ecological and comparative genomics questions
• Transformation and dissection of gene function
Table 1.1. Ecological, scientific and economic importance of Populus nigra L.
Figure 1.11. Black Poplar in Gornje Podunavlje
28 / Variability of European Black Poplar (Populus nigra L.) in the Danube Basin Variability of European Black Poplar (Populus nigra L.) in the Danube Basin / 29
Further, European black poplar buds contain about 0.5% volatile oil. Sesquiterpene alcohols b-eudesmol and a-eudesmol account for 26.3–28.7% of the oil (Jerković and Mustelić, 2003). Other major sesquiterpene compounds were g-selinene (7.6–8.8%), d-cadinene (7.8–8.6%), a-elemene (3.3–5.2%) and g-cadinene (3.9–4.2%). Hemiterpenes are also identified (2.2–7.6%). Monoterpenes were present in low percentages (1.6–5.7%). Aliphatic and aromatic alcohols, carbonyl compounds and aliphatic acids were identified among non-terpene volatiles (9.8–13.5%).
Compounds present in the European black poplar buds have also been reported in propolis (Falcao et al., 2010), a hive product collected by honeybees from tree buds (Vardar-Ünlü et al., 2008), which is known for its antiseptic, antimycotic, bacteriostatic, astringent, choleric, spasmolytic, anti-inflammatory and anaesthesic properties. The leaf-buds of European black poplar (Gemmae populi) (Figure 1.9.) are used in traditional medicine as well as their alcoholic extracts, especially for their anti-inflammatory properties (Debbache-Benaida et al., 2013). Poplar buds are also reported to have antimicrobial (Vardar-Ünlü et al., 2008, Zabka et al., 2011), and antioxidant activities (Dudonné et al., 2009; Dudonné et al., 2011; Debbache et al., 2014). The collective antioxidant properties and transcriptional effects of leaf-bud extract suggest potential antiaging properties which could be utilized in cosmetic and nutraceutical formulations (Dudonné et al., 2011).
Characterization of the biological/ecological functions of P. nigra secondary metabolites as well as their biosynthesis will provide knowledge for the production of important secondary metabolites using novel biotechnological tools, and can lead to the generation of novel, improved varieties. Alternative large-scale production of secondary metabolites with various biological activities offers a great potential for the application in the pharmaceutical and food industries (Dević et al., 2006; Skorić et al., 2012c; Mišić et al., 2013; Radović et al., 2013).
Furthermore, phytochemicals are known to be suitable chemomarkers in chemotaxonomic studies, and for the chemodiversity estimation of many plant species (Govindaraghavan et al., 2012; Šiler et al., 2012). Constituents of the poplar bud exudates are used as markers in chemotaxonomy studies within the genus Populus, for the characterization of interspecific poplar hybrids (Greenaway et al., 1991a,b; Greenaway et al., 1992).
1.5. Conservation of the European black poplar in the Danube floodplains
Floodplain forests consist of a suite of plant species that may tolerate, not just days, but weeks and even months of flooding. These floodplain forests provide excellent habitats and have an important role in controlling downstream flooding by storing floodwaters and thereby dissipating their energy. Healthy riparian vegetation protects banks from erosion, influences in-channel aquatic habitats, maintains favorable water temperature for fish through shading, filters runoff, and provides nutrients (Gumiero et al., 2013).
Floodplain forests are among the most diverse ecosystems in Europe. The European black poplar is its natural element that sustains the existence of numerous plant species, as well as the richness of animal species, through a complex host-herbivore-
predator relationship. This diversity is supported by the diversity of habitats, different stages of maturation and mosaic of different horizontal and vertical structures enforcing stability of ecosystem (Rotach, 2004). A decrease in the size and variability of Populus nigra populations, as well as a loss of vitality and dynamics of floodplain forests in general, endanger characteristic animal and plant species and threatens the stability of ecosystem. Human activities including development, logging, road building, agriculture, and pasture usage have degraded some riparian habitats directly by decreasing riparian vegetation, altering sedimentation, and reducing large wood in streams. Moreover, some of human activities have strong impact on river morphology and floodplain dynamics, and subsequently on tree compositions and forest structure.
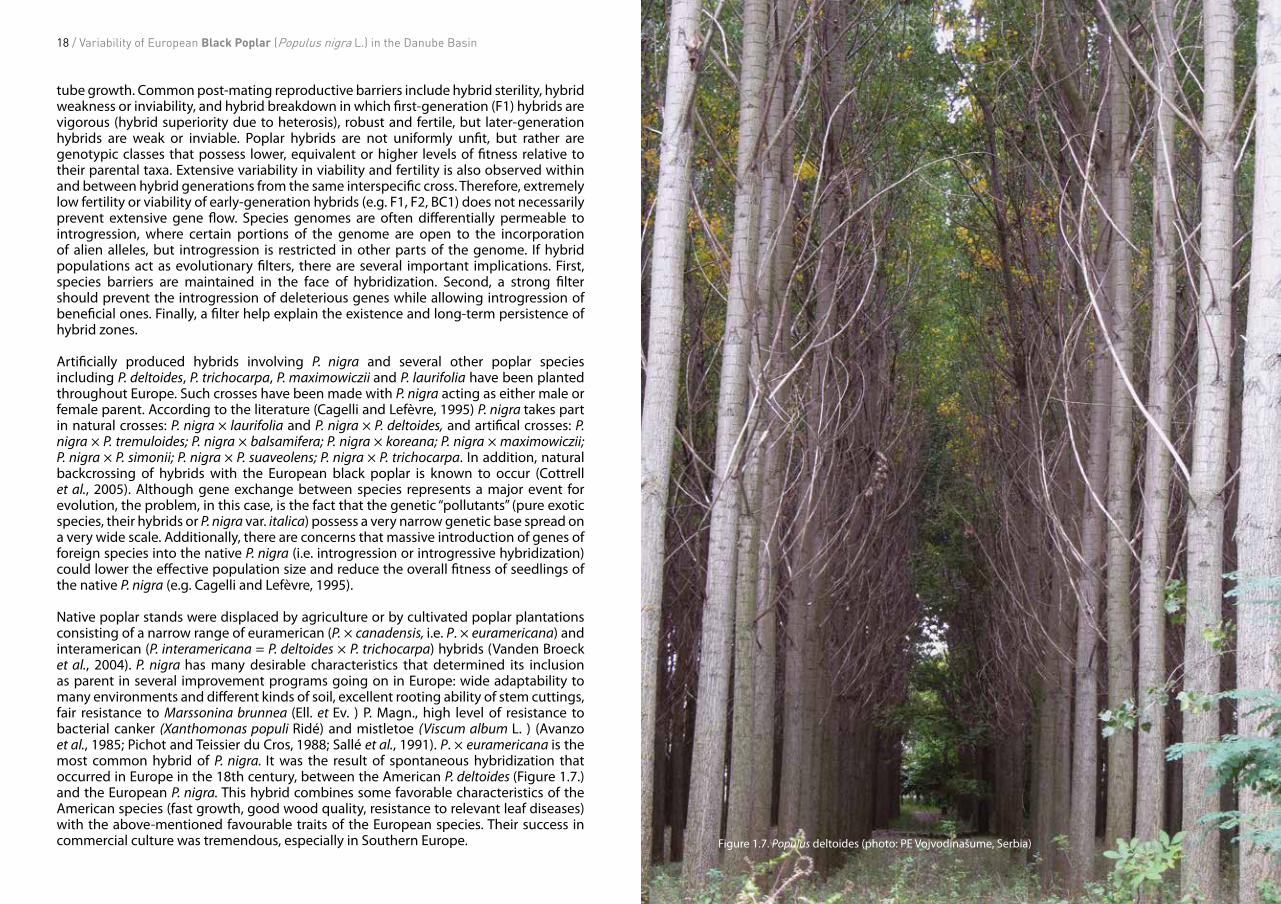
The Danube River (Figure 1.12.) flows through ten European countries and plays a key role as biological corridor (Storme et al., 2004; Naiman et al., 2005). The area of the Danube floodplain forests has been dramatically reduced for centuries, mainly to gain land for agriculture and settlements. Briefly, direct alterations of the floodplains (forest fragmentation) and various indirect effects on the river´s hydromorphology resulted also in fundamental changes of the floodplain forests, and strongly influenced the habitat quality. There has been ongoing pressure on these forests by new infrastructure development – roads, highways, bridges, flood control infrastructure like dams and dykes, etc. The upper Danube is a highly altered
Figure 1.12. The Danube River can act as biological corridor only with floodplain forests in a propitious ecological status, Hungary (photo: Fűzfa)

30 / Variability of European Black Poplar (Populus nigra L.) in the Danube Basin Variability of European Black Poplar (Populus nigra L.) in the Danube Basin / 31
river, due to a chain of hydropower plants in Germany and Austria along the river and its tributaries (Figure 1.13.). These dams stop the transport of sediments, induce river bed incision and thus unnaturally lower the water level, resulting in serious problems, not only in nature conservation, but also in water management, flood protection, infrastructure maintenance, etc. The fresh sediment deposition is vital for generative reproduction of Populus nigra. Its absence is serious risk for the maintenance of variability and stability of this species (Barsoum, 2001; Schulzke, 2004). The efforts should be directed to revitalize natural dynamics through the reduction of embankments, modification of groynes, reconnection of side-arms, etc. The upper and middle Danube is regulated for the most part by dykes and embankments that disconnect the floodplains from the main river (DANUBEPARKS Magazine, 2013). The flooding regime of remaining area could be a problem too, as Populus nigra cannot stand flooding longer than 60 days (Herpka, 1963). Along the lower Danube, mainly in Bulgaria and Romania (Figure 1.14.), there are still large natural and dynamic river sections, which need to be protected adequately from artificial structures.
Figure 1.13. Waterbodies on the Danube River in Neuburg (photo: Gunter Heidemeier)
The Danube floodplain forests are considered as habitats of common European conservation interest. Taking into account the high relevance for nature conservation and the range of environmental functions of the Danube floodplain forests, the sustainable and ecological management of these stands is inevitable and a high priority for the preservation of the Danube natural heritage.
The Danube floodplain forests belong to the endangered habitats on the European level and are therefore listed in the Flora Fauna Habitat Directive (FFH Directive, 1992). Two habitat types are particularly relevant:
- 91F0 Riparian mixed forests of Quercus robur, Ulmus laevis and Ulmus minor, Fraxinus excelsior or Fraxinus angustifolia, along the great rivers of the Atlantic and Middle-European provinces (Ulmenion minoris) and
- 91E0 Alluvial forests with Alnus glutinosa and Fraxinus excelsior (Alno-Padion, Alnionincanae, Salicion albae), with key species like the European black poplar (Populus nigra).
Figure 1.14. Dead swamp in Persina Nature Park (photo: Persina NP)
Populus nigra L. is one of the most common autochtonous tree species which constitutes floodplain forests along riversides in riparian ecosystems throughout Europe (Figure 1.15.). It plays a central role in the initial phase of the development of riparian forests and contributes to the natural control of flooding and water quality, thus becoming a target species for conservation and restoration actions in the Danube floodplain forests. Additionally, black poplar forests might serve as natural corridors, connecting areas along the Danube now separated from each other, facilitating gene flow for many riparian species (Storme et al., 2004; Naiman et al., 2005).
During the last two decades, several scientific projects (e.g. FLOBAR 2 (FLOodplain Biodiversity And Restoration) and projects originating from the EUFORGEN program (EUropean FORest GENetic)) have aimed to better understand the current ecological and

32 / Variability of European Black Poplar (Populus nigra L.) in the Danube Basin Variability of European Black Poplar (Populus nigra L.) in the Danube Basin / 33
genetic dynamics of P. nigra and to propose targeted conservation strategies (Lefèvre et al., 1998, 2001; Barsoum, 2001; Hughes and Rood, 2003; Rathmacher et al., 2010).
Figure 1.15. European black poplar froms riparian forests along the Danube river, Gornje Podunavlje (photo: Z. Tomović)
Nowadays, native populations of the European black poplar face severe threats:
1. Alteration of riparian ecosystems throughout the distribution area of P. nigra, such as drainage of rivers, management of riverbanks, displacement by agriculture land and settlements, etc. (Figures 1.16. and 1.17.). Furthermore, there has been ongoing pressure on floodplain forests by new infrastructure development – roads, highways, bridges, flood control measures like dams and dykes, etc.
2. Planting of non-native tree species, such as fast-growing hybrid poplars, resulted in disturbed composition of tree species in the floodplain forests along the Danube, including the autochthonous P. nigra resources. Cultivated poplar plantations consist usually of a narrow range of euramerican (P. × canadensis) and interamerican (P. interamericana = P. deltoides × P. trichocarpa) hybrids. Artificially produced hybrids involving P. nigra and several other poplar species such are P. deltoides, P. trichocarpa, P. maximowiczii and P. laurifolia have been planted throughout Europe. There are also several invasive species that reduce the area of autochthonous stands.
3. Introgression from cultivated poplars such as the P. nigra cv. ‘Italica’ and P. deltoides and its hybrids distributed all over continental Europe (Vanden Broeck et al., 2005). There are concerns that massive introduction of genes of foreign species into the native P. nigra (i.e. introgression or introgressive hybridization) could lower the effective population size and reduce the overall fitness of seedlings of the native P. nigra (e.g. Cagelli and Lefèvre, 1995). Low levels of introgression are expected in natural populations of black poplar where male black poplars grow in close proximity to female trees. However, caution should be exercised when isolated female black poplar trees are surrounded by interspecific hybrid males, which may be a source for introgression in the native populations.
In an attempt to conserve the genetic diversity of this endangered species, several European countries have independently set up ex situ genebanks in which cuttings of native black poplars from within each country are grown (Lefèvre et al., 1998). The amount of diversity within collections is assessed by using biochemical and molecular markers (isozymes, AFLP, microsatellites, etc.). The genebanks provide an excellent source of material based on collections made by people who were both knowledgeable regarding the locations of natural populations and able to distinguish P. nigra from hybrid material on the basis of morphological characteristics.
The remaining European black poplar stands, as well as the germplasm collected in gene banks, provide the genotypes for establishing new populations of P. nigra (Kovačević et al., 2010). The evel of genetic diversity in these new populations should be estimated to rate their potential to adapt to changing environmental conditions, a prerequisite that is considered to be essential for the long-term survival of populations (Booy et al., 2000; Lefèvre et al., 1998, 2001).
The main fields of activity and questions in conservation genetics of black poplar are listed below:
• How to identify species? A clear taxonomic treatment is the basis of any conservation measure. Natural hybridization and backcrossing of hybrids with black poplar is known to occur. It should be borne in mind that failure to recognize a hybrid or
Figure 1.16. Direct alterations of the floodplains and various indirect effects on the river´s hydromorphology have resulted in fundamental changes of the floodplain forests (photo: Association of citizens “BROZ”)
Figure 1.17. Forest fragmentation by infrastructure and roads (photo: Association of citizens “BROZ”)

34 / Variability of European Black Poplar (Populus nigra L.) in the Danube Basin Variability of European Black Poplar (Populus nigra L.) in the Danube Basin / 35
a backcross in which the maternal line is a species other than P. nigra could lead to misinterpretation of the results on genetic diversity and result in wrong conservation strategy. Environmental influences on the morphology and the phenotypic characters and differences between juvenile and mature trees make it difficult to discriminate between genetically different individuals on the basis of morphological traits alone and may result in genetic duplications within a collection, leading to increased space requirement and maintenance time (van Hintum et al., 1996; van Treuren et al., 2001). In addition, a number of hybrids with characteristics similar to those of P. nigra may have remained undetected. Molecular methods can help in defining genera, species and subspecies, but not on a stand-alone basis – traditional taxonomy and close interdisciplinary interaction are necessary. Analyzing introgression in large numbers of offsprings requires a molecular tool with a high sample throughput capacity and a straightforward interpretation of the results.
• How many populations to include in a conservation strategy? A population is usually defined as an independent breeding unit, a group of individuals that mainly interbreed among themselves over many generations, with only occasional contributions from other populations (immigration). It is necessary to know where to draw a line between populations in order to tackle conservation measures population by population, and to define conservation units.
• What are the relevant life-history traits and the reproductive biology of the species (mating systems, reproductive success, pollen and seed dispersal, migration patterns, sex ratio and age-structure), including any reproductive barriers between species and natural and anthropogenic hybridization (genetic contamination)? All these factors could influence the choice of conservation strategies, and appropriate propagation techniques for ex situ conservation measures. It is, therefore, of great importance to carefully implement basic knowledge on the biology of poplars into planning and conducting conservation practice.
• Which populations and/or individuals to conserve? Measuring the levels of genetic diversity (defined as number and distribution of alleles and genotypes) within and between populations to identify threatened populations (those with a low genetic diversity, or with special adaptations) as conservation targets, also taking into account the genetic basis of adaptive traits. Another aspect could be the conservation of individual genotypes with favorable characteristics (fast growth, good wood quality, resistance to pests and diseases, highly productive ones in terms of biologically active phytochemicals etc.).
• How to deal with populations? Establishing and executing a viable management plan for maintaining the genetic variability of the species is often the most difficult task, as socio-economic factors can often override scientific evidence. The usual approaches are selection of in situ genetic reserves, sampling for the establishment of ex-situ germplasm collections, development of breeding work within the ex-situ collections, and restoration of populations in the wild by using planting material originating from in situ stands or ex situ collections.
1.6. DANUBEPARKS viewpoints on the Danube floodplain forests
DANUBEPARKS is a network of Protected Areas along the Danube, comprising 17 areas represented by different partner institutions (public authorities, public enterprises, non-governmental organizations). The Protected Areas along the Danube preserve and restore the most valuable habitats of this international river, thus safeguarding an important part of Europe’s natural heritage for future generations.
The Protected Areas along the Danube River play an important role in the protection of floodplain forests. They work on site and have the know-how in the conservation and wise use of floodplain forests. Despite the key role of the Protected Areas, nature and forest conservation must not be reduced to the protected sites. In particular with respect to the concept of habitat corridors, the unprotected areas and the floodplains along the tributary rivers have to be taken strongly into consideration.
The European black poplar was selected as a flagship species for conservation of riverine forests and nature friendly floodplain forestry (Lefèvre et al., 1998). The aim of DANUBEPARKS network is to develop a European black poplar cadastre, as well as to analyze the genetics of local variations of P. nigra to provide a basis for future reforestation activities.
As a part of the activities of DANUBEPARK network, the analysis of twelve populations’ variability of the European black poplar (Populus nigra L.) along the Danube River was performed (Figure 1.18.a, b). Analyses of the selected set of morphological and molecular markers (microsatellites) were conducted in order to assess the genetic distance of analyzed populations along with dendrogram of genetic affinity, and defining of conservation units for the implementation of appropriate conservation measures.
Figure 1.18a. General map of the Danube basin indicating the locations of the populations sampled for the study: 1 - Donauauwald Neuburg-Ingolstadt, Germany (DNI), 2 - Donau-Auen National Park, Austria (NPDA), 3 - Protected landscape area Dunajské luhy, Slovakia (PLADL), 4 - Fertő-Hanság National Park, Hungary (FHNP), 5 - Danube Ipoly National Park, Hungary (DINP), 6 - Danube-Drava National Park, Hungary (DDNP), 7 - Special Nature Reserve Gornje Podunavlje, Serbia (SNRGP), 8 - Nature Park Kopački Rit, Croatia (NPKR), 9 - Lonjsko Polje Nature Park, Croatia (NPLP), 10 - Persina Nature Park, Bulgaria (PNP), 11 - Nature Park Rusenski Lom, Bulgaria (NPRL), 12 - Danube Delta Biosphere Reserve, Bulgaria (DDBR)

36 / Variability of European Black Poplar (Populus nigra L.) in the Danube Basin Variability of European Black Poplar (Populus nigra L.) in the Danube Basin / 37
Populus nigra - DANUBEPARKS
Figure 1.18b. Detailed map of the Danube basin indicating precise locations of individual trees of P. nigra used in the study of variability estimation
Legend Populus nigra
Austria HungaryBulgaria RomaniaCrotia SerbiaGermany Slovakia

38 / Variability of European Black Poplar (Populus nigra L.) in the Danube Basin Variability of European Black Poplar (Populus nigra L.) in the Danube Basin / 39
Allegri, E. (1956): I pioppi (genere Populus). Monti e Boschi, 11-12: 491–508.
Angiosperm Phylogeny Group (2003): An update of the Angiosperm Phylogeny Group classification for the orders and families of flowering plants: APG II. Botanical Journal of Linnean Society, 141: 399–436.
Arbez, M., Lefèvre, F., (1997): Towards a European genetic resource programme: objectives and general conception – a case study concerning black poplar (Populus nigra L.). Bocconea, 7: 389–398.
Arens, P., Coops, H., Jansen, J., Vosman, B. (1998): Molecular genetic analysis of black poplar (Populus nigra L.) along Dutch rivers. Molecular Ecology, 7: 11–18.
Avanzo, E., Biosoffi, S., Gras, M.A., Mughini, G. (1985): Breeding strategy adopted in Italy for poplars of the Aigeiros Section. Genetica Agraria, 39: 308 (Abstr.).
Baiocchi, C., Saini, G., Bertolo, P.L., Carpenito, C., Marengo, E., Giacosa, D. (1990): HPLC in the investigation of taxonomic problems. Classification of poplar genotypes. Chromatographia, 29(7-8): 355–362.
Banjanac, T., Šiler, B., Skorić, M., Ghalawenji, N., Milutinović, M., Božić, D., Mišić, D. (2013): Interspecific in vitro hybridization in genus Centaurium Hill and identification of hybrids via flow cytometry, RAPD, and secondary metabolite profiles. Turkish Journal of Botany, 38: 68–79.
Bankova, V.S., Popov, S.S., Marekov, N.L. (1988): Isopentenyl cinnamates from poplar buds and propolis. Phytochemistry, 28: 871–873.
Barrett, J.W., Rajora, O.P., Yeh, F.C.H., Dancik, B.P. (1993): Mitochondrial DNA variation and genetic relationships of Populus species. Genome, 36: 87–93.
Barsoum, N., Hughes, F.M.R. (1998): Regeneration response of black poplar to changing river levels. In: Wheater, W.H., Kirkby, C., Harding, R., Gilvear, D. (Eds.): Hydrology in a Changing Environment (Volume 1), British Hydrological Society and Wiley’s, Chichester, UK, pp. 397–412.
Barsoum, N. (2001): Regeneration-requirements and promotion measures. In: Lefèvre, F., Barsoum, N., Heinze, B., Kajba, D., Rotach, P., de Vries, S.M.G., Turok, J. (Eds.): EUFORGEN Technical Bulletin: In situ conservation of Populus nigra. International Plant Genetic Resources Institute, Rome, Italy, pp. 16–24.
Barsoum, N., Muller, E., Skot, L. (2004): Variations in levels of clonality among Populus nigra L. stands of different ages. Evolutionary Ecology 18: 601–624.
Benetka, V., Mottl, J., Vacková, M., Pospíšková, M., Dubský, M. (1999): Estimation of the introgression level in Populus nigra L. populations by means of isozyme gene markers. Silvae Genetica, 48: 218–223.
Bennett, K.D., Tzedakis, P.C., Willis, K.J. (1991): Quaternary refugia of North european trees. Journal of Biogeography, 18: 103–115.
Boccone, A. (1975): Differenze chemiotassonomiche tra specie e cloni di pioppo a livello del contenuto in flavoni. Cellulosa e Carta, 27(11): 39–46.
Booy, G., Hendriks, R.J.J., Smulders, M.J.M., Van Groenendael, J.M., Vosman, B. (2000): Genetic diversity and the survival of populations. Plant Biology, 2: 379–395.
References:

40 / Variability of European Black Poplar (Populus nigra L.) in the Danube Basin Variability of European Black Poplar (Populus nigra L.) in the Danube Basin / 41
Borititz, S. (1962): Papierchromatographische Differenzierung einiger Arten und Sorten der Gattung Populus. Zuchter, 32: 24–33.
Born, C., Hardy, O.J., Chevallier, M.H., Ossari, S., Atteke, C., Wickings, J., Hossaert-Mckey, M. (2008): Small-scale spatial genetic structure in the Central African rainforest tree species Aucoumea klaineana: a stepwise approach to infer the impact of limited gene dispersal, population history and habitat fragmentation. Molecular Ecology, 17: 2041–2050.
Braatne, J.H., Rood, S.B., Heilman, P.E. (1996): Life history, ecology, and reproduction of riparian cottonwoods in North America. In: Stettler, R.F., Bradshaw Jr., H.D., Heilman, P.E., Hinckley, T.M. (Eds.): Biology of Populus and Its Implications for Management and Conservation. NRC Research Press, Ottawa, Canada, pp. 57–85.
Bradley, E.B., Smith, D.G. (1986): Plains cottonwood recruitment and survival on a prairie meandering river floodplain, Milk River, southern Alberta and northern Montana. Canadian Journal of Botany, 64: 1433–1442.
Bradshaw Jr., H.D., Villar, M., Watson, B.D., Otto, K.G., Stewart, S., Stettler, R.F. (1994): Molecular genetics of growth and development in Populus III. A genetic linkage map of a hybrid poplar composed of RFLP, STS, and RAPD markers. Theoretical and Applied Genetics, 89: 167–178.
Bredemeijer, G.M.M., Cooke, R.J., Ganal, M.W., Peeters, R., Isaac, P., Noordijk, Y., Rendell, S., Jackson, J., Röder, M.S., Wendehake, K., Dijcks, M., Amelaine, M., Wickaert, V., Bertrand, L., Vosman, B. (2002): Construction and testing of a
microsatellite database containing more than 500 tomato varieties. Theoretical and Applied Genetics, 97: 584–590.
Busch, D.E., Smith. S.D. (1995): Mechanism associated with decline of woody species in riparian ecosystems of the south-western U.S. Ecological Monographs, 65: 347–370.
Busov, V., Strauss, S.H., Pilate, G. (2010): Transformation as a tool for genetic analysis in Populus. In: Jansson, S., Bhalerao, R., and Groover, A.T. (Eds.): Genetics and Genomics of Populus. Plant Genetics and Genomics: Crops and Models book series. Springer, New York, USA, pp.113–133.
Cagelli, L., Lefèvre, F. (1995): The conservation of Populus nigra and gene flow with cultivated poplars in Europe. Forest Genetics, 2: 135–144.
Castiglione, S., Wan, G., Damiani, G., Bandi, C., Bisoffi, S., Sala, F. (1993): RAPD fingerprints for identification and for taxonomic studies of elite poplar (Populus) c1ones. Theoretical and Applied Genetics, 87: 57–59.
Cervera, M.T., Storme, V., Soto, A., Ivens, B., Van Montagu, M., Rajora, O.P., Boerjan, W. (2005): Intraspecific and interspecific genetic and phylogenetic relationships in the genus Populus based on AFLP markers. Theoretical and Applied Genetics, 111: 1440–1456.
Chamaillard, S. (2011): Efficience de l’utilisation de l’eau chez le peuplier noir (Populus nigra L.) : variabilité et plasticité en reponse aux variations de l’environnement. PhD thesis of the Université d’Orléans: Orléans, France.
Chambers, G.K., MacAvoy, E.S. (2000): Microsatellites: consensus and
controversy. Comparative Biochemistry and Physiology Part B, Biochemistry and Molecular Biology, 126(4): 455–476.
Chase, M.W., Zmarzty, S., Lledo, M.D., Wurdack, K.J., Swensen, S.M., Fay, M.F. (2002): When in doubt put it in Flacourtiaceae: a molecular phylogenetic analysis based on plastid rbcL DNA sequences. Kew Bulletin, 57: 141–181.
Confalonieri, M., Balestrazzi, A., Bisoffi, S., Carbonera, D. (2003): In vitro culture and genetic engineering of Populus spp.: synergy for forest tree improvement. Plant Cell, Tissue and Organ Culture, 72: 109–138.
Cottrell, J.E., Krystufek, V., Tabbener, H.E., Milner, A.D., Connolly, T., Sing, L., Fluch, S., Burg, K., Lefèvre, F., Achard, P., Bordacs, S., Gebhardt, K., Vornam, B., Smulders, M.J.M., Vanden Broeck, A.H., Van Slycken, J., Storme, V., Boerjan, W., Castiglione, S., Fossati, T., Alba, N., Agundez, D., Maestro, C., Notivol, E., Bovenschen, J., van Dam, B.C. (2005a): Postglacial migration of Populus nigra L.: lessons learnt from chloroplast DNA. Forest Ecology Management, 219: 293–312.
Cronk, Q.C.B. (2005): Plant eco-devo: the potential of poplar as a model organism. New Phytologist, 166: 39–48.
DANUBEPARKS Magazine, 2013: available on line: http://www.danubeparks.org/files/1334_Danubeparks_Magazin_engl_final.pdf
Debbache, N., Atmani, D., Atmani, D. (2014): Chemical analysis and biological activities of Populus nigra, flower buds extracts as source of propolis in Algeria. Industrial Crops and Products, 53: 85–92.
Debbache-Benaida, N., Atmani-Kilani, D., Barbara Schini-Keirth, V., Djebbli,
N., Djebbli, A. (2013): Pharmacological potential of Populus nigra extract as antioxidant, anti-inflammatory, cardiovascular and hepatoprotective agent. Asian Pacific Journal of Tropical Biomedicine 3(9): 697–704.
Decamps, H. (1993): River margins and environmental change. Ecological Applications, 3: 441–445.
Dević, M., Momčilović, I., Krstić, D., Maksimović, V., Konjević, R. (2006): In vitro multiplication of willow gentian (Gentiana asclepiadea L.) and the production of gentiopicrine and mangiferin. Phyton, 46 (1): 45–54.
Dixon, R.A., Achnine, L., Kota, P., Liu, C.-J., Reddy, M.S.S., Wang, L. (2002): The phenylpropanoid pathway and plant defence – a genomics perspective. Molecular Plant Pathology, 3: 371–390.
Dos Santos Utmazian, M.N., Wieshammer, G., Vega R., Wenzel, W.W. (2007): Hydroponic screening for metal resistance and accumulation of cadmium and zinc in twenty clones of willows and poplars. Environmental Pollution, 148: 155–165.
D’Ovidio, R., Scarascia Mugnozza, G., Tanzarella, O. A. (1990): Ribosomal RNA genes structure in some Populus spp. (Salicaceae). Plant Systematics and Evolution, 173: 187–196.
D’Ovidio, R., Scarascia Mugnozza, G., Tanzarella, O. A. (1991): rRNA cloning and rapid hybrid identification in Populus spp. (Salicaceae). Plant Systematics and Evolution, l77: 165–174.
Dudonné, S., Vitrac, X., Coutiere, P. (2009): Comparative study of antioxidant properties and total phenolic content of 30 plant extracts of industrial interest using DPPH, ABTS, FRAP, SOD, and ORAC
42 / Variability of European Black Poplar (Populus nigra L.) in the Danube Basin Variability of European Black Poplar (Populus nigra L.) in the Danube Basin / 43
assays. Journal of Agricultural and Food Chemistry, 57: 1768–1774.
Dudonné, S., Poupard, P., Coutiere, P., Woillez, M., Richard, T., Mérillon, J.M., Vitrac, X. (2011): Phenolic composition and antioxidant properties of poplar bud (Populus nigra) extract: Individual antioxidant contribution of phenolics and transcriptional effect on skin aging. Journal of Agricultural and Food Chemistry, 59: 4527–4536.
Eckenwalder, J.E. (1984a): Natural intersectional hybridization between North American species of Populus (Salicaceae) in sections Aigeiros and Tacamahaca. I - Population studies of P. × parryi. Canadian Journal of Botany, 62(2): 317–324.
Eckenwalder, J.E. (1984b): Natural intersectional hybridization between North American species of Populus (Salicaceae) in sections Aigeiros and Tacamahaca. II. - Taxonomy. Canadian Journal of Botany 62(2): 325-335.
Eckenwalder, J.E. (1996): Systematics and evolution of Populus. In: Stettler, R.F., Bradshaw Jr., H.D., Heilman, P.E., Hinckley, T.M. (Eds.): Biology of Populus and its implications for management and conservation, NRC Research Press, National Research Council of Canada, Ottawa, Canada, pp. 7–32.
Egger, K., Tissut, M. (1968): ChimieVégétale - Sur la présence de galangine, pinocembrine et izalpinine dans les bourgeons de Populus nigra L. var. italica. Comptes Rendus de l’Académie des Sciences, Paris, p. 267.
Faivre-Rampant, P., Bodergat, R., Bervillè, A. (1992a): A molecular method to classify poplar (Populus) clones into sections Tacamahaca, Aigeiros, Leuce and
Leucoides using ribosomal DNA variable restriction fragments. Comptes Rendus de l’Académie des Sciencess, 315 (3): 133–138.
Faivre-Rampant, P., Jeandroz, S., Lefèvre, F., Lemoine, M., Villar, M., Berville, A. (1992b): Ribosomal DNA studies in poplars: Populus deltoides, P. nigra, P. trichocarpa, P. maximowiczii and P. alba. Genome, 35(5): 733–740.
Falcao, S.I., Vilas-Boas, M., Estevinho, L.M., Barros, C., Domingues, M.R., Cardoso, S.M. (2010): Phenolic characterization of North east Portuguese propolis: usual and unusual compounds. Analytical and Bioanalytical Chemistry, 396: 887–97.
Ferris, R., Sabatti, M., Miglietta, F., Mills, R.F., Taylor, G. (2001): Leaf area is stimulated in Populus by free air CO2 enrichment (POPFACE), through increased cell expansion and production. Plant, Cell and Environment, 24: 305–315.
Flora Fauna Habitat Directive (1992): European Council Directive 92/43/EEC on the conservation of natural habitats and of wild fauna and flora. http://eur-lex.europa.eu/LexUriServ/LexUriServ. o?uri=CONSLEG:1992L0043: 20070101:EN:PDF
Fossati, T., Grassi, F., Sala, F., Castiglione, S. (2003): Molecular analysis of natural populations of Populus nigra L. intermingled with cultivated hybrids. Molecular Ecology, 12: 2033–2043.
Francis, R.A., Gurnell, A.M., Petts, G.E. (2004): The survival and growth response of Populus nigra fragments to differing hydrogeomorphological conditions. Hydrology: Science and Practice for the 21st Century, 2: 80–89.
Frison, E., Lefèvre, F., de Vries, S., Turok, J. (1995): EUFORGEN Populus nigra Network – Report of the 1st meeting, 3–5 October 1994, Izmit, Turkey. International Plant Genetic Resources Institute, Rome, Italy, p. 52.
Gaudet, M., Pietrini, F., Beritognolo, I., Iori, V., Zacchini, M., Massacci, A., Scarascia Mugnozza, G., Sabatti, M. (2011): Intraspecific variation of physiological and molecular response to cadmium stress in Populus nigra L. Tree Physiology, 31: 1309–1318.
Gellini, R. (1975): Botanica Forestale, Vol. 11. Edizioni CLUSF, Firenze, pp. 201.
Govindaraghavan, S., Hennell, J.R., Sucher, N.J. (2012): From classical taxonomy to genome and metabolome: Towards comprehensive quality standards for medicinal herb raw materials and extracts. Fitoterapia, 83: 979–988.
Greenaway, W., English, S., Whatley, F.R., Rood, S.B. (1991a): Interrelationships of poplars in a hybrid swarm as studied by gas chromatography – mass spectrometry. Canadian Journal of Botany, 69(1): 203–208.
Greenaway, W., Whatley, F.R. (1991b): Synthesis of esters of acetyloxycaffeic acids and their occurrence in poplar bud exudates. Journal of Chromatography, 543: 113–121.
Greenaway, W., English, S., Whatley, F. R. (1992): Relationships of Populus × acuminate and Populus × generosa with their parental species examined by gas chromatography – mass spectrometry of bud exudates. Canadian Journal of Botany, 70(1): 212–221.
Gumiero, B., Mant, J., Hein, T., Elso, J., Boz, B. (2013): Linking the restoration of rivers
and riparian zones/wetlands in Europe: Sharing knowledge through case studies. Ecological Engineering, 56: 36–50.
Hamada, H., Kakunaga, T. (1982): Potential Z-DNA forming sequences are highly dispersed in the human genome. Nature, 298: 396–398.
Hamzeh, M., Dayanandan, S. (2004): Phylogeny of Populus (Salicaceae) based on nucleotide sequences of chloroplast TRNT-TRNF region and nuclear rDNA. American Journal of Botany, 91: 1398–1408.
Hamzeh, M., Perinet, P., Dayanandan, S. (2006): Genetic relationships among species of Populus (Salicaceae) based on nuclear genomic data. Journal of the Torrey Botanical Society, 133: 519–527.
Hardy, O.J., Vekemans, X. (1999): Isolation by distance in a continuous population: reconciliation between spatial autocorrelation analysis and population genetics models. Heredity, 83: 145–154
Heinze, B. (1997): A PCR marker for a Populus deltoides allele and its use in studying introgression with native European Populus nigra. Belgian Journal of Botany, 129(2): 123–130.
Heinze, B., Lickl, E. (2002): Rare, but steady, introgression in Austrian black poplar as a long-term risk? In: van Dam, B., Bordács, S. (Eds.): Genetic diversity in river populations of European black poplar—implications for riparian eco-system management. Proceedings of an International Symposium, Szekszárd, Hungary, 16–20 May, 2001. Csiszár Nyomda, Budapest, Hungary, pp. 169–175
Herpka, I. (1963): Postanak i razvoj prirodnih vrba u Podunavlju i donjoj Posavini. Topola, 36/37: 18–27.

44 / Variability of European Black Poplar (Populus nigra L.) in the Danube Basin Variability of European Black Poplar (Populus nigra L.) in the Danube Basin / 45
Herpka, I. (1986): A survey on development and possibilities of growing: natural forest of poplars and willows. In: Poplars and willows. Poplar Research Institute, Novi Sad, pp. 21–36.
Hughes, F.M.R., Barsoum, N., Richards, K.S., Winfield, M., Hayes, A. (2000): The response of male and female black poplar (Populus nigra L. subspecies betulifolia (Pursh) W. Wettst.) cuttings to different water table depths and sediment types: implications for low management and river corridor biodiversity. Hydrological Processess, 14: 3075–3098.
Hughes, F.M.R., Adams, W.M., Muller, E., Nilsson, C., Richards, K.S., Barsoum, N., Decamps, H., Foussadier, R., Girel, J., Guilloy, H., Hayes, A., Johansson, M., Lambs, L., Pautou, G., Peiry, J.-L., Perrow, M., Vautier, F., Winfield, M. (2001): The importance of different scale processes for the restoration of floodplain woodlands. Regulated Rivers: Research & Management, 17: 325–345.
Hughes, F.M.R., Rood, S.B. (2003): Allocation of river flows for restoration of floodplain forest ecosystems: a review of approaches and their applicability in Europe. Environmental Management, 32: 12–33.
Hupp, C.R. (1992): Riparian vegetation recovery patterns following stream channelization: a geomorphic perspective. Ecology, 73 :1209–1226.
Iwasa, Y., Levin, S.A. (1995): The timing of life-history events. Journal of Theoretical Biology, 172: 33–42.
Jakovljević, T., Cvjetko Bubalo, M., Orlović, S., Sedak, M., Bilandžić, N., Brozinčević, I., Radojčić Redovniković, I. (2014): Adaptive response of poplar (Populu snigra L.) after prolonged Cd exposure period.
Environmental Science and Pollution Research, 21: 3792–3802.
Janssen, A. (1997): Unterscheidung der beiden Schwarzpappelarten Populus nigra L. und P. deltoides Marsh.sowie ihrer Arthybride P. × euramericana (Dode) Guinier mit Hilfe von Isoenzymmmustern. Holzzucht, 51: 17–23.
Jerković, I., Mustelić, J. (2003): Volatile compounds from leaf-buds of Populus nigra L. (Salicaceae). Phytochemistry, 63 (1): 109–113.
Jump, A.S., Penuelas, J. (2006): Genetic effects of chronic habitat fragmentation in a wind-pollinated tree. Proceedings of the National Academy of Sciences of the United States, 103: 8096–8100.
Karrenberg, S., Edwards, P.J., Kollmann, J. (2002):. The life-history of Salicaceae living in the active zone of floodplains. Freshwater Biology, 47: 733–748.
Karrenberg, S., Blaser, S., Kollmann, J., Speck, T., Edwards, P.J. (2003): Root anchorage of saplings and cuttings of woody pioneer species in a riparian environment. Functional Ecology, 17: 170–177.
Keim, P., Paige, K.N., Whitham, T.G., Lark, K. G. (1989): Genetic analysis of an interspecific hybrid swarm of Populus: occurence of unidirectional introgression. Genetics, 123(3): 557–565.
Komives, T., Gullner, G., Rennenberg, H., Casida, J.E. (2003): Ability of poplar (Populus spp.) to detoxify chloroacetanilide herbicides. Water, Air and Soil Pollution: Focus, 3(3): 277–283.
Kovačević, B., Tomović, Z., Štajner, D., Katanić, M., Drekić, M., Stojnić, S. (2010): Restoracija autohtonih vrsta topola
(Populus sp.) u aluvijalnim područjima – formiranje genofonda. Topola, 185/186: 61–68 [In Serbian].
Kovačević, B., Orlović S., Miladinović D., Katanić M., Vuksanović V. (2013): Evaluation of copper tolerance and accumulation in black poplar in vitro. Programme and abstracts of International Scientific Conference “Forest Research Institute at the Bulgarian Academy of Sciences 85th anniversary”, p. 35.
Kurbalija Novičić, Z., Jelić, M., Savić, T., Savić-Veselinović, M., Dimitrijević, D., Jovanović, M., Kenig, B., Stamenković-Radak, M., Andjelković, M. (2013): Effective population size in Drosophila subobscura: ecological and molecular approaches. Journal of Biological Research – Thessaloniki, 19: 65–74
Laureysens, I., Blust, R., De Temmerman, L., Lemmens, C., Ceulemans, R. (2004): Clonal variation in heavy metal accumulation and biomass production in a poplar coppice culture: I. Seasonal variation in leaf, wood and bark concentrations. Environmental Pollution, 131: 485–494.
Laureysens, I., De Temmerman, L., Hastir, T., Van Gysel, M., Ceulemans, R. (2005): Clonal variation in heavy metal accumulation and biomass production in a poplar coppice culture. II. Vertical distribution and phytoextraction potential. Environmental Pollution, 133: 541–551.
Lefèvre, F., Legionnet, A., de Vries, S., Turok, J. (1998): Strategies for the conservation of a pioneer tree species, Populus nigra L., in Europe. Genetics Selection Evolution, 30: S181–S196.
Lefèvre, F., Kajba, D., Heinze, B., Rotach, P., de Vries, S.M.G., Turok, J. (2001): Black poplar: A model for gene resource
conservation in forest ecosystems. Forestry Chronicle, 77: 239–244.
Lefèvre, F., Bordács, S., Cottrell, J., Gebhardt, K., Smulders, M.J.M., Vanden Broeck, A., Vornam, B., Van Dam, B.C. (2002): Recommendations for riparian ecosystem management based on the general frame defined in EUFORGEN and results from EUROPOP. In: van Dam, B., Bordács, S. (Eds.): Genetic diversity in river populations of European black poplar–implications for riparian eco-system management. Proceedings of an International Symposium, Szekszárd, Hungary, 16–20 May, 2001. Csiszár Nyomda, Budapest, Hungary, pp. 157–161.
Legionnet, A., Faivre-Rampant, P., Villar, M., Lefèvre, F. (1997): Sexual and asexual reproduction in natural stands of Populus nigra. Botanica Acta, 110: 257–263.
Leskinen, E., Alstrm-Rapaport, C. (1999): Molecular phylogeny of Salicaceae and closely related Flacourtiaceae: evidence from 5.8 S, ITS 1 and ITS 2 of the rDNA. Plant Systematics and Evolution, 215: 209–227.
Lexer, C., Fay, M.F., Joseph, J.A., Nica, M.S., Heinze, B. (2005): Barrier to gene flow between two ecologically divergent Populus species, P. alba (white poplar) and P. tremula (European aspen): The role of ecology and life history in gene introgression. Molecular Ecology, 14: 1045–1057.
Liberloo, M., Calfapietra, C., Lukac, M., Godbold, D., Luo, Z.-B., Polle, A., Hoosbeek, M.R., Kull, O., Marek, M., Raines, C., Rubino, M., Taylor, G., Scarascia-Mugnozza, G., Hartceulemans, R. (2006): Woody biomass production during the second rotation of a bio-energy Populus plantation increases in a future high CO2 world. Global Change Biology, 12: 1094–1106.

46 / Variability of European Black Poplar (Populus nigra L.) in the Danube Basin Variability of European Black Poplar (Populus nigra L.) in the Danube Basin / 47
Lowe, A.J., Boshier, D., Ward, M., Bacles, C.F.E., Navarro, C. (2005): Genetic resource impacts of habitat loss and degradation; reconciling empirical evidence and predicted theory for neotropical trees. Heredity, 95: 255–273.
Lytle, D.A. (2001): Disturbance regimes and life-history evolution. The American Naturalist, 157: 525–536.
Lytle, D.A., Poff, N.L. (2004): Adaptation to natural flow regimes. Trends in Ecology and Evolution, 19: 94–100.
Mahoney, J.M., Rood, S. B. (1991): A device for studying the influence of declining water table on poplar growth and survival. Tree Physiology, 8: 305–314.
Mahoney, J.M., Rood, S.B. (1998): Streamflow requirements for cottonwood seedling recruitment - an integrative model. Wetlands, 18: 634–645.
Mansfield, S. D., Weineisen, H. (2007): Wood fiber quality and kraft pulping efficiencies of trembling aspen (Populus tremuloides Michx) clones. Journal of Wood Chemistry and Technology, 27(3-4): 135–151.
Mišić, D., Ghalawenji, N., Grubišić, D., Konjević, R. (2005): Micropropagation and reintroduction of Nepeta rtanjensis, an endemic and critically endangered perennial of Serbia. Phyton, 45: 9–20.
Mišić, D., Grubišić, D., Konjević, R. (2006): Micropropagation of Salvia brachyodon through nodal explants. Biologia Plantarum, 50 (3): 473–476.
Mišić, D., Šiler, B., Skorić, M., Djurickovic, M., Nestorović Živković, J., Jovanović, V., Giba, Z. (2013): Secoiridoid glycosides production by Centaurium maritimum L. Fritch hairy root cultures in temporary
immersion bioreactor. Process Biochemistry, 48: 1587–1591.
Morreel, K., Goeminne, G., Storme, V., Sterck, L., Ralph, J., Coppieters, W., Breyne, P., Steenackers, M., Georges, M., Messens, E., Boerjan, W. (2006): Genetical metabolomics of flavonoid biosynthesis in Populus: a case study. The Plant Journal, 47: 224–237.
Naiman, R.J., Decamps, H., McClain, M.E. (2005). Riparia: Ecology, Conservation, and Management of Streamside Communities (Ed. Maragioglio, N.). Elsevier Academic Press, USA.
Naujoks, G., von Wühlisch, G. (2004): Micropropagation of Populus nigra L.: a potential contribution to gene conservation and tree improvement. In: Koskela, J., de Vries, S.M.G., Kajba, D., von Wühlisch, G. (Eds.): Populus nigra network. International Plant genetic resources Institute, Rome, Italy, pp. 123–124.
Niiyama, K. (1990): The role of seed dispersal and seedling traits in colonization and coexistence of Salix species in a seasonally flooded habitat. Ecological Research, 5: 317–331.
Pautou, G., Arens, M.-F. (1994): Theoretical habitat templates, species traits and species richness: floodplain vegetation in the Upper Rhone River. Freshwater Biology, 31: 507–522.
Pautou, G., Girel, J. (1994): Interventions humaines et changement de la végétation alluviale dans la vallée de l’Isère (de Montmélian a Port Saint-Gervais). Revue de Geographie Alpine LXXXII: 127–146.
Perić, M., Dmitrović, S., Živković, S., Filipović, B., Skorić, M., Simonović, A., Todorović, S. (2012): In vitro growth,
morphogenesis and acclimatization of endangered Rindera umbellata (Waldst. & Kit.) Bunge. Hortscience, 47(8): 1123–1128.
Pichot, C.H., Teissier du Cros, E. (1988): Estimation of genetic parameters in the European black poplar (Populus nigra L. ). Consequence on the breeding strategy. Annales des Sciences Forestiere, 45(3): 223–238.
Popivshchy, I.I., Prokazin, A.E., Routkovsky, L.V. (1997): Black poplar in the Russian Federation, In: Turok, J., Lefevre, F., de Vries, S., Toth, B. (Eds.): Populus nigra Network. Report of the third meeting, Sarvar, Hungary, 5-7 October 1996, IPGRI, Rome, Italy, pp. 46–52.
Pospíšková, M., Šálková, I. (2006): Population structure and parentage analysis of black poplar along the Morava River. Canadian Journal of Forest Research, 36: 1067–1076.
Radović, M., Šiler, B., Nestorović Živković, J., Banjanac, T., Živković, S., Nikolić, M., Soković, M., Mišić, D. (2013): Bioreactor cultivation of Zeltnera beyrichii (Torr. & A. Gray) Mans.: A novel source of biologically active compounds. Records of Natural Products, 7(4): 266–280.
Rajora, O.P. (1986): Mating systems and fertilising pollen gene pools of Populus deltoides Marsh. and P. nigra L. clones located in different compatible species neighborhoods as inferred from isozyme analysis. In: Proceedings of the 20th Canadian Tree Improvement Association 1985, Part 2. Canadian Forestry Service, Ottawa, pp. 134–141.
Rajora, O. P. (1989): Characterization of 43 Populus nigra L. clones representing selections, cultivars and botanical varieties based on their multilocus allozyme genotypes. Euphytica, 43: 197–206.
Rathmacher, G., Niggemann, M., Kohnen, M., Ziegenhagen, B., Bialozyt, R. (2010): Short-distance gene flow in Populus nigra L. accounts for small-scale spatial genetic structures: implications for in situ conservation measures. Conservation Genetics, 11: 1327–1338.
Reily, P.W., Johnson W.C. (1982): The effects of altered hydrologic regime on tree growth along the Missouri River in North Dakota. Canadian Journal of Botany, 60: 2410–2423.
Rogić, B., Tomić, L., Važić, B., Jelić, M., Jovanović, S., Savić, M. (2011): Assessment of genetic diversity of busa cattle from Bosnia and Herzegovina using microsatellite DNA markers. Archives of biological sciences, 63(4): 1077–1085.
Röder, M.S., Wendehake K., Korzun V., Bredemeijer G., Laborie D., Bertrand, L., Isaac, P., Rendell, S., Jackson, J., Cooke, R.J., Vosman, B., Ganal, M.W. (2002): Construction and analysis of a microsatellite-based database of European wheat varieties. Theoretical and Applied Genetics, 106: 67–73.
Romme, W.H., Turner, M.G., Gardner, R.H., Hargrove, W.W., Tuskan, G.A., Despain, D.G., Renkin, R.A. (1997): A rare episode of sexual reproduction in aspen (Populus tremuloides Michx) following the 1988 Yellowstone fires. Natural Areas Journal, 17: 17–25.
Ronald, W.G., Lenz, L.M., Cumming, W.A. (1973a): Biosystematics of the genus Populus L. I. – Distribution and morphology of native Manitoba species and variants. Canadian Journal of Botany, 51(12): 2431–2442.
Ronald, W.G., Lenz, L.M., Cumming, W.A. (1973b): Biosystematics of the genus Populus L. II - Chemotaxonomy,

48 / Variability of European Black Poplar (Populus nigra L.) in the Danube Basin Variability of European Black Poplar (Populus nigra L.) in the Danube Basin / 49
phenology, fertility and segregates of native Manitoba species and variants. - Canadian Journal of Botany, 51(12): 2443–2450.
Ronald, W.G., Steele, J. W. (1974): Biosystematics of the genus Populus L. III - Naturally occurring Manitoba hybrids of introduced P. petrovskyana with native P. deltoides var. occidentalis and P. balsamifera. Canadian Journal of Botany, 52: 1883–1887.
Rood, S.B., Heinz-Milne, S. (1989): Abrupt downstream forest decline following river damming in southern Alberta. Canadian Journal of Botany, 67: 1744–1749.
Rood, S.B., Goater, L.A., Mahoney, J.M., Pearce, C.M., Smith, D.G. (2007): Flood, fire, and ice: disturbance ecology of riparian cottonwoods. Canadian Journal of Botany, 85: 1019–1032.
Rotach, P. (2004): Poplars and biodiversity. In: Koskela, J., de Vries, S.M.G., Kajba, D., von Wühlisch, G. (Eds.): Populus nigra Network, Report of seventh (25-27 October 2001, Osijek, Croatia) and eight meetings (22-24 May 2003, Treppeln, Germany). International Plant Genetic Resouces Institute, Rome, Italy, pp. 79–100.
Rubiolo, P., Casetta, C., Cagliero, C., Brevard, H., Sgorbini, B., Bicchi, C. (2013): Populus nigra L. bud absolute: a case study for a strategy of analysis of natural complex substances. Analytical and Bioanalytical Chemistry, 405: 1223–1235.
Sallé, G., Hariri, E.B., Andary, C. (1991): Some mechanisms involved in resistance of poplar (Populus spp.) to mistletoe (Viscum album L.). Proceedings of Fifth International Symposium On Parasitic Weeds, Nairobi, Kenya, 24-30 June 1991, pp. 270–278.
Schlötterer, C. (2000): Evolutionary dynamics of microsatellite DNA. Chromosoma, 109(6): 365–371.
Schulzke, R. (2004): In situ regeneration of black poplar (Populus nigra L.) along river Eder. In: Koskela, J., de Vries, S.M.G., Kajba, D., von Wühlisch, G. (Eds.): Populus nigra Network, Report of seventh (25-27 October 2001, Osijek, Croatia) and eight meetings (22-24 May 2003, Treppeln, Germany). International Plant Genetic Resouces Institute, Rome, Italy, pp. 115–118.
Scott, M.L., Auble, G.T., Friedman, J.M. (1997): Flood dependency of cottonwood establishment along the Missouri River, Montana, USA. Ecological Applications, 7: 677–690.
Sjödin, A., Wissel, K., Bylesjo, M., Trygg, J., Jansson, S. (2008): Global expression profiling in leaves of free-growing aspen. BMC Plant Biology, 8: 61.
Skorić, M., Šiler, B., Banjanac, T., Nestorović Živković, J., Dmitrović, S., Mišić, D., Grubišić, D. (20Ws of PCR components on RAPD analysis of four Centaurium species. Archives of Biological Sciences, 64(1): 191–199.
Skorić, M., Živković, S., Savić, J., Šiler, B., Sabovljević, A., Todorović, S., Grubišić, D. (2012b): Efficient one-step tissue culture protocol for propagation of endemic plant, Lilium martagon var. cattaniae Vis. African Journal of Biotechnology, 11(8): 1862–1867.
Skorić, M., Todorović, S., Gligorijević, N., Janković, R., Živković, S., Ristić, M., Radulović, S. (2012c): Cytotoxic activity of ethanol extracts of in vitro grown Cistus creticus subsp. creticus L. on human cancer cell lines. Industrial Crops and Products, 38: 153–159.
Slavov, G.T., Leonardi, S., Burczyk, J., Adams, W.T., Strauss, S.H., Difazio, S.P. (2009): Extensive pollen flow in two ecologically contrasting populations of Populus trichocarpa. Molecular Ecology, 18: 357–373.
Smith, R.L., Sytsma, K. J. (1990): Evolution of Populus nigra (Sect. Aigeiros): introgressive hybridization and the chloroplast contribution of Populus alba (Sect. Populus). American Journal of Botany, 77(9): 1176–1187.
Smulders, M.J.M., Bredemeijer, G., Rus-Kortekaas, W., Arens, P., Vosman, B. (1997): Use of short microsatellites from database sequences to generate polymorphisms among Lycopersicon esculentum cultivars and accessions of other Lycopersicon species. Theoretical and Applied Genetics, 94: 264–272.
Smulders, M.J.M., Beringen, R., Volosyanchuk, R., Vanden Broeck, A., van der Schoot, J., Arens, P., Vosman B. (2008): Natural hybridisation between Populus nigra L. and P. × canadensis Moench. Hybrid offspring competes for niches along the Rhine river in the Netherlands. Tree Genetics & Genomes, 4: 663–675.
Stamenković-Radak, M., Jelić, M., Kurbalija Novičić, Z., Kenig, B., Tanasković, M., Anđelković, M. (2012): Balkan glacial history and modern Drosophila subobscura population genetics. Evolutionary Ecology Research, 14(7): 839–858.
Stanton, B.J., Villar, M. (1996): Controlled reproduction of Populus. In: Stettler, R.F., Bradshaw, H.D., Heilman, P.E., Hinckley, T.M. (Eds.): Biology of Populus and its Implications for Management and Conservation. NRC Research Press, Ottawa, Canada, pp. 113–138.
Stella, J.C., Battles, J.J., Orr, B.K., McBride, J.R. (2006): Synchrony of seed dispersal, hydrology and local climate in a semi-arid river reach in California. Ecosystems, 9: 1200–1214.
Stobrawa, K., Lorenc-Plucinska, G. (2008): Thresholds of heavy metal toxicity in cuttings of European black poplar (Populus nigra L.) determined according to antioxidant status of fine roots and morphometrical disorders. Science of the Total Environment, 390: 86–96.
Storme, V., Vanden Broeck, A., Ivens, B., Smulders, M.J.M., Halfmaerten, D., Van Slycken, J., Boerjan, W. (2002): Ex-situ conservation of black poplar in Belgium, the margin of the geographical distribution area of the species. In: van Dam, B., Bordács, S. (Eds.): Genetic diversity in river populations of European black poplar–implications for riparian eco-system management. Proceedings of an International Symposium, Szekszárd, Hungary, 16–20 May, 2001. Csiszár Nyomda, Budapest, Hungary, pp. 61–72.
Storme, V., Vanden Broeck, A., Ivens, B., Halfmaerten, D., Van Slycken, J., Castiglione, S., Grassi, F., Fossati, T., Cottrell, J.E., Tabbener, H.E., Lefèvre, F., Saintagne, C., Fluch, S., Krystufek, V., Burg, K., Bordács, S., Gebhardt, K., Vornam, B., Pohl, A., Alba, N., Agúndez, D., Bovenschen, J., Van Dam, B.C., Van der Schoot, J., Vosman, B., Boerjan, W., Smulders, M.J.M. (2004): Ex-situ conservation of black poplar in Europe: genetic diversity in nine gene bank collections and their value for nature development. Theoretical and Applied Genetics, 108: 969–981.
Street, N., Tsai, C.-J. (2010): Populus resources and bioinformatics. In: Jansson, S., Bhalerao, R., Groover, A.T. (Eds.): Genetics and Genomics of Populus.

50 / Variability of European Black Poplar (Populus nigra L.) in the Danube Basin Variability of European Black Poplar (Populus nigra L.) in the Danube Basin / 51
Plant Genetics and Genomics: Crops and Models book series. Springer, New York, USA, pp. 135–152.
Šiler, B., Avramov, S., Banjanac, T., Cvetković, J., Nestorović, J., Patenković, A., Mišić, D. (2012): Secoiridoid glycosides as a marker system in chemical variability estimation and chemotype assignment of Centaurium erythraea Rafn from the Balkan Peninsula. Industrial Crops and Products, 40: 336–344.
Tabbener, H.E., Cottrell, J.E. (2003): The use of PCR based DNA markers to study the paternity of poplar seedlings. Forest Ecology and Management, 179: 363–376.
Tautz, D., Renz, M. (1984): Simple sequences are ubiquitous repetitive components of eukaryotic genomes. Nucleic Acids Research, 12(10): 4127–4138.
Tesar, M., Reichenauer, T.G., Sessitsch, A. (2002): Bacterial rhizosphere populations of black poplar and herbal plants to be used for phytoremediation of diesel fuel. Soil Biology & Biochemistry, 34: 1883–1892.
Tsai, C.J., Harding, S.A.,Tschaplinski, T.J., Lindroth, R.L., Yuan, Y. (2006): Genome-wide analysis of the structural genes regulating defense phenylpropanoid metabolism in Populus. New Phytologist, 172(1): 47–62.
van Hintum, T.J.L., Boukema, I.W., Visser, D.L. (1996): Reduction of duplication in a Brassica oleracea germplasm collection. Genetic Resources and Crop Evolution, 43: 343–349.
Van Raamsdonk, L.W.D., Vrielink-van Ginkel, M., Kik, C. (2000): Phylogeny reconstruction and hybrid analysis in Allium subgenus Rhizirideum. Theoretical and Applied Genetics, 100: 1000–1009.
Van Slycken, J. (1996): Plant descriptors for Populus nigra. In: Turok, J., Lefèvre, F., Cagelli, L., De Vries, S. (Eds.): Populus nigra Network. Report of the second meeting. 10–12 September 1995. Casale Monferrato, Italy, pp. 13–24.
Van Splunder, I., Coops, H., Voesenek, L.A.C.J., Blom, C.W.P.M. (1995): Establishment of alluvial forest species in floodplains: the role of dispersal timing, germination characteristics and water level fluctuations. Acta Botanica Neerlandica, 44(3): 269–278.
van Treuren, R., van Soest, L.J.M., van Hintum, T.J.L. (2001): Marker-assisted rationalisation of genetic resource collections: a case study in flax using AFLPs. Theoretical and Applied Genetics, 103: 144–152.
Vanden Broeck, A. (2003): EUFORGEN Technical Guidelines for genetic conservation and use for European black poplar (Populus nigra L.). International Plant Genetic Resources Institute, Rome, Italy.
Vanden Broeck, A., Storme, V., Cottrell, J.E., Boerjan, W., Van Bockstaele, E., Quataert, P., Van Slycken, J. (2004): Gene flow between cultivated poplars and native black poplar (Populus nigra L.): a case study along the river Meuse on the Dutch-Belgian border. Forest Ecology and Management, 197: 307–310.
Vanden Broeck, A., Villar, M., Van Bockstaele, E., Van Slycken, J. (2005): Natural hybridization between cultivated poplars and their wild relatives: Evidence and consequences for native poplar populations. Annals of Forest Science, 62: 601–613.
Vanden Broeck, A., Cottrell, J., Quataert, P., Breyne, P., Storme, V., Boerjan, W., Van
Slycken, J. (2006): Paternity analysis of Populus nigra L. offspring in a Belgian plantation of native and exotic poplars. Annals of Forest Science, 63: 783–790.
Vardar-Ünlü, G., Silici, S., Ünlu, M. (2008): Composition and in vitro antimicrobial activity of Populus buds and poplar-type propolis. World Journal of Microbiology and Biotechnology, 24: 1011–1017.
Wollenweber, E., Egger, K. (1971): Die lipophilenflavonoide des knospenols von Populus nigra. Phytochemistry, 10: 225–226.
Zabka, M., Pavela, R., Gabrielova-Slezakova, L. (2011): Promising antifungal effect of some Euro-Asiatic plants against dangerous pathogenic and toxinogenic fungi. Journal of the Science of Food and Agriculture, 91: 492–497.
Zacchini, M., Pietrini, F., Scarascia Mugnozza, G., Iori, V., Pietrosanti L., Massacci, A. (2009): Metal tolerance, accumulation and translocation in poplar and willow clones treated with cadmium in hydroponics. Water Air and Soil Pollution, 197: 23–34.
Živković, B., Radović, J., Sokolović, D., Šiler, B., Banjanac, T., Strbanović, R. (2012): Assessment of genetic diversity among alfalfa (Medicago sativa L.) genotypes by morphometry, seed storage proteins and RAPD analysis. Industrial Crops and Products, 40: 285–291.
Zsuffa, L. (1974): The genetics of Populus nigra L. Academia scientiarum et artium slavorum meridionalium (Zagreb). Annales Forestales, 6(2): 29–53.

52 / Variability of European Black Poplar (Populus nigra L.) in the Danube Basin Variability of European Black Poplar (Populus nigra L.) in the Danube Basin / 53
2.1. Morphological characters as a tool to assess the variability within the genus Populus
Several groups of morphological characters could be used in population studies, such as: measured, derived and descriptive leaf parameters, bark and phenological parameters. The characters of generative organs are also of value in adult phase plants. The fact that measured and derived leaf parameters are not significantly influenced by subjective factor, and have continuous variability, are their main advantage in population studies comparing to categorical (descriptive) characters. These parameters are not as distinctive as molecular markers that are widely used nowadays. However, use of both groups of parameters could provide better insight in variability among and within populations.As regards poplars, the main efforts have been invested in population and taxonomy studies, as well as in discrimination of genotypes of interest. Hattemer (1969) examined 18 measured and derived leaf morphometric characters, and described their variability by variance components derived by hierarchical analysis of variance (Nested design). Based on five leaves from the upper part of stem of one-year old rooted cutting, he examined 101 clones of Populus deltoides, P. trichocarpa and P. ×euramericana, as well as hybrid combinations among species of sections Aigeiros and Tacamahaca. He used interclass correlation coefficient suggesting that the characters with higher coefficient would have more important role in clone discrimination by linear discrimination functions. At the base of variation of six measured and four derived leaf morphometric characters, Marcet (1961) discriminated two ecotypes of Populus deltoides. Ying and Bagley (1976) analyzed 498 clones of 116 half-sib families from 11 provenances of P. deltoides. They found continual cline variability by the direction northeast-southeast, and suggested that three subspecies of P. deltoides: monilifera, missuriensis and angulata could not be distinctly discriminated. Barens (1969) analyzed the variability of early leaves from 31 trees of Populus tremuloides and 23 trees of Populus grandidentata from the area of south Michigan, by using the interclass correlation coefficient.
The implementation of the methods of multivariate analysis was necessary considering numerous parameters and the amount of data necessary to be processed in the analysis of variability in population studies. According to Barens (1969), the pioneer work on his subject in poplars was done by Marcet, 1950 and Muller, 1957 who applied discrimination analysis. Barens (1975) analyzed 1257 clones of P. tremuloides from 206 locations in the USA and Canada. Along with analysis of variance, he used multivariate analysis of variance (MANOVA) in order to test differences among populations and made cluster analyses based on the first two canonical variables from discrimination analyses. Rajora et al. (1991) examined 9 populations of P. deltoides in Ontario, Canada, at the base of seven
2. Variability of leaf morphometric characters in Populus nigra populations in the Danube Basin
Branislav Kovačević
University of Novi Sad, Institute for Lowland Forestry and Environment, Antona Čehova 13, 21000 Novi Sad, Serbia. E-mail: [email protected]

54 / Variability of European Black Poplar (Populus nigra L.) in the Danube Basin Variability of European Black Poplar (Populus nigra L.) in the Danube Basin / 55
leaf morphometric characters of adult trees. They found significant differences among populations and estimated genetic distances among them based on Mahalanobis distances as a measure of similarity. According to the results of principal component analysis (PCA), they suggested that the population Long Point should be clustered separately from others. Barens and Han (1992) examined variability among and within populations of P. davidiana and P. rotundifolia in China and P. tremula in the countries of South and Eastern Europe and China. According to the results of discrimination analyses and multivariate analysis of variance, they suggested that P. davidiana and P. rotundifolia should be considered as varieties of P. tremula. Eckenwalder (1996) used the Principal coordinate analysis and the Cluster analysis in the discrimination of populations of Populus mexicana, by using 72 vegetative and reproductive characters. The Principal coordinate analysis was used in order to utilize both quantitative and qualitative characters. By the first two principal components two subspecies were distinguished.
Kovačević et al. (1999) implemented alternative ways of standardization in Cluster analysis and Principal component analysis for 20 genotypes from section Aigeiros in order to strengthen the effect of characters that are more influenced by genetic sources of variation. They suggested implementation of standard deviation within genotypes instead of standard deviation of genotype means in standardization. In order to preserve the effect of such standardization, they suggested a covariance matrix to be used in PCA. Camussi and Stefanini (2005) used the Monte Carlo method called “Random forest” in discrimination of 30 poplar clones with 18 descriptors. They used this method in order to overcome difficulties due to the probability distribution of different traits. In order to improve the process of numerical description of leaf shape and its use in classification to known genotypes and taxonomic groups, Guyer et al. (1993) examined the possibility of leaf shape scanning and computer analysis of data in course of their allocation to pre-defined groups.
Among relatively rare efforts in population studies in Populus nigra based on leaf morphometric traits, Krstinic et al. (1998) made an attempt to evaluate the degree of interspecific introgression in the progenies of P. nigra in tree populations in Croatia, while Kajba and Romanić (2002) examined the similarity among natural populations of Populus nigra in the Drava River Basin in Croatia, by applying a discriminative analysis.
Nowdays, Populus nigra is an endangered species, and considerable efforts are performed in course of its restoration (Koskela et al., 2004; Kovačević et al., 2010b). The main focus is on two threats: decreasing in number and size of P. nigra populations and gene flow from cultivated poplars to Populus nigra natural populations (Smulders et al. 2008). Assessment and description of genetic diversity is an important part of efforts toward conservation of the Populus nigra (Lefèvre et al., 2001). Also, leaf size and shape could be used to distinguish certain ecotypes (Marcet, 1961; Ying and Bagley, 1976), which could be interesting for restoration and climate changes.
The variability studies based on leaf morphometric characters are relatively efficient and affordable in population studies. Together with other suitable methods, molecular markers in particular, these data can provide additional information and contribute to a better understanding of genetic diversity within and among the populations of Populus nigra.
This chapter analyzes the variability among and within 12 populations of European
black poplar (Populus nigra L.) along the river Danube. In addition, the chapter provides an evaluation of 8 measured and 4 derived leaf morphological characters in order to be used in further population studies.
2.2. Assessment of the variability of the European black poplar’s leaf morphometric characters in the Danube Basin
2.2.1. Leaf sampling
In this research, 30 randomly selected adult trees were examined in 12 populations of Populus nigra L. situated along the Danube River:
in Germany: D (DNI) - Donauauwald Neuburg-Ingolstadtin Austria: A (NPDA) - Donau-Auen National Parkin Slovakia: SK (PLADL) - Protected landscape area Dunajské luhyin Hungary: H (DDNP) - Danube-Drava National Park, H (DINP); - Danube Ipoly National Park, H (FHNP); - Fertő-Hanság National Parkin Croatia: HR (NPLP) - Lonjsko Polje Nature Park, HR (NPKR); - Nature Park Kopački Ritin Serbia: SRB (SNRGP) – Special Nature Reserve Gornje Podunavljein Bulgaria: BG (NPRL) - Nature Park Rusenski Lom, BG (PNP); - Persina Nature Parkin Romania: RO (DDBR) - Danube Delta Biosphere Reserve.
Every tree was registered and labeled. Leaves were taken from short shoots at the height of 4-6 m, at the side of the crown that was exposed to directsun light (Figure 2.1.). From every tree, 60 fully developed, undamaged and healthy leaves from the middle part of several twigs were taken in August in order to form a representative sample (Figure 2.2.).
Figure 2.1. Position of used short shoot 2.2. Position of sampling leave (photo: D.Čortan) (photo: D.Čortan)

56 / Variability of European Black Poplar (Populus nigra L.) in the Danube Basin Variability of European Black Poplar (Populus nigra L.) in the Danube Basin / 57
2.2.2. Examined leaf characters
Once assembled in a herbarium, every leaf was measured by 8 measured leaf characters (Figure 2.3.):
a – length of the leaf blade (mm)b – width of the leaf blade (mm)c – length of the leaf petiole (mm)d – angle between the first leaf vein and the horizontal line (O)e – width of the leaf blade at 1 cm from the top (mm)f – distance between the base of leaf blade and the widest part of the blade (mm)g – length of the whole leaf (leaf blade and petiole) (mm)h – number of leaf veins on the left blade sidei – number of leaf veins on the right blade side.
Figure 2.3. Measured leaf morphometric characters (according to Krstinic et al., 1998)
Beside measured leaf morphometric characters, 4 derived characters were calculated: b/a = b / a, f/a = f / a, c/b = c / b, and f/b = f / b. For statistical analysis, the radians were used instead of degrees for measuring the angle between the first lateral leaf vein and the horizontal line (d). Also, in order to achieve normal distribution of frequencies for characters number of leaf veins on the left (h) and right (i) side of the leaf blade, the square transformation was performed by formula: X . After the statistical analysis, the calculated average values were retransformed.
2.2.3. Descriptive statistics
The first information about the variability of examined characters was gained through parameters of descriptive statistics:
• average ptlX
X ptlΣΣΣΣ= , where p stands for number of populations, t for number of
trees within population and l for number of leaves within the tree
• minimum and maximum population mean values
• coefficient of variation, derived from the nested design analysis of variance: between
populations (
), within populations (
) ,
and for residual variation within trees (
), where σ2 stand for
the expected variance of a particular source of variation.
2.2.4. Analysis of variance and coefficient of correlation
The two-way nested design analysis of variance (Table 2.1.) was performed according to the following model:
)()( ijmijiijm tpX εµ +++=,
where Xijm stands for measured value, µ for average value, pi for effect of ith population, tj(i)
for effect of jth tree within ith population, and εm(ij) for effect of residual variation.
Table 2.1. Two-way analysis of variance, nested design
The effect of the examined sources of variation was evaluated by their contribution to
the total variance by formula: 22)(
2
2
RPTP
X
σσσσ
++ , where 2Xσ stands for the expected variance
of a particular source of variation. The expected variances were calculated as follows:
for population variance: , for tree within population variance: , and for
residual variance .
In order to analyze the relationship among the examined characters, Pearson’s correlation coefficients were calculated by formula:
22 .)(.)(.).)((YYXX
YYXXrii
iixy
−−Σ
−−Σ=
,
where Xi and Yi represent average values of population i, and .X and .Y represent total
1cm
a
c
b
d
f
g
e
Sources ofvariation
Population (P)
Tree (within Population) (T(P))
Residual (R)
Total
Degree of freedom*)
p-1
p*(t-1)
p*t*(n-1)
p*t*n-1
Mean square
MS1
MS2
MS3
Expectedmean square
22)(
2PPTR ntn σσσ ++
2)(
2PTR nσσ +
2Rσ
F-value
MS1/MS2
MS2/MS3
Table 2.1. Two-way analysis of variance, nested design
*) p - number of populations, t - number of trees within population, n - number of leaves within tree, σ2 - expected variance
nMSMS
PT322
)(−
=σ
nMSMS
PT322
)(−
=σnt
MSMSP
212 −=σ
32 MSR =σ
%100*...
2
XCv residual
residual
σ=
%100*2
XCv within
within
σ=%100*
...
2
XCv between
between
σ=

58 / Variability of European Black Poplar (Populus nigra L.) in the Danube Basin Variability of European Black Poplar (Populus nigra L.) in the Danube Basin / 59
average values for the examined characters X and Y, respectively. A hypothesis about the difference between the calculated coefficient of correlation and 0 were tested by z-test.
For the evaluation of similarity between different distances used in the description of relationship among the examined populations, Spearman’s rank correlation coefficient was used by formula:
)1(
612
1
2
−
−=
∑=
nn
dr
n
ii
S
,
where di stands for the difference in the ranks of distances of interest between particular pairs of populations.
2.2.5. Principal component analysis (PCA)
Principal component analysis is a method of multivariate analysis used in order to reduce the amount of data along with preserving its variability as much as possible. The first principal component explains the highest part of the total variance, and the following components lesser and lesser. The entering data were average population values for all examined characters. The data was standardized by the standard deviation of population means. The variance of a particular principal component is obtained by the calculation of its eigenvalue λi. If the correlation matrix is labeled Σ, λi is calculated on the basis of determinant equation:
0=Ι−Σ iλ ,
where I(p*p) is a unit matrix, and p is the number of original variables.
The characteristic vector (α1) of the highest eigenvalue is calculated on the basis of the following equation:
( ) 011 =Ι−Σ αλ .
The principle is the same for other principal components.
Also, the effect of alternative standardization with residual standard deviation from one-way ANOVA based on tree average values was examined. In this case, the covariance matrix was used instead of correlation matrix in order to preserve the effect (Kovačević, 1999).
The first three principal components were used in order to present relationship among the examined populations based on leaf morphological characters.
Grouping of leaf morphometric characters was based on the relationship between the original variables (examined characters) and the principal components. The criterion is based on the fact that the principal components are not correlated, so it could be expected that the characters with high communalities and factor loadings (in fact,
correlation coefficients) with a particular principal component are in high correlation among themselves and low correlation with the other characters. The interpretation was based on the first seven principal components, because the communality for character d was the highest with seventh principal component. Because there is not only one solution of the model of principal component analysis, the matrix of estimated factor loadings (B) is transformed by such orthogonal matrix T, in order to gain Γ - matrix of rotated factor loadings (γij - of ith original variable and jth principal component) that would satisfy the criterion of oblique structure. It means that within Γ - matrix (Γ = BT), a particular principal component will have a small number of high factor loadings, and the remaining loadings will be as low as possible (Kaiser, 1958; Thurstone, 1969; Kovačić, 1994).
For orthogonal rotation, the varimax method was applied on the first seven principal components, where varimax criterion is used as a measure of the obliquity of structure, tending to its maximization.
For the interpretation of relationship between the original variables and the principal components, communalities were used. Communalities are square of factor loadings describing the part of variance presented by a particular original variable through a particular principal component. The criterion for the grouping of examined characters was that all characters with their highest communality with the same principal component are in the same group. Based on the eigenvalue of particular principal component, the ranking of the groups was performed according to the amount of information that a particular principal component contribute to the total variation.
2.2.6. Discrimination analysis
Discrimination analysis is a multivariate method with the aim to discriminate different groups and allocate observations in pre-defined groups,by fulfilling the Fisher’s discrimination criterion by maximizing the ratio between the variances among and within groups. Χ is matrix of average values, B – matrix of the sums of squares between groups, W – matrix of the sum of squares within groups, and the eigenvalue of ith canonical discrimination function ( iλ ) is obtained by solving the determinant equation:
01 =Ι−−iBW λ ,
while characteristic vectors (αi) are calculated on the basis of equation:
( ) 01 =Ι−−iiBW αλ .
In order to analyze relations among populations, the squared Mahalanobis distance was used as a measure of similarity:
( ) ( )srsr xxSxxD −−=2 ,
for centroides of population r ( rx ) and s ( sx ) and general covariance matrix ( S ).
Canonical discrimination analysis was used as a way to evaluate the discrimination power of the examined leaf morphometric characters. The evaluation of the significance

60 / Variability of European Black Poplar (Populus nigra L.) in the Danube Basin Variability of European Black Poplar (Populus nigra L.) in the Danube Basin / 61
of obtained canonical discrimination functions is performed by testing the hypothesis that the first s eigenvalues are equal, for n – total number of observation, p – number of variables and g – number of populations, by Bartlett’s statistics:
( ) ( )∑=
+
+−−
s
iigpn
11ln
211 λ ,
that approximately has χ2 – distribution with p(g-1) degrees of freedom, if the null hypothesis is correct.
For interpretation of canonical discrimination functions, first eight have passed the Bartlett’s test, but first four were selected as their sum of eigenvalues participates with more than 90% in the total variance. Discrimination coefficients were standardized by diagonal matrix D1/2, whose diagonal entries are the square roots of the diagonal elements of general covariance matrix S . A small value of standardized coefficient suggests a weak influence of particular character. For the interpretation of canonical discrimination functions, discriminate loadings (correlation coefficients between original variables and discrimination functions) were also used.
Beside the canonical discrimination analysis, stepwise discrimination analysis was performed, both forward and backward, in order to gather additional information about the significance of the contribution of particular leaf morphometric character to the discrimination between populations.
Stepwise discrimination analysis is an iterative process. By including an independent variable in model (in case of forward analysis), or excluding it from the model (in case of backward analysis), its discrimination power is evaluated according to the difference in discrimination power of the model with and the model without it. In every step the variable that made the highest difference in discrimination power between the previous and the new model is selected. In this way, the order in which variables are included or excluded from the model is related to their significance in discrimination between populations.
The significance of the change of discrimination power is tested by Wilks’s lambda from the multivariate analysis of variance:
WBW+
=Λ ,
where W stands for matrix of the sum of squares within groups, B – matrix of the sum of squares between groups, and T=B+W for matrix of the total sum of squares. For the significance of differences between Λj (for the model without particular variable) and Λj+1 (for the model with particular variable) the following statistics is used:
−
ΛΛ
−−−
+
11 1j
j
gjgn ,
where n stands for the number of independent variables, g – number of groups and j - number of selected independent variables. This statistics has F-distribution with (g-1) and (n-g-j) degrees of freedom, if (j+1)th variable does not contribute significantly to the discrimination between groups.
Allocation of observations was performed based on the scores of discrimination functions for populations. Observations are classified into one of the groups with which they share the highest discrimination score. The score is calculated by formula:
)ln(21 11
)( ikkkxk pxSxxSxy +−= −− ,
where kx stands for average value of group k, x – observation that should be assigned to a group, S – covariance matrix, and pi – the probability that the observation would be classified in group i.
Evaluation of allocation of observations was performed on the basis of the rate of correct allocation, calculated by formula:
∑
∑
=
== k
ii
k
i
n
iinE
1
1)(
,
where n(i|i) stands for the number of correctly classified trees of ith population, and ni is the size of the sample of ith population.
2.2.7. Cluster analysis
The Cluster analysis was performed in order to examine relations among P. nigra populations based on similarities between them. Squared Euclidian distance was used, as proposed by Kendal (1980) and Kovačić (1994), calculated by formula:
∑=
−=−−=p
jsjrjsrsrrs xxxxxxd
1
22 )()()'( ,
where xr and xs are dimensional vectors that describe values of particular populations r and s, for p used variables, while xrj and xsj are the average population values of jth
variable for populations r and s. Standardization was performed on population average values by the standard deviation of population means (normalization), in order to make comparative variables with difference in scale and variability. That is because the parameters with higher values and higher variances would more strongly influence the results of cluster analysis. The alternative way of standardization with residual standard deviation from one-way ANOVA based on tree average values was performed in order to examine its effect on the results of agglomeration (Kovačević, 1999). The unweight pair-group average method (UPGMA), from the group of hierarchical methods of agglomeration was used. This method is, as well as normalization, regularly used in population studies. It is an iterative process, where the distance between two clusters is calculated as the average distance between all pairs of objects in the two different clusters. After the formation of dendrogram, the clusters were defined by the Scree test, at the distance of agglomeration step where the change of distance leaves a linear trend. Statistical analysis was performed by STATISTICA v. 12.0 (StatSoft Inc., 2012).

62 / Variability of European Black Poplar (Populus nigra L.) in the Danube Basin Variability of European Black Poplar (Populus nigra L.) in the Danube Basin / 63
2.3. Variability and discriminative power of leaf morphometric characters
2.3.1. Descriptive statistics and analysis of variance
The first criterion of discrimination ability of the examined leaf morphometric characters was a high variability among populations and low residual variation.
Based on the parameters of descriptive statistics, the first information about the variability of examined characters was acquired. Average values for populations were later used in the methods of multivariate analysis (Table 2.2.). The interval from minimum to maximum values (Table 2.4.) suggests considerable variability. According to the results of the analysis of variance, all characters used in this research were shown to be under statistically significant influence of both differences among and differences within the examined populations. However, F values, although rarely used in this purpose, suggest differences in the intensity of that influence among the examined characters, as well as among the examined sources of variation (Table 2.3.). The highest F values among populations were found for the characters h and I, i.e. the number of leaf veins on the left and right blade side, respectively.
Table 2.2. Average values of examined leaf morphometric characters in examined Populus nigra populations
According to the coefficients of variation, the highest influence of differences among populations was in characters: width of the leaf blade at 1 cm from the top (e), distance between the base of leaf blade and the widest part of the blade (f ), and f/b, ratio between distance between the base of leaf blade and the widest part of the blade and width of the leaf blade. These characters had also the highest coefficients of variation within populations. Number of leaf veins on the left (h) and right blade side (i) and ratio
between distance between the base of leaf blade and the widest part of the blade and length of leaf blade (f/a), showed the highest stability, with the coefficient of residual variation with less then 10%. However, width of the leaf blade at 1 cm from the top (e), distance between the base of leaf blade and the widest part of the blade (f ), and ratio between distance between the base of leaf blade and the widest part of the blade and width of the leaf blade (f/b) presented the highest variability among populations with the coefficient of variation between populations c.c. 20% (Table 2.4.). Kajba and Romanić (2002) found the variation of coefficients within five populations of Populus nigra in Croatia in the Drava basin to vary from 15% to 53% regarding the examined leaf morphometric characters. These characters had also rather high coefficients of residual variation that suggest that discrimination power should be further analyzed.
Beside F values and coefficients of variation, the influence of the examined sources of variation was analyzed by the contribution of the expected variances of variation sources to the total expected variance. The contribution of differences between populations was in most of characters between 10 and 20%. The highest contribution of variance between populations had the characters h and i that describe the number of veins on the left and right blade side. The highest contribution of variation within population (more than 50%) achieved distance between the base of leaf blade and the widest part of the blade (f ) and its ratio with the length of leaf blade (f/a). The highest influence of residual variation was found in the ratio between the width and length of leaf blade (b/a) and the ratio between rhe length of petiole and the width of leaf blade (c/b) (Graph 2.1.).
Table 2.3. Results of nested design analysis of variance for examined leaf morphometric characters in populations of Populus nigra
Population
Dunajské luhy
Danube delta
Fertő-Hanság
Neuburg-Ingolstadt
Kopacki rit
Lonjsko polje
Donau-Auen
Danube Ipoly
Danube-Drava
Persina
Rusenski lom
Gornje Podunavlje
Table 2.2. Average values of examined leaf morphometric characters in examined Populus nigra populations
*) Labels of leaf morphometric characters: a - length of the leaf blade (mm), b – width of the leaf blade (mm), c – length of the leaf petiole (mm), d – angle between the �rst leaf vein and the horizontal line (O), e – width of the leaf blade at 1 cm from the top (mm), f – distance between the base of leaf blade and the widest part of the blade (mm), g – length of the whole leaf (leaf blade and petiole) (mm), h – number of leaf veins on the left blade side, i - number of leaf veins on the right blade side, and b/a, f/a, c/b, f/b refer to the ratios between particular characters
a*)
77.02
89.88
90.40
69.37
75.03
89.75
72.47
83.10
81.61
72.72
81.19
78.08
b
61.49
70.76
66.48
59.98
63.17
74.52
60.58
63.07
65.27
60.19
65.17
65.62
c
48.23
51.22
50.34
43.57
48.46
54.98
43.15
50.91
52.17
44.17
46.23
51.20
d
44.60
37.80
46.20
44.25
44.07
40.62
42.72
46.87
42.52
42.12
42.54
42.71
e
6.52
6.20
4.57
7.87
8.84
6.94
7.68
5.95
6.66
9.64
8.94
8.17
f
34.77
22.63
23.12
21.94
19.53
25.41
20.14
21.77
22.56
20.03
17.20
19.11
g
125.25
141.10
140.74
113.35
122.38
144.39
115.54
134.21
133.78
103.70
127.54
129.29
h
5.06
4.62
6.11
6.47
4.28
4.62
3.35
5.55
4.24
4.47
4.97
4.81
i
5.13
4.66
6.14
6.48
4.33
4.64
3.39
5.63
4.28
4.80
4.93
4.90
b/a
0.81
0.81
0.74
0.88
0.86
0.84
0.84
0.77
0.81
0.84
0.82
0.85
f/a
0.54
0.74
0.74
0.68
0.73
0.71
0.72
0.73
0.72
0.72
0.79
0.75
c/b
0.80
0.73
0.76
0.73
0.78
0.75
0.74
0.81
0.80
0.74
0.72
0.79
f/b
0.58
0.32
0.35
0.37
0.32
0.35
0.35
0.35
0.35
0.35
0.27
0.30
Examinedcharacters1)
a
b
c
d
e
f
g
h
i
b/a
f/a
c/b
f/b
Table 2.3. Results of nested design analysis of variance for examined leaf morphometric characters in populations of Populus nigra
1) Labels of leaf morphometric characters: a - length of the leaf blade (mm), b – width of the leaf blade (mm), c – length of the leaf petiole (mm), d – angle between the �rst leaf vein and the horizontal line (O), e – width of the leaf blade at 1 cm from the top (mm), f – distance between the base of leaf blade and the widest part of the blade (mm), g – length of the whole leaf (leaf blade and petiole) (mm), h – number of leaf veins on the left blade side, i - number of leaf veins on the right blade side, and b/a, f/a, c/b, f/b refer to the ratios between particular characters2) Labels of the results of analysis of variance: MSbetween - mean square between populations, MSwithin - mean square within populations, MSresidual - mean square of residual variation, Fbetween test- F test for variation between populations, Fwithin test- F test for variation within populations
MSbetween2)
95213.30
35204.92
25126.26
3.27
3782.49
33890.87
285732.79
67.67
64.83
2.63
5.90
1.74
10.26
MSwithin
4185.64
2577.85
2272.05
0.46
462.16
2825.68
11856.06
0.82
0.84
0.48
0.47
0.52
0.90
MSresidual
137.14
111.39
74.08
0.01
14.85
17.75
419.15
0.04
0.03
0.03
0.00
0.03
0.02
Fbetween
test
22.75
13.66
11.06
7.19
8.18
11.99
24.10
82.46
77.15
5.43
12.46
3.32
11.41
Fwithin
test
30.52
23.14
30.67
42.50
31.11
159.20
28.29
23.36
25.37
15.60
96.23
19.72
50.65

64 / Variability of European Black Poplar (Populus nigra L.) in the Danube Basin Variability of European Black Poplar (Populus nigra L.) in the Danube Basin / 65
Table 2.4. Descriptive statistics of examined leaf morphometric characters in examined Populus nigra populations
Graph 2.1. Contribution of examined sources of variation to the total expected variance of examined characters in Populus nigra populations*)
*) Labels of leaf morphometric characters: a - length of the leaf blade (mm), b – width of the leaf blade (mm), c – length of the leaf petiole (mm), d – angle between the first leaf vein and the horizontal line (O), e – width of the leaf blade at 1 cm from the top (mm), f – distance between the base of leaf blade and the widest part of the blade (mm), g – length of the whole leaf (leaf blade and petiole) (mm), h – number of leaf veins on the left blade side, i - number of leaf veins on the right blade side, and b/a, f/a, c/b, f/b refer to the ratios between particular characters
The contribution of the examined sources of variation was calculated by the nested design analysis of variance for the examined leaf morphometric characters. In this case, the contribution of variance between populations was of particular interest, as it is related to the genetic differences between populations. According to these results, the influence of the differences between populations was relatively weak, with the contribution to the total variation between 10 and 20%. The highest contribution of variance between populations to the total variation was achieved by the number of leaf veins on the left (h) and right blade side (i). These two characters had low coefficients of residual variation, and relatively moderate coefficients of variation between populations. Thus, their stability contributed to their higher discrimination power.
Influence of residual variation, which refers to the variation among leaves within trees, is relatively high. In most of examined characters it is higher then 50%. The exceptions are the characters describing the number of veins (h and i), and the characters related to distance between the base of leaf blade and the widest part of the blade (f, f/a, f/b). There was an attempt in this work to lower the residual variance by the unification of sampling procedure. So, the fully developed leaves were taken from the short shoots of same height, exposed to the direct sunlight. In further work, attention should be paid to the variability within a shoot, as the position of leaves and their exposition to the sun within a shoot are not the same. The arrangement of leaves within a shoot (phyllotaxis) in poplars is helical with the divergence angle 2/5, meaning that within two turns there are five leaves. Thus, five successive leaves should be measured (Hattemer, 1969), and then we should calculate the average value for the shoot in order to diminish this source of variation (Kovačević et al., 1999; Kovačević et al., 2000). Kovačević et al. (1999) emphasize the influence of year, as a repetition in time, because the source of variation made a significant influence on the discrimination of the group of genotypes of section Aigeiros in one-year old rooted cuttings. Kovačević et al. (1997) also emphasized the significance of the time of collection of leaves, especially regarding the number of lateral vein on the right side (i) in the group of genotypes of section Aigeiros.
The contribution of variation within population to the total expected variation was relatively high for characters related to distance between the base of leaf blade and the widest part of the blade (f, f/a, f/b). This finding is important; suggesting that, beside differences among populations, this group of characters could be efficiently used in describing genetic variability within populations too. This also suggests a high variability within populations in general, which could be a problem for discrimination of populations. Ratio between width of the leaf blade and length of the leaf blade (b/a), and ratio between length of the leaf petiole and width of the leaf blade (c/b) showed the lowest influence of the controlled sources of variation, which is relatively surprising as these characters are regularly suggested in poplar cultivar’s discrimination and population studies (UPOV, 1980; Viart, 1992; Van Slycken, 1996; Kovačević et al., 1999). Kovačević et al. (1995) found high broad-sense heritabilities (>70%) in the length of petiole and related derived characters in black poplars (section Aigeiros) progenies. Hattemer (1969) found that the highest contribution of the variance of clones to the total variance (more than 60%) in the group of clones from sections Aigeiros and Tacamahaca was for characters: length of the leaf petiole (c), angle between the basal left and right leaf veins, and ratio between the length of leaf petiole and the length of leaf blade (c/a). Barnes (1969) found high interclass correlation coefficients (i.e. contribution of clonal
Residual
0%
10%
20%
30%
40%
50%
60%
70%
80%
90%
100%
Betwee n populations Within populations
Examined characters1)
a
b
c
d
e
f
g
h
i
b/a
f/a
c/b
f/b
Table 2.4. Descriptive statistics of examined leaf morphometric characters in examined Populus nigra populations
1) Labels of leaf morphometric characters: a - length of the leaf blade (mm), b – width of the leaf blade (mm), c – length of the leaf petiole (mm), d – angle between the �rst leaf vein and the horizontal line (O), e – width of the leaf blade at 1 cm from the top (mm), f – distance between the base of leaf blade and the widest part of the blade (mm), g – length of the whole leaf (leaf blade and petiole) (mm), h – number of leaf veins on the left blade side, i - number of leaf veins on the right blade side, and b/a, f/a, c/b, f/b refer to the ratios between particular characters2) Labels of the parameters of descriptive statistics: Cvbetween - coe�cient of variation between populations, Cvwithin - coe�cient of variation within populations, Cvresidual - coe�cient of variation of residual variation
Totalaverage value
80.05
64.69
48.72
43.08
7.33
22.35
127.61
4.84
4.91
0.82
0.71
0.76
0.35
Cvbetween2)
9.01
6.68
7.42
5.34
18.79
18.85
9.80
8.88
8.63
4.25
7.79
3.46
20.61
Cvwithin
10.48
10.12
12.69
11.70
38.05
31.27
11.05
5.31
5.35
10.78
12.62
12.19
34.89
Cvresidual
14.63
16.31
17.67
13.77
52.57
18.85
16.04
8.52
8.21
21.39
9.81
21.36
37.54
min-max
69.37 - 90.40
59.98 - 74.52
43.15 - 54.98
37.80 - 46.87
4.57 - 9.64
17.20 - 34.77
103.70 - 144.39
3.35 - 6.47
3.39 - 6.48
0.74 - 0.88
0.54 - 0.79
0.72 - 0.81
0.27 - 0.58

66 / Variability of European Black Poplar (Populus nigra L.) in the Danube Basin Variability of European Black Poplar (Populus nigra L.) in the Danube Basin / 67
variation to the total variation) in adult trees of P. tremuloides and P. grandidentata for a, b, distance from the tip to the widest part of leaf blade (a-f ). Comtois et al. (1986) reported a significant difference among P. balsamifera populations only for the length of leaf petiole (c), but not for a, b and width at half of leaf blade. Guzina (1988) found high broad-sense heritabilities within the full and half-sib families of P. deltoides (40-80%) for the measured leaf characters describing the leaf blade length and width as well as the petiole length and the number of veins on the right side of the blade. Tomović and Orlović (1994) found high broad-sense heritbilities (higher than 70%) for all the measured and derived leaf morphometric characters in 10 genotypes of section Leuce. Kovačević et al. (2000) in two-annual results in one-year rooted cuttings of 20 genotypes of section Aigeiros found no significant influence of differences among clones for measured leaf morphometric parameters, and high broad-sense heritabilities (60% and higher) for the characters describing ratios between the leaf blade length and width characters. Most of other derived characters also showed a significant influence of differences among clones, with broad-sense heritabilities ranging from 2.0 to 50.8%.
Table 2.5. Pearson’s coefficients of correlation between examined characters in Populus nigra populations*)
According to the coefficients of correlation, the relation among the examined leaf morphometric characters was relatively weak, generally speaking (Table 2.5.). However, a high correlation was found between: length of the leaf blade (a), width of the leaf blade (b), length of the leaf petiole (c) and length of the whole leaf (g), suggesting that these characters share the same information about the difference among populations. The same was between the number of veins on the left and right blade side (h and i), as well as the distance between the base of leaf blade and the widest part of the blade (f ) and characters derived with it (f/a and f/b). This correlation matrix was used in the principal component analysis.
2.3.2. Principal component analysis
According to the communalities with the extracted principal components, it was found that every examined character had its highest communality with some of the first seven principal components. These components explained more than 99% of the total variance (Table 2.6.). Thus, the orthogonal rotation of the first seven principal components with was performed by applying the varimax method. In this way, the variability of communalities within principal components was maximized. The characters that had their highest communality with the same principal component were grouped in the same group. According to the communalities of examined characters with the first seven rotated principal components, it could be concluded that the examined characters are grouped in six groups. These groups were characterized by the high and significant correlations of characters within same groups, and low and mostly non-significant correlations between the characters of different groups (Table 2.5.). All maximum communalities are high (over 0.80), except for the angle between the first leaf vein and the horizontal line (d), and the width of the leaf blade at 1 cm from the top (e). These two characters had relatively moderate, but still not significant coefficients of correlation with other characters. Percentage of explained total variance of particular principal component suggests the influence of related group of characters. Thus, the measured characters a, b, c, and g as the first group and f, f/a and f/b as the second group contributed the most to the discrimination of examined populations (Table 2.7.). It could be said that the first three groups are the most significant ones, as the first three principal components explain more than 70% of total variation among populations. However, it is interesting that the characters that describe the number of veins on the left and right side of the blade (h and i), characters with the highest contribution of differences between populations to the total variation, were related the most with the third principal component. Characters of the first and the second group had much weaker contribution of variance between populations, but high eigenvalues of the first and second principal components suggest that these characters still hold a considerable amount of information on differences between populations, despite a high variability within populations.
a
b
c
d
e
f
g
h
i
b/a
f/a
c/b
f/b
Table 2.5. Pearson’s coe�cients of correlation between examined characters in Populus nigra populations*)
*) Labels of leaf morphometric characters: a - length of the leaf blade (mm), b – width of the leaf blade (mm), c – length of the leaf petiole (mm), d – angle between the �rst leaf vein and the horizontal line (O), e – width of the leaf blade at 1 cm from the top (mm), f – distance between the base of leaf blade and the widest part of the blade (mm), g – length of the whole leaf (leaf blade and petiole) (mm), h – number of leaf veins on the left blade side, i - number of leaf veins on the right blade side, and b/a, f/a, c/b, f/b refer to the ratios between particular characters
a
1.0000
b
0.859**
1.000
c
0.802**
0.818**
1.000
d
-0.234
-0.545
-0.173
1.000
e
-0.682*
-0.373
-0.534
-0.236
1.000
f
0.152
0.068
0.243
0.115
-0.483
1.000
g
0.928**
0.846**
0.886**
-0.148
-0.723**
0.216
1.000
h
0.157
-0.034
0.058
0.481
-0.368
0.175
0.168
1.000
i
0.121
-0.077
0.026
0.485
-0.329
0.170
0.106
0.994**
1.000
b/a
-0.655*
-0.182
-0.364
-0.380
0.754**
-0.190
-0.539
-0.322
-0.316
1.000
f/a
0.296
0.317
0.133
-0.199
0.170
-0.898**
0.206
-0.110
-0.121
-0.109
1.000
c/b
0.034
-0.129
0.456
0.527
-0.341
0.394
0.214
0.056
0.065
-0.296
-0.345
1.000
f/b
-0.179
-0.289
-0.074
0.274
-0.299
0.933**
-0.112
0.138
0.149
-0.078
-0.981**
0.401
1.000

68 / Variability of European Black Poplar (Populus nigra L.) in the Danube Basin Variability of European Black Poplar (Populus nigra L.) in the Danube Basin / 69
Table 2.6. Eigenvalues for extracted principal components
Table 2.7. Communalities for the first seven principal components and examined leaf morphometric characters after orthogonal rotation by varimax method (the highest communality for particular character is bolded)
2.3.3. Discrimination analysis
Canonical discrimination analysis was performed in order to evaluate the significance of examined characters by the values of their standardized coefficients in the canonical variables that explain a significant proportion of total variance. According to the χ2 test, the first eight canonical variables significantly contributed to the discrimination of examined populations (Table 2.9.). Yet, the first four canonical variables explained more that 90% of total variance (Table 2.10.).
Table 2.9. Statistics for successive canonical variables
The characters that have high standardized coefficients with the canonical variables that describe a considerable part of total variance could be evaluated as significant for the discrimination of populations (a, c, h, c/b and f/b have high standardized coefficients with the first canonical variable, and g, h and i have high standardized coefficients with the second canonical variable) (Table 2.10.).
The evaluation of characters by their standardized canonical coefficients does not have the same potential to group characters. Canonical variables are not correlated, and their axes are not ordinated either. Thus, a group of characters that has high standardized coefficients with the first canonical variable are not necessarily correlated among themselves, but show the considerable ability to discriminate populations. Characters: a, c, h, c/b and f/b belong to different (the first four) principal component groups, but they hold different information about differences among populations. Tardif and Hardy (1995) do not support to the use of standardized coefficients of canonical variables, suggesting other statistics of discrimination analysis in the evaluation of discriminative power of examined characters.
Principalcomponent
PC1
PC2
PC3
PC4
PC5
PC6
PC7
PC8
PC9
PC10
PC11
Eigenvalue
4.677
3.719
2.200
1.256
0.763
0.192
0.153
0.035
0.003
0.001
0.000
Table 2.6. Eigenvalues for extracted principal components
*) Labels of leaf morphometric characters: a - length of the leaf blade (mm), b – width of the leaf blade (mm), c – length of the leaf petiole (mm), d – angle between the �rst leaf vein and the horizontal line (O), e – width of the leaf blade at 1 cm from the top (mm), f – distance between the base of leaf blade and the widest part of the blade (mm), g – length of the whole leaf (leaf blade and petiole) (mm), h – number of leaf veins on the left blade side, i - number of leaf veins on the right blade side, and b/a, f/a, c/b, f/b refer to the ratios between particular characters
Percentage oftotal variance
35.978
28.607
16.924
9.664
5.869
1.480
1.176
0.269
0.023
0.008
0.001
CumulativeEigenvalue
4.677
8.396
10.596
11.853
12.616
12.808
12.961
12.996
12.999
13.000
13.000
Cumulative percentageof total variance
35.978
64.585
81.509
91.174
97.043
98.523
99.699
99.968
99.991
99.999
100.000
Examinedcharacters*)
a
b
c
d
e
f
g
h
i
b/a
f/a
c/b
f/b
Eigenvalue
Percentage
of total variance
PC1
0.7740.9270.8380.122
0.252
0.043
0.8630.003
0.000
0.080
0.038
0.011
0.022
3.974
0.306
Table 2.7. Communalities for the �rst seven principal components and examined leaf morphometric characters after orthogonal rotation by varimax method (the highest communality for particular character is underlined)
*) Labels of leaf morphometric characters: a - length of the leaf blade (mm), b – width of the leaf blade (mm), c – length of the leaf petiole (mm), d – angle between the �rst leaf vein and the horizontal line (O), e – width of the leaf blade at 1 cm from the top (mm), f – distance between the base of leaf blade and the widest part of the blade (mm), g – length of the whole leaf (leaf blade and petiole) (mm), h – number of leaf veins on the left blade side, i - number of leaf veins on the right blade side, and b/a, f/a, c/b, f/b refer to the ratios between particular characters
PC2
0.006
0.012
0.000
0.007
0.084
0.9310.000
0.006
0.006
0.000
0.9350.079
0.9463.010
0.232
PC3
0.005
0.004
0.000
0.172
0.052
0.006
0.005
0.9680.9760.039
0.003
0.000
0.004
2.235
0.172
PC4
0.008
0.036
0.149
0.216
0.015
0.009
0.007
0.000
0.001
0.022
0.012
0.8830.019
1.378
0.106
PC5
0.202
0.001
0.004
0.082
0.3350.010
0.069
0.012
0.014
0.8480.010
0.015
0.006
1.608
0.124
PC6
0.000
0.001
0.000
0.002
0.253
0.000
0.032
0.003
0.000
0.000
0.001
0.001
0.001
0.294
0.023
PC7
0.003
0.014
0.007
0.3980.006
0.000
0.003
0.007
0.001
0.010
0.000
0.011
0.002
0.462
0.036
Successive canonicalvariables (roots)
R1
R2
R3
R4
R5
R6
R7
R8
R9
R10
R11
Canonicalcorrelation
0.876
0.719
0.641
0.558
0.403
0.359
0.260
0.235
0.169
0.137
0.060
Eigenvalue
3.293
1.071
0.698
0.451
0.193
0.148
0.072
0.059
0.029
0.019
0.004
Wilks' Lambda
0.028
0.120
0.248
0.421
0.611
0.729
0.837
0.897
0.950
0.978
0.996
X2 test
1261.969**
748.374**
491.657**
305.002**
173.716**
111.406**
62.793**
38.201*
18.091
7.906
1.267
Table 2.9. Statistics for successive canonical variables

70 / Variability of European Black Poplar (Populus nigra L.) in the Danube Basin Variability of European Black Poplar (Populus nigra L.) in the Danube Basin / 71
Table 2.10. Standardized coefficients of canonical variables
Discriminative loadings reveal differentiation among the examined characters quite similar to differentiation obtained by the principal component analysis (Table 2.11.). However, the discrimination loadings with canonical variables suggest a high discrimination power of characters describing the number of veins (h and i), while by the principal component analysis, these characters were classified in the third group. The reason could be that the information of within-population variation is not incorporated in the principal component analysis as it is in the discriminant analysis. So, a high contribution of between-population variance to the total variance was enabled to influence discrimination in the discrimination analysis. Kovačević et al. (1999) and Kovačević et al. (2010), working on the group of poplar genotypes from section Aigeiros, incorporated the information of within-genotype variation of examined characters in the principal component analysis by the standardization of genotype means with the within-genotype standard deviation and the implementation of covariance matrix in the analysis in order to preserve the effect. Barnes (1975) used discrimination loadings with canonical variables in discrimination of the populations of Populus tremuloides and found the highest discrimination power for the ratio between the width and the length of leaf blade, the length between the blade basis and the widest point of leaf blade and the number of teeth.
Table 2.11. Discriminative loadings between examined and canonical variables
Stepwise discrimination analysis evaluates the discrimination power of characters in another way, bringing additional information. By both forward and backward stepwise discrimination analysis the number of veins on the left side of leaf blade (h) was first to be included and last to be removed from the model, respectively. This confirms the importance of inclusion of the information of variation within populations for their proper discrimination. The models with four characters derived by both forward and backward stepwise discrimination methods achieved more than 50% of correct allocation (Graphs 2.2. and 2.3.). These results suggest that the majority of characters weakly contribute to correct allocation, meaning that the main partition of discriminative information is described by a relatively small group of characters. This emphasizes the significance of multicolinearity among the examined characters. The most of characters in the four character models are the same regardless the way of stepwise discrimination analysis performed, and belong to one of the first three principal component groups. The character h (number of veins on the left side of the blade) was the first character to be included in the forward and the last to be excluded in the backward stepwise discrimination analysis. The f/a character that was included in the third step of forward stepwise discrimination analysis is the only derived character in four character discrimination models, suggesting that the measured leaf morphometric characters were fairly enough to describe differences among populations in this research, and may be for Populus nigra populations along the river Danube. However, the conclusion for the discrimination within the whole areal requires wider research. Therefore, the
Examined Characters1)
a
b
c
d
e
f
g
h
i
b/a
f/a
c/b
f/b
Eigenvalue
Cumulative
proportion
R1
-0.9840.015
0.5850.351
-0.297
-0.188
0.166
0.6560.420
-0.078
0.172
-0.6760.7453.293
0.545
Table 2.10. Standardized coe�cients of canonical variables
1) Labels of leaf morphometric characters: a - length of the leaf blade (mm), b – width of the leaf blade (mm), c – length of the leaf petiole (mm), d – angle between the �rst leaf vein and the horizontal line (O), e – width of the leaf blade at 1 cm from the top (mm), f – distance between the base of leaf blade and the widest part of the blade (mm), g – length of the whole leaf (leaf blade and petiole) (mm), h – number of leaf veins on the left blade side, i - number of leaf veins on the right blade side, and b/a, f/a, c/b, f/b refer to the ratios between particular characters2) Standardized coe�cients higher than 0,500 are bolded
R2
0.095
-0.279
-0.237
-0.020
-0.063
0.382
1.1511.550-1.5800.313
0.128
-0.159
-0.338
1.071
0.723
R3
-1.7110.867-0.359
0.258
-0.957-0.236
0.8320.476
-0.6950.045
-0.455
0.179
0.364
0.698
0.838
R4
1.153-0.175
-0.296
-0.458
-0.148
1.616-0.855-1.0011.0320.298
-0.306
0.668-1.2180.451
0.913
R5
-1.3340.272
1.4320.466
0.209
1.478-0.109
-0.5820.582-0.5421.256-0.440
-0.304
0.193
0.945
R6
0.757-0.477
-0.5760.511-0.336
0.430
-0.093
-0.5040.372
0.351
0.198
0.530-0.391
0.148
0.970
R7
0.189
-1.9352.639-0.313
-0.827
-1.9560.007
-0.5280.496
0.160
-1.812-2.325-0.045
0.072
0.982
R8
0.809
-2.9951.985-0.445
0.7450.108
0.471
0.485
-0.498
0.6100.544-1.7150.7070.059
0.991
R9
-2.5840.5412.218-0.126
-0.056
0.789-0.181
0.642-0.686-2.6890.544-2.356-0.094
0.029
0.996
R10
-0.7851.4631.039-0.021
0.114
-5.8800.613-0.6700.722-1.209-1.327-1.2234.8860.019
0.999
R11
1.015-3.3374.2950.343
-0.308
-1.246-0.5700.590-0.6881.8862.470-4.1224.0810.004
1.000
Canonical variable 2)Examined Characters1)
a
b
c
d
e
f
g
h
i
b/a
f/a
c/b
f/b
Eigenvalue
Cumulative
proportion
R1
-0.032
-0.090
-0.031
0.153
-0.082
0.095
-0.010
0.8310.807-0.048
-0.108
0.028
0.107
3.293
0.545
Table 2.11. Discriminative loadings between examined and canonical variables
1) Labels of leaf morphometric characters: a - length of the leaf blade (mm), b – width of the leaf blade (mm), c – length of the leaf petiole (mm), d – angle between the �rst leaf vein and the horizontal line (O), e – width of the leaf blade at 1 cm from the top (mm), f – distance between the base of leaf blade and the widest part of the blade (mm), g – length of the whole leaf (leaf blade and petiole) (mm), h – number of leaf veins on the left blade side, i - number of leaf veins on the right blade side, and b/a, f/a, c/b, f/b refer to the ratios between particular characters2) The highest loading of particular character is bolded
R2
0.6680.4920.420
-0.059
-0.333
0.086
0.7890.296
0.154
-0.168
0.146
0.020
-0.096
1.071
0.723
R3
-0.372
-0.212
-0.061
0.107
-0.095
0.417
-0.092
-0.387
-0.451
0.149
-0.5380.157
0.477
0.698
0.838
R4
0.443
0.275
0.275
-0.192
-0.255
0.6910.250
0.023
0.120
-0.158
-0.535
0.071
0.5540.451
0.913
R5
0.114
0.245
0.7440.255
0.091
0.011
0.341
-0.052
0.025
0.048
0.075
0.538-0.087
0.193
0.945
R6
0.342
-0.486
-0.022
0.749-0.632
0.073
0.193
-0.091
-0.038
-0.7940.063
0.376
0.195
0.148
0.970
R7
0.021
-0.031
0.249
-0.381
-0.447-0.437
0.138
0.106
0.196
-0.016
0.393
0.177
-0.442
0.072
0.982
R8
-0.203
-0.524
0.057
-0.003
0.241
0.256
0.017
-0.041
-0.097
-0.224
-0.340
0.414
0.378
0.059
0.991
R9
0.041
-0.092
-0.175
-0.004
-0.149
0.114
-0.093
-0.050
-0.113
-0.360
-0.022
-0.184
0.092
0.029
0.996
R10
0.203
0.085
0.135
-0.076
-0.112
0.055
0.293
-0.036
0.084
-0.207
-0.009
0.119
0.173
0.019
0.999
R11
0.058
0.156
-0.066
0.156
0.041
0.108
-0.142
-0.104
-0.157
0.192
-0.066
-0.273
0.094
0.004
1.000
Canonical variable 2)

72 / Variability of European Black Poplar (Populus nigra L.) in the Danube Basin Variability of European Black Poplar (Populus nigra L.) in the Danube Basin / 73
derived characters should be used in the future because they might be important in discrimination of other distant populations that evolved in different conditions.
Graph 2.2. Percentage of allocation according to the model calculated by the forward stepwise discrimination analysis*)
*) - from left to right: the character in the column is included in the particular discrimination model
Graph 2.3. Percentage of allocation according to the model calculated by the backward stepwise discrimination analysis*)
*) - from left to right: the character in the column is excluded from the previous discrimination model
2.4. Relationship between the populations of Populus nigra
According to the results of the principal component analysis, the first four principal components described more than 90% of the total variance (Table 2.12.). The first three principal components (explained 81.5% of the total variance) were used to present relations among the examined populations (Graph 2.4.). It seems that populations Dunajské luhy, Fertő-Hanság, Duna Ipoly and Neuburg-Ingolstadt are considerably apart from the others.
Graph 2.4. Relation among the examined populations of Populus nigra based on the first three principal components *)
*) Lables for populations: A (NPDA) - Donau-Auen National Park, SK (PLADL) - Protected landscape area Dunajské luhy, H (DDNP) - Danube-Drava National Park, BG (NPRL) - Nature Park Rusenski Lom, BG (PNP) - Persina Nature Park, H (DINP) - Danube Ipoly National Park, HR (NPLP) - Lonjsko Polje Nature Park, D (DNI) - Donauauwald Neuburg-Ingolstadt, RO (DDBR) - Danube Delta Biosphere Reserve, H (FHNP) - Fertő-Hanság National Park, HR (NPKR) - Nature Park Kopački Rit, SRB (SNRGP) – Special Nature Reserve Gornje Podunavlje
Allocation by discrimination functions based on all examined characters was 60.38% correct. The most correct allocation (90%) was recorded for the populations Donau Auen and Neuberg-Ingolstadt. The least correct allocation was for the population Dunajské luhy, whose trees were mostly allocated in the population Danube Ipoly
0
10
20
30
40
50
60
70
80
90
100
0
10
20
30
40
50
60
70
80
90
100

74 / Variability of European Black Poplar (Populus nigra L.) in the Danube Basin Variability of European Black Poplar (Populus nigra L.) in the Danube Basin / 75
and Gornje Podunavlje, and Gornje Podunavlje, whose trees were mostly allocated in the population Kopački rit and Danube Ipoly (Table 2.13.). The squared Mahalanobis distances calculated upon discrimination functions based on all examined characters are presented in Table 2.14.
Table 2.13. Allocation of trees from examined populations by discrimination functions based on all examined characters
Table 2.14. Matrix of squared Mahalanobis distances
Three measures of distance among populations were calculated in this research: squared Euclidian distance based on standardized examined characters (SEDec), squared Mahalanobis distances based on the scores of linear discrimination analysis (SMD)
and Euclidian distances based on the scores of the first three principal components (EDpc). The relationship among them was examined by the Spearman’s rank correlation coefficient. All distances show high correlations among themselves: rS(SEDec:SMD)=0,602**; rS(SEDec:EDpc)=0,947**; rS(SMD:EDpc)=0,534**. This is in concordance with the results of Kovačević (1996), who examined the variability of 23 measured and derived leaf morphometric characters in 20 genotypes of eastern cottonwood. Lower correlations of squared Mahalanobis distances with others could be explained by the fact that the information of within-population variation is incorporated in them. High correlations between the square Euclidian distances based on all characters (used for the cluster analysis) and the square Euclidian distances based on the first three principal components suggest a correct representation of relations among the examined populations by 3D graph based on the first three principal components.
On this graph, four groups can be visually observed:
a) The main group that included: Donau Auen, Persina, Kopački rit, Gornje Podunavlje, Danube-Drava, Rusenski lom, Lonjsko polje, Danube delta
b) Dunajské luhyc) Neuburg-Ingolstadtd) Fertő-Hanság, Danube Ipoly.
A cluster analysis was performed in order to analyze the grouping of examined populations according to similarities among them. According to the Scree-test, the groups were defined at the distance 20 (Graph 2.5.). A dendrogram based on squared Euclidian distances shows the structure of relations among the examined populations based on similarities. According to distances, it could be said that the neighboring populations are usually similar to each other. Five groups were defined (Graph 2.6.).
Graph 2.5. Scree test of the agglomeration of examined populations
Populations from
which the trees
are allocated
Fertő-Hanság
Kopački rit
Lonjsko polje
Donau Auen
Danube-Ipoly
Dunav-Drava
Persina
Rusenski lom
Dunajské luhy
Danube delta
Neuburg-Ingolstadt
Gornje Podunavlje
Total
Table 2.13. Allocation of trees from examined populations by discrimination functions based on all examined characters
Population by which the discrimination functions are de�ned Percent
(Correct)
56.25
43.33
60.00
90.00
56.67
63.33
64.71
80.00
30.00
56.67
90.00
33.33
60.38
Fertő-
Hanság
18
1
0
0
6
0
0
0
0
0
1
1
27
Kopački
rit
0
13
0
3
0
2
5
3
0
0
0
8
34
Lonjsko
polje
0
0
18
0
0
4
0
1
0
6
0
0
29
Donau
Auen
0
2
1
27
0
1
0
0
0
1
0
0
32
Danube
Ipoly
4
3
0
0
17
0
2
0
13
0
0
5
44
Danube-
Drava
2
8
7
0
1
19
1
0
1
4
0
1
44
Persina
0
0
0
0
0
0
22
0
0
0
1
0
23
Rusenski
lom
3
3
0
0
1
1
1
24
0
0
0
4
37
Dunajské
luhy
0
0
0
0
0
0
0
0
9
0
1
0
10
Danube
delta
1
0
3
0
0
2
3
1
0
17
0
1
28
Neuburg-
Ingolstadt
3
0
0
0
3
0
0
0
2
0
27
0
35
Gornje
Podunavlje
1
0
1
0
2
1
0
1
5
2
0
10
23
Fertő-Hanság
Kopački rit
Lonjsko polje
Donau Auen
Danube-Ipoly
Dunav-Drava
Persina
Rusenski lom
Dunajské luhy
Danube delta
Neuburg-Ingolstadt
Gornje Podunavlje
Table 2.14. Matrix of squared Mahalanobis distances
Fertő-
Hanság
0.00
14.44
12.44
33.17
1.92
15.05
20.76
8.73
9.38
13.96
9.77
8.61
Kopački
rit
14.44
0.00
5.03
6.17
7.51
1.88
9.54
4.04
11.33
6.48
25.54
1.86
Lonjsko
polje
12.44
5.03
0.00
12.52
9.39
2.94
16.66
6.07
12.13
2.85
30.41
4.76
Donau
Auen
33.17
6.17
12.52
0.00
23.75
6.43
17.71
14.36
23.26
11.62
48.32
12.51
Danube
Ipoly
1.92
7.51
9.39
23.75
0.00
9.01
14.45
6.00
6.36
11.87
9.59
3.54
Danube-
Drava
15.05
1.88
2.94
6.43
9.01
0.00
12.82
5.76
11.63
4.02
30.26
3.08
Persina
20.76
9.54
16.66
17.71
14.45
12.82
0.00
12.24
17.01
15.45
28.90
10.32
Rusenski
lom
8.73
4.04
6.07
14.36
6.00
5.76
12.24
0.00
14.74
5.47
22.33
3.21
Dunajské
luhy
9.38
11.33
12.13
23.26
6.36
11.63
17.01
14.74
0.00
15.53
11.58
8.64
Danube
delta
13.96
6.48
2.85
11.62
11.87
4.02
15.45
5.47
15.53
0.00
34.26
7.03
Neuburg-
Ingolstadt
9.77
25.54
30.41
48.32
9.59
30.26
28.90
22.33
11.58
34.26
0.00
17.31
Gornje
Podunavlje
8.61
1.86
4.76
12.51
3.54
3.08
10.32
3.21
8.64
7.03
17.31
0.00

76 / Variability of European Black Poplar (Populus nigra L.) in the Danube Basin Variability of European Black Poplar (Populus nigra L.) in the Danube Basin / 77
Graph 2.6. Dendrogram of cluster analysis for examined Populus nigra populations based on squared Euclidian distances calculated from standardized leaf morphometric characters and grouped by unweight pair-group average method (UPGMA)
The agglomeration performed by UPGMA agglomeration method on squared Euclidian distances and the Scree test suggest that the examined populations could be divided in five groups:
1. Dunajské luhy2. Danube delta, Lonjsko polje3. Fertő-Hanság, Danube Ipoly4. Neuburg-Ingolstadt5. Kopački rit, Gornje Podunavlje, Dunav Drava, Rusenski lom, Donau Auen, Persina.
Thus, the German, Slovak and two Hungarian populations were grouped in separate clusters, while the Austrian, one Hungarian, Croatian, Serbian and Bulgarian populations were grouped in one main cluster. The Romanian population is in a separate cluster, but the agglomeration of Croatian population Lonjsko polje with it was unexpected. This could be partially explained by the results of molecular markers given in Chapter 3, which suggest that the population Lonjsko polje has probably recently gone through a serious decrease in size and variability. The agglomeration of Hungrian population Danube-Drava with the main cluster, separate from other two Hungarian populations, could be explained by the fact that this population is in close vicinity of Kopački rit and Gornje Podunavlje populations, and thereby the similarity with them could be expected.
Considering the principal components that discriminate populations, it could be said that the main group is characterized with a weak variation along the second principal
component, suggesting a small difference among these populations in distance between the base of leaf blade and the widest part of the blade and related characters (f, f/a and f/b). The main differentiation among them occurs along the first principal component, suggesting strong differences in related characters of the first group, that describe the size of the leaf blade (a, b, c, g). Among these populations, the leaf size increases from Donau Auen and Persina populations with small leaves towards Lonjsko polje and Danube delta populations with large leaves. A smaller effect was achieved by the third principal component: form Donau Auen and Danube delta with less to Gornje Podunavlje and Rusenski lom with more veins at one side on the leaf blade. Dunajské luhy was separated from the main cluster by the second principal component i.e. by longer distance between the base of leaf blade and the widest part of the blade and related characters, while Neuburg-Ingolstadt was separated by both second and third principal component, i.e. by longer distance between the base of leaf blade and the widest part of the blade and related characters and more veins on one side of the leaf blade. The Hungarian populations Fertő-Hanság and Danube Ipoly differed from the populations of main cluster mostly by the third principal component, as they had more veins at one side of the blade, and partially by the first principal component, regarding larger leaves. The results of principal component analysis suggest that the populations Lonjsko polje and Danube delta are not significantly distinct from other populations of main cluster, but are incorporated in variability within the same cluster probably due to the specificities of their habitats.
2.4.1. Implications of alternative standardization of data by standard deviation within population
Throughout the research, some results suggested the importance of within-population variability, particularly in the description of relations among populations by applying multivariate methods. It was found that the correlation of squared Mahalanobis distances (SMD) derived by linear discrimination analysis with squared Euclidian distance based on standardized examined characters (SEDec), and Euclidian distances based on the scores of the first three principal components (EDpc), was significant, but relatively moderate. It was suggested that the reason is in fact that only Mahalanobis distances contained information about variation within population. Kovačević et al. (1999, 2010, 2011) incorporated this information in multivariate data by standardization with standard deviation within the examined genotypes. Now standardization was performed by residual standard deviation from one-way ANOVA based on tree average values. The covariance matrix was used in PCA in order to preserve the effect. The squared Euclidian distances (SEDsdwp) and the Euclidian distances based on the scores of the first three principal components (EDpcsdwp) calculated after such standardization were still highly correlated (rS(SEDsdwp:EDpcsdwp)=0.996**), but now with considerably higher correlation with the squared Mahalanobis distances (rS(SEDsdwp:SMD)=0.862** and rS(SMD:EDpcsdwp)=0,854**, respectively). So, the correlations with the squared Mahalanobis distances were more the 0.25 higher, which could mean a significant contribution to the description of relations among populations by the cluster analysis and the principal component analysis.
The first three principal components explained 96.23% of total variation. The characters related to the first principal component were the number of veins on the left and right

78 / Variability of European Black Poplar (Populus nigra L.) in the Danube Basin Variability of European Black Poplar (Populus nigra L.) in the Danube Basin / 79
side of the leaf blade (h and i), and the characters that described the size of leaf were related to the second one (Table 2.15.). This is also in concordance with the results of the canonical discriminate analysis, especially with discriminative loadings.
Table 2.15. Communalities for all principal components and examined leaf morphometric characters after standardization with residual standard deviation from one-way ANOVA based on tree average values (the highest communality for particular character is bolded)
Regarding the relation of characters with principal components, it could be said that the relations between populations were similar, but not the same as relations obtained by EDpc distances. The correlation between them is rS(EDpc:EDpcsdwp)=0.727**. The populations that appeared to be distinct from others are Dunajské luhy by the third principal component i.e. by longer distance between the base of leaf blade and the widest part of the blade and related characters, and Neuburg-Ingolstadt by both first and second principal component, i.e. by more veins on one side of the leaf blade and longer distance between the base of leaf blade and the widest part of the blade and related characters (Graph 2.7.).
Graph 2.7. Relation among the examined populations of Populus nigra based on the first three principal components after standardization with residual standard deviation from one-way ANOVA based on tree average values*)
*) Lables for populations: A (NPDA) - Donau-Auen National Park, SK (PLADL) - Protected landscape area Dunajské luhy, H (DDNP) - Danube-Drava National Park, BG (NPRL) - Nature Park Rusenski Lom, BG (PNP) - Persina Nature Park, H (DINP) - Danube Ipoly National Park, HR (NPLP) - Lonjsko Polje Nature Park, D (DNI) - Donauauwald Neuburg-Ingolstadt, RO (DDBR) - Danube Delta Biosphere Reserve, H (FHNP) - Fertő-Hanság National Park, HR (NPKR) - Nature Park Kopački Rit, SRB (SNRGP) – Special Nature Reserve Gornje Podunavlje
According to the cluster analysis and the Scree test (Graph 2.8.), the agglomeration of examined populations was a bit different after the standardization with standard deviation within population. The main difference is that the population Donau-Auen is in separate cluster, by the higher number of veins. Also, the main cluster has changed, grouping together the population Danube-Drava from Hungary and the populations of Croatia, Serbia, Bulgaria and Romania (Graph 2.9.).
Examined Characters*)
a
b
c
d
e
f
g
h
i
b/a
f/a
c/b
f/b
Eigenvalue
Percentage of
total variance
PC1
0.045
0.000
0.013
0.241
0.188
0.057
0.047
0.9910.9830.149
0.021
0.012
0.035
5.260
56.024
PC2
0.9070.8440.7740.118
0.3540.007
0.9060.002
0.009
0.236
0.120
0.009
0.066
2.254
24.005
PC3
0.000
0.004
0.027
0.016
0.162
0.9130.011
0.004
0.004
0.015
0.8340.233
0.8921.229
13.089
PC4
0.001
0.135
0.000
0.4970.127
0.018
0.003
0.001
0.001
0.3880.025
0.303
0.001
0.334
3.555
PC5
0.032
0.003
0.167
0.034
0.056
0.002
0.004
0.000
0.000
0.143
0.000
0.3890.004
0.184
1.963
PC6
0.013
0.000
0.013
0.004
0.051
0.001
0.021
0.002
0.002
0.059
0.001
0.023
0.001
0.068
0.720
PC7
0.001
0.005
0.005
0.077
0.045
0.002
0.001
0.000
0.000
0.000
0.000
0.027
0.001
0.040
0.426
PC8
0.000
0.008
0.001
0.012
0.017
0.000
0.006
0.000
0.000
0.006
0.000
0.002
0.000
0.019
0.198
PC9
0.000
0.000
0.000
0.000
0.000
0.000
0.000
0.000
0.000
0.002
0.000
0.001
0.000
0.001
0.013
PC10
0.000
0.000
0.000
0.000
0.000
0.000
0.000
0.000
0.000
0.000
0.000
0.000
0.000
0.001
0.006
PC11
0.000
0.000
0.000
0.000
0.000
0.000
0.000
0.000
0.000
0.000
0.000
0.000
0.000
0.000
0.001
Table 2.15. Communalities for all principal components and examined leaf morphometric characters after standardization with residual standard deviation from one-way ANOVA based on tree average values (the highest communality for particular character is underlined)
*) Labels of leaf morphometric characters: a - length of the leaf blade (mm), b – width of the leaf blade (mm), c – length of the leaf petiole (mm), d – angle between the �rst leaf vein and the horizontal line (O), e – width of the leaf blade at 1 cm from the top (mm), f – distance between the base of leaf blade and the widest part of the blade (mm), g – length of the whole leaf (leaf blade and petiole) (mm), h – number of leaf veins on the left blade side, i - number of leaf veins on the right blade side, and b/a, f/a, c/b, f/b refer to the ratios between particular characters

80 / Variability of European Black Poplar (Populus nigra L.) in the Danube Basin Variability of European Black Poplar (Populus nigra L.) in the Danube Basin / 81
Graph 2.8. Scree test of the agglomeration of examined populations after standardization with standard deviation within population
Graph 2.9. Dendrogram of cluster analysis for the examined Populus nigra populations based on squared Euclidian distances calculated from leaf morphometric characters standardized by standard deviation within population and grouped by unweight pair-group average method (UPGMA)
2.5. Concluding remarks
The presented results provide an important basis for further work on description, preservation and improvement of diversity in Populus nigra in the Danube River Basin. They suggest that leaf morphometric characters can significantly contribute to intra- and interpopulation variability description in Populus nigra populations. The fact that the discriminative model with all characters achieved less then 60.38% of correct allocation, due to a high variability of examined characters within populations, suggests that it is necessary to include other morphological characters and certainly molecular markers in order to discriminate the examined populations completely.
Leaf morphometric characters play an important role in the taxonomy and populations studies in poplars. Similar research has been recently performed in two other endangered species in Serbia: service tree (Sorbus domestica)(Mikić et al., 2008) and wild cheery (Prunus avium)(Mikić et al., 2012). However, variability description according to molecular markers in poplars is dominant nowdays (Smulders et al., 2008; Orlović et al., 2009). In many studies reviewed by Wu et al. (1997), it is evident that especially leaf size traits showed high heritability. Because these traits are genetically controlled by many QTL’s, leaf characters could not be regarded as markers, but as a result of interaction of multiple loci. According to Burstin and Charcosset (1997), both theoretical and experimental data suggest that low marker distances are associated with low phenotypic distances, while high marker distances are associated to either low or high phenotypic distances. Also, size and shape of leaf could be related to the specificities of habitat (Marcet, 1961; Ying and Bagley, 1976), giving the basis to relate populations according to the conditions in that they grew and evolved. Burstin and Charcosset (1997) also emphasize that correlation between marker and phenotypic distances decrease with increase in the number of QTL’s involved in the variation of traits. Regarding these facts also, leaf characters could be expected to be poorly related to markers. Rajora et al. (1991) and Pigliucci et al. (1991) did not find colinearity between morphometric characters and biochemical markers they examined, while the nature of molecular markers and QTL’s suggests no significant or weak colinearity between phenotypic characters and molecular markers either (Burstin and Charcosset, 1997). Considering this, leaf morphometric characters are still important for bringing new information about similarities and differences among populations that could be used as such or combined with the results obtained by molecular markers. That would be particularly important in case of genetically similar populations where used molecular marker systems have failed to discriminate them sufficiently. Therefore, as morphometric characters, biochemical and molecular markers carry different information, together they could contribute more to discrimination of the populations of Populus nigra.

82 / Variability of European Black Poplar (Populus nigra L.) in the Danube Basin Variability of European Black Poplar (Populus nigra L.) in the Danube Basin / 83
Barnes, V.B. (1969): Natural variation and delineation of clones of Populus tremuloides and Populus grandidentata in Northern Lower Michigan. Silvae genetica, 18 (4): 130-142.
Barnes, V.B. (1975): Phenotypic variation of trembling aspen in western North America. Forest Science 22(3): 319-328.
Barnes, V.B., Han, F. (1992): Phenotypic variation of Chinese aspens and their relationship to similar taxa in Europe and North America. Canadian Journal of Botany, 71: 799-815.
Burstin, J., Charcosset, A. (1997): Relationship between phenotypic and marker distances: theoretical and experimental invetigations. Heredity, 79: 477-483.
Camussi, A., Stefanini, F.M. (2005): La classificazione di cloni di pioppo con metodi montecarlo: le foreste casuali. Forest, 2(2): 217-224.
Comtois, P., Simon, J.P., Payette, S. (1986): Clonal constitution and sex ratio in northern populations of balsam poplar Populus balsamifera. Holarctic Ecology, 9: 251-260.
Hettemer, H.H. (1969): Unterscheidung von Papelklonen. I) Die Variation einzelner Merkmale. Silvae genetica, 18 (5-6):167-172.
Guzina, V. (1988): Procena varijabilnosti topola pomoću parametara veličine i forme lista i polimorfizma izoenzima. Topola, 153-154: 35-40. [In Serbian]
Eckenwalder, J.E. (1996): Taxonomic signal and noise in multivariate interpopulational relationships in Populus mexicana (Salicaceae). Systematic botany, 21(3): 261-271.
Kajba, D., Romanić, B. (2002): Morphological leaf variability of the European black poplar (Populus nigra L.) in natural populations in the Drava River Basin in Croatia. Proceeding of International symposium Genetic diversity of river populations of European Black Poplar-implications for reparian eco-system management, Szekszard, Hungary, 16-20 May 2001: 221-227.
Keiser, H.F. (1958): The varimax criterion for analytical rotation in factor analysis. Psychometrika, 23: 187-200.
Kendal, M. (1980): Multivariate analysis. Second edition, Charl Griffin and company LTD, London and High Wycombe.
Koskela, J., S.M.G. de Vries, D. Kajba and G. von Wuhlisch (Eds.) (2004): Populus nigra Network, Report of seventh (25–27 October 2001, Osijek, Croatia) and eighth meetings (22–24 May 2003, Treppeln, Germany). International Plant Genetic Resources Institute, Rome, Italy.
Kovačević, B. (1996): Variability of leaf morphometric parameters of eastern cottonwood (Populus deltoides Bartr.). MSc Thesis, Faculty of agriculture, University of Novi Sad. [In Serbian]
Kovačević, B., Cobanovic, K., Orlovic, S., Nikolić-Đorić, E. (2010a): Relationship among black poplar genotypes based on cutting rooting and surival - a multivariate approach. Biometrical Letters 47(1): 15-32.
Kovačević, B., Guzina, V. (1997): Variability of rooted cuttings of eastern cottonwood and its hybrids under influence of soil properties. Papers of the Ninth Congress of the Yugoslav Society of Soil Science, 23-27 June 1997, Novi Sad: 769-776.
References:
84 / Variability of European Black Poplar (Populus nigra L.) in the Danube Basin Variability of European Black Poplar (Populus nigra L.) in the Danube Basin / 85
Kovačević, B., Guzina, V., Kraljević-Balalić, M. (2000): Analysis of discrimination ability of leaf morphometric parameters in eastern cottonwood (Populus deltoides Bartr.) clones and hybrids. Genetika, 32(1): 19-30.
Kovačević, B., Guzina, V., Kraljević-Balalić, M., Nikolić, E. (1999): Alternative ways of standardization in multivariate description of similarity among clones and hybrids of Populus deltoides Bartr. Matica srpska - Proceedings for natural sciences: 81-98.
Kovačević, B., Guzina, V., Orlovic, S., Kraljevic - Balalic, M. (1995): Variability of leaf morphometric parameters of intra- and interspecies hybrid families of eastern cottonwood (Populus deltoides Bartr.). Genetika, 27(3), 201 - 209.
Kovačević B., Orlovic., S., Ivanovic, M., Cobanovic, K., Nikolic-Doric, E., Katanic, M., Galovic, V. (2011): Relationship among eastern cottonwood genotypes according to early rooting traits. Genetika, 43(2): 307-320.
Kovačević, B., Tomović Z., Štajner, D., Katanić M., Drekić, M., Stojnić, S. (2010b): Restoracija autohtonih vrsta topola (Populus sp.) u aluvijalnim područjima – formiranje genofonda. Topola 185/186: 61-68 [In Serbian]
Krstinic, A., Trinajstic, I., Kajba, D., Samardjic, J. (1998): Morphological variability of the leaves of black poplar (Populus nigra L.) in natural stands along the Sava river (Croatia). In: Turok, J., Lefevre, F., de Vries, S., Alba, N., Heinze, B., Van Slycken, J. (Eds.). Populus nigra Network. Report of the fourth meeting, 3-5 October 1997, Geraardsbergen, Belgium. International Plant Genetic Resources Institute, Rome: 71-77.
Lefèvre, F., Légionnet, A., de Vries, S., Turok J. (2001): Strategies for the conservation of a pioneer tree species, Populus nigra L., in Europe. Genetics Selection Evolution, 30(Suppl 1): S181-S196.
Marcet, E. (1961): Über die geographische Variabilität blattmorphologischer Merkmale bei Populus deltoides Bartr. Silvae Genetica 10(6): 161-172.
Mikić, T., Orlović, S., Marković, M., Kovačević, B., Pilipović, A. (2008): Variability in service tree (Sorbus domestica L.) populations in Serbia. Lesnicky časopis - Forestry journal, Supplement I: 29-36
Mikić, T., Ballian, D., Kovačević, B., Pilipović, A., Marković, M. (2012): Preliminary results on the variability of wild cherry (Prunus avium L.) in some populations in Serbia. Proceedings of International Scientific Conference Forest in Future: Sustainable Use, Risks and Challenges, 4th-5th October 2012, Belgrade, Republic of Serbia: 151-160.
Orlović, S., Galović, V., Zorić, M., Kovačević, B., Pilipović, A., Galić, Z. (2009): Evaluation of interspecific DNA variability in poplars using AFLP and SSR markers. African Journal of Biotechnology 8(20): 5241-5247.
Pigliucci, M., Malvolti, M.E., Fineschi, S. (1991): Relationship between protein polymorphism and phenotypic variation in Populus deltoides Bartr. Hererditas, 114: 79-84.
Rajora, O.P., Zuffa, L., Dancik, B.P. (1991): Allozyme and leaf morphological variation of eastern cottonwood at the northern limits of its range in Ontario. Forest science, 37(2): 688-702.
Smulders, M. J. M., Beringen, R., Volosyanchuk, R., Vanden Broeck, A., van der Schoot, J., Arens, P., Vosman, B. (2008): Natural hybridisation between Populus nigra L. and P. x canadensis Moench. Hybrid offspring competes for niches along the Rhine river in the Netherlands. Tree Genetics & Genomes, DOI 10.1007/s11295-008-0141-5
StatSoft, Inc. (2012). STATISTICA (data analysis software system), version 12.
Tardif. B., Hardy, J. (1995): Assessing the Relative Contribution of Variables in Canonical Discriminant Analysis. Taxon, 44(1): 69-76.
Tomović, Z., Orlović. S. (1994): Variability and heredity of leaf morphological parameters in poplar in section Leuce clones. Genetika, 26(3): 201–206.
Thurstone, L.L. (1969): Multiple-factor analysis. 8th impression. The University of Chicago.
UPOV (1981): Guidelines for the conduct of test for the distinctnes, homogenity and stability – Populus L. International union for the protection of new varieties of plants. Genewa, Switzerland
Van Slycken, J. (1996): Plant descriptor for Populus nigra. In: Turok, J., F. Lefevre, L. Cagelli and S. de Vries (Eds.) Populus nigra Network, Report of the second meeting, 10-12 September 1995, Casale Monferato, Italy: 13–24.
Viart, M. (1992): International register of cultivars of Populus. Proceedings of 19th session of the International Poplar Commission, Zaragosa, 22.-25.09.1992: 57–105.
Wu, R., Bradshaw, Jr., H. D., Stettler, R. F. (1997): Molecular genetics of growth and
development in Populus (Salicaceae). V. Mapping quantitative trait loci affecting leaf variation. American journal of botany 84(2): 143–153.
Ying, C.C., Bagley, W.T. (1976): Genetic variation of eastern cottonwood in an Eastern Nebraska provenance study. Silvae Genetica 25(2): 67–73.

86 / Variability of European Black Poplar (Populus nigra L.) in the Danube Basin Variability of European Black Poplar (Populus nigra L.) in the Danube Basin / 87
3.1. Genetic variability in natural populations
The organic world is extremely diverse, and this diversity of life is one of the most striking aspects of our planet. The strong illustration of this incredible diversity is the number of all species, precisely unknown, but until now, 1.4 - 1.8 million species has been described (Stork, 1988; Hammond, 1992). Estimates of the actual number of species are much higher, ranging from 3 million to even 100 million (May, 2010). A recent study suggests the number of species that exist on Earth is about 8.7 million (± 1.3 million) among which 7.77 million species of animals, 298,000 of plants, 611,000 of fungi, 36,400 of protozoa and 27,500 of chromists, which include various algae and water molds (Mora et al., 2011). Only a fraction of these species has been identified, predicting that 86% of all terrestrial species and 91% of all marine species have yet to be discovered, described and classified. However, these numbers represent only one percent of all plant and animal species that have so far existed on Earth, the other 99% have gone extinct (Novacek, 2000).
Even in the populations of the same species, there may be considerable variability. Moreover, stating that variation exists in a population is just another way of saying that differences exist among individuals. The variation which can be scored in the easiest way is phenotypic variability and its existence means that individuals in a population differ in their appearances (coloration, morphology), behavior, physiology, life history traits and other biological functions. Behind this phenotypic variability present in natural populations, lies genetic variability, hereditary variation caused by variant forms of genes, which are, in most cases, sensitive to environmental influences. Genes have a variety of functions and the most important is information for the production of specific protein. Genes regulate body size, shape, physiological processes, behavioral traits, reproductive characteristics, tolerance of environmental extremes, dispersal and colonizing ability, the timing of seasonal and annual cycles, disease resistance, and many other traits (Raven et al., 1986).
It is difficult to give one picture that would clarify and explain all richness of genetic variation that can be observed at the population level. One would be variability at the level of chromosome number and structure. At a finer scale, genes or intergenic regions could differ in their sequence. Therefore, genetic variability refers to a presence of different variants of genes, chromosomes, or other genetic entities and their combinations in individuals, and can be quantified with parameters, such as proportion of polymorphic loci, average heterozygosity, allelic richness. Additionaly, genetic variability in natural populations is dynamic, constantly changing in space and in time by the action of evolutionary factors.
3. Genetic variability of Populus nigra L. in the Danube Basin
Mihailo Jelić*, Aleksandra Patenković**, Zorana Kurbalija Novičić**
*Faculty of Biology, University of Belgrade, Studentski trg 16, 11000 Belgrade, Serbia
**Institute for Biological Research “Siniša Stanković”, University of Belgrade, Bulevar despota Stefana 142, 11060 Belgrade, Serbia

88 / Variability of European Black Poplar (Populus nigra L.) in the Danube Basin Variability of European Black Poplar (Populus nigra L.) in the Danube Basin / 89
3.1.1. Factors that shape genetic variability in natural populations
All individuals in a population can have the same variant of a particular gene, called allele, or there may be several different alleles (Hartl and Clark, 1997). In diploid, sexually breeding organisms, each individual inherits one allele from each parent. If it inherits identical alleles from both mother and father, it is said to be homozygous, and if it inherits two different alleles, it is called heterozygous. The genetic structure of a population is described by the total of all the alleles, and is usually referred as gene pool. The genetic structure can be also characterized by the distribution of alleles into genotypes. The usage of allelic frequencies offers several advantages over genotypic frequencies. For example, in sexually reproducing organisms, genotypes break down to alleles when gametes are formed, and alleles, not really genotypes are passed through generations. Consequently, only alleles have continuity over time, and the gene pool evolves through changes in the frequencies of alleles.
The Hardy-Weinberg (H-W) law serves like a foundation for population genetics since it offers a simple explanation of how the basic principles of inheritance, presented in Mendel’s rules, influence a genetic pool, i.e. allelic and genotypic frequencies in a population. It says that in an infinitely large, randomly mating population, free from mutation, gene flow, and natural selection, the frequencies of the alleles are constant over time. The H-W law explains what happens to the allelic and genotypic frequencies of a population as the alleles are passed through generations in the absence of evolutionary forces. Moreover, as long as mating is random, frequency of a particular genotype is a function of frequencies of alleles that form this genotype. Quite simply, if there are two alleles in a population: allele A with frequency p, and allele a with frequency q, then genotype AA has the frequency of p2, genotype Aa the frequency of 2pq, and genotype aa the frequency of q2. If a population yields an infinitely large pool of gametes for the next generations, then this pool of gametes will have the same frequency of alleles just as in the population they come from, and the allele frequency in the next generation and over the following generations will be identical.
For many populations and genes, however, the conditions required from the H-W law do not really hold. Populations can possibly be small, mating may possibly be non-random, and mutations, gene flow, genetic drift and natural selection may be present. In these circumstances, allelic frequencies change, and the gene pool of the population evolves in the response to the interplay of these processes.
Mutations usually occur at such a low rate that the changes resulting from mutations alone are often negligible. However, as stated above, mutation is a primal cause of genetic variability. The mutation rate varies between species, and between loci (Russell, 2003). The most of the mutations that occur in natural populations are thought to be the result of spontaneous processes. However, induced mutagenesis may be the cause of a minute part of the genetic variability (Friedburg et al., 2006; Patenković et al., 2009, 2013; Savić et al., 2011).
When populations are limited in size, chance factors may lead to random changes in allelic frequencies. Such random change is termed genetic drift, which comes from a general phenomenon of sampling error. If the gametes of only several individuals fuse
to make the next diploid generation, than the allele frequency in this gene pool may differ, and the allele frequency in the next generation will be different. In addition, some alleles might be lost, solely by chance. This way, the genetic drift reduces the level of genetic variability of a population. The smaller the sample, the quicker will be the loss of variability with time. Since genetic drift is a random process, allelic frequencies in different populations may drift in different directions; thus, genetic drift can produce genetic divergence among populations.
Gene flow is another evolutionary factor that changes allele frequencies and therefore the level of genetic variability. Many plant populations are not completely isolated from each other, and they may exchange genes through pollen or seeds with other populations of the same species. Gene flow has two major effects on a population. First, it introduces new alleles into a population. Since mutation is a rare event, a specific mutant allele may arise in one population and not in another. Gene flow distributes these unique alleles to other populations, increasing variability. Second, when the allelic frequencies of migrants and the recipient population differ, gene flow changes the allelic frequencies within the recipient population. Through the exchange of genes, different populations remain similar, and thus gene flow is a homogenizing force that has a tendency to prevent populations from accumulating genetic differences among them.
Mutation, genetic drift, and gene flow alter the gene pool of a population, changing genetic variability in populations, but these factors do not result in adaptation, a process by which traits evolve, making organisms more suited to the environment they live in. In natural populations, genetic variability in combination with environmental components leads to phenotypic variability, which in a different environment leads to differences in adaptations. The adaptation arises mostly from natural selection, which can be defined as differential reproduction of genotypes, meaning that individuals with certain alleles produce more offspring than others in a specific environment. Therefore, their genes increase in frequency in the next generation. There are different types of selection. For example, directional selection favors some genotypes ensuring better survival, and acts against others by decreasing their frequency, or possibly by eliminating them. In this way, directional selection decreases genetic variability in a population. On the other hand, another type of selection, called balancing selection, maintains genetic variability in a population. The simplest type of balancing selection is termed heterozygote superiority, when heterozygous individuals have better survival, and as such, both alleles present in heterozygous individuals are maintained in the populations. Natural selection can enhance genetic differences between populations by simply favoring different alleles in different populations, or it may prevent divergence by maintaining allelic frequencies uniform among populations.
In natural populations, evolutionary processes are rarely acting solely, but interact in a complex way, changing allele frequency. Furthermore, when acting in different direction, they can result in equilibrium when their simultaneous action does not lead to allele frequency change. In most natural populations, the joint effects of these processes determine the pattern of genetic variation observed in the gene pool over time (Anđelković and Stamenković-Radak, 2013).

90 / Variability of European Black Poplar (Populus nigra L.) in the Danube Basin Variability of European Black Poplar (Populus nigra L.) in the Danube Basin / 91
3.1.2. Genetic adaptation to changing environment
It is well know, that most organisms are amazingly well adapted to the environment that they live in. But, even for the populations which are fairly well stabilized in their respective environments, the presence of genetic variability is crucial for the ability of a species to adapt to changes in environment (Guisan and Zimmermann, 2000; Allen et al., 2002; Franklin, 2010; Savić et al., 2011; Šiler et al., 2012). Genetic variation allows species to evolve in response to diseases, predators, parasites, pollution, and climate change (Kenig et al., 2013; Savić et al., 2008; Kurbalija Novičić et al., 2012a)
Our planet is continually changing, causing habitats to be altered and modified, and changes tend to occur at a gradual pace, usually causing a slight impact on individual species. Organisms have always been exposed to the fluctuations of environmental conditions such as temperature, humidity, atmospheric composition. When there are drastic changes in environmental conditions, such as floods, fires, storms, volcanic eruptions, earthquakes, or resource availability, population sizes of competitors, etc. many species disappear. The vast majority of species died out because they could not compete successfully for food or other resources.
Humans are having strong impacts on the global environment: climate warming, the populations of many species are in decline, pollution is affecting ecosystems, concentration of carbon dioxide increasing in the atmosphere, sea level changes (Raup, 1994; Hilton-Taylor et al., 2008; Dillon et al., 2010; Pereira, 2010; Falkowski et al., 2011; IPCC 5rd assessment reports, 2013). In general, habitat change is the main cause of today’s biodiversity loss. Landscapes are changing worldwide, as natural land covers like forests, grasslands, and desserts are being converted to human-dominated ecosystems, including cities, agriculture, and forestry, and the conversion of forests to agricultural uses is among the most detrimental kind of land use change on biodiversity (FAO, 2010). Many species will not be able to adapt fast enough to new environmental conditions, possibly leading to 15–37% of species going extinct (Thomas et al., 2004). The problem is not just the loss of species. There is also the loss of genetic diversity within species, as well as the loss of diversity of different types of ecosystems. Genetic diversity helps organisms cope with current environmental variability, but it is also important for continued evolution, where the preservation of wider gene pool diversity in subdivisions of species, such as subspecies and populations, offers the raw material for the evolution of new species in the future.
Human impacts in terms of anthropogenic climate warming, habitat loss, degradation and fragmentation are likely to increase over the 21st century (Smith et al., 2009). The acceleration of environment change can lead to failure of natural populations to adapt to the swiftly changed environment. Detailed knowledge on how past evolutionary pressures have shaped the genetic composition of species can help us to better predict the possible future consequences of climatic changes (Stamenković-Radak et al., 2008, 2012; Faurby and Pertoldi, 2012). In addition, the role of geographic variation in environmental factors creates an important basis for predicting responses to future climate change (e.g. Thomas et al., 2004; Kjærsgaard et al., 2012; Kristensen et al., 2012). Pleistocene glaciations exemplify how climatic changes influenced species distributions by alternately inducing southward range contractions with northward expansions
(Pertoldi et al., 2012). In this perspective, there is a need for a deeper understanding of how genetic parameters can be used to evaluate causal processes, including the genetic signature of populations’ decline or expansion (Mucci et al., 2012) due to selective pressure, which could be caused by environmental changes. Selective pressures also change the patterns of biotic interactions between species, and their morphology.
Thus, the challenges faced by conservation biologists in preserving biodiversity are becoming more and more complex (Kurbalija Novičić, et al., 2012b).
3.1.3. Genetic variability and molecular markers
Molecular tools are valuable for investigating the pattern of genetic variability in population and species, and for clarifying demographic and ecological issues in species management in order to plan long-term conservation or restoration projects. Although some researchers have questioned the relative importance of genetic information, stating that ecological or demographic issues may be more precise (e.g. Lande, 1988; Schemske et al., 1994), molecular markers have become part of a repertoire of tools needed to assess the amount of genetic variation in populations of endangered species and to address the ever increasing loss of biodiversity. An outstanding advantage of molecular approach is the immense amount of potential data they provide (Petersen and Seberg, 1998). Evolutionary rates of different genome parts are different, allowing the construction of molecular markers that can be applicable in a wide array of analysis at any taxonomic level. They also differ in the way that they evaluate DNA sequence variation and in the type of data, they generate, but important rationale behind their development has been the search for polymorphic and “easy-to-handle” markers. Genetic variability could be obtained by using different methodologies in the analysis of genetic material on different levels of organization.
Since the 1960’s the most widely applied method of estimating genetic differences among individuals has been enzyme electrophoresis (allozyme and isozyme analysis), detecting the genetic variability at the protein level. Literally, thousands of enzyme electrophoresis studies have been conducted on a wide range of organisms (Hamrick and Godt, 1989; Rajora et al., 1991; Castro et al. 1999). Enzyme electrophoresis detects the changes in amino acid caused by mutation in DNA since they have different mobility in the electric field.
There are several molecular markers, mostly PCR (Polymerase Chain Reaction) based, that are frequently used with the aim to determine the level of DNA variability within populations: Restriction Fragment Length Polymorphism (RFLP), Random Amplified Polymorphic DNA (RAPD), Amplified Fragment Length Polymorphism (AFLP), Microsatellites, Single-Nucleotide Polymorphism (SNP).
Restriction Fragment Length Polymorphism (RFLP) is a technique to refers to a difference between samples of homologous DNA sequences that come from presence or absence of restriction sites, short sequences of nucleotides, recognized by restriction enzyme. In RFLP analysis, the DNA sample is broken into pieces (digested) by restriction enzymes and the resulting restriction fragments are separated according to their lengths by

92 / Variability of European Black Poplar (Populus nigra L.) in the Danube Basin Variability of European Black Poplar (Populus nigra L.) in the Danube Basin / 93
gel electrophoresis. Presence or absence of a specific site is visualized as different number of restriction fragments. RFLP is a co-dominant marker, giving the possibility to discriminate heterozygous from homozygous individuals.
Random Amplified Polymorphic DNA (RAPD), so far most commonly used method, does not require any specific knowledge of the DNA sequence of the target organism: the 10-mer primers will or will not amplify a segment of DNA, depending on the complementary to the primers’ sequence. It is a dominant marker, meaning that it gives information only of the presence of particular allele in an individual. It cannot give information whether individual is in a homozygous or heterozygous state.
Amplified Fragment Length Polymorphism (AFLP) uses restriction enzymes to digest genomic DNA, followed by ligation of adaptors to the sticky ends of the restriction fragments. A subset of the restriction fragments is then selected to be amplified by PCR. This selection is achieved by using primers complementary to the adaptor sequence, the restriction site sequence and a few nucleotides inside the restriction site fragments. The amplified fragments are electrophoreticaly separated based on their length. If the specific allele is amplified, the specific band or peak is present. AFLP is a dominant marker.
Microsatellites, also known as Simple Sequence Repeats (SSRs) or Short Tandem Repeats (STRs) or Simple Sequence Length Polymorphisms (SSLPs) are repeating sequences of 2-6 base pairs of DNA usually in regions between genes. The length of amplified alleles (by PCR) depends on the number of these short repeats. Microsatellites are locus-specific and co-dominant markers.
It is also possible to directly determine the exact order of bases in the DNA of individual by using different sequencing procedures. In that way, it is possible to determine Single-Nucleotide Polymorphisms (SNP), the difference between individuals in a single nucleotide in the genome. SNP can be analyzed by sequencing a particular DNA region, or if the variation at a single nucleotide is already known to exist, its variability can be determined by quantitative PCR procedures and gene arrays, methodologies that at are based on the discriminative hybridization of specific primers or gene probes.
Both dominantly and co-dominantly inherited markers have been used in population genetics studies of many species (Bugarski-Stanojević et al., 2011; Adnađević et al., 2012; Jelić et al., 2012a,b; Skorić et al. 2012; Živković et al., 2012; Kurbalija Novičić et al., 2013; Banjanac et al., 2014).
Since the 90-ies, microsatellite markers have become increasingly popular in plant population genetics due to their high variability. For finding and developing microsatellite primers, we use locus-specific flanking regions. On each side of the repeat unit are unique flanking regions that consist of “unordered” DNA. The probability of finding the particular stretch of unordered DNA 30-50 base pairs (bp) long more than once in the genome is very small. In contrast, the genomes of the majority of taxa are abundant in repetitive sequences, and the repeats of a given unit (AC or ACG) may occur in thousands of places in the genome. In some instances, it is possible to use already designed primers for related taxa, but sometimes they do not lead to amplification products at
all or they introduce artifacts (van Treuren et al., 1997). Microsatellite performance may be sometimes hampered by apparent heterozygote deficiency due to the occurrence of null alleles (Callagen et al., 1993) short allele dominance (Wattier et al., 1998) or undetected alleles that are outside of the normal calling range for a particular locus. If a mutation occurs in the annealing site of the flanking region of one allele, primers will not anneal, and only the allele present at the other homologous chromosome will amplify. Short allele dominance is a bias in favor of short alleles to competition in PCR amplification, leading to failure of long allele to amplify.
In data comparisons, estimates of genetic variation obtained with different types of dominant markers (AFLP, RAPD) proved to be quite similar in magnitude, both for within and among populations (Zawko et al., 2001). In contrast, microsatellite-derived estimates of within-population diversity were at least twice higher and among population diversity is lower (Nybom et al., 2004). This difference may be attributed to the hypervariability of microsatellite loci, estimated to occure between 10-3 and 10-5 times per locus per generation, which is up to four orders of magnitude higher than the mutation rate of other loci (Hancock et al., 2000). Adjustment of traditional statistical procedures to hypervariable loci is promising for obtaining reliable results (Hedrick, 1999).
High mutation rate limits microsatellites’ utility in philogenetic studies, between evolutionary distant taxons. Even if we use the same primers for different taxa, we can no longer safely assume that two alleles are identical by descent or they both arose by mutation from different alleles.
Microsatellites are also distinctive since they mutate by gaining or loosing repeat units. The classical stepwise mutation model (SMM) (Ohta and Kimura, 1973) assumes changes in only one unit. However, mutations of larger gain or looss have been observed (Harr et al., 2002; Huang et al., 2002), and this is implemented in the two-phase mutation model (TPM) (DiRienzo et al., 1994; Fu and Chakraborty, 1998).
Microsatellites are useful markers at a wide range of scales of analysis. In a biological/evolutionary context, they are useful as markers for parentage analysis and for captive or endangered species. Microsatellites can serve as tools to evaluate inbreeding levels (FIS). In addition, it is quite an important tool for the analysis of genetic structure of subpopulations and populations (by using tools such as F-statistics and genetic distances). They can be used to assess demographic history (e.g., to look for evidence of population bottlenecks), to assess effective population size and to assess the magnitude and directionality of gene flow between populations. Microsatellites provide data suitable for phylogeographic studies that seek to explain the concordant biogeographic and genetic histories of the floras and faunas of large-scale regions.
3.2. Overview of Populus nigra L. genetic variability in Europe
The European black poplar (Populus nigra L.) is one of the most common plant species that constitutes floodplain forests along riversides in the riparian ecosystems throughout Europe (Figure 3.1.). It plays a central role in the initial phase of the development of riparian forests and contributes to the natural control of flooding

94 / Variability of European Black Poplar (Populus nigra L.) in the Danube Basin Variability of European Black Poplar (Populus nigra L.) in the Danube Basin / 95
and water quality, thus becoming a flagship species of the project DANUBEPARKS STEP 2.0. Additionally, European black poplar forests might serve as natural corridors, connecting areas along the Danube now separated from each other, facilitating gene flow for many riparian species (Storme et al., 2004; Naiman et al., 2005). It forms meta-populations by colonizing open areas through seeds, stems fragments and sprouting from roots and stems of damaged plants (Zsuffa, 1974; Herpka, 1986).
Figure 3.1. Flooded meadows in Kopački rit Nature Park (photo: Hrvoje Domazetovič)
Several main factors are recognized as threats for P. nigra populations in Europe (Lefèvre et al., 1998; 2001): alteration of riparian ecosystems throughout the species distribution area; overexploitation or replacement of autochthonous P. nigra resources with faster growing hybrid poplars; plantation of limited number of cultivated clones and possible occurrence of introgression from cultivated poplars. The major concern regarding introgression in P. nigra is the possible reduction of genetic variability, more specifically, the reduction of genetic diversity as a result of the genetic introgression from a limited number of cultivated clones, such as the male clone ‘Italica’, distributed all over continental Europe (Cagelli and Lefèvre, 1995).
Several molecular markers have been developed and used to access genetic variability of Populus nigra in natural populations or in gene bank collections. In some studies, variability has been analyzed at the narrow geographical scale (Arens et al., 1998; Imbert and Lefèvre 2003; Rathmacher et al., 2010), while other studies covered larger area of the species distribution (Cottrel et al. 2005; Smulders et al., 2008). By using molecular techniques, these studies shed more light on the species biology: reproduction, its dynamics in space and time, interaction with the fluctuations in the environment, and
genetic introgressions by oriental, non-native Populus species. The obtained information on species biology is very important for development of proper conservation strategies. Among the first genetic analysis of P. nigra was the assessment of genetic differences at the protein level, the isozymes (Legionnet et al., 1996; Fossati et al., 2003; Storme et al., 2004; Vanden Broeck et al., 2004, 2006). At the level of DNA variability, Populus nigra was analyzed with AFLP markers (Arens et al., 1998; Smulders et al., 2008) and microsatellite markers (van der Schoot et al., 2000; Smulders et al., 2001; Imbert and Lefèvre, 2003; Vanden Broeck et al., 2006; Smulders et al., 2008; Rathmacher et al., 2010). Today, a large number of microsatellite loci is available for genotyping of P. nigra. Van der Shoot (2000) developed the first set of primers that amplified polymorphic dinucleotide repeat loci (WPMS01-WPMS12). Smulders et al. (2001) further developed ten more pairs of primers for the microsatellite analysis. These primers amplified loci with trinucleotide repeats (WPMS13-WPMS22). At present, a large number of microsatellite loci can be found from IPGC (International Populus Genome Consortium) SSR Resource (http://www.ornl.gov/sci/ipgc/). Position of some of the microsatellite loci on chromosomes is mapped (Cervera et al., 2001; Gaudet et al., 2008). In addition to the genetic markers located on nuclear DNA, variability of extranuclear, chloroplast DNA markers was studied at the level of variability of restriction sites (Cottrel et al., 2005) in an attempt to discover refugia, regions from where poplar colonized Europe after the ice ages. Chloroplast DNA sequences are the primary source of data for plant phylogenies and biodiversity in a range of plant species. The uniparental mode of inheritance, the absence of recombination and the low mutation rate make specific regions of the chloroplast genome as appropriate markers for phylogenetic studies as well as for the study of postglacial routes of colonisation. Maternally inherited genomes are more geographically structured, due to limited seed dispersal compared to pollen movement (El Mousadik and Petit, 1996).
By far the most comprehensive study on microsatellite variability, in terms of the size of geographical region, affiliation to different catchments, different levels of river dynamics, and age groups was that of Smulders et al. (2008) who analyzed 17 populations from seven European catchment systems, with seven microsatellite loci.
More detailed analysis of the variability of P. nigra along the Danube Basin was needed since different catchments, to some extent, show genetic specificity. Smulders et al. (2008) showed that genetic variation between different catchments could be several times higher than genetic variation between populations from the same catchment. This ratio is 1.37 times higher for AFLP marker, but 3.83 times higher for microsatellites. Moreover, genetic variability in different catchments represents distinct genetic clusters. In Smulder’s study, rivers were represented with one or two localities. Three of these rivers were in fact tributaries of the Danube, and one locality was directly on the Danube in Austria, therefore, knowledge about the variability of P. nigra populations along the Danube Basin is only fragmentary. We stress that the Balkan Peninsula, whose northern border is in fact part of the Danube flow (Figure 1.18., Chapter 1), is important glacial refugium for many plant and animal species including P. nigra (Hewit, 2000; Cottrel et al., 2005). Regions of high genetic diversity, where populations persisted in adverse conditions are likely to be areas that will continue to pose a refuge (Leroy and Arpe, 2007), and should be the focus of conservation strategies (Médail and Diadema, 2009).

96 / Variability of European Black Poplar (Populus nigra L.) in the Danube Basin Variability of European Black Poplar (Populus nigra L.) in the Danube Basin / 97
3.3. Assessment of the microsatellite variability of the European black poplar in the Danube Basin
In our research we concentrated solely on the European black poplar in the Danube Basin, analyzing 12 populations from the the Danube spring in Germany to its delta in Romania. Samples of P. nigra were collected from twelve protected areas, along the Danube River, with the exception of one protected area, located on the Sava River, the tributary of the Danube. Collection sites are distributed in eight countries: Germany, Austria, Slovakia, Hungary, Croatia, Serbia, Bulgaria and Romania, and cover the whole river flow. In each population approximately 30 individual trees at a distance no less than 10 m were included in the analysis. Five leaves were collected from each individual. Total number of sampled individuals was 364. The locations and coding of populations is presented in Table 3.1., and Figure 1.18. in Chapter 1.
Table 3.1. Collection sites of the European Black Poplar (Populus nigra L.)
In the study of 12 populations of Populus nigra in the Danube River Basin, eight mirosatellite loci were used. One, PMGC14, was selected from the IPGC (International Populus Genome Consortium) SSR Resource as in Smulders et al. (2008), five (WPMS03, WPMS05, WPMS08, WPMS09, and WPMS12) from the study by Van der Schoot et al. (2000), and two (WPMS16 and WPMS18) were taken from the paper by Smulders et al. (2001). Four different fluorescent dyes (6-FAM, NED, PET, and VIC) were used to end-label one primer of each primer pair (Table 3.2.).
Two PCR protocols differed only in annealing temperatures. One cycle at 94oC for 3 min was followed by 30 cycles of 45s at 94oC, 45s at the annealing temperature (50 or 55oC), and 105s at 72oC. A final elongation step of 10 min at 72oC was included. Loci were amplified in three multiplex PCR reactions. One reaction included loci: WPMS05, WPMS09, WPMS16, and WPMS18 and the annealing temperature was 50oC. The second reaction included loci WPMS08 and WPMS12 and was conducted on annealing temperature of 50oC. The third reaction included loci WPMS03 and PMGC14 where annealing temperature was
55oC. Amplification was performed in a volume of 20 μl and the final concentration of components was as follows:1×Taq Buffer with (NH4)2SO4, 1.5 mM MgCl2, 0.2 mM of dNTP each, 0.15-0.30 μM of either forward or reverse primer, 0.05 U/μlTaq DNA polymerase (recombinant) (ThermoScientific, EU), and 0.03 μg/μl DNA template.
Table 3.2. Microsatellite loci and primers used for fragment analysis of P. nigra accessions from the SEE/D/0165/2.3/X-02 collection. Primer pairs were labeled with fluorescent dyes (6-FAM, NED, PET, and VIC).
After amplification, products of the second and third reactions were mixed (multipooled) in equal volumes, and were plated as one. Products of first reaction were plated separately. Each well on a plate contained 0.5 μl of an amplification product for 4 loci of the specific accession, 9 μl of Hi-Di™ Formamide (Applied Biosystems®, UK), and 0.5 μl of GeneScan™ 600 LIZ® Size Standard (Applied Biosystems®, UK). After denaturation of plate at 95oC for 3 min, and cooling on ice for 5 min, the plate was loaded on 3130 Genetic Analyzer (Applied Biosystems®, UK). Only distinct and reproducible, well-marked amplified peaks were included in the genetic analysis. If some loci were missing, the specific reactions were repeated. Data were analyzed with the GeneMapper® Software (Life Technologies™, USA).
In the processed samples, clearly separated peaks belonging to eight microsatellite loci are distinguishable. Well-marked amplified peaks are presented in the Figure 3.2. The microsatellite fragment analysis identified two identical genotypes both in population H (DDNP) and in population RO (DDBR). All other genotypes were unique.
Genotypes were obtained for 355 individuals and all microsatellite loci had less than 5% of missing data, so all loci were included in the analysis.
Code number for population
1
2
3
4
5
6
7
8
9
10
11
12
Population Abbreviation
D (DNI)
A (NPDA)
SK (PLADL)
H (FHNP)
H (DINP)
H (DDNP)
SRB (SNRGP)
HR (NPKR)
HR (NPLP)
BG (PNP)
BG (NPRL)
RO (DDBR)
Protected area
Donauauwald Neuburg -Ingolstadt, Germany
Donau-Auen National Park, Austria
Protected landscape area Dunajské luhy, Slovakia
Fertő-Hanság National park, Hungary
Danube Ipoly National Park, Hungary
Danube-Drava National Park, Hungary
Special Nature Reserve Gornje Podunavlje, Serbia
Nature Park Kopački rit, Croatia
Lonjsko polje Nature Park, Croatia
Persina Nature Park, Bulgaria
Nature Park Rusenski Lom, Bulgaria
Danube Delta Biosphere Reserve, Romania
Table 3.1. Collection sites of the European Black Poplar (Populus nigra L.)
Microsatellitelocus
WPMS03
WPMS05
WPMS08
WPMS09
WPMS12
PMGC14
WPMS16
WPMS18
Forward/reverse primer sequences (5’-3’),end–labeled with �uorescent dyes
NED-TTTACATAGCATTTAGCCTTTAGA
TTATGATTTGGGGGTGTTATGGTA
6-FAM-TTCTTTTTCAACTGCCTAACTT
TGATCCAATAACAGACAGAACA
VIC-TAACATGTCCCAGCGTATTG
TTTTTAGAGTGTGCATTTAGGAA
PET-CTGCTTGCTACCGTGGAACA
AAGCAATTTGGGTCTGAGTATCTG
PET-TTTTTCGTATTCTTATCTATCC
CACTACTCTGACAAAACCATC
6-FAM-TTCAGAATGTGCATGATGG
GTGATGATCTCACCGTTTG
VIC-CTCGTACTATTTCCGATGATGACC
AGATTATTAGGTGGGCCAAGGACT
NED-CTTCACATAGGACATAGCAGCATC
CACCAGAGTCATCACCAGTTATTG
Table 3.2. Microsatellite loci and primers used for fragment analysis of P. nigra accessions from the SEE/D/0165/2.3/X-02 collection. Primer pairs were labeled with �uorescent dyes (6-FAM, NED, PET, and VIC).

98 / Variability of European Black Poplar (Populus nigra L.) in the Danube Basin Variability of European Black Poplar (Populus nigra L.) in the Danube Basin / 99
Figure 3.2. Amplified fluorescent dye-labeled products of 8 microsatellite loci analyzed by 3130 Genetic Analyzer (Applied Biosystems®). Pairs of peaks labeled with the same fluorescent dye represent heterozygous loci, while homozygous loci are visible as single peaks. A) amplified loci: WPMS12 (red), PMGC14 (blue), WPMS08 (green) and WPMS03 (black-representing yellow fluorescence) B) amplified loci: WPMS16 (green), WPMS18 (black-representing yellow fluorescence), WPMS09 (red) and WPMS05 (blue).
3.3.1. Pattern and amount of genetic variation
To assess the level of genetic diversity of the European black poplar in the Danube Basin, following parameters were determined per locus and population: the number of alleles, allelic richness based on a minimal sample size, allelic size range, observed (HO) and expected (HE) heterozygosity (Nei, 1973).
Our results show a very low level of clonality, since only in two populations two individuals shared the same genotype which support findings of Smulders et al. (2008), who found a low level of duplicated genotypes along dynamic rivers.
The number of alleles per locus and population, and the corresponding values for allelic richness based on a minimal sample size are presented in Table 3.3. and Table 3.4. The allelic size range per locus and population is presented in Table 3.5. The number of alleles ranged from 9 - 24 depending on loci with the mean value of 9.24 ± 2.55. All populations had a similar mean number of alleles detected (Table 3.3. and 3.4.). The results presenting the number of alleles based on a minimal sample size (allelic richness) were consistent with the general number of alleles, and the mean value was 9.71 ± 2.44. The highest mean allelic richness was observed in population BG (NPRL), which indicates that this population shows the highest genetic diversity, while the lowest was recorded in population A (NPDA).
Table 3.3. Number of alleles per population and locus
Table 3.4. Number of alleles (allelic richness) per population and locus based on minimal sample size
locuspopulationD (DNI)
A (NPDA)
SK (PLADL)
H (FHNP)
H (DINP)
H (DDNP)
SRB (SNRGP)
HR (NPKR)
HR (NPLP)
BG (PNP)
BG (NPRL)
RO (DDBR)
Mean
Total
WPMS03 15
14
14
12
14
12
11
11
10
12
12
11
12.33
24
Table 3.3. Number of alleles per population and locus
WPMS0514
14
11
13
12
10
9
11
8
10
10
13
11.25
19
WPMS089
7
11
11
12
11
8
8
8
12
14
11
10.17
22
WPMS0913
10
11
11
11
9
11
10
9
10
15
13
11.08
23
WPMS1210
6
9
7
9
7
7
6
5
8
8
6
7.33
12
PMGC146
6
6
7
7
8
8
8
6
7
9
9
7.25
11
WPMS166
6
6
7
6
6
8
8
5
6
7
6
6.42
9
WPMS186
5
10
9
9
7
10
10
7
6
10
8
8.08
14
Mean
9.88
8.50
9.75
9.63
10.00
8.75
9.00
9.00
7.25
8.88
10.63
9.63
9.24
1.68
s.d.
3.76
3.70
2.71
2.45
2.73
2.12
1.51
1.77
1.83
2.48
2.83
2.83
2.55
5.95
locuspopulationD (DNI)
A (NPDA)
SK (PLADL)
H (FHNP)
H (DINP)
H (DDNP)
SRB (SNRGP)
HR (NPKR)
HR (NPLP)
BG (PNP)
BG (NPRL)
RO (DDBR)
Mean
Total
WPMS03
13.74
13.37
12.77
11.20
13.46
11.76
10.75
10.45
9.96
11.32
10.80
10.68
12.96
13.74
Table 3.4. Number of alleles (allelic richness) per population and locus based on minimal sample size
WPMS05
13.11
13.11
10.36
11.32
11.40
9.91
8.99
10.32
7.78
9.55
9.36
12.25
11.41
13.11
WPMS08
8.40
6.71
10.71
10.12
11.27
10.68
7.77
7.75
7.86
11.75
12.52
10.45
11.85
8.40
WPMS09
12.24
9.82
10.28
9.88
10.52
8.84
10.76
9.39
8.84
9.77
13.35
12.12
11.31
12.24
WPMS12
9.52
5.95
8.32
6.38
8.32
6.77
6.82
5.80
4.97
7.20
7.54
5.76
7.48
9.52
PMGC14
5.96
5.83
5.80
6.76
6.65
8.00
8.00
7.80
5.92
6.96
8.75
8.48
7.61
5.96
WPMS16
5.96
5.83
6.00
6.49
5.99
6.00
7.57
7.60
4.99
5.76
6.78
5.96
6.48
5.96
WPMS18
5.95
5.00
9.55
8.38
8.69
7.00
9.84
9.55
6.71
5.76
9.64
7.56
8.62
5.95
Mean
9.36
8.20
9.22
8.82
9.54
8.62
8.81
8.58
7.13
8.51
9.84
9.15
9.71
9.36
s.d.
3.32
3.43
2.40
2.09
2.56
2.04
1.51
1.61
1.80
2.40
2.29
2.60
2.44
3.32
10000
8000
6000
4000
2000
0
10000
8000
6000
4000
2000
0
4406 5606 6609 7006 8606 9906 10006 11030
37 40 47 40 57 40 67 40 77 40 87 40 97 40
A
B
10000
8000
6000
4000
2000
0
10000
8000
6000
4000
2000
0
4406 5606 6609 7006 8606 9906 10006 11030
37 40 47 40 57 40 67 40 77 40 87 40 97 40
A
B

100 / Variability of European Black Poplar (Populus nigra L.) in the Danube Basin Variability of European Black Poplar (Populus nigra L.) in the Danube Basin / 101
Table 3.5. Allelic size range per population and locus
The mean HO and HE were high in all populations (Table 3.6. and 3.7.). The results of non-parametric Mann-Whitney test did not show significant differences between the pairs of populations in genetic parameters, except for allelic richness based on minimal sampled size between populations HR (NPLP) and BG (NPRL) (p = 0.0379) and for HE between populations H (FHNP) and H (DINP) (p = 0.0499).
Table 3.6. Observed heterozygosity (HO) per population and locus
Table 3.7. Expected heterozygosity (HE) per population and locus
The determined level of genetic diversity of the European black poplar in the Danube Basin are consistent with the previous studies of microsatellite variability (van der Schoot et al., 2000, Smulders et al., 2001, Imbert and Lefèvre, 2003, Smulders et al., 2008, Rathmacher et al., 2010) considering the differences in total sample sizes, number of populations and different set of loci used. Table 3.8. presents an overview of the observed number of alleles, and the HO and HE from several studies conducted on P. nigra. The values are presented per each locus, to avoid the misinterpretation of differences that could arise from different sets of loci that was used in different studies.
Allelic richness detected in our study was high, and did not vary much among populations. The number of alleles for all loci was slightly lower compared to the study of Smulders et al. (2008). Compared to Imbert and Lefèvre (2003) some loci showed higher (WPMS09 and WPMS18), and some lower number of alleles (WPMS12, WPMS16 and PMGC14). Our study showed higher number of detected alleles for all loci compared to the studies of van der Schoot et al. (2000), Smulders et al. (2001) and Rathmacher et al. (2010).
The results of HO and HE are similar among analyzed populations, and were close to values reported by other studies. Heterozygosity or allelic diversity is preserved in the analyzed populations, which is probably related to the long life span of individual trees. Genetic diversity, which we found, is in the range of other European populations. Compared to the study of Smulders et al. (2008), higher values of HO and HE are observed for loci PMGC14, WPMS16 and WPMS18, while lower for WPMS09, WPMS12. Differences are small, except for the locus WPMS16. Compared to the study of Imber and Lefèvre (2003), higher HO and HE are observed for locus PMGC14, and WPMS09 (only for HE), WPMS16 (HE) and WPMS18 (only for HE), while lower for loci WPMS09 (only for HO), WPMS12, WPMS16 (only for HO), and WPMS18 (only for HO). Our study showed somewhat higher levels of heterozigosities for all loci compared to the study of Rathmacher et al., 2010.
locuspopulationD (DNI)
A (NPDA)
SK (PLADL)
H (FHNP)
H (DINP)
H (DDNP)
SRB (SNRGP)
HR (NPKR)
HR (NPLP)
BG (PNP)
BG (NPRL)
RO (DDBR)
Mean
s.d.
Total range
WPMS03 15
16
18
13
32
27
29
17
18
21
25
12
20.25
6.54
37
Table 3.5. Allelic size range per population and locus
WPMS0521
19
13
19
19
11
11
11
8
10
11
17
14.17
4.49
21
WPMS0816
11
15
16
20
19
12
12
13
24
21
12
15.92
4.23
27
WPMS0927
11
11
23
21
21
22
22
9
22
27
27
20.25
6.41
32
WPMS1211
7
8
8
10
8
6
6
8
10
7
6
7.92
1.68
12
PMGC148
6
7
8
7
7
11
8
8
6
11
10
8.08
1.73
11
WPMS166
6
6
7
6
6
7
8
6
8
7
7
6.67
0.778
9
WPMS187
7
14
11
15
7
11
10
9
7
11
8
9.75
2.77
17
Mean
13.88
10.38
11.50
13.13
16.25
13.25
13.63
11.75
9.88
13.50
15.00
12.38
12.88
1.83
20.75
s.d.
7.38
4.90
4.24
5.79
8.65
7.98
7.86
5.31
3.83
7.48
8.07
6.87
5.55
1.64
10.375
locuspopulationD (DNI)
A (NPDA)
SK (PLADL)
H (FHNP)
H (DINP)
H (DDNP)
SRB (SNRGP)
HR (NPKR)
HR (NPLP)
BG (PNP)
BG (NPRL)
RO (DDBR)
Mean
WPMS03
0.52
0.57
0.63
0.55
0.80
0.58
0.70
0.59
0.72
0.67
0.43
0.50
0.60
Table 3.5. Allelic size range per population and locus
WPMS05
0.77
0.79
0.77
0.63
0.79
0.77
0.77
0.73
0.70
0.57
0.83
0.70
0.73
WPMS08
0.47
0.64
0.55
0.43
0.39
0.46
0.33
0.48
0.33
0.67
0.47
0.66
0.49
WPMS09
0.73
0.71
0.79
0.91
0.73
0.58
0.73
0.80
0.88
0.83
0.87
0.77
0.78
WPMS12
0.77
0.55
0.70
0.53
0.80
0.62
0.69
0.60
0.79
0.60
0.53
0.50
0.64
PMGC14
0.80
0.90
0.83
0.90
0.76
0.80
0.88
0.86
0.73
0.75
0.73
0.83
0.81
WPMS16
0.60
0.86
0.79
0.84
0.67
0.77
0.79
0.87
0.70
0.77
0.80
0.63
0.76
WPMS18
0.67
0.66
0.64
0.69
0.96
0.85
0.76
0.80
0.75
0.60
0.67
0.73
0.73
Mean
0.66
0.71
0.71
0.68
0.74
0.68
0.71
0.72
0.70
0.68
0.67
0.66
0.69
s.d.
0.12
0.13
0.10
0.18
0.16
0.14
0.16
0.14
0.16
0.09
0.17
0.12
locuspopulationD (DNI)
A (NPDA)
SK (PLADL)
H (FHNP)
H (DINP)
H (DDNP)
SRB (SNRGP)
HR (NPKR)
HR (NPLP)
BG (PNP)
BG (NPRL)
RO (DDBR)
Mean
Total
WPMS03
0.84
0.84
0.79
0.76
0.84
0.86
0.87
0.81
0.87
0.85
0.87
0.87
0.84
0.87
Table 3.7. Expected heterozygosity (HE) per population and locus
WPMS05
0.89
0.88
0.85
0.70
0.86
0.86
0.87
0.79
0.84
0.78
0.85
0.83
0.83
0.86
WPMS08
0.78
0.73
0.81
0.80
0.86
0.79
0.69
0.74
0.77
0.89
0.84
0.87
0.80
0.83
WPMS09
0.85
0.84
0.82
0.81
0.85
0.79
0.85
0.78
0.82
0.83
0.87
0.87
0.83
0.84
WPMS12
0.80
0.63
0.68
0.70
0.75
0.70
0.75
0.69
0.68
0.68
0.61
0.56
0.69
0.70
PMGC14
0.78
0.80
0.82
0.81
0.78
0.85
0.84
0.84
0.78
0.80
0.83
0.81
0.81
0.82
WPMS16
0.79
0.78
0.80
0.79
0.76
0.77
0.79
0.82
0.75
0.77
0.76
0.73
0.77
0.79
WPMS18
0.69
0.73
0.79
0.74
0.82
0.81
0.82
0.82
0.80
0.69
0.74
0.77
0.77
0.80
Mean
0.80
0.78
0.79
0.76
0.82
0.80
0.81
0.79
0.79
0.79
0.80
0.79
0.79
0.81
s.d.
0.06
0.08
0.05
0.05
0.04
0.06
0.06
0.05
0.06
0.07
0.09
0.06
0.06
0.05

102 / Variability of European Black Poplar (Populus nigra L.) in the Danube Basin Variability of European Black Poplar (Populus nigra L.) in the Danube Basin / 103
Table 3.8. Overview of genetic diversity parameters for microsatellite loci used in our study of Populus nigra, obtained in Europe
The results of the Hardy-Weinberg (H-W) disequilibrium test have revealed that most loci did not show deviations from H-W disequilibrium with a few minor exceptions (Table 3.9.). Only locus WPMS08 showed deviations in most of populations (except for population A (NPDA)). We found no evidence of linkage disequilibrium between the pairs of loci.
Table 3.9. Deviations from Hardy-Weinberg disequilibrium per population and locus
3.3.2. Population differentiation (F statistics)
In natural populations, heterozigosity, as a measure of genetic variability, can be lower than expected based on the present allele frequencies. For example, inbreeding may exist in a population and this can lower the heterozigosity. In addition, if populations are divided with limited gene flow, and are genetically different, in a way that allele frequencies of particular genetic loci are different, there are fewer HE. Extreme examples are populations each with only one, but different allele. All individuals are thus homozygous, and none is heterozygous, although there are several different alleles.
So, one of the main effects that a population subdivision has on genetic diversity, is the reduction in HO compared to HE, and the extent of this reduction can be used to quantify the level of genetic differentiation between populations. This quantification has been formalized (in the first instance by Wright (1951, 1965, 1978) in a series of hierarchical F-statistics), described through three hierarchical parameters of heterozygosity (H):
HI - mean HO per individual within a subpopulation.HS - mean HE within a random-mating subpopulation. It is calculated based on allele frequencies of each subpopulation, and then averaged.HT - HE in a random-mating total population. The mean allele frequencies are calculated, and then HE.By using these three different hierarchical measures of H, the three hierarchical F-statistics are defined:FIS, also called inbreeding coefficient, FIS= (HS- HI)/ HS. It defines the mean reduction in H of an individual due to non-random mating within a subpopulation. It is a measure of the extent of genetic inbreeding within a subpopulation. It can range from -1 (all individuals are heterozygous) to +1 (absence of heterozygotes).FST, also called fixation index, FST = (HT- HS)/ HT. defines the mean reduction in H
locus
para -meter
WPMS03
WPMS05
WPMS08
WPMS09
WPMS12
PMGC14
WPMS16
WPMS18
S our study n 24 19 22 23 12 11 9 14
D12 populationsthe Danube River,8 countries
HO 0.60 0.73 0.49 0.78 0.64 0.81 0.76 0.73
No 264 samples HE 0.84 0.83 0.80 0.83 0.69 0.81 0.77 0.77
S van der Schoot et al ., 2000 n 15 13 12 11 10 / / /
D EUFORGEN Core Collection HO / / / / / / / /
No 23 samples HE / / / / / / / /
S Smulders et al .,2001 n / / / / / / 7 7
D
EUFORGEN Core Collection
genotypes,West and Middle Europe
HO / / / / / / / /
No 23 samples HE / / / / / / / /
S Smulders et al .,2008 n / / / 25 15 12 10 17
D
17 populations,11 river valleys,7 catchments (Danube, Ebro, Elbe, Po, Rhine, Rhone, and Usk)
HO / / / 0.82 0.76 0.74 0.59 0.73
No 1069 samples HE / / / 0.83 0.72 0.74 0.65 0.74
S Imbert and Lefèvre, 2003 n / / / 13 15 13 11 12
D22 populations the Drôme River, the Netherlands
HO / / / 0.79 0.78 0.71 0.82 0.85
No 652 samples HE / / / 0.79 0.8 0.72 0.65 0.73
S Rathmacher et al., 2010 n / 10 / 17 / 9 / 8
DHesse, central Germany, at the Eder River
HO / 0.73 / 0.67 / 0.78 / 0.62
No ~290 samples HE / 0.76 / 0.74 / 0.76 / 0.58
Table 3.8. Overview of genetic diversity parameters for microsatellite loci used in our study of Populus nigra, obtained in Europe
Study
locuspopulationD (DNI)
A (NPDA)
SK (PLADL)
H (FHNP)
H (DINP)
H (DDNP)
SRB (SNRGP)
HR (NPKR)
HR (NPLP)
BG (PNP)
BG (NPRL)
RO (DDBR)
WPMS03
0***
0.00182
0.0106
0.00955
0.26257
0.00197
0.00236
0.13205
0.02626
0.00334
0***
0***
Table 3.9. Deviations from Hardy-Weinberg disequilibrium per population and locus
WPMS05
0.18191
0,02829*
0.49514
0.14915
0.09398
0.09401
0.10682
0.92401
0.24024
0,0209*
0.22418
0,04977*
WPMS08
0,00023***
0.30613
0,00039***
0***
0***
0,00119**
0,00002***
0,00169**
0***
0,00007***
0***
0,00116**
WPMS09
0.46876
0,01337*
0.10938
0,02007*
0.1172
0,00099**
0.08799
0.38637
0.25873
0.49505
0.72011
0.05266
WPMS12
0.13866
0.05958
0.84334
0.08855
0.60845
0.12091
0.31187
0.17865
0.59178
0.45381
0.08676
0,03268*
PMGC14
0.16402
0.87371
0.84887
0.35201
0.08397
0.15202
0.99488
0.344
0.2252
0.2558
0.06751
0,03005*
WPMS16
0.0656
0.6811
0.58932
0.95536
0.19852
0.95859
0.56828
0.43968
0.76023
0.24024
0.26201
0.13708
WPMS18
0.87469
0.23363
0.16576
0.05807
0.0832
0.23276
0.29891
0,01459*
0.44252
0.2712
0.09541
0,01272*
S, study; D, short description of study; No, number of analyzed individuals; par, parameters; n, number of alleles; Ho, observed
p<0.05*; p<0.01**; p<0.001***

104 / Variability of European Black Poplar (Populus nigra L.) in the Danube Basin Variability of European Black Poplar (Populus nigra L.) in the Danube Basin / 105
of subpopulations (relative to the total population) due to genetic drift among subpopulations. It is a measure of the extent of genetic differentiation among subpopulations. It can range from 0 (no differentiation) to 1 (complete differentiation – subpopulations are fixed for different alleles).FIT, also called overall fixation index, FIT= (HT- HI)/ HT, defines the mean reduction in H of an individual relative to total population. It combines contributions from non-random matting within subpopulations (FIS), and effects of random drift among subpopulations (FST).F statistics has proven to be a very useful tool in elucidating the pattern and extent of genetic variation residing within and among natural population of different species (Aguirre-Planter et al., 2000; Chung et al., 2004; Aranguaren-Mendez et al., 2002; Jelić et al., 2009; Kurbalija Novičić et al., 2011, Rogić et al., 2011; Stamenković-Radak et al., 2012) including Black poplar (Smulders et al., 2008).
In the Analysis of Variance (ANOVA) the observed variance in a particular variable is partitioned into components attributable to different sources of variation. Similarly, the Analysis of Molecular Variance (AMOVA) is a methodology that partitions genetic variability of a population to different sources, i.e. different levels of organization. It tells how much of the genetic variability is attributable to variability within populations, and how much to variability between populations. For example, based on AMOVA, we can say whether two individuals taken at random from two different populations are more genetically different than two individuals from the same population. If there is high gene flow between populations, they would be similar and the proportion of variation between populations would be small compared to variation within a population. On the other hand, if populations were isolated, the proportion of variation between populations would be higher.
In order to calculate diversity measures for the European black poplar in the Danube Basin, Fstat 2.9.3 (Goudet, 1995) and Arlequin (v.3.5.1.2, Excoffier and Lischer, 2010) software were used and obtained values were assessed for significance using the non-parametric Mann-Whitney U-test with PAST software (Hammer et al., 2001). To characterize the sources of genetic variation within and between populations, AMOVA was performed (Arlequin v.3.5.1.2), by using Wright’s F statistics (Weir and Cockerham, 1984; Weir, 1996). Pairwise FST values between populations were also calculated. The significance of the departure of the FST index from zero was done with 1023 permutations. Weir and Cockerham (1984) estimation of FIT, FST, and FIS per locus and overall were also calculated by using Fstat 2.9.3 software.
The AMOVA for all loci (Table 3.10.) revealed that the greatest amount of genetic variance occurred within populations. The amount of genetic variance among all twelve populations was 2.83%, and the amount of genetic variance within populations was 97.17%. The obtained results of the AMOVA indicate a low level of variation between populations, and high values of variation within populations. Smulders et al. (2008) reported a similar proportion of genetic variation within the catchment.
Table 3.10. AMOVA: partitioning of genetic variation among and within populations
The fixation index (FST) generated by AMOVA is 0.0282, which is significantly greater than 0 (p<0.01). Weir and Cockerham (1984) estimation of FST was similar to the value generated by AMOVA (Table 3.11.).
Table 3.11. Weir and Cockerham (1984) estimation of F indices
Pairwise FST values between each pair of populations are presented in the Table 3.12. The majority of pairwise population comparisons showed a small, but statistically significant genetic differentiation (FST<0.05) (Wright, 1978).
Table 3.12. FST distances between analyzed populations computed by Arlequin software
Source of variationAmong populations
Within populations
Total
Fixation index FST: 0.02825
d.f.
11
698
709
Sum of squares
89.873
2096.658
2186.531
Variance components
0.08734
3.00381
3.09114
Percentage of variation
2.83
97.17
Table 3.10. AMOVA: partitioning of genetic variation among and within populations
locusindexFIT
FST
FIS
WPMS03
0.309
0.036
0.283
WPMS05
0.154
0.04
0.119
WPMS08
0.408
0.032
0.388
WPMS09
0.073
0.013
0.061
WPMS12
0.089
0.021
0.069
WPMS14
0.005
0.007
-0.002
WPMS16
0.042
0.02
0.022
WPMS18
0.092
0.042
0.052
overall
0.150
0.027
0.126
Table 3.11. Weir and Cockerham (1984) estimation of F indices
99% con�dence interval (bootstrapping over loci): FIT= 0.048-0.281; FST= 0.015-0.037; FIS = 0.030-0.257
population
A(NPDA)
SK(PLADL)
H(FHNP)
H(DINP)
H(DDNP)
SRB(SNRGP)
HR(NPKR)
HR(NPLP)
BG(PNP)
BG(NPRL)
RO(DDBR)
D(DNI)
0,0339
***
0,0305
***
0,0340
***
0,0295
***
0,0309
***
0,0390
***
0,0349
***
0,0377
***
0,0486
***
0,0366
***
0,0694
***
A(NPDA)
-
0.0018
0,0225
***
0,0111
*
0.0075
0,0242
***
0,0213
***
0,0349
***
0,0363
***
0,0264
***
0,0263
***
SK(PLADL)
0,0216
***
0,0123
**
0,0125
*
0,0256
***
0,0243
***
0,0284
***
0,0453
***
0,0323
***
0,0334
***
H(FHNP)
0.0073
0,0234
***
0,0385
***
0,0159
**
0,0374
***
0,0388
***
0,0363
***
0,0526
***
H(DINP)
0.0098
0,0167
***
0,0123
*
0,0154
**
0,0295
***
0,0212
***
0,0279
***
H(DDNP)
0.0072
0.0003
0,0245
***
0,0366
***
0,0342
***
0,0328
***
SRB(SNRGP)
0.0065
0,0218
***
0,0395
***
0,0307
***
0,0324
***
HR(NPKR)
0,0295
***
0,0371
***
0,0487
***
0,0553
***
HR(NPLP)
0,0254
***
0,0214
***
0,0371
***
BG(PNP)
0,0120
*
0,0373
***
BG(NPRL)
0,0148
*
Table 3.12. FST distances between analyzed populations computed by Arlequin software

106 / Variability of European Black Poplar (Populus nigra L.) in the Danube Basin Variability of European Black Poplar (Populus nigra L.) in the Danube Basin / 107
p<0.05*; p<0.01**; p<0.001***
Only two comparisons showed a moderate and statistically significant genetic differentiation (0.05<FST<0.15): D (DNI) vs. RO (DDBR), H (FHNP) vs. RO (DDBR). A careful overview of the pairwise FST values and their statistical significance indicates that the pattern of population differentiation could be the result of the isolation by distance. Small pairwise FST values are the result of high gene flow between populations. The highest FST values are recorded between the two most distant populations: the population from Germany (the closest to the Danube source) and the population from Romania (located at the Danube confluence with the Black Sea). Populations originating in the middle of the Danube flow (Austria, Slovakia, Hungary, Croatia, and Serbia) show milder levels of differentiation. Furthermore, populations H (DDNP), SRB (SNRGP), and HR (NPKR), which are geographically very close, show no significant differentiation, and very low FST levels. Interestingly, population HR (NPLP) from Croatia, located on the Sava River (Danube tributary), evenly and significantly differs from all other populations. As expected, populations at the lower flow of the Danube (populations BG (PNP) and BG (NPRL) from Bulgaria) are also very similar. Populations BG (PNP) (Bulgaria) and RO (DDBR) (Romania) show stronger difference than populations BG (NPRL) and RO (DDBR), which are geographically closer.
3.3.3. Population bottleneck
Populations that have experienced a recent reduction of their size exhibit a correlative reduction of the allele numbers as well as heterozygosities at polymorphic loci. However, the allelic diversity is actually reduced faster than the heterozygosity, i.e. HO is larger than HE from the observed allele number where the locus is at mutation-drift equilibrium.
If we have a large diploid population with 10 alleles of equal frequencies (e.g. 0.1), then the proportion of heterozygotes would be 0.9. If this population experiences a bottleneck and only two individuals of different sex survive, the maximal alleles that are preserved is 4 (if both individuals are heterozygous). If the allele frequencies in the next generation are preserved and are equal (0.25), than based on H-W expectations, heterozygosity would be 0.75. Therefore, the number of alleles is reduced from 10 to 4
(40%), and the heterozygosity from 0.9 to 0.78 (which is 83.33%).
The Wilcoxon signed-rank test implemented in software Bottleneck (v.1.2) was used to test whether a significant number of loci feature excess of heterozigosity, which would indicate a recent bottleneck event. The two-phase mutation model (TPM) was used (Cornet and Luikart, 1996). This model assumes that the majority of mutations arise by gain or loss of one repeat unit (stepwise model), but allows a minor portion of multistep changes. In the analysis, the TPM model was parameterized with 90% of stepwise mutation. Similar results were obtained with a different parameter set.
Our results indicate that the majority of populations of the European black poplar in the Danube Basin have not experienced a recent bottleneck effect. This is supported by normal L-shaped distribution of allele frequencies in all populations. However, the Wilcoxon signed-rank test shows that population HR (NPLP) has experienced a recent reduction in population size (p< 0.05) (Table 3.13.).
Table 3.13. P values for heterozygocity excess obtained by the Wilcoxon signed-rank test
In addition to heterozigosity excess, the populations that have experienced a reduction in population size lose their alleles faster than they lose an allelic range, thus, the ratio of the number of alleles divided by the allelic range (The Garza-Williamson (G-W) index) decreases (Garza and Williamson, 2001). G-W index was computed for all populations by using Arlequin software.
The Garza-Williamson index for each population is shown in the Table 3.14. It is known to be sensitive to population bottlenecks, and should be near zero for the populations that have passed through a bottleneck, but close to one in stationary populations.
Table 3.14. Garza-Williamson index computed for all populations by Arlequin software
population
A(NPDA)
SK(PLADL)
H(FHNP)
H(DINP)
H(DDNP)
SRB(SNRGP)
HR(NPKR)
HR(NPLP)
BG(PNP)
BG(NPRL)
RO(DDBR)
D(DNI)
0,0339
***
0,0305
***
0,0340
***
0,0295
***
0,0309
***
0,0390
***
0,0349
***
0,0377
***
0,0486
***
0,0366
***
0,0694
***
A(NPDA)
-
0.0018
0,0225
***
0,0111
*
0.0075
0,0242
***
0,0213
***
0,0349
***
0,0363
***
0,0264
***
0,0263
***
SK(PLADL)
0,0216
***
0,0123
**
0,0125
*
0,0256
***
0,0243
***
0,0284
***
0,0453
***
0,0323
***
0,0334
***
H(FHNP)
0.0073
0,0234
***
0,0385
***
0,0159
**
0,0374
***
0,0388
***
0,0363
***
0,0526
***
H(DINP)
0.0098
0,0167
***
0,0123
*
0,0154
**
0,0295
***
0,0212
***
0,0279
***
H(DDNP)
0.0072
0.0003
0,0245
***
0,0366
***
0,0342
***
0,0328
***
SRB(SNRGP)
0.0065
0,0218
***
0,0395
***
0,0307
***
0,0324
***
HR(NPKR)
0,0295
***
0,0371
***
0,0487
***
0,0553
***
HR(NPLP)
0,0254
***
0,0214
***
0,0371
***
BG(PNP)
0,0120
*
0,0373
***
BG(NPRL)
0,0148
*
Table 3.12. FST distances between analyzed populations computed by Arlequin software
P
D (DNI)0.844
(NPDA)
0.629
SK(PLADL)
0.875
(FHNP)
0.990
H(DINP)0.844
H(DDNP)
0.629
SRB (SNRGP)
0.629
HR(NPKR)
0.963
HR(NPLP)
0.0137*
BG(PNP)0.726
BG(NPRL)0.875
RO(DDBR)
0.844
Table 3.13.P values for heterozygocity excess obtained by the Wilcoxon signed-rank test
locuspopulationD (DNI)
A (NPDA)
SK (PLADL)
H (FHNP)
H (DINP)
H (DDNP)
SRB (SNRGP)
HR (NPKR)
HR (NPLP)
BG (PNP)
BG (NPRL)
RO (DDBR)
Mean
Total
WPMS03
0.94
0.82
0.74
0.86
0.42
0.43
0.37
0.61
0.53
0.55
0.46
0.85
0.63
0.20
Table 3.14. Garza-Williamson index computed for all populations by Arlequin software
WPMS05
0.64
0.70
0.79
0.65
0.60
0.83
0.75
0.92
0.89
0.91
0.83
0.72
0.77
0.11
WPMS08
0.53
0.58
0.69
0.65
0.57
0.55
0.62
0.62
0.57
0.48
0.64
0.85
0.61
0.09
WPMS09
0.46
0.83
0.92
0.46
0.50
0.41
0.48
0.43
0.90
0.43
0.54
0.46
0.57
0.19
WPMS12
0.83
0.75
1.00
0.78
0.82
0.78
1.00
0.86
0.56
0.73
1.00
0.86
0.83
0.13
PMGC14
0.67
0.86
0.75
0.78
0.88
1.00
0.67
0.89
0.67
1.00
0.75
0.82
0.81
0.12
WPMS16
0.86
0.86
0.86
0.88
0.86
0.86
1.00
0.89
0.71
0.67
0.88
0.75
0.84
0.09
WPMS18
0.75
0.63
0.67
0.75
0.56
0.88
0.83
0.91
0.70
0.75
0.83
0.89
0.76
0.11
Mean
0.71
0.75
0.80
0.72
0.65
0.72
0.71
0.77
0.69
0.69
0.74
0.77
0.73
0.04
s.d.
0.17
0.11
0.12
0.14
0.17
0.22
0.23
0.18
0.14
0.20
0.18
0.14
0.17
0.04
p<0.05*

108 / Variability of European Black Poplar (Populus nigra L.) in the Danube Basin Variability of European Black Poplar (Populus nigra L.) in the Danube Basin / 109
Population HR (NPLP) with significant heterozigosity excess also showed one of the lowest values of G-W index (Table 3.14.). Population HR (NPLP) from Croatia has not dramatically lost its genetic diversity. However, it is necessary to define factors that negatively influenced the genetic stability of this population in order to eventually prevent their further impacts. Based on this observation, the population originating in Croatia deserves a special attention. We suggest the genetic characterization of nearby populations along the Sava River and the evaluation of the current state of P. nigra in this region, but also its population history, in order to select populations that could potentially serve as a source of genetic diversity. Maintenance of the current state and possible genetic improvement of this specific population, together with the efficient conservation strategies, could prevent it from further genetic degradation.
3.3.4. Metapopulation structure
The region of the Danube River is a vast geographical area, and our sample comprises of twelve populations distributed along its flow. It is of crucial importance to obtain the level and pattern of population structuring in such a large area, not continually inhabited by the intact native populations of this species. If there is a structure in the sample, then allele frequencies would be different between them. However, populations are not usually completely isolated from each other, so the individuals (or their gametes, such as pollen in plant species) originating from one population may migrate to other populations leaving their own alleles. Hence, based on allele frequencies in each population, each individual can be assigned (with certain probability) to a population (genetic clusters) where it originated. In addition, one individual can have an admixed origin, carrying the alleles that assign it to several genetic clusters. The way we divided our sample, at the time of collection, usually does not represent a real biological pattern of structuring. For example, we may collect our sample from several different places. However, several of these collection sites may represent the same population. In addition, some collection sites may have individuals coming from two genetically distinct genetic clusters. Therefore, the number of genetically distinct clusters or populations would be different than we assumed.
In order to estimate the number of genetic clusters represented in the samples of the European black poplar in the Danube Basin, the software STRUCTURE 2.3.4 (Pritchard et al., 2000; Falush et al., 2003; Hubisz et al., 2009) was used without prior population information. In the program STRUCTURE one can assume any number of supposed groups, and the program will assign individuals to each of the groups. To be more
precise, it can show that a specific individual has the alleles that originate only from one of the assumed groups, or it can be said that its genetic constitution is made of e.g. 70% of the first group, 20% of the second group, and 10% of the third group. If there is a high gene flow between populations and the parameters are set to several groups, than the majority of individuals will originate from many groups. If populations were isolated, individual would not have a mixed origin. Based on the results for each specified number of supposed groups, it could be said which is the most probable.
More precisely, this program uses a Markov Chain Monte Carlo (MCMC) method that clusters individuals to minimize Hardy–Weinberg disequilibrium and linkage disequilibrium between loci. In our analysis, an admixture model was used with a burn-in length of 10,000 and a MCMC of 100,000. The range of possible number of clusters (K) tested was from 1 to 13 with a series of five runs for each K. The results obtained with STRUCTURE were uploaded to software STRUCTURE Harvester version 0.6.93 (Earl and von Holdt, 2012). This program produces a plot of the mean likelihood value per K value and calculates the highest value of the second-order rate of change (DK) according to the method of Evanno et al. (2005) to detect the number of K groups that best fits the data set.
STRUCTURE Harvester illustrated that K 10 and K 5 were the most likely scenarios for the ‘all samples’ test (Figure 3.3.). The graphs of these scenarios were then examined to investigate groupings. According to the most probable K 10 scenario, each examined population consists of 10 different genetic clusters (Figure 3.4.). K 5 scenario highlights the divergence of 5 clusters in each population (Figure 3.5.). The results indicated that all populations of the European black poplar in the Danube Basin recruited plants from all clusters, yet geographically closer populations tended to draw evenly from the same clusters.
Figure 3.3. Distribution of Delta K indicating the structure of genetic differentiation among populations.
locuspopulationD (DNI)
A (NPDA)
SK (PLADL)
H (FHNP)
H (DINP)
H (DDNP)
SRB (SNRGP)
HR (NPKR)
HR (NPLP)
BG (PNP)
BG (NPRL)
RO (DDBR)
Mean
Total
WPMS03
0.94
0.82
0.74
0.86
0.42
0.43
0.37
0.61
0.53
0.55
0.46
0.85
0.63
0.20
Table 3.14. Garza-Williamson index computed for all populations by Arlequin software
WPMS05
0.64
0.70
0.79
0.65
0.60
0.83
0.75
0.92
0.89
0.91
0.83
0.72
0.77
0.11
WPMS08
0.53
0.58
0.69
0.65
0.57
0.55
0.62
0.62
0.57
0.48
0.64
0.85
0.61
0.09
WPMS09
0.46
0.83
0.92
0.46
0.50
0.41
0.48
0.43
0.90
0.43
0.54
0.46
0.57
0.19
WPMS12
0.83
0.75
1.00
0.78
0.82
0.78
1.00
0.86
0.56
0.73
1.00
0.86
0.83
0.13
PMGC14
0.67
0.86
0.75
0.78
0.88
1.00
0.67
0.89
0.67
1.00
0.75
0.82
0.81
0.12
WPMS16
0.86
0.86
0.86
0.88
0.86
0.86
1.00
0.89
0.71
0.67
0.88
0.75
0.84
0.09
WPMS18
0.75
0.63
0.67
0.75
0.56
0.88
0.83
0.91
0.70
0.75
0.83
0.89
0.76
0.11
Mean
0.71
0.75
0.80
0.72
0.65
0.72
0.71
0.77
0.69
0.69
0.74
0.77
0.73
0.04
s.d.
0.17
0.11
0.12
0.14
0.17
0.22
0.23
0.18
0.14
0.20
0.18
0.14
0.17
0.04
8
6
4
2
0
Del
ta K
Delta K = mean (lL”(K)l) / SD (L(K))
2 4 6 8 10 12K

110 / Variability of European Black Poplar (Populus nigra L.) in the Danube Basin Variability of European Black Poplar (Populus nigra L.) in the Danube Basin / 111
Figure 3.4. Recruitment of the inferred Structure clusters from the populations studied, based on microsatellite data. For each tree in a population the Structure cluster with the highest probability was taken, from a run at K = 10.
Figure 3.5. Recruitment of the inferred Structure clusters from the populations studied, based on microsatellite data. For each tree in a population the Structure cluster with the highest probability was taken, from a run at K = 5.
3.3.5. Testing selective neutrality
Microsatellites are considered neutral genetic markers. However, some loci can be close on chromosome to other loci that are important for survival and reproduction, and are subject to natural selection. If a species is divided into several populations of finite size and microsatellite loci are neutral, we can say that the allele frequencies between populations are different not because of natural selection, but because of random
genetic processes (drift). Based on this, we can predict the distribution of FST values. In other words, if we analyze several loci and their HE, we can predict that all FST values will be in an expected range. On the other hand, if some microsatellite loci were close to a locus that is a subject to natural selection, than the frequency of alleles on that locus would be shaped by natural selection. For example, in the population that inhabits a hot habitat, the frequency of an allele that enables individuals to tolerate heat would be higher than in the population from a cold habitat. The difference in allele frequency for that locus would be higher compared to other loci, and the FST value would also be higher, and would fall out of the expected range. Similarly, the FST value of a locus under selection can be significantly lower compared to other loci, and this is the case for balancing selection, which tends to keep genetic variability and hence equalizes allele frequencies, contrary to genetic drift that tends to make differences in allele frequencies by chance.
We tested eight microsatellite markers across 12 populations of the European black poplar in the Danube Basin to determine whether selection was acting on loci. We used the FST method described in Cavalli-Sforza (1966) and Beaumont (2005) to evaluate the relationship between FST and HE. LOSITAN software (http://popgen.eu/soft/losi, Beaumont and Nichols, 1996; Antao et al., 2008) was used to implement the FST method and to test for outlier loci. The overall sample was analyzed in two runs (for 15000 simulations) under a stepwise mutation model. The first run optimized the baseline FST while the second run evaluated the outliers. We used that distribution of values to identify outlier loci that potentially had an excessively high or low FST value compared with the estimated baseline FST.
The obtained results suggest the neutrality of the microsatellites analyzed, except one locus, which is under a balancing selection trend (Table 3.15. and Figure 3.6.).
Table 3.15. Relationship between FST and HE. LOSITAN software was used to implement the FST method and to test for outlier loci.
Locus
WPMS03
WPMS05
WPMS08
WPMS09
WPMS12
PMGC14
WPMS16
WPMS18
HE
0.874525
0.867722
0.82838
0.841632
0.702038
0.818594
0.790722
0.804075
FST
0.040278
0.040292
0.038817
0.014055
0.022289
0.006925
0.020749
0.04329
P (FST<sample FST)
0.959595
0.948669
0.907126
0.054395
0.421413
0.004664 outlier0.300407
0.949514
Table 3.15. Relationship between FST and HE. LOSITAN software was used to implement the FST method and to test for outlier loci.

112 / Variability of European Black Poplar (Populus nigra L.) in the Danube Basin Variability of European Black Poplar (Populus nigra L.) in the Danube Basin / 113
Figure 3.6. Graphical view of the test for selective neutrality. Locus 1-WPMS16; locus 2- WPMS12; locus 3- PMGC14; locus 4- WPMS18; locus 5- WPMS08. locus 6- WPMS09; locus 7- WPMS03; locus 8- WPMS05
3.3.6. Genetic distances between populations
Based on the genetic distances between individuals or groups of individuals, graphical presentation (dendrogram) of their relatedness can be drawn. The mean distances between populations were computed by GenAlEx 6.5 platform (Peakall and Smouse, 2012). UPGMA (Unweighted Pair Group Method with Arithmetic Mean) and NJ (Neighbor Joining) plots were made in NTSYSpc software, v. 2.1 (Rohlf, 2005).
Mean genetic distances between populations of the European black poplar in the Danube Basin observed in the plots of hierarchical cluster analyses (UPGMA and NJ) were substantially low (Figure 3.7. and 3.8.).
Figure 3.7. UPGMA dendrogram presenting mean genetic distances between assessed populations
Figure 3.8. NJ dendrogram presenting mean genetic distances between assessed populations
UPGMA dendrogram clustered geographically closer populations into joint clusters (Figure 3.7.). The similar trend can be observed in NJ dendrogram (Figure 3.8.).
3.4. Implications for conservation and restoration of the European black poplar in the Danube Basin
The European black popular has a wide distribution and can be found nearly all over Europe, but due to the mentioned threats it is one of the rarest and most endangered trees (Pospíšková and Šálková, 2006). Riparian forests are very dynamic ecosystems subjected to changes in river path, flooding, sequences of evolution stages, and pioneer species such as poplars tend to be quickly replaced. For these reasons, the protection of restricted ecological zones, even with appropriate silvicultural management that ensure the survival of the species, is not be enough. It was estimated that more than 99% of riparian forests in Europe vanished by different human activities (Lefèvre et al., 1998), and this is the reason why many institutes in European countries have carried out substantial work for ex situ conservation of genetic diversity of P. nigra and in situ conservation activities in riparian ecosystems, with international collaboration.
This book is a result of such collaboration of people from 12 protected areas belonging to eight countries and their joint effort to comprehensively evaluate the current genetic state of P. nigra variability throughout its riparian habitat along the Danube flow. The presented results demonstrate that the primal condition for a successful conservation of P. nigra is presented in the region along the Danube flow, since all analyzed populations collected from the protected areas possess a high level of genetic variability at the microsatellite loci. Therefore, they can be considered as source populations for further conservation and restoration, and thus local diversity can be preserved and a capacity for natural regeneration can be offered.
-0.10
-0.09
-0.08
-0.07
-0.06
-0.05
-0.04
-0.03
-0.02
-0.01
0.00
0.01
0.02
0.03
0.04
0.05
0.06
0.07
0.08
0.09
0.00 0.05 0.10 0.15 0.20 0.25 0.30 0.35 0.40 0.45 0.50 0.55 0.60 0.65 0.70 0.75 0.80 0.85
Markers Candidate balancing selection Candidate neutral Candidate positive selection
He
Fst
Fst/He
Locus_2 Locus_1Locus_7
Locus_3
Locus_5Locus_6Locus_4

114 / Variability of European Black Poplar (Populus nigra L.) in the Danube Basin Variability of European Black Poplar (Populus nigra L.) in the Danube Basin / 115
Although genetic variability is present, the question is how to further preserve this diversity considering specific requirements for the species regeneration in nature. Natural regeneration of P. nigra is patchy and sporadic, requiring specific conditions in terms of moisture of sediment (Legionnet et al., 1999) that are just periodically met. One clear illustration of the sporadic nature of regeneration is a strong age structure, which is a direct consequence of the history of flooding (Heinze, 1998). The sensitive regeneration is even more restricted by human activities, such as prevention of natural flooding by managing riverbanks. In addition, many native populations have been fragmented by commercially exploited hybrid poplars.An important strategy that should be implemented is in situ conservation (Figure 3.9.). In order to conserve the adaptive capacity of a species, the most advisable action to take would be the protection and enhancement of its natural habitats, to maintain the gene complexes that have evolved and that will evolve over time in response to environmental changes.
Figure 3.9. Young European black poplar (photo: Baumgartner / Donau-Auen National Park)
The in situ conservation, however, might not be applicable to P. nigra in large parts of its range along the Danube due to urbanization, and because the natural stands of this species are often very disturbed and fragmentary, and cannot be preserved from high gene flow by the establishment of large protection bands. Furthermore, the conservation of in situ genetic resources could be limited to restricted areas, such are riparian forests, isolated from cultivated poplar accessions with uniform genetic material. We suggest conservation of old trees in each population of the European black poplar in the Danube Basin, because they most likely represent the source of the original genetic constitution, which did not suffer from genetic introgression. Old trees also possess tendency for larger amount of genetic variability and inbreeding than juvenile (Rathmacher et al., 2010). It is clear that
genetic differentiation between populations along the Danube is not considerable, especially between neighboring populations. Differences gradually accumulate with geographical distance, without ability to strictly define specific genetic pools.
Significant heterozigocity excess has been documented by microsatellites in a population from Croatia (Lonjsko Polje Nature Park, NPLP), indicating that this population has experienced a recent reduction in effective population size. Additionally, according to leaf morphometric parameters (Chapter 2), this population is more similar to the Romanian population (DDBR) than to other nearby populations. This similarity is probably influenced by random factors, influenced by a decrease in population number. If specific local and endangered populations are to be conserved, it is important to know how far populations can coexist and still remain in contact through gene flow. Therefore, conservation strategies for P. nigra in the Danube Basin should focus on maintaining and promoting metapopulations that are close enough to each other, so they can protect themselves from random genetic deterioration (Rathmacher et al., 2010). The population in close vicinity is more likely to possess genetic variability that will enable adaptivity for the endangered local populations since the ecological conditions that shape genetic variability are similar. We suggest the genetic characterization of nearby populations along the Sava River and the evaluation of the current state of P. nigra in this region, but also its population history, in order to select populations that could potentially serve as a source of genetic diversity. Maintenance of the current state and possible genetic improvement of this specific population, together with the efficient conservation strategies, could prevent it from further genetic degradation.
Rathmacher et al. (2010) analyzed local significance of gene flow for the spatial genetic structure of P. nigra. They showed reduced genetic diversity and inbreeding in the juvenile part of a population and also stressed the need for providing multiple and scattered sights for natural regeneration for preserving high genetic diversity present in natural populations. The amount of gene flow by pollen and seeds in P. nigra is such that single, small habitats for seedling establishment usually contain only few local genotypes from the close vicinity. If conditions for multiple scattered sight for seedling could not be obtained, human assistance is further needed, and these limited sights should be seeded by carefully selected diverse genotypes. Ex situ conservation could be crucial in this respect.
The results of morphological analysis of the European black poplar in the Danube Basin suggest four or five clusters. Populations from Germany (Donauauwald Neuburg-Ingolstadt, DNI), Slovakia (Protected landscape area Dunajské luhy, PLADL) and Hungary (Fertő-Hanság National Park, FHNP and Danube-Drava National Park, DINP) are clearly separated in individual clusters from the main cluster, which is formed of populations from Austria, Croatia, Serbia, Bulgaria and Romania. According to the results of microsatellite analysis, the population from Germany (DNI) is distinguishable on one side of the dendogram, while two populations from Bulgaria (Nature Park Rusenski Lom, NPRL and Persina Nature Park, PNP) and one population from Romania (Danube Delta Biosphere Reserve, DDBR) are clustered together on the other side. However, there are no clear genetic differences among the rest of the populations due to extremely high intrapopulation variations. The results from the two markers systems are congruent only in diversification of the population from Germany (DNI) from other populations.

116 / Variability of European Black Poplar (Populus nigra L.) in the Danube Basin Variability of European Black Poplar (Populus nigra L.) in the Danube Basin / 117
These findings are not unusual, since morphological characteristics are originating from a different expression of the coding regions of genome and are generally under the influence of environmental factors, as well as evolutionary mechanisms and pressures. On the other hand, microsatellites are mostly an integral part of the noncoding regions of genome, which rather unfold close phylogenetic relationships. Two presented systems alone cannot reflect the actual picture of total variations in natural populations of the European black poplar, and it is advisable to combine their informativeness or apply them with other markers for a more precise recognition of variability in populations.
The results of morphological analyses for 12 populations of the European black poplar in the Danube Basin do not entirely support the results of molecular analysis, but they generally support the similarity among neighboring populations. According to this, suitable areas should be reforested by reproductive or planting material of its own indigenous Populus nigra population, obtained by generative or vegetative reproduction. If it is not manageable or if it is not possible to obtain sufficiently vital and vigorous material, then the planting material from the nearest population should be used.
Secondary genetic resources (ex situ conservation) are also of crucial importance. Ex situ conservation could include the formation of germplasm collections (e.g. arboretums), which would represent the genetic diversity of defined areas along the Danube. The collection of germplasm must be made by taking into consideration the results obtained from the studies on genetic variability. Additionally, the extensive genotypization of the genotypes selected for germplasm collections should be performed. Such ex situ collections should be extended, and the “core collections”, representing the diversity within populations should be kept in several contrasted environments. The goals of such a conservation strategy is to maintain a large gene pool that may ensure the potential for natural adaptation, but also to provide base material for further restoration of riparian forests and eventual reintroduction actions, by using technology appropriate for the conditions in the area (particularly considering the flooding regime and depth of ground water) (Schulzke, 2004). Since the European black poplar is an allogamous species for which an important genetic load is expected, the impact of inbreeding on the mean fitness of the population may be important. For these reasons, restoration of populations should be practiced by using selected individual clones (from old trees) rather than seed progenies. However, the in situ conditions should be improved in order to support generative propagation (Barsoum, 2001). Plant material should be carefully collected, taking into account the geographical distance between populations, safety distance between sampled trees, age of trees, population size and even a sex ratio. Germplasm collection size should be large enough to avoid the effect of genetic drift on the genetic diversity and on the level of inbreeding. Additionally, seeds of P. nigra should be collected only in the areas where the risk of genetic pollution is reduced to the minimum.
Genetic characterization of European black poplar populations should be performed periodically, while monitoring the regeneration of species in order to evaluate population dynamics, to ensure sustainability and efficient management of genetic resources, and finally to apply appropriate in situ and/or ex situ conservation practice when necessary. Conservation strategies should be developed with an utmost care, and any new information that will shed more light on the species biology could be
crucial. Therefore, further characterization of P. nigra populations along the Danube, by introducing other molecular markers of different properties (type of dominance and inheritance, mutation rate, adaptivity, etc) is needed. In addition, diverse parameters that influence the dynamics of population in natural populations should be accounted for in further and enhanced genetic studies.

118 / Variability of European Black Poplar (Populus nigra L.) in the Danube Basin Variability of European Black Poplar (Populus nigra L.) in the Danube Basin / 119
Aguirre-Planter, E., Furnier, G.R., Eguiarte, L.E. (2000): Low levels of genetic variation within and high levels of genetic differentiation among populations of species of Abies from southern Mexico and Guatemala. American Journal of Botany, 87(3): 362–371.
Adnađević, T., Bugarski-Stanojević, V., Blagojević, J., Stamenković, G., Vujošević, M. (2012): Genetic differentiation in populations of the yellow-necked mouse Apodemus flavicollis, harbouring B chromosomes in different frequencies. Population Ecology, 54(4): 537–548.
Allen, A.P., Brown, J.H., Gillooly, J.F. (2002): Global biodiversity, biochemical kinetics, and the energetic-equivalence rule. Science, 297: 1545–1554.
Anđelković, M., Stamenković-Radak, M. (2013): Geni u populacijama. Univerzitet u Beogradu - Biološki fakultet, Alta Nova, Beograd.
Antao, T., Lopes, A., Lopes, R.J., Beja-Pereira, A., Luikart, G. (2008): LOSITAN: A workbench to detect molecular adaptation based on a FST-outlier method. BMC Bioinformatics, 9: 323.
Aranguaren-Mendez, J., Gomez, M., Jordana, J. (2002): Hieararchical analysis of genetic structure in Spanish donkey breeds using microsatellite markers. Heredity, 89: 207-211.
Arens, P., Coops, H., Jansen, J., Vosman, B. (1998): Molecular genetic analysis of black poplar (Populus nigra L.) along Dutch rivers. Molecular Ecology, 1: 11–18.
Banjanac, T., Šiler, B., Skorić, M., Ghalawenji, N., Milutinović, M., Božić, D., Mišić, D. (2014): Interspecific in vitro hybridization in genus Centaurium and identification of hybrids via flow
cytometry, RAPD, and secondary metabolite profiles. Turkish Journal of Botany, 38(1): 68–79.
Beaumont, M.A., Nichols, R.A. (1996): Evaluating loci for use in the genetic analysis of population structure. Proceedings of the Royal Society of London, Series B, 263: 1619–1626.
Beaumont, M.A. (2005): Adaptation and speciation: what can Fst tell us? Trends in Ecology & Evolution, 20(8): 435–440.
Bugarski-Stanojević, V., Blagojević, J., Stamenković, G., Adnađević, T., Giagia-Athanasopolou, E.B., Vujošević, M. (2011): Comparative study of the phylogenetic structure in six Apodemus species (Mammalia, Rodentia) inferred from ISSR-PCR data. Systematics and Biodiversity, 9(1): 95–106.
Callagen, D.F., Thompson, A.D., Shen, Y., Phillips, H.A., Richards, H.A., Mulley, J.C., Sutherland, G.R. (1993): Incidence and origin of “null” alleles in the (AC) in microsatellite markers. American Journal of Human Genetics, 52(5): 922–927.
Cagelli, L., Lefèvre, F. (1995): The conservation of Populus nigra L. and gene flow with cultivated poplars in Europe. Forest Genetics, 2(3): 135–144.
Castro, J.A., Ramon, M.M., Picornell, A., Moya, A. (1999): The genetic structure of Drosophila subobscura populations from the islands of Majorca and Minorca (Balearic Islands, Spain) based on allozymes and mitochondrial DNA. Heredity, 83: 271–279.
Cavalli-Sforza, L.L. (1966): Population Structure and Human Evolution. Proceedings of the Royal Society of London, Series B, Biological Science, 995(164): 362–379.
References:

120 / Variability of European Black Poplar (Populus nigra L.) in the Danube Basin Variability of European Black Poplar (Populus nigra L.) in the Danube Basin / 121
Cervera, M.T., Storme, V., Ivens, B., Gusmao, J., Liu, B.H., Hostyn, V., VanSlycken, J., Van Montagu, M., Boerjan, W. (2001): Dense genetic linkage maps of three Populus species (P. deltoids, P. nigra and P. trichocarpa) based on AFLP and microsatellite markers. Genetics, 158: 787–809.
Chung, M.Y., Nason, J.D., Chung, M.G. (2004): Spatial genetic structure in populations of the terrestrial orchid Cephalanthera longibracteata (Orchidaceae). American Journal of Botany, 91(1): 52–57.
Cornet, J.M, Luikart, G. (1996): Description and power analysis of two tests for detecting recent population bottlenecks from allele frequency data. Genetics, 144: 2001–2014.
Cottrell, J.E., Krystufek, V., Tabbener, H.E., Milner, A., Connelly, T. Sing, L., Fluch, S., Burg, K., Lefèvre, F. Achard, P. Bordács, S., Gebhardt, K., Vornam, B., Smulders R., Vanden Broeck, A.H., Van Slycken, J., Storme, V., Boerjan, W., Castiglione, S. Fossati, T., Alba, N., Agúndez, D., Maestro, C., Novitol, E., Bovenschen, J. and van Dam, B. (2005): Post glacial migration of Populus nigra L: lessons learnt from chloroplast DNA. Forest Ecology and Management, 206: 71–90.
Dillon, M.E., Wang, G., Huey R.B. (2010): Global metabolic impacts of recent climate warming. Nature, 467: 704–706.
DiRienzo, A., Peterson, A.C., Garza, J.C., Valdes, A.M., Slatkin, M., Freimer, N.B. (1994) Mutational processes of simple-sequence repeat loci in human populations. Proceedings of the National Academy of Sciences USA, 91: 3166–3170.
Earl, D.A., von Holdt, B.M. (2012): STRUCTURE HARVESTER: a website and
program for visualizing STRUCTURE output and implementing the Evanno method. Conservation Genetics Resources, 4(2): 359–361.
El Mousadik, A., Petit, R.J. (1996): Chloroplast DNA phylogeography of the argan tree of Morocco. Molecular Ecology, 5: 547–555.
Excoffier, L., Lischer, H.E.L. (2010): Arlequin suite ver 3.5: A new series of programs to perform population genetics analyses under Linux and Windows. Molecular Ecology Resources, 10: 564–567.
Evanno, G., Regnaut, S., Goudet, J. (2005): Detecting the number of clusters of individuals using the software STRUCTURE: a simulation study. Molecular Ecology, 14: 2611–2620.
Falkowski, P.G., Algeo, T., Codispoti, L., Deutsch, C., Emerson, S., Hales, B., Huey, R.B., Jenkins, W.J., Kump, L.R., Levin, L.A., Lyons, T.W., Nelson, N.B., Schofield, O.S., Summons, R., Talley, L.D., Thomas, E., Whitney, F., Pilcher, C.B. (2011): Ocean deoxygenation: Past, present, and future. EOS Transactions AGU, 92: 409–420.
FAO, (2010): Global Forest Resources Assessment. FAO, Rome, Italy
Faurby, S., Pertoldi, C. (2012): The consequences of the unlikely but critical assumption of stepwise mutation in the population genetic software, MSVAR. Evolutionary Ecology Research, 14: 859–879.
Falush, D., Stephens, M., Pritchard, J.K. (2003): Inference of population structure using multilocus genotype data: linked loci and correlated allele frequencies. Genetics, 164: 1567–1587.
Fossati, T., Grassi, F., Sala, F., Castiglione,
S. (2003): Molecular analysis of natural populations of Populus nigra L. intermingled with cultivated hybrids. Molecular Ecology, 12: 2033–2043.
Franklin, J. (2010): Mapping Species Distributions: Spatial Inference and Prediction. Cambridge: Cambridge University Press.
Friedberg, E.C., Walker, G.C., Siede, W., Wood, R.D., Schultz, R.A., Ellenberger, T. (2006): DNA Repair and Mutagenesis. ASM Press, Washington, D.C.
Fu, Y., Chakraborty, R. (1998): Simultaneous estimation of all the parameters of a step-wise mutation model. Genetics, 150: 487–497.
Garza, J.C., Williamson, E.G. (2001): Detection of reduction in population size using data from microsatellite loci. Molecular Ecology, 10: 305–318.
Goudet, J. (1995): FSTAT (Version 1.2): a computer program to calculate F-statistics. Journal of Heredity, 86: 485–486.
Gaudet, M., Jorge, V., Paolucci, I., Beritognolo, I., Scarascia Mugnozza, G., Sabatti, M. (2008): Genetic linkage maps of Populus nigra L. including AFLPs, SSRs, SNPs, and sex trait. Tree Genetics & Genomes, 4: 25–36.
Guisan, A, Zimmermann, N. (2000): On the use of static distribution models in Ecology. Ecological Modelling, 135: 147–186.
Hamrick, J.L., Godt, M.J.W. (1989): Allozyme diversity in plant species. In A. H. D. Brown, M. T. Clegg, A. L. Kahler, and B. S. Weir [eds.], Plant population genetics, breeding and genetic resources, 43–63.
Sinauer, Sunderland, MA.
Hammer, Ø., Harper, D., Ryan, P.D. (2001): PAST: Paleontological statistics software package for education and data analysis. Paleontologia Electronica, 4: 9.
Hancock, J. M. (2000): Microsatellites and other simple sequences: genomic context and mutational mechanisms. In D. B. Goldstein and C. Schlötterer, eds. Microsatellites: evolution and applications. Oxford University Press, Oxford.
Harr, B., Todorova, J., Schlötterer, C. (2002): Mismatch repair-driven mutational bias in D. melanogaster. Molecular Cell, 10: 199–205.
Hartl, D. L., Clark, A. G. (1997): Principles of population genetics. Third ed. Sunderland, MA: Sinauer Associates.
Hedrick, P.W. (1999): Perspective: Highly variable loci and their interpretation in evolution and conservation. Evolution, 53(2): 313–318.
Hedrick, P.W. (2005): A standardized genetic differentiation measure. Evolution, 59:1633–1638.
Heinze, B. (1998): Erhaltung der Schwarzpappel in Österreich - forstwirtschaftliche, genetische und ökologische Aspekte, Forstliche Bundesversuchsanstalt Wien.
Herpka, I. (1986): A survey on development and possibilities of growing: natural forest of poplars and willows. In: Poplars and willows. Poplar Research Institute, Novi Sad, pp. 21–36.
Hewitt, G.M. (2004): Genetic consequences of climatic oscillations in the Quaternary. Philosophical

122 / Variability of European Black Poplar (Populus nigra L.) in the Danube Basin Variability of European Black Poplar (Populus nigra L.) in the Danube Basin / 123
Transactions of the Royal Society B, 359: 183–195.
Huang, Q., Xu, F., Shen, H., Deng, H., Liu, Y., Liu, Y., Li, J., Recker, R.R., Deng, H. (2002): Mutation patterns at dinucleotide microsatellite loci in humans. American Journal of Human Genetics, 70: 625–634.
Hubisz, M.J., Falush, D., Stephens, M., Pritchard, J.K. (2009): Inferring weak population structure with the assistance of sample group information. Molecular Ecology Resources, 9: 1322–1332.
Imbert, E., Lefèvre, F. (2003): Dispersal and gene flow of Populus nigra (Salicaceae) along a dynamic river system. Journal of Ecology, 91: 447–456.
Jelić, M., Kenig, B., Kurbalija, Z., Stamenković-Radak, M., Anđelković, M. (2009): Intra-species differentiation among Drosophila subobscura from different habitats in Serbia. Archivers of Biological Sciences, (Belgrade), 61(3): 513–521.
Jelić, M., Castro, J.A., Kurbalija Novičić, Z., Kenig, B., Dimitrijević, D., Savić Veselinović, M., Jovanović, M., Milovanović, D., Stamenković-Radak, M., Andjelković, M. (2012a): Absence of linkage disequilibria between chromosomal arrangements and mtDNA haplotypes in natural populations of Drosophila subobscura from the Balkan Peninsula. Genome, 55(3): 214–21.
Jelić, M., Kenig, B., Tanasković, M., Stamenković-Radak, M., Anđelković, M. (2012b): Relationship between chromosomal and mitochondrial DNA variability of Drosophila subobscura population from the Lazar’s River Canyon. Genetika, 44(2): 409–417.
Kenig, B., Stamenković-Radak, M., Andjelković, M. (2013): Population specific
fitness response of Drosophila subobscura to lead pollution. Insect Science, 20: 245–253.
Kjærsgaard, A., Le, N., Demontis, D., Kurbalija Novičič, Z., Loeschcke, V., Pertoldi, C. (2012): The effect of developmental temperature fluctuation on wing traits and stressed locomotor performance in Drosophila melanogaster, and its dependence on heterozygosity. Evolutionary Ecology Research, 14: 803–819.
Kristensen, T.N., Overgaard, J., Hoffmann, A.A., Nielsen, N.C., Malmendal, A. (2012): Inconsistent effects of developmental temperature acclimation on low-temperature performance and metabolism in Drosophila melanogaster. Evolutionary Ecology Research, 14: 821–837.
Kurbalija Novičić, Z., Jelić, M., Jovanović, M., Dimitrijević, D., Savić Veselinović, M., Stamenković-Radak, M., Ađelković, M. (2011): Microsatellite variability of Drosophila subobscura populations from the central Balkans. Evolutionary Ecology Research, 13(5): 479–494.
Kurbalija Novičić, Z., Kenig, B., Ludoški, J., Stamenković-Radak, M., Anđelković, M. (2012a): Lead-Induced Variation in Wing Size and Shape in Populations of Drosophila subobscura. Environmental Entomology, 41(4): 979–988.
Kurbalija Novičić, Z., Pertoldi, C., Randi, E., Nygaard Kristensen, T., Santos, M., Milankov, V., Stamenković-Radak, M., Anđelković, M. (2012b): Conservation biology: The need for multidisciplinary approaches. Evolutionary Ecology Research, 14(4): 787–791.
Kurbalija Novičić, Z., Jelić M., Savić T., Savić Veselinović, M., Dimitrijević, D.,
Jovanović M., Kenig, B., Stamenkoivć-Radak, M., Andjelković M. (2013): Effective population size in Drosophila subobscura: ecological and molecular approaches. Journal of Biological Research-Thessaloniki, 19: 65–74.
Lande, R. (1988): Genetics and Demography in Biological Conservation. Science, New Series, 241(4872): 1455–1460.
Lefèvre, F., Kajba, D., Heinze, B., Rotach, P., de Vries, S.M.G., Turok, J. (1998): Strategies for the conservation of a pioneer tree species, Populus nigra L., in Europe. Genetics Selection Evolution, 30: 181–196.
Lefèvre, F., Kajba, D., Heinze, B., Rotach, P., de Vries, S.M.G., Turok, J. (2001): Black poplar: A model for gene resource conservation in forest ecosystems. Forestry Chronicle, 77: 239–244.
Legionnet, A., Lefèvre, F. (1996): Genetic variation of the riparian pioneer tree species Populus nigra. I Study of population structure based on isozymes. Heredity, 77: 629–637.
Legionnet, A., Muranty, H., Lefèvre, F. (1999): Genetic variation of the riparian pioneer tree species Populus nigra. II Variation in susceptibility to the foliar rust Melampsora larici-populina. Heredity, 82: 318–327.
Leroy, S.A.G., Arpe, K. (2007): Glacial refugia for summer-green trees in Europe and south-west Asia as proposed by ECHAM3 time-slice atmospheric model simulations. Journal of Biogeography, 34: 2115–2128.
May, R. (2010): Tropical arthropod species, more or less? Science, 329: 41–42.
Mora, C., Tittensor, D.P., Adl, S., Simpson, A.G.B., Worm, B. (2011): How many species are there on Earth and in the ocean? PLoS Biology, 9(8): e1001127.
Médail, F., Diadema, K. (2009): Glacial refugia influence plant diversity patterns in the Mediterranean Basin. Journal of Biogeography, 36: 1333–1345.
Mucci, N., Mattucci, F., Randi, E. (2012): Conservation of threatened local gene pools: landscape genetics of the Italian roe deer (Capreolus c. italicus) populations. Evolutionary Ecology Research, 14: 897–920.
Naiman, R.J., Decamps, H., McClain, M.E. (2005): Riparia: Ecology, Conservation, and Management of Streamside Communities (Ed. Maragioglio, N.). Elsevier Academic Press, USA.
Nei, M. (1973): Analysis of gene diversity in subdivided populations. Proceedings of the National Academy of Sciences USA, 70: 3321–3323.
Novacek, M.J. (2000): The Biodiversity Crisis: Losing What Counts, American Museum of Natural History.
Nybom, H. (2004): Comparison of different nuclear DNA markers for estimating intraspecific genetic diversity in plants. Molecular Ecology, 13: 1143–1155.
Ohta, T., Kimura, M. (1973): A model of mutation appropriate to estimate the number of electrophoretically detectable alleles in a finite population. Genetics Research, 22: 201–204.
Patenković, A., Stamenković-Radak, M., Banjanac, T., Anđelković, M. (2009): Antimutagenic effect of sage tea in the wing spot test of Drosophila

124 / Variability of European Black Poplar (Populus nigra L.) in the Danube Basin Variability of European Black Poplar (Populus nigra L.) in the Danube Basin / 125
melanogaster. Food and Chemical Toxicology, 47: 180–183.
Patenković, A., Stamenković-Radak, M., Nikolić, D., Marković, T., Anđelković, M. (2013): Synergistic effect of Gentiana lutea L. on methyl methanesulfonate genotoxicity in the Drosophila wing spot test. Journal of Ethnopharmacology, 146: 632–636.
Pereira, H.M., Leadley, P.W., Proença, V., Alkemade, R., Scharlemann, J.P.W., Fernandez-Manjarrés, J.F., Araújo, M.B., Balvanera, P., Biggs, R., Cheung, W.W.L., Chini, L., Cooper, H.D., Gilman, E.L., Guénette, S., Hurtt, G.C., Huntington, H.P., Mace, G.M., Oberdorff, T., Revenga, C., Rodrigues, P., Scholes, R.J., Sumaila, U.R., Walpole, M. (2010): Scenarios for global biodiversity in the 21st century. Science, 330(6010): 1496–1501.
Petersen, G. Seberg, O. (1998): Molecules vs. morphology: Molecular tools for biodiversity. Plants and animals, s. 357-364, Karp, A., Issac, P.G., Ingram, D.S. Chapman & Hall, London.
Peakall, R. Smouse, P.E. (2012): GenAlEx 6.5: genetic analysis in Excel. Population genetic software for teaching and research – an update. Bioinformatics, 28: 2537–2539.
Pertoldi, C., Pellegrino, I., Cucco, M., Mucci, N., Randi, E., Laursen, J.T., Sunde, P., Loeschcke, V. Kristensen, T.N. (2012): Genetic consequences of population decline in the Danish population of the little owl (Athene noctua). Evolutionary Ecology Research, 14: 921–932.
Pritchard, J.K., Stephens, M., Donnelly, P. (2000): Inference of population structure using multilocus genotype data. Genetics, 155: 945–959.
Pospíšková, M., Šálková, I. (2006): Population structure and parentage analysis of black poplar along the Morava River. Canadian Journal of Forest Research, 36: 1067–1076.
Rajora, O.P., Zuffa, L., Dancik, B.P. (1991): Allozyme and leaf morphological variation of eastern cottonwood at the northern limits of its range in Ontario. Forest Science, 37(2): 688–702.
Rathmacher, G., Niggemann, M., Kohnen, M., Ziegenhagen, B., Bialozyt, R. (2010): Short-distance gene flow in Populus nigra L. accounts for small-scale spatial genetic structures: implications for in situ conservation measures. Conservation Genetics, 11: 1327–1338.
Raup, D.M. (1994): The role of extinction in evolution. Proceedings of the National Academy of Sciences, USA, 91: 6758–6763.
Rogić, B., Tomić, L., Važić, B., Jelić, M., Jovanović, S., Savić, M. (2011): Assessment of genetic diversity of Buša cattle from Bosnia and Herzegovina using microsatellite DNA markers. Archives of Biological Sciences (Belgrade), 63 (4): 1077–1085.
Rohlf, F.J. (2005): NTSYS-pc: numerical taxonomy and multivariate analysis system, version 2.2. Exeter Software: Setauket, NY
Russell, P.J. (2003): Essential iGenetics. Blackwell Scientific publication, Oxford, UK.
Savić, M., Patenković, A., Stamenkovic-Radak, M., Anđelković, M. (2008): Variability of fluctuating asymmetry in ovariole number of Drosophila subobscura caused by microclimatic difference.
Archives of Biological Sciences (Belgrade), 60: 1P–2P.
Savić, T., Patenković, A., Stamenković-Radak, M., Anđelković, M. (2011): Adaptive significance of amylase polymorphism in Drosophila. XV: Examination of genotype-by-environment interactions on the viability, developmental time and stability of Drosophila subobscura homozygous for Amy during exposure to nutritional changes. Archives of Biological Sciences (Belgrade), 63: 1273–1286.
Savić T., Patenković, A., Soković, M., Glamočlija, J., Anđelković, M., van Griensven, L. J. L. D. (2011): The Effect of Royal Sun Agaricus, Agaricus brasiliensis S. Wasser et al. Extract on Methyl Methanesulfonate Caused Genotoxicity in Drosophila melanogaster. International Journal of Medicinal Mushrooms, 13: 377–385.
Schemske, D.W., Husband, B.C., Ruckelshaus, M.H., Goodwillie, C., Parker, I.M., Bishop, J.G. (1994): Evaluating approaches to the conservation of rare and endangered plants. Ecology, 75(3): 584–606.
Skorić, M., Šiler, B., Banjanac, T., Nestorović Živković, J., Dmitrović, S., Mišić, D., Grubišić, D. (2012): The reproducibility of RAPD profiles: Effects of PCR components on RAPD analysis of four Centaurium species. Archives of Biological Sciences, 64(1): 191–199.
Smith, J.B., Schneider, S.M., Oppenheimer, M., Yohe, G.W., Hare, W., Mastrandrea, M.D., Patwardhan, A., Burton, I., Cofree-Moriot, J., Magadza, C.H.D., Fussel, H., Pittock, A.B., Rahman, A., Suarez, A., van Ypersele, J. (2009): Assessing dangerous climate change through an update of the Intergovernmental Panel on Climate Change (IPCC) ‘reasons’ for concern.
Proceedings of the National Academy of Sciences, USA, 106: 4133–4137.
Smulders, M.J.M., van der Schoot, J., Arens, P., Vosman, B. (2001): Trinucleotide repeat microsatellite markers for black poplar (Populus nigra L.). Molecular Ecology Notes, 1: 188–190.
Smulders, M.J.M., Cottrell, J.E., Lefèvre, F., van der Schoot, J., Arens, P., Vosman, B., Tabbener, H.E., Grassi, F., Fossati, T., Castiglione, S., Krystufek, V., Fluch, S., Burg, K., Vornam, B., Pohl, A., Gebhardt, K., Alba, N., Agúndez, D., Maestro, C., Notivol, E., Volosyanchuk, R., Pospíšková, M., Bordács, S., Bovenschen, J., van Dam, B.C., Koelewijn, H.P., Halfmaerten, D., Ivens, B., van Slycken, J., Vanden Broeck, A., Storme, V., Boerjan, W. (2008): Structure of the genetic diversity in black poplar (Populus nigra L.) populations across European river systems: Consequences for conservation and restoration. Forest Ecology and Management, 255: 1388–1399.
Stamenković-Radak, M., Rašić, G., Savić, T., Kalajdžić P., Kurbalija Z., Kenig B., Anđelković M. (2008): Monitoring of the genetic structure of natural populations: change of the effective population size and inversion polymorphism in Drosophila subobscura. 133(1): 57–63.
Stamenković-Radak, M., Jelić, M., Kurbalija, Novičić, Z., Kenig, B., Tanasković, M., Anđelković, M. (2012): Balkan glacial history and modern Drosophila subobscura population genetics. Evolutionary Ecology Research, 14(7): 839–858.
Storme, V., Vanden Broeck, A., Ivens, B., Halfmaerten, D., Van Slycken, J., Castiglione, S., Grassi, F., Fossati, T., Cottrell, J.E., Tabbener, H.E., Lefèvre, F., Saintagne, C., Fluch, S., Krystufek,

126 / Variability of European Black Poplar (Populus nigra L.) in the Danube Basin Variability of European Black Poplar (Populus nigra L.) in the Danube Basin / 127
V., Burg, K., Bordács, S., Gebhardt, K., Vornam, B., Pohl, A., Alba, N., Agúndez, D., Bovenschen, J., Van Dam, B.C., Van der Schoot, J., Vosman, B., Boerjan, W., Smulders, M.J.M. (2004): Ex-situ conservation of black poplar in Europe: genetic diversity in nine gene bank collections and their value for nature development. Theoretical and Applied Genetics, 108: 969–981.
Šiler, B., Avramov, S., Banjanac, T., Cvetković, J., Nestorović, J., Patenković, A., Mišić, D. (2012): Secoiridoid glycosides as a marker system in chemical variability estimation and chemotype assignment of Centaurium erythraea Rafn from the Balkan Peninsula. Industrial Crops and Products, 40: 336–344.
The Intergovernmental Panel on Climate Change (IPCC) (2013). Climate Change 2013: The Physical Science Basis. Contribution of Working Group I to the Fifth Assessment Report of the Intergovernmental Panel on Climate Change [Stocker, T.F., Qin, D., Plattner, G.-K., Tignor, M., Allen, S.K., Boschung, J., Nauels, A., Xia, Y., Bex, V., Midgley, P.M. (eds.)]. Cambridge University Press, Cambridge, United Kingdom and New York, NY, USA.
Thomas, C.D., Cameron, A., Green, R.E., Bakkenes, M. Beaumont, L.J., Collingham, Y.C., Erasmus, B.F.N., de Siqueira, M.F., Grainger, A., Hannah, L., Hughes, L., Huntley, B., van Jaarsveld, A.S., Midgley, G.F., Miles, L., Ortega-Huerta, M.A., Townsend Peterson, A., Phillips, O.L., Williams, S.E. (2004): Extinction risk from climate change. Nature, 427: 145–148.
Vanden Broeck, A., Storme, V., Cottrell, J.E., Boerjan, W., Van Bockstaele, E., Quataert, P., Van Slycken, J. (2004): Gene flow between cultivated poplars and native black poplar (Populus nigra L.): a
case study along the river Meuse on the Dutch-Belgian border. Forest Ecology and Management, 197: 307–310.
Vanden Broeck, A., Cottrell, J., Quataert, P., Breyne, P., Storme, V., Boerjan, W., Van Slycken, J. (2006): Paternity analysis of Populus nigra L. offspring in a Belgian plantation of native and exotic poplars. Annals of Forest Science, 63: 783–790.
van der Schoot, J., Pospíšková, M., Vosman, B., Smulders, M.J.M. (2000): Development and characterization of microsatellite markers in black poplar (Populus nigra L.). Theoretical and Applied Genetics, 101: 317–322.
van Treuren, R., Kuittinen, H., Kärkkäinen, K., Baen-Gonzalez, E., Savolainen, O. (1997): Evolution of microsatellites in Arabis petraea and Arabis lyrata, outcrossing relatives of Arabidopsis thaliana. Molecular Biology and Evolution, 14: 220–229.
Wattier, R., Engel, C.R., Saumitou-Laprade, P., Valero, M. (1998): Short allele dominance as a source of heterozygote deficiency at microsatellite loci: experimental evidence at the dinucleotide locus Gv1CT in Gracilaria gracilis (Rhodophyta). Molecular Ecology, 7: 1569–1573.
Weir, B.S. (1996): Genetic Data Analysis II: Methods for Discrete Population Genetic Data. Sinauer Assoc. Inc., Sunderland, MA, USA.
Weir, B.S., Cochercham, C.C. (1984): Estimating F-statistics for the analysis of population structure. Evolution, 38: 1358–1370.
Wright, S. (1951): The genetical structure of populations. Annals of Eugenics, 15: 323–354.
Wright, S. (1965): The interpretation of population structure by F-statistics with special regard to systems of mating. Evolution, 19: 295–420.
Wright, S. (1978): Evolution and the Genetics of Populations. Vol. 4. Variability Within and Among Natural Populations. University of Chicago Press, Chicago.
Zawko, G., Krauss, S.L., Dixon, K.W., Sivasithamparam, K. (2001): Conservation genetics of the rare and endangered Leucopogon obtectus (Ericaceae). Molecular Ecology, 10: 2389–2396.
Zsuffa, L. (1974): The genetics of Populus nigra L. Academia scientiarum et artium slavorum meridionalium (Zagreb). Annales Forestales, 6(2): 29–53.
Živković, B., Radović, J., Sokolović, D., Šiler, B., Banjanac, T., Štrbanović, R. (2012): Assessment of genetic diversity among alfalfa (Medicago sativa L.) genotypes by morphometry, seed storage proteins and RAPD analysis. Industrial Crops and Products, 40: 285–291.

Variability of European Black Poplar (Populus nigra L.) in the Danube Basin / 129
CIP - Каталогизација у публикацијиБублиотека Матице српске, Нови Сад
582. 681. 81. ( 282.243.7 )
VARIABILITY of European black poplar (Populus nigra I,.)in the Danube basin / [compiled and edited by Zoran Tomović,Ivana Vasić] . - Petrovaradin : Vojvodina šume, 2014 (Beograd: Avantguarde Design). - 128 str. : ilustr. ; 24 cm
Tiraž 1.500. - Bibliografija.
ISBN 978-86-906665-4-6
а) Црна топола - Дунавски басенCOBISS. SR-ID 284926983

130 / Variability of European Black Poplar (Populus nigra L.) in the Danube Basin
Due to habitat loss in last few decades the Black
Poplar (Populus nigra) become an endangered tree
species. It serves as indicator species for sustainable
floodplain forest management.
DANUBEPARKS STEP 2.0 project (“Anchoring the
Danube River Network of Protected Areas as Plat-
form for Preservation of Danube Natural Heritage”)
aims to promote Black Poplar as flagship species. Im-
plementation of conservation activities, within the
project, for this species will contribute to improve
forest habitat management practice but at the same
time stressing the role of Danube Protected Areas for
its preservation.
Public Enterprise “Vojvodinašume” within the men-
tioned project took very ambitious tasks to lead the
activity entitled as “Black Poplar conservation”. Hav-
ing the most experience in this tree species PE “Vo-
jvodinašume” additionally played an important role
in bringing together protected areas with forestry
agencies along the Danube. PE “Vojvodinasume”
become an important bridge builder between vari-
ous sectors and a key for the implementation of the
“DANUBEPARKS Guidelines for Ecological Forestry in
Danube Riparian Woodland” adopted as draft ver-
sion in first DANUBEPARKS project.