Embed Size (px)
Citation preview

Original article
Variability of circulation features in the Gulf of LionNW Mediterranean Sea. Importance of inertial currents
Variabilité de la circulation dans le golfe du Lion(Méditerranée nord-occidentale). Importance des courants d’inertie
Anne A. Petrenko *
Centre d’Océanologie de Marseille, LOB-UMR 6535, Faculté des Sciences de Luminy, 13288 Marseille cedex 09, France
Received 9 October 2001; revised 5 July 2002; accepted 18 July 2002
Abstract
ADCP data from two cruises, Moogli 2 (June 1998) and Moogli 3 (January 1999), show the variability of the circulation features in the Gulfof Lion, NW Mediterranean Sea. The objective of the present study is to determine whether the hydrodynamic features are due to local forcingsor seasonal ones. During both cruises, the Mediterranean Northern Current (NC) is clearly detected along the continental slope and intrudes onthe eastern side of the shelf. East of the gulf, its flux is ~2 Sv both in June and January in opposition to previous literature results. Otherwise,the NC characteristics exhibit usual seasonal differences. During the summer, the NC is wider (35 km), shallower (~200 m), and weaker(maximum currents of 40–50 cm s–1) than during the winter (respectively, 28 km, 250–300 m, 70 cm s–1). Moreover the NC is tilted verticallyduring the winter, following the more pronounced cyclonic dome structure of that season. Its meanders are interpreted as due to baroclinicinstabilities propagating along the shelf break. Other circulation features are also season-specific. The summer stratification allows thedevelopment, after strong wind variations, of inertial currents with their characteristic two-layer baroclinic structure. In the top layer, the speedof the inertial oscillation can locally be as high as 200% the NC speed. Otherwise in the surface layer, inertial current is about 2/3 the NC.During the 1999 winter, dense water formations are observed both on the continental shelf and offshore. Other hydrodynamic features dependprimarily on topography or wind forcing. Deep portions of the NC go up canyons. The continental shelf circulation is complex, and influencedby the wind stress curl. During Moogli 3, strong eastern counter-currents may be linked to the numerous intrusions of the NC on the shelf.During Moogli 2, tramontane conditions seem to favor the formation of a cyclonic structure on the western continental shelf.
© 2003 Éditions scientifiques et médicales Elsevier SAS and Ifremer/CNRS/IRD. All rights reserved.
Résumé
Les données ADCP de Moogli 2 (juin 1998) et Moogli 3 (janvier 1999) montrent la variabilité de la circulation dans le golfe du Lion,(Méditerranée nord-occidentale). L’objectif est de déterminer si les structures dynamiques sont dues aux forçages locaux ou saisonniers.Durant les deux campagnes, le courant Nord longe le talus continental, et, en amont, a un flux de ~2 Sv. Sinon, ses caractéristiques habituellessont opposées entre les deux saisons. En juin, le courant Nord est plus large (35 km), moins profond (~200 m), et plus faible (maximum de40–50 cm s–1) qu’en janvier (respectivement, 28 km, 250–300 m, 70 cm s–1). Le courant Nord est incliné verticalement en hiver, suivant lespentes isopycnales de la structure en dôme, plus marquées en cette saison. Les méandres du courant Nord sont dus à des instabilités baroclinesse propageant le long du talus continental. D’autres structures de circulation sont aussi saisonnières. La stratification estivale permet ledéveloppement, après un fort épisode de vent, de courants inertiels, baroclines à 2 couches. Dans la couche supérieure, leur vitesse peuts’élever localement à 200 % la vitesse du courant Nord. Sinon, dans la couche de surface, le courant inertiel représente ~2/3 du courant Nord.Pendant l’hiver 1999, des formations d’eaux denses ont été observées sur le plateau continental et au large. D’autres structures hydrody-namiques sont forcées par la topographie ou le vent. Les parties profondes du courant Nord remontent certains canyons. La circulation duplateau est complexe, influencée par le rotationnel du vent. Durant Moogli 3, de forts contre-courants vers l’est sont peut-être liés auxintrusions du courant Nord sur le plateau. Durant Moogli 2, la tramontane semble favoriser une circulation cyclonique à l’ouest du plateau.
© 2003 Éditions scientifiques et médicales Elsevier SAS and Ifremer/CNRS/IRD. All rights reserved.
* Corresponding author.E-mail address: [email protected] (A.A. Petrenko).
Oceanologica Acta 26 (2003) 323–338
www.elsevier.com/locate/oceact
© 2003 Éditions scientifiques et médicales Elsevier SAS and Ifremer/CNRS/IRD. All rights reserved.doi:10.1016/S0399-1784(03)00038-0

Keywords: Coastal circulation; Inertial oscillations; Forcings
Mots clés : Circulation côtière ; Oscillations inertielles ; Forcages
1. Introduction
There is a renewal of interest in coastal circulation due tothe increasing population along coasts all over the world, thepotentially accompanying rise in pollution, and the parallelgrowth in environmental concerns. Coastal areas and theirterrestrial inputs can favor phytoplankton activity (Cruzadoand Velasquez, 1990), and hence affect global budgets ofbiogeochemical elements, such as some greenhouse gases.To be able to forecast these parameters both on short (andlocal) and long (and global) scales, there is still a need for insitu physical and biogeochemical measurements, their analy-sis, and their use in adequate modeling. This is being under-taken for the Gulf of Lion, an extended continental shelf inthe northern western Mediterranean Sea, between Cap Creus,Spain, and Marseilles, France (Fig. 1). Unless explicitlymentioned, the Gulf of Lion (GoL) will refer, in this article,not only to the continental shelf, but also to its adjacentcontinental slope. This paper will focus on circulation fea-tures detected in ADCP measurements during two oceano-graphic cruises, Moogli 2 and Moogli 3 modeling and ob-serving the GoL. These cruises were performed, respectively,in June 1998 and January 1999 in the GoL.
The meteorological forcing is important in the GoL. Dueto the surrounding orography, continental winds—when theyoccur—are mainly channeled in two directions: the tramon-tane from the west/northwest, and the mistral from the north.They can occur together, the tramontane on the western sideof the GoL and the mistral on the eastern side. They generate
upwellings (Millot, 1982), downwellings, and inertial cur-rents (Millot, 1990). Otherwise, southeasterly winds can bestrong from autumn to spring.
River discharges are also important on that continentalshelf. The Rhone River accounts for roughly 90% of the totalfresh water input in the GoL (Fieux, 1974). Its mean flow ratehas been estimated close to 1700 m3 s–1 over a 30 year period(Moutin et al., 1998); but its flux can vary by a factor of2 during the year (higher in autumn and spring).
The main general circulation feature influencing the GoLis the Northern Current (NC) (Millot, 1991). Theevaporation-induced water deficit in the Mediterranean Seagenerates a surface flux of Atlantic waters through theGibraltar Strait (Lacombe and Tchernia, 1960). Due to theCoriolis force and the basin bathymetry, these waters tend toflow—not taking into account instabilities—cyclonicallyaround the western basin (Millot, 1999). The NC follows thecyclonic curve on the northern side of the basin, hence northof an isopycnal dome structure (Lacombe and Tchernia,1972). In the Ligurian Sea, the geostrophic NC flux (calcu-lated to 700 dbar) varies throughout the year, in a range of0.9–1.8 Sv with its maximum in November or December(Albérola et al., 1995; Sammari et al., 1995). Values up to2.7 Sv were obtained in January 82 (Béthoux et al., 1988).Less flux studies have been done in the GoL than in theLigurian Sea. Along longitude 5° 12.5 E, NC flux reachedextreme values, a maximum of 1.8 Sv in April 92 and aminimum of 0.5 Sv in June 92 (Conan and Millot, 1995). Allthese fluxes have been evaluated from geostrophic calcula-tions. In this region, no fluxes calculated fromADCP data hasbeen found in the literature. ADCP fluxes of ~1 Sv wereobtained in the northern Catalan Sea in spring 89 (Castellonet al., 1990). At longitude 5° 12.5 E, the NC was found to bedeep (~450 m), narrow (20–30 km), quick (0.50–1 m s–1) andclose to the coast in winter/spring and the opposite: shallow(~250 m), wide (~40 km), slow (10–15 cm s–1) and furtherfrom the coast in summer (Conan and Millot, 1995). Comingfrom the Ligurian Sea, the NC encounters the shelf break ofthe GoL on its northern side. There, it can either continue itsroute along the continental slope or split into two branches,the main one following the continental slope and the otherentering the GoL (Echevin et al., in press; Millot and Wald,1980). Its main branch can exhibit strong meanders (Al-bérola et al., 1995; Crepon et al., 1982; Flexas et al., 2002;Sammari et al., 1995).
Offshore the GoL, from surface to bottom, the followingwater masses can be found: the Modified Atlantic Water(MAW), the Western Mediterranean Intermediate Water(when and if present), the Levantine Intermediate Water(LIW), the Western Mediterranean Deep Water. They havedifferent water mass characteristics but all flow cyclonically
Fig. 1. Map of the GoL. Moogli stations are indicated by crosses. The fivemain transects correspond to AD, EH, IL, MP, and QT. Isobaths at 100, 200,500, 1000, 1500, 2000 m are drawn. Canyons locations and names (at thecanyon head) are in the same color. From west to east, the canyons are:LDc = Lacaze-Duthiers; Ac = Aude; MPc = Montpellier; PRc = Petit Rhône;GRc = Grand Rhône; Mc = Marseille; Pc = Planier; and LCc = La Ciotatcanyon.
324 A.A. Petrenko / Oceanologica Acta 26 (2003) 323–338

(Millot, 1999), with a speed continuum so that, when study-ing current measurements, no current shear clearly shows thelimits of the NC. Hence, depending on authors, the NC refersto either all these water masses or uniquely to the MAW(Conan and Millot, 1995). Here, ADCP measurements goingdown to 400 m maximum, only MAW and LIW are observedin this depth range. But, in this paper, the NC will be defined,not according to water mass characteristics, but as the vein ofstrong western current with a lower magnitude limit of0.05 m s–1.
Millot (1990) described the main hydrodynamic pro-cesses occurring in the GoL including inertial oscillatorycurrents. At the surface, horizontal inertial motions werecoherent over distance of 14–43 km (Millot and Crepon,1981). Millot and Crepon (1981) were able to demonstrate,with the analysis of current and temperature time seriesmeasured only at one point, that the inertial currents werepropagating from the coast to the center of the GoL. Incurrent time series collected near the shelf break offshore ofthe Ebro River, inertial motions clearly occurred in springand summer, with amplitude ranges of 0.15 m s–1 even at100 m depth (Font et al., 1995). Nonetheless, no example ofthe respective contributions of inertial currents versus mesos-cale circulation has yet been found in the literature.
The numerous articles cited above prove that the GoLhydrodynamic features have been quite studied. But no stud-ies with ADCP (acoustic Doppler current profilers) currentmeasurements covering the whole gulf at two different sea-sons were done before the Moogli cruises. The main circula-tion features of each cruise will be detailed in Section 3.Similarities and differences will be explained in Section 4.Emphasis is put on differentiating the seasonal variability ofthese hydrodynamic features from the variability due to localforcings. The main findings of this descriptive article aresummarized at the end. They include a quantification ofinertial currents, along with recommendations on experimen-tal and numerical work.
2. Methods
The main objective of the Moogli cruises was to establishbiogeochemical budgets in the GoL, especially a carbonbudget in order to determine whether the gulf acts as a carbonsource or sink. Four oceanographic cruises had been plannedso that the four main seasons be sampled in the gulf. The firstMoogli cruise, Moogli 1, coupled with the atmospheric cam-paign Fetch, took place in spring March 1998. The secondand third cruises took place on board of the R/V Le Suroît inJune 1998 for Moogli 2, and in January 1999 for Moogli 3(Fig. 1). The fourth cruise, planned for fall 1999, did not takeplace due to unfinished ship upgrading.
Moogli 2 started on June 3 and ended on June 19, 1998.The cruise was interrupted for 4 d (June 9–13) due to verybad meteorological conditions. Despite the fact that Moogli2 took place in late spring/early summer, it will be referred toas “summer” cruise. Some of the observed circulation fea-
tures, the seasonal ones, are expected to develop more in thehot season, when the stratification of the water column gen-erally continues to increase. Moogli 3 took place from Janu-ary 11 to January 21, 1999.
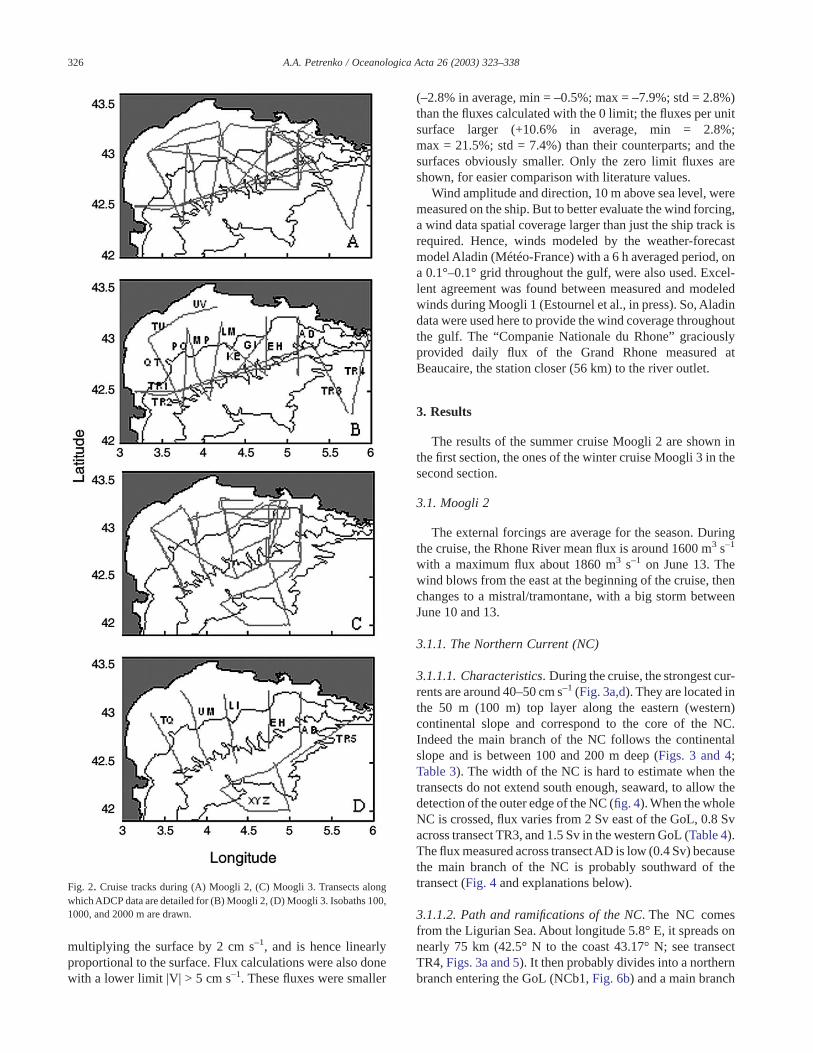
During these two cruises, continuous measurements weremade with a RD Instruments hull-mounted ADCP and aSeabird thermosalinograph connected to an underway pump.At pre-chosen stations (A to T, Fig. 1), CTD profiles, Niskinsamples, and sediment cores were collected or measured.These 20 stations are aligned on five transects, approxi-mately orthogonal to both the coast and the continental slope(neglecting the various canyons) (Fig. 1). The study of physi-cal processes was not the priority in the strategy of thecruises. Hence the cruise tracks were quite complicated dur-ing both cruises (Fig. 2a,c) due to sediment core samplingconstraints. Moreover, stations or transects were added whenjudged necessary by the chief scientist.
The ADCP is a narrowband VM 150 kHz. The sameconfiguration was used during both cruises: 50 cells, 8 mdepth bins, an ensemble average of 2 min (120 pings), and nobottom tracking. Data analysis was done with RDI softwareCODAS (http://currents.soest.hawaii.edu/software/codas3/).The ADCP head alignment in the horizontal plane was cor-rected with the water tracking calibration method based onrapid changes in ship velocities (Joyce, 1989; Pollard andRead, 1989). The reference layer covered bins 2–14, corre-sponding to the depth range 24–120 m. The correction fac-tors found were an amplitude factor A of 0.9965 (1.007) anda correction angle φ of 3.3° (3.8°) for Moogli 2 (Moogli 3).The calibration is made before the ship velocity is retrieved;otherwise, the errors in the ADCP head alignment cause apart of the ship velocity component to be left in the currentestimates. Once the corrections applied and the ship velocityretrieved, the final data are the horizontal currents, every 8 mfrom 16 to 408 m depth, given in a rectangular coordinatesystem where x is pointing eastward and y northward. Preci-sion is better than 2 cm s–1 (theoretically, 1.5 cm s–1). Cur-rents are also sometimes given in a polar coordinate systemwhere the angle increases clockwise from the northern direc-tion. During Moogli 2, the gyrocompass of Le Suroît wasbadly connected until mid-afternoon of June 6; hence theADCP data could only be analyzed and calibrated correctlyafterwards.
No time or distance averaging has been done on the ADCPdata, unless specified otherwise. To facilitate understanding,current data are plotted only on specific chosen transects(Fig. 2b,d; Tables 1 and 2). Fluxes of the NC are calculatedthrough surfaces orthogonal to the main flow. Direction ofthis main flow is obtained by averaging the directions of thecurrents in the main vein of the NC (|V| > 10 cm s–1). Thenfluxes are calculated summing all the normal component ofhorizontal currents (with a lower limit |V| > 0 cm s–1) by eachunit surface. The flux is given in Sv (1 Sverdrup = l06 m3 s–1),the surface in square kilometer, and a flux per unit surface iscalculated (in Sv/km2). Incertitude on the flux calculation,due to the ADCP precision limit of 2 cm s–1, is estimated by
325A.A. Petrenko / Oceanologica Acta 26 (2003) 323–338
multiplying the surface by 2 cm s–1, and is hence linearlyproportional to the surface. Flux calculations were also donewith a lower limit |V| > 5 cm s–1. These fluxes were smaller
(–2.8% in average, min = –0.5%; max = –7.9%; std = 2.8%)than the fluxes calculated with the 0 limit; the fluxes per unitsurface larger (+10.6% in average, min = 2.8%;max = 21.5%; std = 7.4%) than their counterparts; and thesurfaces obviously smaller. Only the zero limit fluxes areshown, for easier comparison with literature values.
Wind amplitude and direction, 10 m above sea level, weremeasured on the ship. But to better evaluate the wind forcing,a wind data spatial coverage larger than just the ship track isrequired. Hence, winds modeled by the weather-forecastmodel Aladin (Météo-France) with a 6 h averaged period, ona 0.1°–0.1° grid throughout the gulf, were also used. Excel-lent agreement was found between measured and modeledwinds during Moogli 1 (Estournel et al., in press). So, Aladindata were used here to provide the wind coverage throughoutthe gulf. The “Companie Nationale du Rhone” graciouslyprovided daily flux of the Grand Rhone measured atBeaucaire, the station closer (56 km) to the river outlet.
3. Results
The results of the summer cruise Moogli 2 are shown inthe first section, the ones of the winter cruise Moogli 3 in thesecond section.
3.1. Moogli 2
The external forcings are average for the season. Duringthe cruise, the Rhone River mean flux is around 1600 m3 s–1
with a maximum flux about 1860 m3 s–1 on June 13. Thewind blows from the east at the beginning of the cruise, thenchanges to a mistral/tramontane, with a big storm betweenJune 10 and 13.
3.1.1. The Northern Current (NC)
3.1.1.1. Characteristics. During the cruise, the strongest cur-rents are around 40–50 cm s–1 (Fig. 3a,d). They are located inthe 50 m (100 m) top layer along the eastern (western)continental slope and correspond to the core of the NC.Indeed the main branch of the NC follows the continentalslope and is between 100 and 200 m deep (Figs. 3 and 4;Table 3). The width of the NC is hard to estimate when thetransects do not extend south enough, seaward, to allow thedetection of the outer edge of the NC (fig. 4). When the wholeNC is crossed, flux varies from 2 Sv east of the GoL, 0.8 Svacross transect TR3, and 1.5 Sv in the western GoL (Table 4).The flux measured across transectAD is low (0.4 Sv) becausethe main branch of the NC is probably southward of thetransect (Fig. 4 and explanations below).
3.1.1.2. Path and ramifications of the NC. The NC comesfrom the Ligurian Sea. About longitude 5.8° E, it spreads onnearly 75 km (42.5° N to the coast 43.17° N; see transectTR4, Figs. 3a and 5). It then probably divides into a northernbranch entering the GoL (NCb1, Fig. 6b) and a main branch
Fig. 2. Cruise tracks during (A) Moogli 2, (C) Moogli 3. Transects alongwhich ADCP data are detailed for (B) Moogli 2, (D) Moogli 3. Isobaths 100,1000, and 2000 m are drawn.
326 A.A. Petrenko / Oceanologica Acta 26 (2003) 323–338

going southwest along the continental slope (transect TR3;Fig. 5). One fourth of the NC flux on transect TR4, i.e. 0.5 Sv,is on the continental margin (above 120 m, longitude superiorto 42.82° N). This probably gives a lower estimation of NCb1intrusion. Otherwise, by difference between NC flux up-stream (TR4) and downstream (TR3) of the intrusion, ahigher flux value of 1.2 Sv is obtained. This NCb1 northernbranch is not detected on transect TR3, since TR3 does notextend close enough to the coast (shallowest depth ~800 m).In the northern part of transect AD, NCb1 is not detectedclose to the surface but can be traced at depth below 40 m(Fig. 3b,c). The main branch of the NC crosses transect TR3going southwest. Then, on transect AD, it splits again in amain branch (going west at the surface, and southwest atdepth, Fig. 3), and a second northern intrusion (b2, Fig. 6b),detailed in the next section.
3.1.1.3. Bathymetry influences. The NC can be affected bythe bathymetry, as the two following examples show. Thenorthern edge of the Grand Rhone canyon, which extends tothe 2500 m isobath, influences the NC below 120 m ontransects TR3 and AD (Fig. 3d). CTD 47, performed betweenAD and TR3, shows two pycnoclines, one approximately at40 m and a second one at 100–120 m depth (Raimbault,2000). This confirms the hypothesis that the bathymetryinfluence can be felt on the currents as far up in the watercolumn as this one is homogeneous. The second example is
further west. From 40 m down to 300 m, the NC is split by thesouthern edge of the Grand Rhone canyon (transect AD;Fig. 3b,d). The NC southern portion goes to the southwest(220°) but most of this branch is probably southward oftransect AD. Its northern section (b2) goes to the northwest(300°), approximately into the Grand Rhone canyon. Thesedirections remain constant from 40 m down to the ADCPdetection limit. CTD 46 (Raimbault, 2000) performed beforetransect AD showed a strong pycnocline at 40 m. The ratherwell-mixed water column below it allows the influence of thebathymetry to be felt up to this 40 m pycnocline. Above 40 m,the NC does not split and continues westward (Fig. 6b).
Canyons also have a strong influence on the deep portionsof the NC. Branches of the NC were observed going upthrough canyons to the right of the NC direction. Duringtransects TR1, TR2, and GI, deep currents went north in thePlanier canyon, the Petit Rhone canyon, and the Montpelliercanyon (data not shown). Bottom currents also went up theAude canyon going northwest (e.g., transect PQ; Fig. 3b,d).
3.1.1.4. South of the NC. Southeast of the GoL, most oftransects TR3 and TR4 are done over water columns deeperthan 2500 m. Those two transects are the only ones of thatcruise to collect data seaward of the NC. Apart from the NC,their most noticeable feature is an eastern undercurrent. Thiscurrent flows at depths below 50 m. It is located south of42.55° N for TR3 and south of 42.45° N for TR4 (Fig. 5).
Table 1For each transect of Moogli 2, the table includes: the start day of the transect (and end day, if different), the start and end times of the transect, the start and endpositions: latitude (°N) and longitude (°E), and the wind direction and strength (knots). Transects are classified in chronological order. Transects names refer tothe stations at the extremities of the transect. For transect not linking two stations, TRi was used with i = l, 4
Transect Day (06/98) Time Position start Position end Wind direction Wind strengthLM 06 3:50–21:05 43° 12–4° 13 42° 25–4°04 NW 10MP 06–07 21:40–3:20 42° 25–4° 04 43° 07–3° 48 NW 10PQ 07 3:25–21:05 43° 07–3° 48 42° 20–3° 45 W 22QT 07–08 21:35–4:05 42° 20–3° 45 43° 01–3° 20 W–NW 25–30TU–UV 08 16:35–21:31 43° 0l–3° 20 43° 20–4° 10 W (N) 20 (15)TR1 15–16 20:54–7:06 42° 56–5° 17 42° 30–3° 11 N–NE 20–25TR2 16 10:34–20:35 42° 30–3° 11 42° 52–5° l8 N–NW 30GI 17 5:15–10:15 43° 04–4° 45 42° 30–4° 22 N 35–40KE 17 14:17–19:39 42° 59–4°15 42° 40–4° 45 N 20–25EH 17–18 20:15–00:45 42° 40–4° 45 43° 15–4° 45 N 20–30AD 18 6:15–11:35 42° 40–5° 08 43° 15–5° 08 NE 15–20TR3 18–19 21:55–2:15 42° 59–5° 19 42° 17–5° 45 NW 15–20TR4 19 2:25–6:35 42° 17–5° 46 43° 04–5° 58 NW 15
Table 2Same as Table 1 for Moogli 3. Transect TQ has been completed from north to south, in reverse direction to the Moogli 2 transect QT. The XYZ “ loop” includestransects XY, YZ1, Z1Z2
Transect Day (01/99) Time Position start Position end Wind direction Wind strengthAD 11–12 21:07–4:16 42° 40–5° 08 43° 15–5° 08 N, NW 25EH 12–13 20:36–3:54 42° 40–4° 45 43° 15–4° 45 W 15/weakerLI 13–14 20:44–4:21 43° 12–4° 13 42° 30–4° 22 N, NE 25; weaker south LITQ 14–15 20:41–4:44 43° 01–3° 20 42° 20–3° 45 NE 25 (idem)UM 15–16 22:02–5:18 43° 07–3° 48 42° 25–4° 04 N 15XYZ 19–20 17:46–4:50 42° 00–5° 00 42° 25–4° 45 N, NE 10TR5 20 15:34–19:44 42° 30–5° 01 42° 57–5° 46 N, NE 10–15
327A.A. Petrenko / Oceanologica Acta 26 (2003) 323–338

Such eastern current was also observed south of the NCduring the Billion 1996 summer cruise (Lapouyade and Dur-rieu de Madron, 2001).
3.1.2. Main currents in the continental shelf
The main circulation features are detailed for two periods:(a) early June 6–late June 8 in the western part of the GoL and(b) June 17–19 in the eastern part. To follow the NC flow, itwould be more logical to present data first in the eastern GoL,and second in the western GoL. But, since nearly 10 dseparate these two data sets, they are presented in chrono-logical order. Moreover, a strong counter-circulation is ob-served on the shelf from west to east, so that this order is alsomeaningful hydrodynamically.
3.1.2.1. Circulation in the western GoL (a). While the NCroughly follows the continental slope with its core above the1000 m isobath, an eastern current (E1) can be clearly fol-lowed along the 100 m isobath (Fig. 6a). More inland, despiterelatively shallow waters (25 m depth in average north of42.8° N and west of 3.5° E), strong currents (20 cm s–1) aredetected going northwest and west (current W1) (Fig. 6a).The continental shelf currents W1 and E1 may constitute an“elongated” cyclonic gyre, as was found in modeling outputsunder specific tramontane conditions. Indeed, during thispart of the cruise, winds were coming from the west andnorth-west (10–30 knots, Table 1) and were localized in thewestern part of the gulf (Aladin data for June 7, not shown).This kind of wind conditions, used as inputs in the Sympho-nie 3D oceanographic model, lead to a clear cyclonic gyrecirculation in the western part of the gulf (Estournel et al.,2003). Unfortunately, this cyclonic circulation hypothesiscannot be checked since no current measurements were madein the directions orthogonal to the arrows.
Fig. 3. Horizontal currents during Moogli 2 at (A) 24 m, (B) 48 m, (C) 96 m,and (D) 152 m, along the transects detailed in Fig. 2b. Same isobaths as onFig. 2.
Fig. 4. Vertical sections of the west–east current component along transectsAD, EH, LM, MP and QT (bottom to top) during Moogli 2. Extreme valuesmeasured on these transects are –0.5 and 0.25 m s–1. Color scale (speed inm s–1) ranges from –0.6 to 0.5 m s–1, to allow comparison with Moogli3 sections (Fig. 14). Contours at –0.20 m s–1 (white) show the NC corelimits.
328 A.A. Petrenko / Oceanologica Acta 26 (2003) 323–338

3.1.2.2. Circulation in the eastern GoL (b). At the top ofthe continental slope (depth range: 200–500 m), an easterncurrent (E2) can be followed, from west to east, on transectsGI, KE, EU, AD and TR3 (Fig. 6b). Whether or not it is acontinuation of E1 is uncertain because of the nearly 10 dinterval between the western and eastern coverage of theGoL. Part of the northwestern branch of the NC (b2) detectedon transect AD is probably deviated and entrained east by E2.Closer to the coast, a small anticyclonic circulation spreadsmostly in the longitude direction. Its northern branch (E3)entrains Rhone River waters to the east. West of Marseilles(43.2° N–5.2° E), the three water masses: E2, entrained NC,and Rhone waters E3 (and potentially a fourth one: the firstnorthern branch of the NC) mix. Due to the coast boundary tothe north and east, these waters are obliged to go westward,closing the southern branch of the small anticyclonic gyre(W2). But W2 is squeezed between the northern branch ofthe anticyclonic gyre (E3) and the eastern current (E2). Thereis not enough place for all the mixed waters to go back west atthe surface; so part of the waters are obliged to sink and gowest at depth (Fig. 3, 48 m). At the surface, Rhone waters areof the lowest density (r = 26–27 kg m–3); E2 waters are alsorelatively light (r = 27 kg m–3); while mixed waters r are~28.5 kg m–3. Hence, the mixed waters sink to go westward.They probably mix with waters from the NC branch that hasintruded at the eastern entrance of the GoL (see sectionabove). These waters can be traced from 40 m, down to200 m on transect AD (Fig. 4).
This circulation in the eastern part of the GoL is clearlyseen on the SeaWiFs satellite image of June 19, 1998 (Fig. 7).In the eastern part of the GoL, there is a typical Sanskrit“Om” shape of high chlorophyll concentration waters(0.8–1.5 µg 1–1 compared to the background of 0.4 µg 1–1).The top portion of the Om symbol corresponds mainly to theRhone River waters forming the anticyclonic gyre; the bot-tom portion to the main branch of the NC.
3.1.3. Inertial currents
3.1.3.1. Detecting the inertial currents. A combination ofphase unwrapping (Chereskin et al., 1989) and current direc-tion analysis is a good technique to exhibit the presence ofinertial currents. The unwrapped phase of the current shear(16–72 m) shows three periods where its slope is negativeand ~–f0: June 14, early June 16 (transects TR1 and TR2),end of transect GI on June 17 (Fig. 8). Analyzing the currentsthroughout the water column during these three periods showthat inertial currents are detected during the last two periods.Indeed, three transects show inertial currents: transects TR1,TR2, and UI (Table 1). They were collected at the beginningof the second part of the Moogli 2 cruise, hence just after thestorm obliged the R/V Le Suroît to go back to the coast forprotection. During the storm, the mistral and tramontaneblew very strongly on June 11–13 (Aladin data). On June 13,the second part of the cruise started. The Suroît stayed mostlyin shallow waters (less than 100 m deep) until June 15 and noinertial waves were detected during that period. Then the R/Vcrossed the GoL back and forth (transects TR1 and TR2),approximately along the 1000 m isobath. During three por-tions (I1, I2, I3) of these transects, the currents in the surfacelayer (roughly 0–50 m) and at depth (below 60 m) are ~180°out-of-phase (Fig. 9). In stratified waters, this is characteris-tic of wind-induced horizontal inertial currents.
Transect GI crosses the continental shelf in a southwesterndirection (Table 1, Fig. 2). The vertical section of the currentamplitude exhibits two zones of strong current (|V| >20 cm s–1), one at the surface (down to 40 m) and the otherdeeper (50–90 m) (Fig. 10). The surface current goes to thewest and the deeper layer to the northeast. This baroclinicstructure is particularly strong at the end of the transect,between station I and 42.95° N. No CTD station was done atstation I. A CTD station (CTD 45), done at G, the northeast-ern end of transect GI, shows the pycnocline at 25 m (Raim-
Table 3The horizontal width (km) and thickness (m) of the NC, and the latitude of its core are given for each cruise. Width with an * indicates that the southern end ofthe NC was not reached during the cruise; so this width underestimates the real width of the NC
TransectMoogli 2 Moogli 3Width Thickness Latitude Width Thickness Latitude
AD 39 0–120 42.78 31 0–250 42.84EH 28* 0–200 42.66 31 * 0–300 42.69LI–LM 39 0–200 42.57 29 0–300 42.60MP–UM 33 0–240 42.53 24.5 0–250 42.52QT–TQ 33 0–125 42.67 17 * 0–325 42.33
Table 4For certain transects of Moogli 2 (from east to west), flux of the NC (in Sv), flux incertitude between parentheses, surface used for the flux calculation (in km2),flux per unit surface (in Sv/km2), mean direction of the NC core, latitude extent and depth range of the NC
Transect Flux (incertitude) Surface Flux/surface Direction Latitude south Latitude north Depth rangeTR4 2.0 (0.3) 14.28 0.14 280° 42.5 43.7 16–384TR3 0.8 (0.2) 8.18 0.09 245° 42.57 42.88 16–256AD 0.4 (0.1) 4.95 0.08 280° 42.67 42.83 16–384MP 1.5 (0.2) 8.47 0.18 250° 42.42 42.67 16–408
329A.A. Petrenko / Oceanologica Acta 26 (2003) 323–338

Fig. 5. Vertical sections of the west–east current component along transects(A) TR1 and (B) TR2 during Moogli 2. Extreme values for TR1 are–0.35 and 0.15 m s–1, and, for TR2, –0.5 and 0.15 m s–1. A common colorscale, in m–1, is used to allow comparison between the two transects.Contours at –0.20 m s–1 (white) show the NC core limits, and at 0 m s–1
(black) the limits between the NC and eastern currents.
Fig. 6. Main current directions represented on top of the measured horizontal currents at 24 m, during two periods (A) June 6–8 in the western part of the GoLand (B) June 17–19 in the eastern part. The main branch of the NC is represented with double-line arrows; branches of the NC intruding on the gulf, orcontinental shelf currents with single-line arrows. For clarity, names of the transects are reminded on the right.
Fig. 7. SeaWiFs map of chlorophyll-a concentration on June 19, 1998 (pixelresolution ~l km). Blue represents 0.2 µg l–1, green 1 µg l–1, and red morethan 10 µg l–1 of chl-a. High turbidity leads to an overestimation of chl-a inthe Rhône plume; hence color scale is not shown. ADCP currents measuredduring June 17–19 are shown in white, and in black in the Rhone Riverplume. Isobaths at 200, 1000, and 2000 m are drawn in white.
330 A.A. Petrenko / Oceanologica Acta 26 (2003) 323–338

bault, 2000). The pycnocline is shallower than the 40 mexpected from the baroclinic feature located southwest of theCTD. Nonetheless the deepest current structure shallowsgoing northeast towards G (Fig. 10). This means that thepycnocline is tilted towards the surface going northeast. And
the current shear corresponds, as expected, to the pycnoclinedepth.
East of transect GI, at the (FIxed Observation Station)SOFI mooring (43.07° N, 5.13° E, 162 m depth), time seriesof current measurements were continuously collected at two
Fig. 8. Phase unwrapping of the horizontal current shear (16–72 m) duringJune 13–19. The negative slope corresponding to the Coriolis factor isshown. Transects TR1, TR2 and GI were done during the periods indicatedby vertical dotted lines.
Fig. 9. Horizontal currents during Moogli 2 at (A) 16 m and (C) 72 m along transect TR1, and (B) 16 m and (D) 72 m along transect TR2. The boxes isolate thezones with inertial currents. At 16 m, they are labeled (I1, I2, and I3) in the chronological order currents were measured. Isobaths 100, 1000, and 2000 m areshown.
Fig. 10. Vertical section of the horizontal current amplitude along transectGI during Moogli 2. Color scale is the speed amplitude in m s–1.
331A.A. Petrenko / Oceanologica Acta 26 (2003) 323–338

depths (65 and 150 m) during that period. At both depths,during April–June 1998, the rotary spectra of the current timeseries clearly show, at the Coriolis frequency, a clockwisecomponent much stronger than the counter-clockwise com-ponent (Fig. 11). This is characteristic of inertial currents.Phase unwrapping of the mooring currents also shows aspecific inertial episode on June 14–15 (data not shown).
3.1.3.2. Quantifying the inertial currents. Several techni-ques are used to check the time evolution of these inertialcurrents and quantify their contribution to the circulation,assuming horizontal coherence. This is not a trivial issuesince current measurements are acquired with both time andspace variability.
At the GoL latitude, the Coriolis factor f0 corresponds to aperiod of about 17.5 h. Plotting u(t) = cos(f0) = sin(f0t + p/2)on the eastward component and v(t) = sint(f0t) on the north-ward component of the current exhibits the clockwise rota-tion of the inertial oscillation with time (Fig. 12). The meancurrent of the eastward component is around –10 cm s–1,corresponding to the average westward speed of the NC. Themean component of the northward component is zero. Theamplitude of the sinusoidal curve, corresponding to the iner-tial current, is about 20 cm s–1. Hence, at that depth (16 m),the speed of the inertial oscillation can be locally as high as200% the NC speed. Otherwise, the average speed of the NCin its core is about 30 cm s–1; so the inertial current is about2/3 the NC. It is important to remember that the thickness ofthe top layer of the inertial oscillation is about 30 m while theNC extends over 200 m; hence, the inertial oscillation energyis much smaller than the NC energy.
The presence of inertial currents can also be verified onthe spatial maps of TR1 and TR2 currents. For example,
surface inertial currents are oriented southwestward at theend of TR1 (12) and northward in the center of TR2 (13),about 10 h after (Fig. 9 and Table 1). A full rotation of 360°representing 17.5 h, it is expected that the inertial currentsrotate by 126° (taking into account the geostrophic compo-nent of the NC) clockwise in 10 h. The observed clockwiserotation is ~120°, in nearly perfect agreement with the onecalculated. The inertial currents compared are separated by50–75 km. This shows that our horizontal coherence assump-tion was acceptable. No coherence is found between I1 andI2, or between I1 and I3.
3.2. Moogli 3
During the beginning of the cruise, the fresh water inputsfrom the Rhone River were low for the season. Then theyincreased rapidly and stayed high (above 3000 m3 s–1) fromJanuary 18 to the end of the cruise. During the cruise, thewind blew mostly from the north (mistral), oscillating to atramontane or northeast/east wind. It was always strongerthan 10 knots. There was a storm with strong east windsduring January 16–17.
Current data are shown at four different depths throughoutthe GoL (Fig. 13). From east to west, the five transects AD toTQ were done at nights, one each night from January 11 to 16(Table 2). This temporal spacing does not provide a realsynoptic view of the gulf. But since there is neither disconti-nuities nor apparent contradictions in the main current direc-tions during this period, it will be studied as a whole.
3.2.1. The Northern Current (NC)
3.2.1.1. Characteristics. During Moogli 3, the strongest cur-rents reach 70 cm–1 at 40 m depth. Below, currents decreasewith depth, but are still between 20 and 40 cm s–1 at 160 m
Fig. 11. Rotary spectra vs. frequency (bottom x-axis) for (A) 65 m, (B)150 m currents measured at SOFI during April–June 1998. The black (grey)line is the clockwise (counter-clockwise) component of the spectra. Notethat, at the inertial frequency (indicated by the vertical line), the clockwisecomponent is much higher than the counter-clockwise component.
Fig. 12. Time series of the (A) west–east and (B) south–north currentcomponents, at 16 m depth, along transects TR1 and TR2 of Moogli 2.Superimposed is a sinusoidal curve of inertial period, shifted by +p/2 on (A)compared to (B). The means of the two components are also drawn: (A)–0.10 m s–1 and (B) 0 m s–1.
332 A.A. Petrenko / Oceanologica Acta 26 (2003) 323–338

depth. The strongest currents are located along the continen-tal slope and correspond to the core of the NC. This core is200–280 m deep (Fig. 14; Table 3). The width of the NC is
between 25 and 35 km. Its core is not symmetrical withdepth. Its southern limit is tilted northward with depth. Itsflux is ~2.1 Sv east of the GoL, and between 1.7 and 1.8 Svalong the continental slope of the GoL (Table 5).
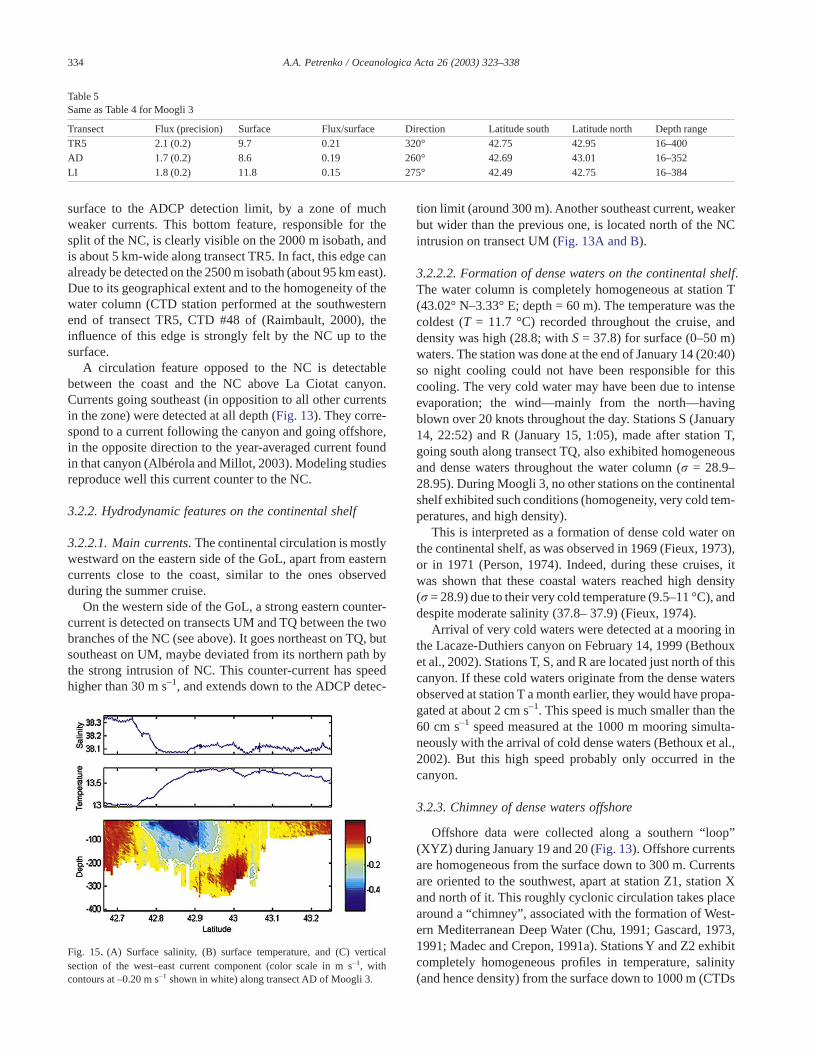
At the surface, the signature of the NC is clearly associ-ated with sharp gradients of temperature and salinity. Cross-ing the NC from south to north, temperature increases andsalinity drops (Fig. 15). Indeed the NC is the northern branchof a cyclonic gyre; hence it flows north of an isopycnal domewith colder and saltier (hence denser) waters to its south, andwarmer and fresher waters to its north.
3.2.1.2. Ramifications. The main branch of the NC is clearlypresent along the continental slope, between isobath 1500 m(to the south) and isobath 200 m (to the north). Its maindirection is westward, but going either southwest (southernportions of transects AD, EH and UM) or northwest (south-ern portions of transects LI and TQ). A branch of the NCsplits from the main current at the entrance of the GoL andenters in the eastern region of the gulf. It is clearly visiblealong TR5, and, close to the coast, between the isobaths100 and 200 m, on transects AD and EH (Figs. 13 and 14). Bydifference between the NC fluxes, the intrusion may accountfor 0.4 Sv (Table 5). The NC splits again just west of transectLI. The southern branch or “main” branch of the NC-continues along the continental slope meandering to the south-west on UM and to the northwest on TQ (as described above).While the northern branch—intrusion of the NC in theGoL—goes first northwest on UM, and then southwest on TQ.
3.2.1.3. Bathymetry effects. Along transect TR5, the edgebetween the Marseilles and the Grand Rhone canyons splitsthe NC in two. Both branches of the NC go roughly in thesame direction (3l5–320°) but are clearly split, from the
Fig. 13. Horizontal currents during Moogli 3 at (A) 24 m, (B) 48 m, (C)96 m, and (D) 152 m, along the transects detailed in Fig. 2d, and the sameisobaths.
Fig. 14. Vertical sections of the west–east current component along tran-sects AD, EH, LI, PM and TQ (bottom to top) during Moogli 3. Color scaleis in m s–1. Contours at –0.20 m s–1 (white) show the limits of the NC core.
333A.A. Petrenko / Oceanologica Acta 26 (2003) 323–338
surface to the ADCP detection limit, by a zone of muchweaker currents. This bottom feature, responsible for thesplit of the NC, is clearly visible on the 2000 m isobath, andis about 5 km-wide along transect TR5. In fact, this edge canalready be detected on the 2500 m isobath (about 95 km east).Due to its geographical extent and to the homogeneity of thewater column (CTD station performed at the southwesternend of transect TR5, CTD #48 of (Raimbault, 2000), theinfluence of this edge is strongly felt by the NC up to thesurface.
A circulation feature opposed to the NC is detectablebetween the coast and the NC above La Ciotat canyon.Currents going southeast (in opposition to all other currentsin the zone) were detected at all depth (Fig. 13). They corre-spond to a current following the canyon and going offshore,in the opposite direction to the year-averaged current foundin that canyon (Albérola and Millot, 2003). Modeling studiesreproduce well this current counter to the NC.
3.2.2. Hydrodynamic features on the continental shelf
3.2.2.1. Main currents. The continental circulation is mostlywestward on the eastern side of the GoL, apart from easterncurrents close to the coast, similar to the ones observedduring the summer cruise.
On the western side of the GoL, a strong eastern counter-current is detected on transects UM and TQ between the twobranches of the NC (see above). It goes northeast on TQ, butsoutheast on UM, maybe deviated from its northern path bythe strong intrusion of NC. This counter-current has speedhigher than 30 m s–1, and extends down to the ADCP detec-
tion limit (around 300 m). Another southeast current, weakerbut wider than the previous one, is located north of the NCintrusion on transect UM (Fig. 13A and B).
3.2.2.2. Formation of dense waters on the continental shelf.The water column is completely homogeneous at station T(43.02° N–3.33° E; depth = 60 m). The temperature was thecoldest (T = 11.7 °C) recorded throughout the cruise, anddensity was high (28.8; with S = 37.8) for surface (0–50 m)waters. The station was done at the end of January 14 (20:40)so night cooling could not have been responsible for thiscooling. The very cold water may have been due to intenseevaporation; the wind—mainly from the north—havingblown over 20 knots throughout the day. Stations S (January14, 22:52) and R (January 15, 1:05), made after station T,going south along transect TQ, also exhibited homogeneousand dense waters throughout the water column (r = 28.9–28.95). During Moogli 3, no other stations on the continentalshelf exhibited such conditions (homogeneity, very cold tem-peratures, and high density).
This is interpreted as a formation of dense cold water onthe continental shelf, as was observed in 1969 (Fieux, 1973),or in 1971 (Person, 1974). Indeed, during these cruises, itwas shown that these coastal waters reached high density(r = 28.9) due to their very cold temperature (9.5–11 °C), anddespite moderate salinity (37.8– 37.9) (Fieux, 1974).
Arrival of very cold waters were detected at a mooring inthe Lacaze-Duthiers canyon on February 14, 1999 (Bethouxet al., 2002). Stations T, S, and R are located just north of thiscanyon. If these cold waters originate from the dense watersobserved at station T a month earlier, they would have propa-gated at about 2 cm s–1. This speed is much smaller than the60 cm s–1 speed measured at the 1000 m mooring simulta-neously with the arrival of cold dense waters (Bethoux et al.,2002). But this high speed probably only occurred in thecanyon.
3.2.3. Chimney of dense waters offshore
Offshore data were collected along a southern “ loop”(XYZ) during January 19 and 20 (Fig. 13). Offshore currentsare homogeneous from the surface down to 300 m. Currentsare oriented to the southwest, apart at station Z1, station Xand north of it. This roughly cyclonic circulation takes placearound a “chimney” , associated with the formation of West-ern Mediterranean Deep Water (Chu, 1991; Gascard, 1973,1991; Madec and Crepon, 1991a). Stations Y and Z2 exhibitcompletely homogeneous profiles in temperature, salinity(and hence density) from the surface down to 1000 m (CTDs
Table 5Same as Table 4 for Moogli 3
Transect Flux (precision) Surface Flux/surface Direction Latitude south Latitude north Depth rangeTR5 2.1 (0.2) 9.7 0.21 320° 42.75 42.95 16–400AD 1.7 (0.2) 8.6 0.19 260° 42.69 43.01 16–352LI 1.8 (0.2) 11.8 0.15 275° 42.49 42.75 16–384
Fig. 15. (A) Surface salinity, (B) surface temperature, and (C) verticalsection of the west–east current component (color scale in m s–1, withcontours at –0.20 m s–1 shown in white) along transect AD of Moogli 3.
334 A.A. Petrenko / Oceanologica Acta 26 (2003) 323–338
43 and 45; Raimbault, 2000). These stations must have beendone in some of the mixing plumes of the chimney (Schott etal., 1996).
4. Discussion
4.1. Variations of the NC
4.1.1. Seasonal variationsThe NC has weaker maximum speeds, is more extended
horizontally, and is more shallow in summer (Moogli 2) thanin winter (Moogli 3) (Figs. 4 and 14). Its vertical shape is alsovery different between the two seasons. During the winter,the NC is strongly inclined to the north following the sharpisopycnes associated with the cyclonic gyre, which is close tothe shelf-break. While, in summer, the isopycnes are not assteep and are located more to the south, further from theslope. That explains that the summer NC is shallower andmore extended in width than the winter NC, and that it doesnot have the striking vertical tilt observed during the winter.In fact, a reverse angle is even observed on transect AD ofMoogli 2. There, the shallow core of the NC is inclined to thesouth with depth, probably due to the strong eastern currentflowing on the shelf below the NC (Fig. 4). Offshore of theEbro delta, a slightly inclined tilt of the NC was observed inJune 1987 in agreement with tilted haloclines (Font et al.,1995).
The ADCP fluxes do not agree with the previously ob-served seasonal variations of the NC (references listed in theintroduction). Indeed, east of the GoL, the NC flux is ~2 Svboth in winter and summer; while a lower summer flux wasexcepted. Precision in ADCP measurements induces an in-certitude of maximum 0.3 Sv in these flux estimations. None-theless, in summer, the fluxes may be biased by inertialoscillations. Geostrophic and ADCP fluxes cannot be di-rectly compared since they are obtained with different tech-niques. Geostrophic calculation does not include the barotro-pic component present in the ADCP flux. The geostrophictechnique has also been used for the two Moogli cruises. Butno CTD stations were done on most of the transects selectedhere; so no comparison and retrieval of the potential inertiacontribution are possible. The high ADCP flux in June maynot be representative of the seasonal NC flux; or it maycorrespond to an episode of higher flux, such as the onespreviously observed in April 92 (Conan and Millot, 1995) orin July 1985 (Sammari et al., 1995). Indeed, mesoscale activ-ity is sometimes quite high in late spring or early summer, aswas observed 1 year (1989) out of a 5 year-long study (Fontet al., 1995). The study of the NC variability would benefitfrom additional experimental measurements including a net-work of moorings and systematic ADCP transects across theNC for several years.
4.1.2. Meanders of the NCThe NC meanders along the shelf break. If meanders are
defined from crest to crest as a wave would be, half-
wavelength represents the distance between two nodal pointsof the wave. During Moogli 3, two meanders with a half-wavelength of ~35 km were observed. Flexas et al. (2002)countered four meanders (transforming into intrusions) at thebeginning of April 1997. During Moogli 2, the separatecoverage of the eastern and western part of the GoL makes itdifficult to assess the number of meanders.
The hypothesis that meanders location could be linked tothe presence of canyons cutting the continental slope, istested in the following paragraph. Indeed, the relative vortic-ity of a moving water mass can be modified at the passageover a canyon (vertical stretching). This vorticity change cancreate deviations in the current directions (Gill, 1982). Cur-rent meanders were observed along the Catalan coast wherecanyons are regularly positioned (about every 50 km) andinterpreted as due to the change of vorticity over these can-yons (Arnau del Amo, 2000). Here, the canyons do notgenerate meanders since, at the same locations, the NC canhave different directions. For example, along transect EH, theNC is going northwest during Moogli 2 and southwest duringMoogli 3. Also, if the meanders of the NC were to follow thelocal bathymetry of the canyons, the NC would be expectedto go, for example, northwest in the canyons on transects EHand UM. But during Moogli 3, the NC goes southwest on thesouthern portions of transects EH and UM (Fig. 13). Toexplain these meanders, another possibility is to disregard thepresence of all canyons, and only keep the main orientationof the isobaths. From east to west, the expected curvature ofthe NC would then be a gradual change in directions (westernto southern current), which is not observed on either cruises.Since the situation is more complicated than either of thesetwo cases (with or without canyons), other factors thanstrictly bathymetry influence the path of the NC.
Echevin et al. (2003) found that a coastal baroclinic cur-rent deeper than a shelf break would create, upon arriving atthe shelf break, first a fast propagating barotropic/baroclinic double Kelvin wave system, then a baroclinicwave slowly propagating along the shelf break. This secondwave, slower than a classical coastal Kelvin wave, propa-gates along the shelf break and takes approximately 3 d tocross from Marseilles to Spain. Along the shelf, its directionoscillates from southwest to northwest at about 1 d interval(Fig. 8c,d of Echevin et al., 2003). The fluctuations of the NCduring Moogli 3 are identical to the modeled ones. SinceMoogli 3 took place in winter, when the NC goes down to300 m while the shelf depth is about 100 m, the modelhypotheses correspond exactly to the cruise conditions. Theposition of the meanders of the NC are interpreted as thepropagating baroclinic wave.
4.2. Intrusions of the NC in the GoL
Echevin et al. (2003) wrote that “when the density strati-fication is weak and the pycnocline deep, the shelf topogra-phy can act as a barrier and prevent the current from flowinginto the gulf. When the stratification is strong and shallow,
335A.A. Petrenko / Oceanologica Acta 26 (2003) 323–338

the current may separate into two branches, one flowingalong the shelf break and the other following the coast” .
4.2.1. On the eastern sideThe entrance of the NC in the gulf at its eastern side is first
considered. The situations observed during Moogli 2 and3 are more complex than the one described by Echevin et al.(2003), and the wind forcing cannot be neglected. DuringMoogli 2, while there is a strong and shallow stratificationand winds from the northeast, the NC probably makes anintrusion, detected below 40 m on the northern portion oftransect AD. The flux of the intrusion is probably comprisedin a 0.4–1.2 Sv range. During Moogli 3, the stratification isweak, the water column nearly or completely homogeneousand the winds from the north to northeast. An intrusion of theNC is clearly detected on the eastern side of the GoL andspreads from the slope up to the 100 m isobath. The flux ofthe intrusion is estimated at ~0.4 Sv.
4.2.2. Along the shelf breakDuring Moogli 2, no intrusions of the NC are detected on
the continental shelf elsewhere than at the eastern entrance ofthe gulf. In the western part of the gulf, while a strongnorth-northwest wind is blowing, a cyclonic circulationdominates on the continental shelf. The forcing prevents theNC intrusions could be the wind, or a balanced water budgetin the gulf. Modeling should shed light on whether one ofthese two factors dominate. During Moogli 3, intrusions ofthe NC are observed in the center of the gulf (transect LI) andon its western side (transect TQ). Weak north to northeastwinds are blowing during both transects. Only portions of thecurrent enter the gulf since the current is deeper than thecontinental shelf. The strong eastern current observed in theeastern GoL may be due to these intrusions.
Hence, in opposition to Echevin et al. (2003) statement, noconclusion on NC intrusions could come only from the stateof the water column stratification. Indeed, there are globallymore intrusions of the NC in the gulf during Moogli 3 thanMoogli 2. Three reasons could be responsible: (1) the NC iscloser to the coast during the winter and hence its northwestmeanderings necessarily intrude on the gulf; (2) intrusionsare favored by east or northeast winds, and there are morefavorable winds during Moogli 3 than Moogli 2; (3) theglobal balance of the gulf during Moogli 3 could be a water“deficit” (Estournel et al., 2003), hence favoring the intru-sions of the NC. But the Rhone River input was higher than3000 m3 s–1 on the days preceding transect TR5, and that didnot prevent the strong intrusion of the NC on the shelf duringthat transect. So the third reason may be neglected in thiscase. Modeling results concerning these two periods shouldsoon determine the respective contributions of these factors(Dylan-Julliand, personal communication).
4.3. Topographic effects on surface currents
The edge between the Marseilles and the Grand Rhonecanyon divides the NC in two, from the bottom up to 120 m
depth during Moogli 2, and through the whole water columnduring Moogli 3. The upper limit of this topographic influ-ence corresponds to the depth of a deep pycnocline, when itexists. This stresses the role of the homogeneity of the bot-tom part of the water column. The deep bathymetry can affectcurrents as far up as the water column is not stratified.
On the contrary, the influence of the southern edge of theGrand Rhone canyon on the currents was clear only duringMoogli 2 and not visible during Moogli 3. The reason is thatthe NC is located north of that edge in the latter case (winter),and hence could not be separated by that edge.
5. Summary and conclusions
During both cruises, the NC is clearly detected along thecontinental slope and intrudes on the eastern side of the shelf.East of the gulf, its flux is ~2 Sv both in June and January.This new result does not agree with the expected lowerintensity of the NC in the summer. The present flux, based onADCP measurements, is not directly comparable with geo-strophic estimations. Nonetheless, it is recommended tomonitor the NC variability with a network of moorings andsystematic cross-current ADCP transects for several years.That should shed light on its variability and whether this oneis linked with deep water formation, as supported by numeri-cal (Madec et al., 1991b) and theoretical studies (Crepon etal., 1989), or other processes (Béthoux et al., 1988).
The NC characteristics exhibit seasonal differences. Someagree with observations previously described in the litera-ture. During the summer, the NC is generally wider than35 km, shallow (~200 m), with maximum currents of40–50 cm s–1. During the winter, the NC is narrower (28 km)but deeper (250–300 m) than during the summer. Its maxi-mum speed is around 70 cm s–1. Other characteristics are newor were not as clearly shown previously. The tilted verticalstructure of the NC is observed only during the winter, inagreement with the more pronounced cyclonic dome struc-ture of that season. During the winter, meanders of the NCare interpreted as due to baroclinic instabilities propagatingalong the shelf break. Other circulation features are alsoseason-specific. During the 1999 winter, dense water forma-tions are observed both on the continental shelf and offshore.During Moogli 2, an eastern current was observed at the topedge of the continental slope. Whether it is characteristic ofthe season is not determined. The summer stratification al-lows the development, after strong wind variations, of iner-tial currents with their characteristic 2-layer baroclinic struc-ture. In the surface layer, the speed of the inertial oscillationcan locally be as high as 200% the NC speed. Otherwise theinertial current is about 2/3 the NC. Horizontal spatial coher-ence of inertial currents is found on scales up to 50–75 km.The contribution of these inertial currents to the measuredcirculation cannot be neglected but is hard to estimate with-out the detailed and local analysis done in this article. Thesituation is different with time series data sets where highfrequency motions such as inertial currents are classically
336 A.A. Petrenko / Oceanologica Acta 26 (2003) 323–338

filtered out. Spatial interpolation technique (Candela et al.,1992) was tried unsuccessfully on the Moogli 1 ADCP datato isolate inertial currents (Durrieu de Madron, personalcommunication). The retrieval of the inertial componentfrom the circulation is one of the main problems that ocean-ographers and modelers, working on the circulation in theGoL and elsewhere, are presently dealing with.
Other hydrodynamic features depend primarily on topog-raphy or wind forcing. During both cruises, the NC is foundto branch out with deep portions going up canyons. Other-wise, bathymetric features strongly influence currents as farup as no pycnocline is encountered. Intrusions of the NC onthe continental shelf occur at the eastern end of the GoLduring both cruises, hence apparently independently of thestratification conditions. Moreover, intrusions also occur atthe center and western end of the gulf during Moogli 3. Thewinter (more northern) position of the NC seems to favorthese intrusions on the continental shelf. But the wind curlstress probably also influences the existence and strength ofthese intrusions of the NC on the continental shelf. Thecontinental shelf circulation is complex. During Moogli 3,strong eastern counter-currents may be linked to the numer-ous intrusions of the NC on the shelf. During Moogli 2,tramontane conditions seem to favor the formation of a cy-clonic structure on the western continental shelf. Modelingstudies should use the present data to validate or contradictthe hypotheses made on the mechanisms generating the cir-culation features described in this article.
Acknowledgements
This study was accomplished in the framework of theProgramme National d’Environnement Côtier (PNEC),Chantier Golfe du Lion. I thank the captains and crews of theSuroît, the chief scientist Patrick Raimbault, and GérardEldin for his assistance with Codas. I have very much appre-ciated the reviews from, or discussions with Frédéric Diaz,Claude Estournel, Claire Dylan-Julliand, Yann Leredde,Claude Millot, Louis Prieur, and Isabelle Taupier-Letage. Iam grateful to Virginie Destuynder for her collaboration, andto Urania Christaki for her friendship during Moogli 3. TheSeaWiFs image was obtained on the Italy/JRC site.
References
Albérola, C., Millot, C., 2003. Circulation in the French Mediterraneancoastal zone near Marseilles: influence of the wind and of the NorthernCurrent. Cont. Shelf Res. 23 (6), 587–610.
Albérola, C., Millot, C., Font, J., 1995. On the seasonal and mesoscalevariabilities of the Northern Current during the PRIMO-0 experiment inthe western Mediterranean Sea. Oceanol. Acta 18 (2), 163–192.
Arnau del Amo, P.A., 2000. Aspectos de la variabilidad de mesoescala de lacirculacion marina en la plataforma continental catalana. PolytechnicUniversity of Catalunya Tesis doctoral.
Bethoux, J.P., Durrieu de Madron, X., Nyffeler, F., Taillez, D., 2002. Deepwater in the western Mediterranean: peculiar 1999 and 2000 character-istics, shelf formation hypothesis, variability since 1970 and geochemi-cal inferences. J. Mar. Syst., 33–34 117–131.
Béthoux, J.-P., Prieur, L., Bong, J.H., 1988. Le courant Ligure au large deNice. Oceanol. Acta 9, 56–67 (special issue).
Candela, J., Beardsley, R.C., Limeburner, R., 1992. Separation of tidal andsubtidal currents in ship-mounted acoustic Doppler current profilerobservations. J. Geophys. Res. 97 (C1), 769–788.
Castellon, A., Font, J., Garcia, E., 1990. The Liguro-Provençal-Catalancurrent (NW Mediterranean) observed by Doppler profiling in the Bale-aric Sea. Sci. Mar. 54 (3), 269–276.
Chereskin, T.K., Levine, M.D., Harding, A.J., Regier, L.A., 1989. Observa-tions of near-inertial waves in acoustic Doppler current profiler measure-ments made in the mixed layer dynamics experiment. J. Geophys. Res.94 (C6), 8135–8145.
Chu, P.C., 1991. Geophysics of deep convection and deep water formation inthe oceans. In: Chu, P.C., Gascard, J.C. (Eds.), Deep Convection andDeep Water Formation in the Oceans, vol. 57. Elsevier OceanographySeries, pp. 3–16.
Conan, P., Millot, C., 1995. Variability of the northern current off Marseilles,western Mediterranean Sea, from February to June 1992. Oceanol. Acta18 (2), 193–205.
Crepon, M., Boukthir, M., Barnier, B., Aikman III, F., 1989. Horizontalocean circulation forced by deep water formation: Part I. An analyticalstudy. J. Phys. Oceanogr. 19, 1781–1792.
Crepon, M., Wald, L., Monget, J.M., 1982. Low-frequency waves in theLigurian Sea during December 1977. J. Geophys. Res. 87 (C1), 595–600.
Cruzado, A., Velasquez, Z.R., 1990. Nutrients and phytoplankton in the Gulfof Lion, northwestern Mediterranean. Cont. Shelf Res. 10 (9–11),931–942.
Echevin, V., Crepon, M., Mortier, L., 2003. Interaction of a coastal currentwith a gulf: application to the shelf circulation of the Gulf of Lion in theMediterranean Sea. J. Phys. Ocean. 33, 188–206.
Estournel, C., Durrieu de Madron, X., Marsaleix, P., Auclair, F., Julliand, C.,Vehil, R., 2003. Observation and modelisation of the winter coastaloceanic circulation in the Gulf of Lion under wind conditions influencedby the continental orography (FETCH experiment). J. Geophys. Res.108 (c3), 8059.
Fieux, M., 1973. Contribution àl’étude hydrologique et dynamique du Golfedu Lion en période hivernale. Union des Océanographes de France 5 (2),38–43.
Fieux, M., 1974. Formation d’eau dense sur le plateau continental du Golfedu Lion. Colloques Internationaux du CNRS. La Formation des EauxOcéaniques Profondes. CNRS, Paris.
Flexas, M., Durrieu de Madron, X., Garcia, M.A., Canals, M., Arnau, P.,2002. Flow variability in the Gulf of Lion during the MATER HFFExperiment (March–May 1997). J. Mar. Syst., 33–34 197–214.
Font, J., Garcia-Ladona, E., Gorriz, E.G., 1995. The seasonnality of themesoscale motion of the Northern Current of the western Mediterranean:several years of evidence. Oceanol. Acta 18 (2), 207–219.
Gascard, J.-C., 1973. Vertical motions in a region of deep water formation.Deep-Sea Res. 20, 1011–1027.
Gascard, J.-C., 1991. Open ocean convection and deep water formationrevisited in the Mediterranean, Labrador, Greenland and Weddell Seas.In: Chu, P.C., Gascard, J.C. (Eds.), Deep Convection and Deep WaterFormation in the Oceans, vol. 57. Elsevier Oceanography Series,pp. 157–182.
Gill, A.E., 1982. In: Donn, W.L. (Ed.), Atmosphere–Ocean Dynamics.Academic Press, pp. 662.
Joyce, T., 1989. On in situ ‘calibration” of shipboard ADCPs. J. Atmos.Ocean. Tech. 6, 169–172.
Lacombe, H., Tchernia, P., 1960. Quelques traits généraux de l’hydrologieméditerranéenne d’après diverses campagnes hydrologiques récentes enMéditerranée, dans le proche Atlantique et dans le détroit de Gibraltar.Cahiers Océanographiques 12 (8), 527–537.
337A.A. Petrenko / Oceanologica Acta 26 (2003) 323–338
Lacombe, H., Tchernia, P., 1972. Caractères hydrologiques et circulationdes eaux en Méditerranée. In: Stanley, D.J. (Ed.), The MediterraneanSea. Dowden Hutchinson and Ross, Strousberg, pp. 25–36.
Lapouyade, A., Durrieu de Madron, X., 2001. Seasonal variability of theadvective transport of particulate matter and associated organic carbon inthe Gulf of Lion (NW Mediterranean). Oceanol. Acta 24, 295–312.
Madec, G., Crepon, M., 1991a. Thermohaline-driven deep water formationin the Northwestern Mediterranean sea. In: Chu, P.C., Gascard, C. (Eds.),Deep Convection and Deep Water Formation in the Oceans, vol. 57.Elsevier Oceanography Series, pp. 241–266.
Madec, G., Chartier, M., Delecluse, P., Crepon, M., 1991b. Effect of ther-mohaline forcing variability on deep water formation in the WesternMediterranean Sea: a high resolution three dimensional numerical study.Dyn. Atmos. Oceans 15 (3–5), 301–332.
Millot, C., 1982. Analysis of upwelling in the Gulf of Lion. In: Nihoul (Ed.),Hydrodynamics of Semi-enclosed Seas.
Millot, C., 1990. The Gulf of Lion’s hydrodynamics. Cont. Shelf Res. 10(9–11), 885–894.
Millot, C., 1991. Mesoscale and seasonal variabilities of the circulation inthe Western Mediterranean. Dyn. Atmos. Oceans 15, 179–214.
Millot, C., 1999. Circulation in the Western Mediterranean Sea. J. Mar. Syst.20, 423–442.
Millot, C., Crepon, M., 1981. Inertial oscillations on the Continental Shelf ofthe Gulf of Lion—observations and theory. J. Phys. Oceanogr. 11 (5),639–657.
Millot, C., Wald, L., 1980. The effects of Mistral wind on the Liguriancurrent near Provence. Oceanol. Acta 3 (4), 399–402.
Moutin, T., Raimbault, P., Golterman, H.L., Coste, B., 1998. The input ofnutrients by the Rhône river into the Mediterranean Sea: recent observa-tions and comparison with earlier data. Hydrobiologia 373/374,237–246.
Person, R., 1974. Un exemple de descente des eaux superficielles du plateaucontinental dans un canyon du Golfe du Lion. CNRS. Processus deformation d’eaux océaniques profondes. Colloques Internationaux duCNRS, Paris.
Pollard, R., Read, J., 1989. A method for calibrating shipmounted acousticDoppler profilers and the limitations of Gyro. Compasses. J. Atmos.Ocean. Tech. 6, 859–865.
Raimbault, P., 2000. MOOGLI, Recueil de données. LOB, COM, Marseille,pp. 271.
Sammari, S., Millot, C., Prieur, L., 1995. Aspects of the seasonal andmesoscale variabilities of the Northern Current in the western Mediter-ranean Sea inferred from PROLIG-2 and PROS-6 experiments. Deep-Sea Res. I 42 (6), 893–917.
Schott, F., Visbeck, M., Send, U., Fischer, J., Stramma, L., Desaubies, Y.,1996. Observations of deep convection in the Gulf of Lion, NorthernMediterranean, during the winter of 1991–92. J. Phys. Ocean 26 (4),505–524.
338 A.A. Petrenko / Oceanologica Acta 26 (2003) 323–338


![inertial navigation[persian]](https://img.dokumen.tips/doc/110x75/55cf8f81550346703b9d0bdb/inertial-navigationpersian.jpg)