Embed Size (px)
Citation preview

DOE / PC92544-18
VAPOR PRESSURES AND HEATS OFVAPORIZATION OF PRIMARY COAL
TARS
FINAL REPORT
Grant Dates: August, 1992 - November, 1996
Principal Authors: Eric M. Suuberg (PI) and Vahur Oja
Report Submitted: April, 1997Revised: July, 1997
Grant Number: DE-FG22-92PC92544
Report Submitted by:ERIC M. SUUBERG
DIVISION OF ENGINEERINGBROWN UNIVERSITY
PROVIDENCE, RI 02912TEL. (401) 863-1420
Prepared For:U. S. DEPT. OF ENERGY
FEDERAL ENERGY TECHNOLOGY CENTERP.O. BOX 10940
PITTSBURGH, PA 15236
DR. KAMALENDU DAS, FETC, MORGANTOWN , WVTECHNICAL PROJECT OFFICER
"US/DOE Patent Clearance is not required prior to the publication of this document"

ii
United States Government Disclaimer
This report was prepared as an account of work sponsored by an agency of the UnitedStates Government. Neither the United States Government nor any agency thereof, nor anyof their employees, makes any warranty, express or implied, or assumes any legalresponsibility for the accuracy, completeness, or usefulness of any information, apparatus,product, or process disclosed or represents that its use would not infringe privately ownedrights. Reference herein to any specific commercial product, process, or service by tradename, trademark, manufacturer, or otherwise does not necessarily constitute or imply itsendorsement, recommendation, or favoring by the United States Government or anyagency thereof. The views and opinions of the authors expressed herein do not necessarilystate or reflect those of the United States Government or any agency thereof.

iii
Executive Summary
This project had as its main focus the determination of vapor pressures of coal
pyrolysis tars. It involved performing measurements of these vapor pressures and from
them, developing vapor pressure correlations suitable for use in advanced pyrolysis models
(those models which explicitly account for mass transport limitations).
This report is divided into five main chapters. Each chapter is a relatively "stand-alone"
section. Chapter A reviews the general nature of coal tars and gives a summary of existing
vapor pressure correlations for coal tars and model compounds. It is shown that the
heterogeneous nature and the complexity of coal tars have made it unrealistic to apply
detailed vapor pressure correlations which take into account the variation in the chemical
structure of the tars.
Chapter B summarizes the main experimental approaches for coal tar preparation and
characterization which have been used throughout the project. A significant aspect is the
development of the new "non-isothermal" Knudsen effusion technique to measure the
vapor pressures of complicated mixtures. The traditional isothermal Knudsen effusion
technique has long been employed as an indirect method for determining the vapor
pressures of pure low volatility materials. It is difficult to apply the method to complex
mixtures of compounds, since the long time-scales required in the usual measurement may
permit significant change in composition while waiting for pseudo-steady-state. For this
reason, a modification was made to the traditional Knudsen method. The resulting non-
isothermal method involves a straightforward modification of equipment and only a limited
change in procedures. The technique has been applied to polycyclic aromatics and pyrolysis
tars.
iv
Chapter C is concerned with the selection of the model compounds for coal pyrolysis
tars and reviews the data available to us on the vapor pressures of high boiling point
aromatic compounds. This chapter also deals with the question of identifying factors that
govern the vapor pressures of coal tar model materials and their mixtures. The
measurements of vapor pressures for various large polycyclic aromatic hydrocarbons
(PAH), including those containing heteroatoms, and some mixtures of these compounds
are presented. We believe that our results might be among the first available on some of
these materials.
Chapter D covers the vapor pressures and heats of vaporization of primary cellulose
tars. Cellulose tar has a much narrower distribution of molecular weights than does coal
tar, and is much more homogenous. Thus it was better to develop the methods to be used
for coal tars on this simpler model system first. New vapor pressure data for sugar-
compounds (levoglucosan, D-xylose, D-glucose and cellobiose) and for cellulose tar are
presented. The volatility of the tar is similar to that of a widely accepted major component
of the tar, levoglucosan. It is thus confirmed that levoglucosan can be a reasonable model
for fresh cellulose tar.
This work has also resulted in a hypothesis regarding the role of tar evaporation in the
global kinetics of cellulose pyrolysis. This study of the cellulose tar vapor pressure and
heat of vaporization has been the first in the field of biomass pyrolysis. Therefore, future
research could be directed at measuring the vapor pressures for the other biomass pyrolysis
tars and at developing the pyrolysis models which take into account the heats of
vaporization.
Chapter E discusses the results of the main focus of this study. Coal tars were prepared
from various coal samples. Four coals from the Argonne Premium Coal set - the Illinois

v
No.6, the Pittsburgh No.8, the Pennsylvania Upper-Freeport and the Wyodak - were
selected for this study. Also another Pittsburgh No.8 sample, Bruceton standard coal, was
examined in preliminary work.
Characterization of tars was obtained via elemental analysis and gel permeation
chromatography (GPC). This characterization shows the heteroatomic content of all tars to
be comparable to the parent coal, and that tars likely contain a large amount of hydroxyl
functionality. The coal tar separation by GPC, using a Phenogel column and pyridine as
mobile phase, allows one to characterize tars in terms of compound classes, by drawing
lines designating the region of elution for various classes of aromatics. This type of
separation can be characterized only by an extensive calibration procedure. The actual
assignment of classes is still tentative on the basis of the limited data at hand. However, we
believe that this technique could serve as a good and simple basis for characterizing
complex mixtures such as coal tars. This needs further verification by detailed chemical
analysis.
The significant product of this study is a much improved understanding of the volatility
and thermal behavior of coal tars. The volatility was studied by vacuum sublimation and
Knudsen effusion experiments. The volatility behavior is considerably more complicated
than had been earlier believed.
The tars evaporate in a "distillation-like" fashion. More volatile species are lost earlier in
the process, leaving behind a progressively less volatile residue. The results suggest that
there are three very different classes of compounds, and therefore, at least three different
vapor pressure behaviors. The first corresponds to compounds of high molecular weight
and significant alkyl character, the second to compounds with significant hydroxyl group
content and medium molecular weight, and the third to medium molecular weight aromatic
compounds without hydroxyl groups. Hydrogen bonding plays a major role in the
determining the tar volatility.
vi
There has been concern in pyrolysis modeling about how closely Raoult's law is
followed in coal tar. It appears from our results that the assumption of ideal mixture
behavior could be acceptable for rough models of pyrolysis despite the possibility of strong
specific interactions between certain functional groups.
The results from the current work show that measuring the vapor pressures of
complicated and thermally unstable mixtures is possible at low temperatures. There has also
been some concern about condensation-type reactions influencing the results of vapor
pressure measurements, even at modest temperatures, below 250°C. It was shown to be
unlikely that such residue formation could affect the vapor pressure results very much,
though the thermal instability of the tars was clearly demonstrated. The major reactions
promote formation of some kinds of non-volatile residue. New vapor pressure correlations
for Pittsburgh No.8 coal tar, Wyodak coal tar and Upper-Freeport coal tar have been
developed for use in pyrolysis models.
In summary, this work provides improved understanding of the volatility of coal and
cellulose pyrolysis tars. It has resulted in new experimentally verified vapor pressure
correlations for use in pyrolysis models. Further research on this topic should aim at
developing general vapor pressure correlations for all coal tars, based on their molecular
weight together with certain specific chemical characteristics i.e. hydroxyl group content.
vii
Contents
List of Figures xi
List of Tables xx
Chapter A. Introduction 1
A.1. Overview 1
A.2. General Nature of Coal Tars 3
A.2.1. Molecular Weight Characterization 5
A.2.2. Functional Group Characterization 6
A.3. Vapor Pressure of Coal Tar 11
A.4. Pure Compound Vapor Pressure Estimation 14
A.4.1. Pure Component Vapor Pressure - Survey 14
A.4.2. Vapor Pressure Extrapolation and Estimation Methods 15
A.4.3. Integrated Forms of Clausius-Clapeyron Equation 17
A.4.4. Other Empirical Correlations 20
A.4.5. Group-Contribution Methods 22
A.5. Models of Vapor Pressures of Coal Liquids 24
Figures for Chapter A 28
Chapter B. Experimental Techniques 29
B.1. General Experimental Procedure for Coal Tar Preparation and
Characterization 29
B.2. Tar Preparation Techniques 30
B.2.1. The Selection of the Solvent for Tar Collection, Fractionation 30
and Analysis
B.2.2. Tar Production Techniques 30

viii
B.2.3. Tar Fractionation Techniques 32
B.3. Tar Characterization Techniques 34
B.3.1. Vapor Phase Osmometry 34
B.3.2. GPC in Analytical Mode 34
B.3.3. Differential Scanning Calorimetry 35
B.3.4. Elemental Analysis 36
B.4. Vapor Pressure Measurements 37
B.4.1. Selection of Technique 37
B.4.1.1. Transpiration Technique 38
B.4.1.2. Knudsen Effusion Technique 41
B.4.2. Knudsen Effusion Method - Basic Aspects 43
B.4.2.1. The Theory of the Knudsen Effusion Technique 43
B.4.2.2. Real Cells, Samples and Orifices 45
B.4.2.2.1. Nonideal Orifice, the Clausing Factor for
an Orifice 45
B.4.2.2.2. Evaporation Coefficient, Cell Geometry 46
B.4.2.3. Implementation of the Method 49
B.4.3. Knudsen Effusion System 51
B.4.3.1. Effusion System 51
B.4.3.2. TGA Apparatus 52
B.4.3.3. Heating System 53
B.4.3.4. Effusion Cell 53
B.4.4. Establishing the Performance of the Apparatus 55
B.4.4.1. Effusion Technique Using the Isothermal Method 55
B.4.4.2. Non-Isothermal Technique 57
B.4.5. Conclusions 58
Figures for Chapter B 59

ix
Chapter C. Vapor Pressures of Polycyclic Aromatic Hydrocarbons
and Model Mixtures 73
C.1. Effects of Intermolecular Forces on Vapor Pressure - Overview 73
C.2. Vapor Pressure Measurements for PAH 75
C.2.1. Polycyclic Aromatic Hydrocarbons 75
C.2.2. Polycyclic Aromatic Hydrocarbons Containing Heteroatoms 77
C.3. Model Compounds for Coal Tars - Some Considerations 81
C.3.1. Van der Waals Forces 81
C.3.2. Polar Attraction 82
C.3.3. The Entropy of Sublimation 84
C.3.4. The Contribution of Hydrogen Bond 85
C.4. Vapor Pressure of Coal Tar Model Mixtures 88
C.5. Variation of Vapor Pressure with Temperature - Summary 92
C.6. Vapor Pressure Correlation for Aromatic Compounds 95
Figures for Chapter C 97
Chapter D. Vapor Pressures and Heat of Vaporization of Model
Compounds and Primary Cellulose Tar 133
D.1. Cellulose Tar Characteristics and Its Volatility 133
D.2. Vapor Pressure of the Cellulose Tar Related Compounds 136
D.2.1. Vapor Pressure of Levoglucosan 137
D.2.2. Vapor Pressures of Sugar Compounds 138
D.3. The Vapor Pressure of Primary Cellulose Tar 141
D.3.1. Production of the Cellulose Tar 141
D.3.2. Characterization of the Cellulose Tar 142
D.3.3. Vapor Pressure Measurements of Cellulose Tar 144

x
D.3.4. Heat of Vaporization - Contribution to the Heat of Pyrolysis 148
D.3.5. Cellulose Tar Evolution - Controlled Kinetics 149
D.4. Conclusion 150
Figures for Chapter D 151
Chapter E. Coal Tar - Experimental Results and Discussion 167
E.1. Characterization of the Coal Tars by GPC in the "Analytical Mode" 168
E.1.1. GPC Chromatogram Characterization 171
E.1.2. Absorbance 177
E.2. Thermal Behavior and Stability of Tar 180
E.2.1. DSC Results 180
E.2.2. Thermal Treatment of Tar and its Effect on Molecular Weight 181
E.3. Tar Volatility and Stability 183
E.3.1. Vacuum Sublimation Experiments 184
E.3.1.1. Vacuum Sublimation/Knudsen Effusion Experiments 185
E.3.1.2. Molecular Weight Determination for Evaporated Fractions 187
E.3.1.3. Comparison with Pure Compounds 189
E.3.2. The Effusion Experiments for Coal Tars 190
E.4. Tar Characterization 193
E.4.1. Tar Composition 193
E.4.2. Is the Tar an Ideal Mixture? 196
E.5. Results of the Vapor Pressure Measurements 198
E.5.1. High Volatile Bituminous Coal Tar 200
E.5.1.1. Pittsburgh No.8 Coal Tar Fractions. 203
E.5.2. Upper-Freeport Medium Volatile Bituminous Coal Tar 207
E.5.3. Wyodak Subbituminous Coal Tar 208
E.5.4. Comparison of Boiling Point Correlations at 760 Torr. 209
xi
E.5.5. New Vapor Pressure Correlation. 211
Figures for Chapter E 214
Chapter F. Concluding Remarks 284
References 288
Appendix A 297
Appendix B 298

xii
List of Figures:
A.1. Predicted variation of boiling point with molecular weight, for low
molecular weight aromatics 28
B.1. General scheme for coal tar preparation and characterization 59
B.2. Typical preparative GPC chromatogram, along with the dividing lines
between fractions 60
B.3. VPO calibration constant determinations at 90°C, using pyridine as the
solvent 61
B.4. Selection of the wavelength to maximize the UV detector response 62
B.5. General schematic of the effusion system 63
B.6. Arrangement of an Effusion Apparatus with control and measurement
system 64
B.7. The effusion method applied to anthracene, using different effusion
orifices 65
B.7a. Mean of literature data for solid anthracene. 66
B.8. Effusion method applied to solid naphthacene 67
B.9. Effusion method applied to solid pentacene 68
B.10. A comparison of results obtained using the non-isothermal and isothermal
effusion method on anthracene. Heating and cooling rates 5°C/min 69
B.11. The non-isothermal effusion method on solid anthracene. Heating
rate 0.8 °C/min 70
B.12. Non-isothermal effusion method applied to naphthacene, with
continuous decrease of sample temperature. Cooling rate 0.8 °C/min 71
B.13. Non-isothermal effusion method applied to naphthacene, with
continuous increase of sample temperature. Heating rate 0.8 °C/min 72
C.1. Vapor pressure data for aromatic compounds at 75°C 97

xiii
C.2. Effusion method applied to solid phenanthrene 98
C.3. Effusion method applied to solid pyrene 99
C.4. Effusion method applied to solid coronene 100
C.5. Effusion method applied to solid perylene 101
C.6. Effusion method applied to solid 2,3-benzofluorene 102
C.7. Effusion method applied to solid phenanthridine 103
C.8. Effusion method applied to solid 1,2-benzodiophenylene sulfide 104
C.9. Effusion method applied to solid hydroxypyrene 105
C.10. Effusion method applied to solid perinaphthenone and
3-hydroxy-1H-phenalen-1-one 106
C.11. Effusion method applied to solid 6,11-dihydroxy-5,12-naphthacene
dione 107
C.12. Effusion method applied to solid benz[g]isoquinoline-%,10-dione 108
C.13. Effusion method applied to solid Aspirin 109
C.14. Enthalpy of sublimation against carbon number for PAH 110
C.14b. Enthalpy of sublimation against molecular weight for PAH 111
C.15. Comparison of the vapor pressure data on selected aromatic hydrocarbons
MW(C18 H12)=228 112
C.16. Enthalpy of sublimation against molecular weight for alkyl and phenyl
substituted PAH 113
C.17. Comparison of the solid vapor pressure data of anthracene (MW 178)
9,10-dimethylanthracene (MW 206), and 5-butylantharcene (MW 234) 114
C.18. Normal boiling point against molecular weight for PAH and alkyl
substituted PAH 115
C.19. Enthalpy of sublimation against molecular weight of heteroatom
containing PAH 116
C.20. Comparison of vapor pressures of four aromatic compounds 117

xiv
C.21. Comparison of vapor pressures of four aromatic compounds 118
C.22. Entropy of sublimation for various aromatics. 119
C.23. Comparison of vapor pressures of naphthalene, 1-naphthol and
2-naphthol 120
C.24. Effusion method applied to a mixture of anthracene (50%) and perylene
(balance) 121
C.25. Effusion method applied to a mixture of anthracene (75%) and benzo-
fluorene (balance) 122
C.26. Effusion method applied to a mixture of anthracene (25%) and benzo-
fluorene (balance) 123
C.27. Effusion method applied to a mixture of 1-hydroxypyrene (54%) and
phenanthridine (balance) 124
C.28. Effusion method applied to a mixture of phenanthridine (50%) and
perylene (balance) 125
C.29. Effusion method applied to a mixture of phenanthridine (50%) and
1,2-benzodiphenylene sulfide (balance) 126
C.30. Effusion method applied to a mixture of phenanthridine (75%) and
1,2-benzodiphenylene sulfide (balance) 127
C.31. Non-isothermal effusion method applied to a mixture of hydroxypyrene
(mole fraction 0.55) and perinaphthenone (balance) 128
C.32. The vapor pressure curve for pyrene 129
C.33. ∆Hfus/∆Hsub ratio for aromatic hydrocarbons 130
C.34. ∆Sfus/∆Ssub ratio for aromatic hydrocarbons 131
C.35. Comparison of the equation {C.2} with pure compound boiling point
data at pressure 760 torr and the Unger-Suuberg correlation {A.1} 132
D.1. Mass loss rates during cellulose powder pyrolysis at different heating
rates in the TGA 151

xv
D.2. Mass loss from reheating cellulose tar at 60°C/min, in the heated mesh
reactor 152
D.3. DSC applied to levoglucosan. Heating rate 5°C/min 153
D.4. Effusion method applied to levoglucosan 154
D.5. The extrapolation of levoglucosan data up to the boiling point at 760 torr 155
D.6. Effusion method applied to solid D-xylose, levoglucosan, D-glucose and
cellobiose 156
D.6a. Variation of ∆Hsub with hydroxyl group content 157
D.6b. Variation of ∆Ssub with hydroxyl group content 158
D.7. DSC applied to D-xylose. Heating rate 5° K/min 159
D.8. DSC applied to D-glucose. Heating rate 5° K/min 160
D.9. DSC applied to cellobiose. Heating rate 5° K/min 161
D.10. GPC chromatogram (UV spectra at 305 nm) for cellulose tars. 162
D.11. GPC chromatogram (RI spectra ) for cellulose tars. 163
D.12. Effusion data for cellulose tars and levoglucosan 164
D.13. Vapor pressure of "fresh" cellulose tar and levoglucosan as a function
of temperature 165
D.14. DSC applied to "fresh" cellulose tar. Heating rate 5 ° K/min. 166
E.1. Separation of coal-derived liquids by GPC based upon Philip and
Anthony [1982] 214
E.2. GPC elution data for standard compounds (Strachan and Johns, 1985) 215
E.3. GPC elution data for standard compounds (Rodgers et al., 1985) 216
E.4. GPC elution data for standard compounds 217
E.5. GPC chromatograms for Bruceton coal tar and the first 5 fractions, collected
from the preparative GPC column. 218
E.6. GPC chromatograms for Bruceton coal tar and the last 4 fractions, collected
from the preparative GPC column. 219

xvi
E.7. Reconstruction of the curve for whole Bruceton coal tar by summing the
contributions of fractions 220
E.8. Analytical GPC chromatograms for Pittsburgh No.8 coal tar and its
fractions separated by preparative GPC 221
E.9. Analytical GPC chromatograms for Illinois No.6 coal tar and its
fractions separated by preparative GPC 222
E.10. Analytical GPC chromatograms for Wyodak coal tar and its
fractions separated by preparative GPC 223
E.11. Analytical GPC chromatograms for Upper-Freeport coal tar and its
fractions separated by preparative GPC 224
E. 12. Normalized absorbance for whole Bruceton coal tar at different
wavelengths 225
E.13. DSC applied to Pittsburgh No.8 coal tar. heating rate 5° K/min 226
E.14. DSC applied to Pittsburgh No.8 coal tar. heating rate 0.5° K/min 227
E.15. Comparison of the Illinois No.6 coal tar GPC spectra before and
after heating at 200°C 2 hours 228
E.16. Comparison of the Wyodak coal tar GPC spectra before and
after heating at 280°C 2 hours 229
E.17. Comparison of the Upper-Freeport coal tar GPC spectra before and
after heating at 280°C 2 hours 230
E.18. Comparison of the old and fresh Illinois No.6 coal tars GPC spectra 231
E.19. Comparison of the old and fresh Pittsburgh No.8 coal tars GPC spectra 232
E.20. Relative volatility of lignite and bituminous coal tars as a function
of heated grid temperature [Freihaut et al., 1993] 233
E.21. GPC chromatograms for Bruceton coal tar and its fractions separated
by vacuum sublimation 234
E.22. GPC chromatograms for Wyodak coal tar and its fractions separated

xvii
by vacuum sublimation 235
E.23. GPC chromatograms for Upper-Freeport coal tar and its fractions
separated by vacuum sublimation 236
E.24. Reconstruction of the GPC spectra for Wyodak coal tar by summing the
contributions of tar vacuum sublimation fractions 237
E.25. Reconstruction of the GPC spectra for Upper-Freeport coal tar by summing
the contributions of tar vacuum sublimation fractions 238
E.26. Vapor phase molecular weight dependence with effusion temperature 239
E.27. Mass percents of evaporated fractions as a function of evaporation
temperature 240
E.28. The non-isothermal Knudsen effusion method applied to whole Bruceton
coal tar 241
E.29. GPC chromatograms for various coal tars studied 242
E.30. Effusion method applied to a mixture of Illinois No.6 coal tar GPC
fraction 4 (50%) and 1-hydroxypyrene (balance) 243
E.31. Effusion method applied to a mixture of Illinois No.6 coal tar GPC
fraction 4 (65%) and phenanthridine (balance) 244
E.32. Simulated vapor pressure experiment 245
E.33. Raw vapor pressure data for Bruceton coal tar 246
E.34. Raw vapor pressure data for Pittsburgh No.8 coal tar produced in the
wire mesh reactor 247
E.35. Raw vapor pressure data for Pittsburgh No.8 coal tar produced in the
tubular reactor 248
E.36. The vapor pressure curves for Pittsburgh No.8 wire mesh coal tar 249
E.37. The vapor pressure curves for Pittsburgh No.8 tubular reactor coal tar 250
E.38. The vapor pressure curves for Bruceton coal tar 251
E.39. Vaporization enthalpy as a function of molecular weight for

xviii
Pittsburgh Seam coal tars 252
E.40. The pre-exponential (A) as a function of molecular weight for
Pittsburgh Seam coal tars 253
E.40a. The pre-exponential (A) as a function of molecular weight for
Pittsburgh No.8 coal tars, excluding fluidized bed data 254
E.41. Raw data for Pittsburgh No.8 coal tar fraction 1 separated by
preparative GPC 255
E.42. Raw data for Pittsburgh No.8 coal tar fraction 2 separated by
preparative GPC 256
E.43. Raw data for Pittsburgh No.8 coal tar fraction 3 separated by
preparative GPC 257
E.44. Raw data for Pittsburgh No.8 coal tar fraction 4 separated by
preparative GPC 258
E.45. The vapor pressure curves for Pittsburgh No.8 coal tar fraction 1
separated by preparative GPC 259
E.46. The vapor pressure curves for Pittsburgh No.8 coal tar fraction 2
separated by preparative GPC 260
E.47. The vapor pressure curves for Pittsburgh No.8 coal tar fraction 3
separated by preparative GPC 261
E.48. The vapor pressure curves for Pittsburgh No.8 coal tar fraction 4
separated by preparative GPC 262
E.49a. Comparison of Pittsburgh No.8 coal tar fraction 2 GPC spectra before
and after effusion 263
E.49b. Comparison of Pittsburgh No.8 coal tar fraction 3 GPC spectra before
and after effusion 264
E.49c. Comparison of Pittsburgh No.8 coal tar fraction 4 GPC spectra before
and after effusion 265

xix
E.50. Vaporization enthalpy as a function of molecular weight for
Pittsburgh No.8 coal tar GPC fractions 266
E.51. The pre-exponential (A) as a function of molecular weight for
Pittsburgh No.8 coal tar GPC fractions 267
E.52a. The vapor pressure correlation curves for Pittsburgh No.8 coal tar
and its GPC fractions at 500°C 268
E.52b. The vapor pressure correlation curves for Pittsburgh No.8 coal tar
and its GPC fractions at 600°C 269
E.53. The vapor pressure curves for Upper-Freeport coal tar produced
in the wire mesh reactor 270
E.54. Raw data for Upper-Freeport coal tar produced in the wire mesh
reactor 271
E.55. Vaporization enthalpy as a function of molecular weight for
Upper-Freeport coal tar 272
E.56. The pre-exponential (A) as a function of molecular weight for
Upper-Freeport coal tar 273
E.57. The vapor pressure curves for Wyodak coal tar produced
in the wire mesh reactor 274
E.58. Raw data for Wyodak coal tar produced in the wire mesh
reactor 275
E.59. Vaporization enthalpy as a function of molecular weight for
Wyodak coal tar and its GPC fraction 1 276
E.60. The pre-exponential factor (A) as a function of molecular weight for
Wyodak coal tar and its GPC fraction 1 277
E.61. The vapor pressure curves for Wyodak coal tar fraction 1
separated by preparative GPC 278
E.62. Raw data for Wyodak coal tar fraction 1 separated by preparative GPC 279

xx
E.63. Comparison of predicted coal tar boiling points at 760 torr with the
Unger-Suuberg [1985], Fletcher et al. [1992] , Oh et al. [1989] and
Niksa-Kerstein [1991] correlations 280
E.64. Comparison of the different vapor pressure correlations at 300°C (573 K) 281
E.65. Comparison of the different vapor pressure correlations at 500°C (773 K) 282
E.66. Comparison of the different vapor pressure correlations at 700°C (973 K) 283

xxi
List of Tables:
A.1. Vapor pressure correlations for coal pyrolysis tar. 12
A.2. Vapor pressure ranges defined. 14
C.1. The heats of sublimation for benzene, phenol and benzenediols. 86
C.2. Literature data for some aromatic compounds. 92
C.3. Normal boiling points and estimated critical temperatures for some PAH. 94
D.1. Enthalpy and entropy of sublimation for sugar like compounds. 139
D.2. Measured melting points and heats of fusion for sugar-like compounds. 139
D.3. Elemental analysis results for cellulose tars. 144
E.1. Ultimate analyses (dry wt %) of coals studied. 167
E.2. GPC elution data for compounds used as standards. 171
E.3. Relative amounts of different fractions from Bruceton coal tar 173
E.4. Average molar absorbances of tars. 178
E.5. Sublimation behavior of some tars. 180
E.6. Molecular weights and amounts of evaporated fractions. 187
E.7. The temperature of volatility of pure aromatic compounds. 189
E.8. Elemental analysis results for coals and tars studied. 193
E.9. Separation of tars by compound classes. 195
E.10. Chemical characterization of the Pittsburgh No.8 coal tar and its
preparative GPC fractions. 203
E.11. Comparison of the correction factor φ with the ratio MWGPC fraction
to MWtar. 204
E.12. Vapor pressure correlations for Pittsburgh No.8 coal tar and its
preparative GPC fractions. 206
E.13. Vapor pressure correlation for coal tars studied. 211

xxii
Chapter A. Introduction.
A.1. Overview.
As the world continues to deplete its petroleum reserves, heavy crude oil, coal liquids,
and other heavy fossil fuels may be required to meet world energy needs. The
thermodynamic and thermophysical properties of high molecular weight compounds are of
increasing importance in the utilization of fossil fuels. Heavy fossil fuels contain molecules
that are large and more aromatic and that contain more heteroatoms than those found in
liquid crude oil.
There is also significant current interest in the general area of coal pyrolysis,
particularly with respect to comprehensive models of this complicated phenomenon. This
interest derives from the central role of pyrolysis in all thermally driven coal conversion
processes - gasification, combustion, liquefaction, mild gasification, or thermal
beneficiation. Earlier modeling work has shown that tars are key volatile products of coal
pyrolysis, and their ability to evaporate from coal particles determines several key features
of pyrolysis (tar yields, char yields, gas yields, tar molecular weight distribution, ability of
the particles to soften). Regardless of how coal is thermally processed, development of a
truly fundamental understanding of the process requires learning more about how the tars
behave during pyrolysis. Since there is unquestionably a need to continue to improve coal
utilization technologies, there is naturally a strong driving force for improving many
aspects of understanding of the process. There remain several key data needs in these
application areas. Among them is a need for more reliable correlations for prediction of
vapor pressures of heavy, primary coal tars. Such information is important in design of all
coal conversion processes, in which the volatility of tarry products is of major concern.
The experimental data to develop such correlations are not available. The vapor
pressure correlations that exist at present for coal tars are very crude and they are not

2
considered reliable to even an order of magnitude. The tars obtained either by low-
temperature or high-temperature carbonization of coal are complex mixtures of a myriad of
aromatic compounds of widely ranging concentrations. Investigators have identified more
than 100 condensed polynuclear aromatic hydrocarbon and heterocyclic compounds in coal
tar, but it was estimated that as many as 5000 compounds may be present. Sophisticated
general correlative approaches are slowly being developed, based upon group contribution
methods, or based upon some key functional features of the molecules. These detailed
group contribution methods, in which fairly precise structural information is needed, do not
lend themselves well for application to very complex, poorly characterized coal tars. The
methods based upon more global types of characterizations have on the other hand not yet
dealt much with the question of oxygenated functional groups. In short, very few
correlations exist, and these are not considered reliable to even an order of magnitude when
applied to tars. Improving the ability to predict vapor pressures of coal tars is one of the
remaining critical issues to be resolved in pyrolysis modeling. Detailed models of pyrolysis
all include tar vaporization as a key element. Examples of codes that directly employ
estimates of vapor pressure include FG/DVC (a product of AFR, Inc.), FLASHCHAIN
(from Sandia/Stanford Univ./SRI, Inc.), and CPD. In some cases FG/DVC is incorporated
in to the PCGC2 code also from Brigham Young University and ACERC.

3
A.2. General Nature of Coal Tars.
Tars are among the major products of pyrolysis of a great many organic solids. Tars are
key volatile products of coal pyrolysis, and their ability to evaporate from coal particles
determines several key features of pyrolysis. Knowledge of coal tar vapor pressures is
important in predicting the pyrolysis behavior of coals, since most advanced models of coal
pyrolysis utilize an evaporation step to describe the loss of tar from particles.
The definition of tar is arbitrary. Tars are generally operationally defined in any
experiment. They are most often defined as any degradation products which have escaped
the parent solid, and are condensable at room temperature. In this work we are interested in
"primary tars" or tars that have not undergone secondary reactions.
Coal itself can be defined as a complex sedimentary rock, a heterogeneous mixture of
higher-plant-derived organic materials which has undergone chemical changes related to
depositional environment and diagenetic history. Since coal is not a homogenous
substance, it is characterized by wide variations in its properties and compositions. The
most common coal classification is by rank. The rank is a measure of the degree of
coalification that organic plant sediment has reached in its metamorphosis from peat to near
-graphite-like material. Some aspects of the characterizations of coals are given elsewhere
[Smith et al., 1994]. Coal tars reflect the characteristics of parent coal.
Coal tars are very complex mixtures of individual components. Tars and their fractions
are often represented in the terms of an "average molecule", based upon elemental
composition, molecular weight, molecular weight distribution, functional group
concentration and structural parameters such as the aliphatic and aromatic hydrogen-to-
carbon ratio. A review of the techniques for characterizing coal tars is given by Solomon et
al.[1992]. Some investigators [Orning and Greifer, 1956; Brown, 1958; Solomon et al.,
1984] have reported that the chemical structural characteristics of primary tars are similar to

4
those present in the parent coal, although the chemical nature and composition of the tars
vary substantially with rank characteristics of the parent coal and operating conditions
[Solomon et al., 1981, 1992; Freihaut et al., 1989].
The rate of escape of tar from pyrolyzing coal particles depends strongly upon the
vapor pressure of the tar, and this property depends to the greatest extent upon the
molecular weight of the tar [Unger and Suuberg, 1984; Fletcher et al., 1992]. Thus,
several investigators [Unger and Suuberg, 1984; Oh et al., 1989; Solomon et al., 1990]
have studied the molecular weight distribution of coal tars released in rapid pyrolysis and
noted its strong dependence on pyrolysis conditions (temperature, pressure, effect of
different reactors and pyrolysis environment) and coal rank. There are relatively few data
on the characterization of "primary" tars.
The reactor systems which most nearly approach conditions necessary for studies of
primary tars are those in which the gas into which tars evolve remains cold. These reactors
include the heated wire mesh type systems and flashlamp/laser heated systems. Even with
these systems, gas phase secondary reactions sometimes take place. In any type of
experimental device, secondary reactions may actually occur within the particles
themselves, if transport limitations exist. Thus there is not an experimentally clean way to
produce only "primary tars", and some reported differences in tars, from study-to-study,
may have to do with how the tars were prepared.
A.2.1. Molecular Weight Characterization.
In earlier work, the molecular weight distribution determination techniques have been
the subject of much concern. Two methods have been used for characterizations. Early
attempts relied upon size-exclusion chromatography (SEC) or gel permeation

5
chromatography (GPC), and in later work field ionization mass spectrometry (FIMS) was
used. The FIMS results generally suggest lower molecular weight tars than do the GPC
results. There are, however, concerns about the reliabilty of both techniques.
Suuberg and co-workers [1984, 1985] determined molecular weights in the range 200-
4000 daltons by GPC with THF as mobile phase, for high volatile bituminous coal primary
tars. In fact, there is a concern that using THF as solvent results in a shift of the molecular
weight to unrealistically high values. Oh et al. [1989] obtained a molecular weight
distribution between 150 and 1500 daltons for a Pittsburgh bituminous tar using pyridine
as the solvent. The difference was attributed to association of tar species in the THF, since
pyridine is generally a stronger solvent for coal, and presumably, its tar.
Solomon et al. [1990] determined molecular weight distributions using FIMS for 8
Argonne premium coals pyrolysed to 450°C at 3°C/min in the FIMS apparatus. They
showed that the intermediate rank coals, i.e., Pittsburgh No.8, Lewiston-Stockton, Utah
Blind Canyon, and Illinois No.6 all have similar molecular weight distributions showing
maxima in near 400 daltons. Upper-Freeport coal tar showed a maximum near 500 daltons.
Low rank coals such as Wyodak and Zap showed that the majority of tars fall between 100
and 200 daltons. The maximum molecular weight extended to about 800 daltons for all
tars.
Some other techniques have also been used to examine the molecular weights of
vacuum pyrolysis tars and coal derived materials [Winas et al., 1991; Winas, 1991; Herod
et al., 1993a, 1993b; Parker et al., 1993]. Winans et al. [1991] compared fast atom
bombardment-mass spectroscopy (FAB-MS), laser desorption mass spectrometry (LDMS)
and desorption chemical ionization DCI-MS of a vacuum pyrolysis tar. Very different
upper limits were reported using the different methods. The tars were mostly found to be
below 1000 daltons, with the exception of FAB. Using this technique, Winans [1991]
observed the highest molecular weight values for vacuum pyrolysis tars to be on the order
1000 to 1200 daltons, with the peaks of the distributions centered at around 400 to 450

6
daltons. It is important in any mass spectrometric method to assure that the analysis of the
whole sample is possible. Formation of a non-volatile residue in the inlet of the mass
spectrometer warns that this may not be so. Such concerns have been voiced from time-to-
time about the FIMS technique.
Existence in pyrolysis tars of high molecular mass materials between 1000 and 5000
daltons has also been recently observed by laser desorption mass spectrometry [Parker et
al., 1993; Herod et al., 1993a, 1993b]. It is fair to say, in summary, that there remains
some uncertainty as to the molecular weight distribution of the tars, with different methods
of characterization suggesting different ranges. Still, there is general agreement that the
materials of interest have molecular weights of several hundred up to thousands.
A.2.2. Functional Group Characterization.
It is known that vapor pressure is a property which depends on the interaction between
molecules. Although the molecular size (number of atoms) is the most important factor in
determining interactions, the specific interaction between particular structures may also play
an important role. Thus it is important to identify chemical features which influence those
interactions. The chemical analysis of the coal tars is, however, particularly difficult
because of the high heteroatomicity and the wide range of the structures and functional
groups present.
Individual chemical species in coal tars have been identified using glass capillary
columns in gas chromatography (GC) [Borwitzky and Schomburg, 1979; Lee and Wright,
1980], gas chromatography -mass spectrometry (GC-MS) [Evans et al., 1985; Borwitzky
and Schomburg, 1979] or high-performance liquid chromatography (HPLC). These
techniques are always subject to questions about components that do not elute or vaporize,
or that decompose during analysis. Molecular masses much greater than 300 to 350 daltons
cannot readily be characterized by GC. Several 6-10 ring polycyclic aromatic hydrocarbons

7
have been identified in coal tars and coal tar pitches by HPLC [Fetzer and Kershaw, 1995],
and this suggests how high the molecular weight can be, thought as the previous section
suggests, the main problems might be encountered with a large amount of tar that falls
between 300 and 1000 daltons.
Coal tar average structural and functional group characterization are most commonly
based on elemental and spectroscopic analysis. Elemental analyses are used to determine
the relative abundance of nitrogen, carbon, hydrogen and oxygen in coal tar samples (see
Appendix A). Relatively little attention has been however paid to the variation of elemental
composition of tar fractions with molecular weight. Freihaut [1989] showed that as the
rank of the parent coal increases, the elemental composition of the primary tars becomes
more like that of the parent coal at any given extent of tar evolution. The tar is generally
richer in hydrogen than the parent coal. Three forms of hydrogen are typically
distinguished: aromatic, aliphatic, and hydroxyl. Three forms of carbon are normally
distinguished: aromatic, aliphatic and carbonyl, though more can be identified with
sensitive methods. Four forms of oxygen are usually cited: carbonyl, carboxyl, hydroxyl
and ether, though more can be identified by appropriate methods. The average functional
group concentrations can in principle be determined by Nuclear Magnetic Resonance
Spectroscopy (NMR) or by Fourier-Transform Infrared Spectroscopy. The question of the
quantitative reliability and accuracy is still under discussion and often these methods are
used for only relative characterization. 1H NMR has been most commonly used to
determine distribution of the various types of hydrogen in coal tars [Collin et al., 1980;
Cerny, 1991; Evans et al., 1985; Fynes et al., 1984]. This technique enables the
classification of hydrogen functional groups. 13C NMR is used to identify carbon types
and has been often used for the quantification of the structural parameters of average tar
molecule [Calkins et al., 1984; Evans et al., 1985 ; Fletcher et al., 1990]. FTIR has been
used mainly for the qualitative determination of functional groups in coal tars [Fynes et al.,
1984; Solomon et al., 1990; Cerny, 1991; Evans et al., 1985], though it has also been

8
used quantitatively for several functional groups in coal and there is no reason why it
cannot be used for the same purpose for tars.
Solomon and co-workers [Squire et al., 1986; Solomon et al., 1983; Solomon et al.,
1984; Solomon and Colket, 1978,1979] suggested from the similarities in elemental
composition, infrared spectra and NMR spectra that the primary tars are fragments of the
parent coals, at least in bituminous coal. But it was also noted that the infrared spectrum for
a lignite tar was significantly different from that of the parent coal, being richer in aliphatic
groups and poorer in oxygen functional groups [Solomon, 1981; Solomon et al., 1984;
Freihaut et al., 1989].
Lately UV-Fluorescence Spectroscopy (UV-F) has been applied to characterize the
relative concentrations and sizes of fused aromatics ring systems in coal tars [Li et al.,
1993, 1994]. Fluorescence spectroscopic properties of coal pyrolysis tars have been found
to correlate with the rank of the original coals. With increasing rank, UVF emission from
pyrolysis tars was increasingly observed to take place from progressively larger aromatic
ring systems.
Calkins [1984], using GC-MS, FTIR, 1H NMR and 13C NMR techniques, noted that
the concentration of polymethylene (series of n-olefin-paraffin pairs from C14 to C26 and
higher) increased with decreasing rank from about 4% for high volatile bituminous coals to
about 8% for lignites . The relative contribution of the polymethylenes to the tar therefore
increases with decreasing rank. Some tars were observed to have even higher
polymethylene contents, for example it was suggested by Calkins and Tyler [1984] that tar
produced at 600°C from Millmeran coal contains long chain olefins and paraffins to an
extent of 30 to 40%, and, from Texas lignite about 13% .
Fynes et al. [1984] noted for bituminous coal tars that their infra-red spectra showed
prominent phenolic OH bands, and the high ratio of the absorbance due to aliphatic and
aromatic C-H suggested aromatic ring multisubstitutions.

9
Coal nitrogen is almost entirely found in tightly bound rings such as pyridine and a
large fraction of the fuel bound nitrogen in the bituminous coals is volatilized as a
heteroatom in the tar component of the total volatiles [Solomon and Colket, 1981; Blair,
1976; Freihaut et al., 1989]. Sulfur appears in tars within rings as tightly bound ring sulfur
and in chains as weakly bound sulfur [Solomon et al., 1981].
Freihaut et al. [1993] observed the following changes in tar characteristics with rank:
the fuel nitrogen concentration of low rank primary coal tars is significantly lower than that
observed in parent coals on a daf basis; the chemical nature of the primary tars varies
systematically, for high vitrinite coals, from primarily polymethylene for low rank coals to
primarily condensed aromatics for high rank coals; the thermophysical (softening
temperatures) and volatility characteristics (transient vaporization temperatures and extent of
revaporization) vary systematically with the rank of the parent coal, with lower rank coals
producing primary tars having lower softening temperatures, lower vaporization
temperatures and greater volatility in general.
The tar released from coal will undergo further secondary reactions if the surrounding
gas temperature is high enough. These reactions can significantly change the tar
composition. Knowing how the kinetics of secondary reactions depend upon temperature
and time is important if the aim is to produce "primary" tars. The temperature at which such
reactions become important has been shown to be below 700°C by several investigators
using flash pyrolysis reactors.
Calkins et al. [1984] report that further pyrolysis, at 700 to 1100°C, of flash
pyrolysis tars produced at low temperatures (600°C) produces the hydrocarbon products
characteristic of those obtained during high temperature pyrolysis of coal itself. They also
demonstrated that tar cracking would be a major source of light hydrocarbon gas at
temperatures above 600°C in a fluidized bed reactor.
This is consistent with studies of Tyler [1979; 1980], and Nelson et al. [1988] which
showed that the total C1 to C3 hydrocarbon gas yield increases strongly over the

10
temperature range from 600 to 800°C due to the secondary cracking reactions of tar vapors.
As noted by Collin et al. [1980] marked changes occur in the composition of aliphatic
components of flash pyrolysis tar ( fluidized bed) above 600°C for Liddell tar, and 650 °C
for Millmeran and Loy Yang tars .
Nelson et al. [1988], investigating Millmeran subbituminous coal and Yallourn brown
coal tars, showed that at temperatures above 600°C, secondary reactions of tar occur and
yields of simple aromatics increase as the polymethylene products disappear. The alkyl
substituted aromatics and phenols decompose at temperatures above 700°C .
Freihaut [1993] showed that the gas phase, secondary reactions of primary tars which
produce HCN from ring nitrogen compounds initiate at gas temperatures of approximately
700°C.
Thus the chemical nature of the "primary tars" is only crudely determined by the
chemical characteristics of the parent coal. Many common "environmental" factors (e.g., tar
residence time) are difficult to control, and can influence the tar characteristics.

11
A.3. Vapor Pressures of Coal Tars.
Tars are complicated mixtures of coal fragments and have widely variable chemical
structure. As noted above, the chemical nature and composition of the tars vary
substantially with rank of the parent coal and operating conditions. There is little hope of
characterizing materials as complex as coal tars in very great detail. Therefore, there is
strong incentive to keep the amount of data needed for prediction of vapor pressures of
such mixtures to an absolute minimum.
Actual vapor pressure data on "primary" coal tar are unavailable. Pyrolysis modelers
have turned to simple correlative techniques based upon extrapolation of known vapor
pressure behavior of pure compounds or of coal liquid fractions, well beyond the
conditions at which data are available. Historically there has been much use of correlations
based upon molecular weight distributions alone, since molecular weight and temperature
are the two most important variables in determining vapor pressures. These correlations
have been of one particular form, obtained from the Clausius-Clapeyron equation,
assuming that the heat of vaporization is a function of the molecular weight and not a
function of temperature. The resulting form of correlation developed by Suuberg et al.
[1979] is :
P = αexp −βM γ
T
{A.1}
This is the simplest expression which appears to be consistent with the known
thermodynamics of the situation and is used because of the lack of detailed chemical
structure and vapor pressure data on coal tar. It should also be noted, consistent with this
approach, that it has been shown possible to correlate vapor pressure with molecular
weight of coal liquids using only boiling point information, at least up to about 400
molecular weight [Tsonopoulos et al., 1986].

12
Several workers have employed a correlation such as {A.1}, and values of the
constants they have obtained by fitting the data to literature data on various types of
aromatic hydrocarbons are shown below:
Table A.1 Vapor pressure correlations for coal pyrolysis tar.
α β γ
Suuberg et al.[1979] 1.23 x 10⁵ 236 0.654
Suuberg et al.[1985] 5765 255 0.586
Niksa [1988] 70.1 1.6 1.0
Niksa and Kerstein [1991] 3.0 x 10⁵ 200 0.6
Fletcher et al. [1992] 87060 299 0.59
Oh et al. [1989] 6.23 x 10⁵ 561 0.474
In this case, P is in atmospheres, T is in K, and M is in daltons. Comparisons of the
predictions of several of these models have been offered elsewhere [Fletcher et al., 1992].
Wide variations were noted in the predictions, and there is a concern about adequacy of
predictions of the vapor pressures under pyrolysis conditions. Nevertheless, it is clear that
there is a general convergence of most of the values of α, β, and γ in the literature. A
comparison of the predictions of boiling points with molecular weight is shown in Figure
A.1, for various models. For reference, the measured properties of anthracene are
indicated.
This type of correlation is used in network models of coal devolatilization to describe
the tar evaporation process. A review of such models is given elsewhere [Solomon et al.,
1992; Lee et al., 1994]. The models include the Functional Group - Depolymerization,
Vaporization, and Cross-linking (FG-DVC) model [Serio et al., 1987; Solomon et al.,
1988, 1990b, 1991], the FLASHCHAIN model [Niksa and Kerstein, 1987, 1991; Niksa,
1988, 1991a, 1991b], and the Chemical Percolation Devolatilization (CPD) model [Grant et
al., 1989; Fletcher et al., 1990, 1992].
13
In the FG-DVC model, the tar is "formed" from a metaplast fraction via finite rate
evaporation (controlled by the gas evolution rate), using the Unger-Suuberg correlation
[1985] and assuming Raoult's law applies. In the FLASHCHAIN and CPD models, the
tar evaporates assuming through an equilibrium flash distillation analogy and again the
validity of Raoult's law is assumed and combined with a correlation such as {A.1}.
There are two questions that need to be examined at this time. The first one is how
good are the predictions of the vapor pressures under pyrolysis conditions, the second is
how closely Raoult's law is followed in tars. First, a survey of methods for correlating
vapor pressures is presented. Then there is consideration of how well these techniques may
apply to coal tars.

14
A.4. Pure Compound Vapor Pressure Estimation.
A.4.1. Pure Component Vapor Pressures - Survey.
Vapor pressures can vary as much as 11 orders of magnitude over the coexistence
range, and generally no single technique is capable of measuring vapor pressure over the
entire range. For this reason it is useful to define several somewhat arbitrary pressure
ranges for purposes of discussion of different measurement techniques:
Table A.2. Vapor pressure ranges defind.
Pressure range torr kPa
High 103… 105 102… 104
Mid 101… 103 100… 102
Low 10-3… 101 10-4… 100
Very-low 10-7… 10-3 10-8… 10-4
Extensive experimental vapor pressure data have been accumulated and summarized in
the literature [e.g., Stephenson and Malanowski, 1987; Reid et al., 1987]. In fact, most of
the existing experimental data for high boiling organic compounds in the literature have
been measured in the mid range, of order from 10 to 103 torr and for basic hydrocarbons
in the low pressure range, of order 10-3 torr to 10 torr. The data on high molecular weight
aromatic compounds are relatively scarce, which does not allow us to describe these data
systematically. It is noteworthy that many of the published vapor pressure data appear to be
questionable, especially for very low vapor pressure organic compounds. As a rule, as
molecular weight increases, data become more scarce and vapor pressure data for
hydrocarbons containing heteroatoms are often unavailable for even low molecular weight
hydrocarbons.
Most of the experimental data in the literature on what might be considered model
compounds for coal tars, have been measured in the very low to low pressure range from
10-5 to 10 torr. Measurements of vapor pressures of high molecular weight materials
15
require high temperatures to obtain conveniently measurable pressures, but high
temperatures cannot be employed because of concerns about thermal decomposition during
measurement. Yet it is the high temperature range that is of most practical interest for coal
tars, since these materials are formed at high temperatures. A problem arises in
extrapolating existing experimental data out of the temperature range in which they were
obtained. The vapor pressure measurements are usually performed under sublimation
conditions at low temperatures, where the heat of vaporization is a very weak function of
temperature. Because the work is done at low and very low pressure conditions, the data
are often inaccurate due to experimental difficulties. This makes the prediction of changes
in vapor pressure with temperature in the high temperature range of interest very difficult.
Not only is a correction required to correct for evaporation as opposed to sublimation
(involving an enthalpy of fusion), but the enthalpy of evaporation itself is a decreasing
function of temperature reaching zero at the critical point.
For the above reasons, many efforts have been directed at the development of
improved correlative and predictive methods for extrapolating low pressure vapor pressures
into the mid pressure ranges. Most standard vapor pressure curve-fitting/extrapolation
techniques developed for the mid pressure range fail in the low pressure range and success
can be seen only with correlations for aliphatic and monocyclic aromatic species.
A.4.2. Vapor Pressure Extrapolation and Estimation Methods.
Numerous expressions proposed in the literature represent actual experimental data with
a high degree of accuracy, but they are often disappointing when used for extrapolation
purposes. The solid and liquid vapor pressure curves with temperature (or even reciprocal
of temperature) are highly nonlinear, and no method is currently available for calculating
from theory alone the magnitude of vapor pressure and its dependence on temperature.

16
Several empirical and semi-empirical equations are based in some way on integration
of the Clapeyron equation. These are used to fit experimental data and extrapolate out of the
experimental region. They have the general form [ Majer et al., 1989]:
ln P = iAi−1
Ti= k
m
∑ + lnA ln T + fA ƒ {A.3}
where the Am are adjustable parameters and ƒ is general function of the temperature
(and pressure), which is used only in a limited number of cases. Different forms of this
equation have been used for correlating vapor pressures, with the four- and five-parameter
forms the most common. Modifications of these vapor pressure equations are often also
given in the reduced form using critical properties as reducing parameters. Moreover, the
number of adjustable parameters has been reduced by introducing the normal boiling
temperature, melting temperature or the enthalpy of vaporization of interest. Due to the
logarithmic nature of most vapor pressure correlations, correlating parameters must be
known accurately to avoid large errors. The predictive ability of the equations based on the
Clapeyron equation is generally poor. These methods will be reviewed further in the next
subsection.
Many correlating and estimating equations, based on the classical theories of
corresponding of states, have been proposed for calculating the vapor pressure of a given
compound given a set of characteristic parameters. Vapor pressures for pure compounds
have been correlated using methods in which the temperature or the vapor pressure of one
compound is plotted against the corresponding function of a reference compound to obtain
a relationship that is linear over a wide temperature range, especially for a homologous
series; for example Cox's [1923] graphical correlation. The principle of corresponding
states posits that all substances obey the same equation of state expressed in terms of the
critical properties. In practice, another parameter, the acentric factor ω = ƒ (Tb, Tc, Pc),
was found to be required in order to accurately predict vapor pressures for a variety of
substances. The problem of finding such information was noted in the last section.

17
Consequently, estimation procedures for critical properties and boiling point are also
needed. In fact for many large aromatic species, these properties are not known accurately
if at all. When data are available, results obtained are satisfactory in the high pressure range
and usually are only roughly correct at medium and low pressures.
Comprehensive reviews of vapor pressure correlation/extrapolation/estimation methods
are given by Reid et al. [1987], Majer et al. [1989] and Malanowski et al. [1992].
A.4.3. Integrated Forms of Clausius-Clapeyron Equation.
When the vapor phase of a pure fluid is in equilibrium with its liquid phase, then the
chemical potential, temperature, and pressure in both phases are equal. The combined first-
second law of thermodynamics provides the constraint on the vapor pressure (P)
temperature (T) curve in the form of the differential Clapeyron equation. The differential
equation determining the equilibrium in a two phase one component system can be written:
dP
dT=
∆h
T∆v{A.4}
This equation relates the slope of the coexistence curves to the molar enthalpy of
vaporization (∆h) and the molar volume change (∆v) on vaporization. Many vapor pressure
correlations are based in some way on integration of the Clapeyron equation which
indicates that the vapor pressure is an exponential function of temperature, with
characteristic parameters for each individual compound. The basic approach involves the
integration of the differential Clapeyron equation after making assumptions about ∆h and
∆v that make the integration possible. The integrated equations are empirically modified on
the basis of actual vapor pressure data. Many empirical equations have been developed.

18
Only a small selection of equations has found universal acceptance. Here the most
frequently used equations for correlation of vapor pressure data are reviewed .
At temperatures at which the vapor pressure is not very high equation {A.4} can be
rearranged using the ideal gas law, or the actual compressibility of the vapor:
d lnP
dT=
∆h
RT2 , where ∆v =RT
P, or {A.5}
d lnP
dT=
∆h
RT2∆Z, where ∆v =
RT∆Z
P{A.6}
In both cases the assumption was made that the molar volume of the condensed phase
is negligible, in comparison with the molar vapor volume.
Equations {A.5} and {A.6} are referred to as the differential Clausius-Clapeyron
equations. The simplest solution to {A.5} can be obtained based upon the assumption that
∆h is independent of temperature and the result is sometimes called the Clausius-Clapeyron
equation:
lnP = −∆h
RT+ C {A.7}
This integrated form of the Clausius-Clapeyron equation is widely used for low and
very low vapor pressure data in the pressure region from 10-6 to 10-3 torr, where the
assumption of constant ∆h is fairly good. The assumption that ∆h is constant implies that
the vapor pressure curve in the ln P vs. 1/T plot is a straight line, and results in an over
estimation of vapor pressure in middle pressure ranges. In the literature, this equation has
quite often been rewritten in the equivalent form :
lnP = −∆h
RT+
∆s
R{A.8}
where ∆h and ∆s are enthalpy and entropy of sublimation (or vaporization),
respectively.

19
A simple three parameter modification of the Clausius-Clapeyron equation was
proposed by Antoine [1888], and is widely used to correlate vapor pressures accurately
over the range from 1 to 200 kPa :
ln P = A −B
C + T{A.9}
the third parameter C is introduced to take into account the variation of ∆h with
temperature and values of C are typically -20 to -50 K. Antoine constants are available in
literature for over 5,000 compounds [Reid et al., 1987; Boublik et al., 1987; Ohe, 1976;
Stephenson et al., 1987]. Although the extrapolation capabilities of the Antoine equation
are limited [King and Al-Najjar, 1974; Scott and Osborn, 1979; Majer et al., 1989], this
relationship appears to be routinely used in engineering calculations for extrapolating
beyond the range of experimental data. Strictly speaking, the Antoine equation can only be
used in the stated temperature limits. It is the most common, but not the best, three
parameters correlating equation.
Generally speaking, the enthalpy of vaporization is a function of temperature. To take
this into account several empirical and semi-empirical equations, based in some way on
integration of the Clapeyron equation, are available to fit experimental data and extrapolate
out of the experimental region.
The Rankine-Kirchhoff equation [Rankine, 1849; Kirchhoff, 1858] may be represented
as:
ln P = A - B / T - C lnT {A.10}
The equation was derived on the assumption that ∆H is a linear function of temperature.
MacKay et al.[1982] developed a predictive equation in the form of the Rankine
equation for low volatility liquid/solid hydrocarbons and halogenated hydrocarbons, that
boil above 100°C. The constants of this equation were correlated for 72 hydrocarbons and
halogenated hydrocarbons. Because the correlation was not extended to other species this

20
equation cannot be used for predicting the vapor pressures of O, N, and S containing
compounds.
This equation was modified by Yalkowsky et al. [1991] applying it to the same data set
developed by Mackay . These authors used recently proposed modifications of Walden's
Rule and Trouton's Rule for ∆Sm and ∆Sb, respectively, to account for two molecular
characteristics. One was the effect of high rotational symmetry (characterized by the
rotational symmetry number) and the other conformational flexibility. All numerical
coefficients were obtained from non vapor pressure data.
The Frost-Kalkwarf equation [1953] may be represented as:
ln P = A + B / T + C lnT + D P / T2 {A.11}
This equation was derived on the assumption that ∆h is a linear function of temperature
and ∆v can be estimated from the van der Waals equation of state. Parameters for many
compounds are given in the book by Reid et al. [1987] and in the paper by Halacher and
Brown [1975]. Rogalski et al. [1991] have reviewed several modified versions of this
equation and proposed an extended Forst-Kalkwarf equation for extrapolating/predicting
vapor pressures of over a very wide temperature range, using no adjustable parameters.
The Plank-Riedel equation [1948] is of a similar form:
ln P = A + B / T + C / lnT + D T6 {A.12}
Lee and Kesler [1975] proposed a generalized form of this equation, where the
parameters are established using the acentric factor and a universal relationship should be
valid for all nonpolar compounds.
A.4.4. Other Empirical Correlations.
In what follows, there is a progressively less strong tie to the integration of the
Clapeyron equation.

21
The Wagner equation [1973] is : lnP
Pc
=
Tc
TAi
i =1
m
∑ 1−T
Tc
α i
{A.13}
The exponents αi have fixed values that were determined by the methods of statistical
analysis [Wagner, 1973]. This equation has been considered efficient in the correlation of
vapor pressures, and it is the only equation able to accurately describe the data with few
constants at reduced temperatures between 0.5 and 1. The number of adjustable parameters
is usually four, but five were used for correlations of very accurate data over a wide
temperature range. The Wagner equations has become very popular for correlating vapor
pressures up to the critical temperature [Ruzicka and Majer, 1996]. Several articles present
parameters for certain groups of substances [McGarry, 1983; Reid et al., 1987; Ambrose
and Walton, 1989].
The Lee and Kesler [1975] method is based on following relation (Pitzer expansion,
1955):
lnP r = f 0(T r ) +ω f1 (Tr ) and ω = ƒ(Tb; Tc ;Pc ) {A.14}
A fluid's properties are obtained by interpolating between the properties of a simple fluid
(ω=0) and a reference fluid ( octane with ω=0.3978). The equation is recommended for the
prediction of vapor pressures at reduced temperatures of 0.8 and lower.
Gomez -Nito and Thodos [1977, 1978] proposed vapor pressure estimation techniques
for three classes of compounds: nonpolar, polar and hydrogen-bonded. The equation is
recommended for the prediction of vapor pressures at reduced temperatures between 0.5
and 1.
Ambrose and Patel [1984] proposed the use of two real fluids with well-correlated vapor
pressures, this leads to:
lnP r = lnP r1 + (lnP r2 − ln Pr1)ω −ω 1
ω2 −ω 1
{A.15}
The equation is recommended for the prediction of vapor pressures at reduced
temperatures between 0.5 and 1 is suitable for polar compounds.
22
Smith et al. [1976] correlated vapor pressure data of high boiling hydrocarbons in the
region from 10 to 1950 torr. The SWAP (Smith-Winnik-Abrams-Prausnitz) correlation
was based on the relation
lnP r = A +B
Tr
+C
Tr2 {A.16}
and on the theory of polysegmented molecules [Prigogine, 1957]. This correlation is
reliable to ±10% and can be extrapolated with good results to lower pressures. The only
input data required are the boiling point at 10 mm Hg ( vapor pressure) and approximate
characterization of molecular structure: the fractional aromaticity, naphthenicity, branching,
and heteroatomicity. Edwards et al. [1981] extended SWAP to include hydrocarbon
derivatives containing either nitrogen or sulfur as heteroatoms.
A.4.5. Group-Contribution Methods.
A popular approach is to define a molecular property as consisting of the contributions
of the various component groups of the molecule. When no vapor pressure data exist, but
the molecular structure of a component is known, the group contribution methods can be
used to provide an estimate.
Macknick and Prausnitz [1979] presented a group-contribution method for direct
determination of two adjustable constants in the AMP equation [Moelwyn-Hughes, 1961;
Abrams et al., 1974] to estimate vapor pressures (in the range 10 to 1500 torr) and
enthalpies of vaporization for heavy hydrocarbons. Edwards and Prausnitz [1981]
extended the group parameters to nitrogen and sulfur containing groups, Ruzicka [1983] to
naphthenic 5-membered rings and a condensed naphthenic groups, and Burkhard [1985]
to aromatic halogen groups.

23
Jensen et al. [1981] developed a group-contribution method, in part based on the
UNIFAC model for vapor liquid equilibria [Fredenslund and Rasmussen, 1979;
Fredenslund et al., 1975, 1977], for the prediction of pure-component vapor pressures in
the range 10 to 2000 torr for polar and nonpolar compounds with molecular weights below
500. The model was applied to different hydrocarbons, alcohols, ketones, organic acids,
and cloroalkanes. Yair and Fredenslund 1983 extended this correlation to include amines,
pyridines, nitrites, ethers, esters, and ketones. Chandar and Singh [1985] extended it to
include sulfur - and additional nitrogen-containing heavy hydrocarbons.
Skjold-Jørgensen [1984] developed a new group contribution equation of state, GC-
EOS, especially designed to represent phase equilibria. Skjold-Jørgensen [1988] revised
and extended the parameter tables for GC-EOS, so pure-component vapor pressures as
well as critical temperatures and pressures are reliably predicted. The data base used to
establish the parameter tables contains pure component vapor pressures in the pressure
range 15 torr to the critical pressure.
Hoshino et al. [1985] developed a group-contribution method for prediction of vapor
pressures for high molecular weight hydrocarbons based on substituted benzenes. In this
work the three adjustable parameters in the Antoine equation were determined from boiling
temperatures at three specified pressures (10, 760 and 1500 torr). The group-contribution
method is used to calculate the boiling points of substituted benzenes at specific pressures.
This method is suggested for use in the pressure range 10 to 1500 torr.
Tu [1994] developed a group-contribution method for predicting the vapor pressures of
organic liquids based on the integrated Clausius-Clapeyron equation in the form
lnP = A +P
T− ClnT − DT {A.17}
The parameters for 42 organic groups were derived from 5359 experimental vapor
pressure data on 342 organic compounds. This method may be used for both nonpolar and
polar compounds and yields acceptable prediction up to a pressure of 60000 torr. The
24
model was applied to alkanes, alkenes, alkynes, cyclones, aromatics, alcohols, aldehydes,
acids, ketones, esters, ethers, amines, nitrites, thiols and chlorides.
Although numerous vapor pressure curve-fitting/extrapolation/prediction techniques
could be applicable to high molecular weight PAH, the correlations presented above were
developed using data on low molecular weight aromatic and nonaromatic species with no
strong polar groups present. They are thus often inaccurate for describing the entire vapor
pressure curve even for monocyclic aromatic spieces.
A.5. Models of Vapor Pressure of Coal Liquids.
There have been some efforts made at characterizing vapor pressures of coal liquids, as
opposed to coal tars [Tsonopoulos et al., 1986]. For the most part, that work was
concerned with relatively lighter compounds than are interest in coal pyrolysis (typically,
four fused aromatic rings or fewer, with molecular weights of about 300 or less). Primary
coal tar exhibits molecular weights that can be well over 1000, though centered between
200 and 500 daltons. In addition, there is a tendency in liquefaction to reduce the
heteroatom content of coal liquids, as compared to coal tars. The predictive methods seen to
work reasonably well with hydrocarbon models of coal liquids were often noted to work
more poorly in heteroatomic systems [Tsonopoulos et al., 1986]. The specific
intermolecular interactions prevalent in coal derived liquids make these simple approaches
inadequate.
Petroleum engineering computations require a simple and reliable correlation of vapor
pressure/temperature relations whose parameters can be derived from minimum information
on the oil fractions. These methods have been extended to coal liquids. Several methods for
correlating vapor pressures of coal liquids have been summarized by Tsonopoulos et

25
al.[1986]. The methods assume that the cut is narrow, less than 50°F from initial to final
boiling points. It has also been noted that the successful correlations used for many years in
the petroleum industry tend to be difficult to apply to coal liquids because of their highly
aromatic nature.
The parameter used as index of this nature is the Watson characterization factor, Kw
K w =Tb °R( )[ ]1/3
S{A.2}
where Tb is the normal boiling point in degrees Rankine and S the specific gravity at
60/60 °F. Heavy paraffins have Kw's in excess of 13, crude oil fractions have a value of
about 12, coal liquids have fractions with Kw's less than 10 (e.g., tetralin has a Kw of
9.78, anthracene 9.21).
The vapor pressure of petroleum fractions have been reliably predicted with the
Maxwell-Bonnell [1957] correlation, which only requires two input parameters, Tb and
Kw. This correlation is principally designed for converting data on subatmospheric boiling
points to normal boiling points, using n-hexane as a reference material. The Maxwell-
Bonnell (MB) method is based on a formula, though it is also well known as a graphical
procedure. This correlation can be used without correction when Kw =12. For
hydrocarbons with Kw substantially different from 12.0 a correction is needed to the
boiling point. The modified Maxwell-Bonnell correlation has been applied to coal liquids
by Tsonopoulos et al. [1986], Zudkevitch et al. [1983], Wilson [1981], and there has been
an attempt to apply it to tars by Zudkevitch et al. [1983].
Other methods, such as the Lee-Kesler correlation [Lee and Kesler 1980] or Reidel
equation [Reidel, 1954] have been explored and discussed in the context of application to
coal liquids [Tsonopoulos et al., 1986]. The Reidel equation can be used for fractions if
their critical temperature (Tc), critical pressure (Pc) and acentric factor (ω) are known. Tc
and Pc must be also known (or estimated) to use the modified Reidel equation, which is at
its best between Tb and Tc. Application of other methods, such as a modified Benedict-

26
Webb-Rubin equation [Brule et al., 1982] also rely on having at least fraction boiling
points and specific gravity as input parameters [Gray et al., 1985]. In their approach, Brule
and co-workers [1982] replaced the acentric factor with a third corresponding state
parameter.
The input information of these equations is not particularly useful for present
applications to coal tars because data on Kw, subatmospheric boiling points, and critical
properties are not yet readily available. The weakness of the modified MB and Lee-Kesler
correlations comes in handling heteroatom-containing compounds [Tsonopoulos et al.,
1986]. These equations are not applicable to coal tars without considerably more a priori
knowledge of the properties of tars than exists now.
These problems are avoided by the use of techniques developed by Prausnitz and
coworkers. The SWAP method incorporates limited information on molecular structure into
a vapor pressure correlation [Edwards et al., 1981; Smith et al., 1976]. From information
on the molecular weight, the aromaticity, and heteroatom content, it is possible to estimate
the vapor pressure of nitrogen and sulfur containing hydrocarbons to within about 20%.
The application of the SWAP method to coal tars is considerably more involved than were
the earlier correlations presented, because of the need for molecular structure information.
In addition to the SWAP method, there have been developed simultaneously group
contribution methods based on detailed knowledge of all functional groups in the molecules
[Edwards and Prausnitz, 1981; Jensen et al., 1981]. In comparison to SWAP, these
methods are less likely to be useful in application of coal tars, since the detailed structures
of the coal tars are not likely to be easily determined. The group contribution methods have
been applied to the estimation of vapor pressures of low molecular weight liquefaction
products [Hartounian and Allen ,1989; Vajdi and Allen ,1989].
The above methods are being developed with an eye towards the important effect that
strongly interacting groups, including especially hydroxyl groups can have. An approach
based on another recent group contribution method [Slejold-Jorgenson, 1988] proved more

27
successful [Vajdi and Allen, 1989] , but again was tested only against coal liquids that are
of considerably lower molecular weight than the tars that are of interest here. Still, the
success of this attempt gives hope of applicability of similar methods to the higher
molecular weight materials in the future.
It may, consequently, be concluded that at present there exist no reliable or at least
demonstrated correlations for estimating vapor pressures of coal tar components. Apart
from the rather simple correlation of the form developed by Suuberg et al. [1979] and
extended by others, attempts to develop better correlations will generally be limited by a
lack of detailed characterization information on these complicated mixtures. Lack of actual
vapor pressure data on coal related materials at high temperatures has led to widespread use
of correlations derived from data on low molecular weight species being extrapolated well
beyond safe limits.

28
4
4.5
5
5.5
6
6.5
7
ln M
300 400 500 600 700 800 900 1000 1100
Tb [K]
Figure A.1. Predicted variation of boiling point with molecular weight, for low molecular weight aromatics.
Tsonopoulos et al. [1986]Suuberg et al. [1985]Niksa and Kerstein [1991]Fletcher et al. [1992]Oh et al. [1989]anthracene

29
Chapter B. Experimental Techniques.
This chapter is divided into two parts. The first describes the preparation and
characterization of coal tars. The second describes the methods by which vapor pressures
of such materials can be measured.
B.1. General Experimental Procedure for Coal Tar Preparation and
Characterization.
The coal tars were produced using rapid pyrolysis techniques (employing reactors and
coals described below) and collected by washing the reactor with inhibitor-free THF. To
prepare dry tars for testing, the solvent was evaporated from the collected tar solutions in a
vacuum oven at 45°C. It is known that such vacuum drying will result in loss of some light
material, especially that with a volatility greater than that of anthracene. So the starting tars
can be defined, operationally, as a collection of room temperature condensables, with a
molecular weight generally greater than 150 daltons. The overall approach for preparing
and examining the tars is shown in Figure B.1.
The tars were, in some cases, first fractionated chromatographically, using a
preparative scale gel-permeation chromatography (GPC) column. This fractionation crudely
divides the tar into molecular weight intervals. Vapor pressure measurements have been
made using the "non-isothermal" Knudsen effusion technique on these fractions, as well as
on the whole, unfractionated tars.
Analyses of the different tar fractions were performed using vapor phase osmometry
(VPO) and analytical mode gel-permeation chromatography. The latter provides the
number average molecular weight of a fraction, and the former allows a crude
characterization of chemical structure. An elemental analyzer was used to determine the

30
elemental compositions of the fractions. Differential Scanning Calorimetry (DSC) was used
to examine the thermal behavior of the fractions.
B.2. Tar Preparation Techniques.
B.2.1. The Selection of the Solvent for Tar Collection, Fractionation
and Analysis.
The selection of the solvent was based on a combination of three criteria: high solubility
of the tars in the solvent, suitability for the liquid chromatographic and vapor phase
osmometric work, and ability to evaporate it from coal tars. Pyridine and THF are on one
basis approximately equally effective solvents for the coal tars; both are able to dissolve
better than 97% by the mass of dry tar [Unger and Suuberg, 1984]. THF was employed
instead of pyridine in the collection of tars in the preparative scale fractionation only
because of the difficulty in disengaging pyridine from coal tars. Pyridine is, however,
known to be a superior solvent for coal tars on the basis of GPC and VPO work, and
would eliminate suspected association artifacts thought to occur in THF. These might give
an incorrect impression of the molecular weight distribution [Oh et al., 1989; Solomon et
al., 1992]. Thus pyridine was used in the analytical GPC and VPO characterization.
B.2.2. Tar Production Techniques.
As the project emphasizes study of primary tars (i.e., tars that have not been subject to
extensive secondary reactions) the tar preparation systems have been selected to minimize
the residence times of evolved volatiles in hot regions of the reactors and to avoid contact
with oxidizing gases. It is difficult to produce large amounts of tar without creating the
31
possibility for secondary reactions of the tar [Solomon et al., 1992]. This is because the
reactor systems must be chosen to provide a short residence time for the tars, and thus must
be of limited dimensions. A review and the comprehensive description of a variety reactors
which have been employed in pyrolysis experiments has been given elsewhere [Solomon et
al., 1992]. Three systems have been used in this study: a wire mesh reactor, a fluidized bed
reactor and a tubular reactor.
The wire mesh reactor (or heated grid reactor) is a rapid pyrolysis apparatus which has
been described in detail elsewhere [Suuberg et al., 1978]. Typically, a pulverized coal
sample was pyrolysed in an electrically heated wire mesh at a rate of 3000 °C/min to a
temperature of 700°C, at which it was held for 3 seconds before cooling. The disadvantage
of this method is a low tar productivity per run; producing large quantities of tar takes days
because of the small coal loadings (100 mg) in each run. This method was used to prepare
tar at high heating rate conditions, not readily achieved in the other devices. The other two
systems could be used to pyrolyze larger masses of coal per run.
The fluidized bed technique involves pyrolysis of coal particles fluidized by an inert
gas fed at the bottom of a 2 inch (5 cm) bed. The volatiles are carried away by this inert
purge gas and tar is collected downstream of the hot zone. The temperature of the fluidized
bed was maintained at 500°C. Collection and handling of the tars from this system are
identical to the procedures followed after tar production in the heated wire mesh system.
Disadvantages of this experimental method are that particle residence time and temperature
history are unknown, particularly under conditions in which particles can be eluted from
the bed. Also, there is the potential for significant secondary reactions of the tar, before it
is eluted from the bed. The residence time of the gas in the bed may be estimated as 7
seconds. Another operational disadvantage of this technique is that this reactor needs
millimeter size particles, which are not conveniently available when working with the well
characterized Argonne Premium Coal samples (which come in <100 mesh and <20 mesh
sizes).

32
Using the tubular reactor, it is possible to pyrolyze larger masses of coal than in the
heated wire mesh reactor - several grams, as compared to one hundred mg per experiment.
Also, particle size is not a major concern. The coal was contained in a wire mesh holder
and then pushed suddenly into the heated zone of an oven. This was done to maximize the
yield and to avoid secondary reactions, while at the same time allowing for moderate
heating rates. The particle temperature was measured directly by a chromel-alumel
thermocouple connected to the wire mesh holder. The volatiles, in this configuration, were
swept away by an inert purge gas, and tar was collected on the cooled walls of a small
tube, downstream of the hot zone.
The tube furnace was designed to keep secondary reactions to a minimum. An inert gas
purge flow was 150 ml/min measured at 25°C, which corresponded to an average tar
residence time of around 5 sec in the hot zone of the reactor. The reactor wall temperature
was kept approximately at 700°C, leading to an ambient inert gas temperature of
approximately 680 °C and a final particle temperature 670°C. The average particle heating
rate from room temperature to 500°C was 15°C/sec and then the particle temperature
reached 670°C in two minutes. The total reaction time was 3 minutes, after which the char
was pulled out from heated zone. Again, handling procedures for the tars from this system
were identical to those used in the other two cases.
B.2.3. Tar Fractionation Techniques.
Two different methods have been applied. The first one involved classical gel
permeation chromatography (GPC), and the second, vacuum sublimation.
Gel permeation chromatography (GPC), also referred to as size exclusion
chromatography (SEC) or gel filtration (GF), is a chromatographic technique in which
molecules are separated on the basis of their ability to penetrate a porous gel. Larger
molecules travel through the column at the same speed as the mobile phase, smaller

33
molecules are held back to an extent depending on their molecular size and the distribution
of pore sizes within the gel [Evans et al., 1985].
The vacuum sublimation technique is based directly upon the difference in vapor
pressures of tar components, leading to differences in ability to vaporize at different
temperatures. Preliminary experiments showed that the separation by vacuum sublimation
was less satisfactory and also the thermal decomposition of the tar was a concern when
using this technique.
Thus, the tars were mainly fractionated using GPC in preparative mode, i.e., using
large sample volumes. Two 25 cm columns were used in series, for this purpose. The first
column was packed with µ-Styragel (styrene-divinylbenzene polymer) beads with a
nominal pore size of 100 Å, and the pore size of the second column was 500 Å. The
solvent was inhibitor free tetrahydrofuran (THF). The flowrate was typically 1 ml/min. The
column operated at room temperature. Approximately 0.5 cc of solution containing around
500 mg/cc of tar was injected in each run.
The fractionations were based on an assumption that different molecular weight/size
fractions elute at different elution times. Generally speaking, between 10 to 20 minutes
were allowed for elution of each fraction. Six fractions were collected from the gel
permeation chromatograph following UV detection at a wavelength of 283 nm. A typical
preparative scale GPC chromatogram is shown in Figure B.2, along with the dividing lines
between fractions. As may be noted, the earlier and later fractions are much more dilute
than the middle fractions. Unger and Suuberg [1984] have verified the fact that all of the
injected tar can elute from the µ-Styragel column when THF was used as solvent. Since
around 30 mg of each fraction was needed for vapor pressure testing, three GPC runs were
generally required to obtain enough material in each elution interval. After fractionation, the
solvent was evaporated in a vacuum oven for approximately 24 hours, 12 hours at room
temperature and room pressure, and then 12 hours at 50°C in vacuum.

34
B.3. Tar Characterization Techniques.
The characterization information of interest here is only that ultimately needed for the
prediction of the vapor pressure and heat of vaporization. Thus very detailed chemical
characterizations were not performed. Correlations based upon large amounts of
characterization information may be fundamentally more appealing, but much more
difficult to use.
B.3.1. Vapor Phase Osmometry.
A Knauer model 11 Vapor Phase Osmometer was used determine the number average
molecular weights of tar fractions subjected to analytical GPC. All measurements were
made at 90°C. Calibration was accomplished using pyrene (MW 202) as the standard and
the accuracy of the VPO measurement was checked with 3-hydroxy-1H-phenalen-1-one
(MW 196.21) and phenanthridine (MW 179) to ascertain the influence of heteroatoms on
the calibration. Figure B.3 shows a comparison of the calibration curves based on the
results for these three compounds. The slope of voltage vs. concentration appears to be
slightly lower for compounds which are able to form stronger hydrogen bonds with
pyridine. The results of phenanthridine were chosen to calibrate the VPO for work with a
coal tar. Aspects of experimental procedure and construction of calibration curves are
discussed elsewhere [Chung et al., 1979].
B.3.2. GPC in Analytical Mode.
Although not originally intended for this purpose, the analytical GPC allows to
characterize tars in terms of compound classes. The analytical GPC characterization was
performed using a Phenogel column of 300 mm length and 7.8 mm diameter, packed with

35
10 to 100 Å Phenogel. Pyridine was used as a solvent in this case. The change of solvent
from THF to pyridine was dictated by the fact that pyridine is known to be a superior
solvent for coal tars, and would eliminate suspected association artifacts in the THF. These
might give an incorrect impression of the molecular weight distribution. Pyridine was not
employed in the preparative scale fractionation only because of the difficulty in disengaging
pyridine from coal tars (drying the tars prior to vapor pressure measurement is of course a
key requirement for getting good vapor pressure data). The column was operated at 30 °C,
and the solvent flowrate was 0.3 ml/min. Samples were prepared by dissolving a small
amount of each tar fraction in pyridine. The sample injection volume was 20 µl of a 10
mg/ml solution. Detection of peaks was accomplished using a UV detector at a wavelength
of 305 nm (UV cutoff was found to be slightly below 305 nm). The wavelength of 305 nm
was selected to maximize the overall response factor, based upon measured signal strength
as a function of wavelength. This is shown in Figure B.4. Figure B.4 shows that the ratios
of different elution time fractions are not particularly sensitive to the choice of the
wavelength, even though the absolute value of signal is quite sensitive.
B.3.3. Differential Scanning Calorimetry.
The Differential Scanning Calorimeter was used to study the thermal behavior of the
coal tars in the temperature region of interest. The DSC would reveal where any thermally
significant reaction events took place, so that the temperatures of vapor pressure
measurement could be kept below such temperatures. The approximate values of the latent
heat of fusion for model compounds have also been estimated using this technique.
The DSC device was a TA Instruments system 2910. The DSC system was calibrated
with indium, zinc and water samples. Generally, between 5 and 10 mg of sample was used
in each experiment. Heating rates were chosen between 0.5 °C/min and 60 °C/min, the

36
most common being 5 °C/min. Experiments were performed in the presence of a flowing
inert purge gas, helium, at a flowrate of 50 ml/min through the sample cell.
B.3.4. Elemental Analysis.
Elemental analysis was used to determine the elemental composition of the tars and
fractions. The elemental analyzer was the Perkin Elmer model 240B. The system was
calibrated using C25H16N2O5 (benzophenone tetracarboxylic dianhydride 1,4 phenyl
diisocyanate, elemental mass fractions C=0.7075, H=0.0377, N=0.0660 and O=0.1887)
and checked by benz[gi]isoquinoline-5,10-dione, C13H14NO2. These measurements are
based on complete conversion of the small quantity of sample (1 to 2 mg) by combustion
to N2, CO2 and H2O. The amounts of these gases formed were measured by a thermal
conductivity detector which outputs corresponding signals for nitrogen, carbon, and
hydrogen respectively following selective sorption of H20 and CO2 at different stages of
analysis. Oxygen and sulfur were determined by the difference required to obtain mass
closure.
37
B.4. Vapor Pressure Measurements.
Most ordinary devices cannot be applied to measure the vapor pressures of the primary
tars because the temperatures at which they would have to be held in order to generate
accurately measurable pressures are above the temperatures of decomposition of these
materials. Thus, an acceptable instrument should be able to directly or indirectly determine
the vapor pressures from experiments in which the samples are rapidly evaporated at low
temperatures, so as to minimize thermal cracking or secondary reactions. The need to
avoid pyrolytic reactions during the measurements has dictated that temperatures be kept
below about 250 °C and the technique must be employed for only short times at
temperatures close to 250°C. In fact, it appeared as though even lower temperatures might
be called for in some cases. This will be discussed below.
B.4.1. Selection of the Technique.
The most accurate data reported in the mid pressure range were obtained by direct
static techniques, where the equilibrium pressure exerted by liquid or solid at constant
temperature is measured directly with a pressure gauge. This type of measurement of vapor
pressures is usually used a over wide pressure ranges down to 1 torr. However, Sasse et
al. [1988; 1989] have measured low vapor pressures of organic compounds down to 10-3
torr using this method. There are however no direct vapor pressure measurement
techniques available below 10-3 torr.
Several techniques have been used to study low and very low vapor pressures of pure
organic compounds. Reviews of low and very low vapor pressure measurement techniques
are given elsewhere [Nesmeyanov, 1963; Ambrose, 1975].
Of the different experimental techniques used to measure low vapor pressures, two
have been considered here: transpiration and Knudsen effusion. These indirect dynamic

38
techniques have been widely used in the region from 10-1 to 10-6 torr. Both methods are
standard methods, that are accepted by the Organization of Economic Cooperation and
Development as pure compound vapor pressure measurement techniques.
B.4.1.1. The Transpiration Technique.
In the transpiration technique (also referred to as the gas saturation technique) a flow of
insoluble and inert gas is passed in close proximity to the sample to be vaporized by either
dispersing it through or passing it over the sample. The carrier gas can be passed through a
volatile solid as well as a liquid. Vapor pressure is calculated from measured amount of
material transported by a known amount of carrier gas by using the equation:
P isat =
P ⋅ n i
n i + n c( ) ≈P ⋅ n i
n c
, as nc>>ni {B.1}
where ni is the molar flowrate of the vaporizing material, nc is the molar flowrate of
carrier gas, and P atmospheric pressure.
The concentration of organic material in the carrier flow has been determined by
various methods including an infrared analyzer, UV spectroscopy, gas chromatography,
liquid chromatography or by use of an electrobalance. The method adopted here involved
measuring the flame ionization detector (FID) signal or response (in mV), and calculating
concentrations from a ratio of this signal to a known calibration concentration signal. The
flame ionization detector was selected for this purpose because of its high sensitivity to
hydrocarbons and its linear concentration response over a very large range of
concentrations. The calibration of the FID involved introducing a known amount of a
calibration hydrocarbon into the detector system, and measuring the response. The equation
for determining vapor pressure can be written in the convenient form:
P = Constant(FID Response)∗(experimental temperature)
Carrier Flowrate {B.2}

39
The temperature and the flowrate of the carrier gas are experimental variables, which
can be controlled with high accuracy. The constant in this equation includes pressure and
temperature corrections for the carrier gas flowrate, the molar volume, the barometric
pressure, and the detector calibration in mV per mass or mole of carbon per time.
A problem arose in using this technique because the system had to achieve equilibrium
with a small amount of material. The preparation of large quantities of well-characterized
tar was difficult. The carrier gas can seldom be saturated with vapor in a simple pass-
through cell. This is true even at low flow rates and with an extra-fine gas dispersion
apparatus.
This was overcome by developing two different saturation devices. The first approach
to achieving saturation is dictated by the fact that true saturation can most likely be assured
if an initially partially saturated gas stream is forced to recondense. Thus an equilibrium
concentration is established in a section of the saturation apparatus in which a somewhat
reduced temperature zone is created, to force a partial condensation. When the vapor-gas
mixture comes into contact with the cooled surface in this zone, condensation occurs, and
an equilibrium is established between liquid on the surface and vapor. A temperature
difference from 5 to 10 degrees between the initial saturator and the lower, constant
temperature region which achieves true saturation, appears to be sufficient to provide an
equilibrium saturation at the exit, based upon our own measurements. This technique is
especially suitable for pure compounds. In the case of mixtures, however, changes of
composition can occur during the condensation.
In the second saturation technique the carrier gas is passed through the sample, which
is supported on a non-absorbent material such as a glass wool, inside a tube of 3 mm
diameter and 10 cm length. The pressure drop was unimportant. This system gives good
contact between the gas stream and the material, and ensures that the gas stream is almost
completely saturated with vapor, while allowing a very small sample to be used. Preference

40
for this technique arises from a consideration of the method of separation of the coal tars.
In this method, tars were already dissolved in THF. They could be easily coated in a fine
layer onto a high surface area substrate (such as glass wool). The tar for which the vapor
pressure is to be determined is first dissolved in a volatile solvent. It is then transferred into
the saturator column after which the solvent is removed by evaporation in vacuum oven at
room temperature.
The main problem occurred in analyzing actual tars. Consider an experiment in which
5 mg of any compound with molecular weight 300 is kept at a temperature at which the
vapor pressure is 10-3 torr, under a 20 ml/min inert gas flow. For example, coronene (MW
300) generates such a vapor pressure at 200°C. To evaporate all this material under these
conditions would take 10 days. Thus to analyze a full tar sample requires days, assuming
that 5 to 10 mg of tar sample is necessary in order to reach saturation, and a two hour
experiment is performed at each selected temperature. On the other hand, tars are
complicated mixtures of thousands compounds with very different volatilities, and
according to Raoult's law, the FID signal would be mainly determined by the more volatile
compounds present at any time. To explore the full mixture requires patiently evaporating
all of it, while at the same time worrying about loss of saturation when the mass of tar
becomes low.
An additional disadvantage of this technique was the large uncertainty in calculating the
vapor pressure and the mass loss from the FID signal. This is because of the highly
heteroatomic nature of tars. Various features of the chemical structure (such as
heteroatoms) influence the response of the FID, thus it is difficult to calibrate the FID for a
coal tar, i.e., to find suitable calibration standard compound. Coal tar itself cannot be used,
because of condensation type reactions and its low volatility. Moreover, it can be crudely
estimated from the effusion results that only around 70% of HV bituminous tar would be
GC volatile. Therefore the vapor pressure experiments of this study were carried out using
the Knudsen effusion technique.
41
B.4.1.2. Knudsen Effusion Technique - Overview.
Effusion is the phenomenon in which molecules escape from a vessel through a small
opening, without disturbing the equilibrium distribution within the vessel. Knudsen
effusion involves measurement of the rate of loss of molecules of the evaporating
substance, leaving the opening of the effusion cell under molecular flow conditions. The
simplified equation for determining vapor pressure can be written as:
P = Cdωdt
{B.3}
in which dω/dt represent the mass loss per unit time from an orifice of an effusion cell
under molecular flow conditions, and the constant C, among the other things, contains the
orifice area, molecular weight, the temperature of effusing species and other correction
factors. The principal application of this method has been for determining the vapor
pressures of metals. It has, however, proven equally effective for obtaining the vapor
pressures of organic crystals and compounds.
Reliable measurements using the Knudsen effusion method require particular attention
to the problem of the measuring and controlling the temperature of the Knudsen cell within
the vacuum enclosure. Most discrepancies between the results of various workers using
this or related vacuum techniques are the result of insufficient attention to this problem. As
the sample must receive heat purely by radiation (since the cell is operated in a high
vacuum) isothermal steps as long as 5-10 hours duration are used for equilibration at any
new temperature. The determination of a vapor pressure curve via the conventional
"isothermal" mode of the Knudsen effusion technique requires days. During this time,
there may be more than a 20% mass loss from the sample ( up to 50% ). This is an
important consideration in work with mixtures, in which the condensed phase composition
can be significantly changed by high extents of mass loss.

42
To address this problem we improved the traditional "isothermal" mode of the Knudsen
effusion technique, so that the determination of the full vapor pressure curve requires from
5 to 10 hours. The most important advance was development of a new continuous non-
isothermal technique. This new modification of the Knudsen effusion technique provides
vapor pressure information while temperature is continuously varied and is faster than the
"isothermal" mode. Thus the sample loss during an experiment may be kept quite low.

43
B.4.2. Knudsen Effusion Method - Basic Aspects.
In this study, the vapor pressures of primary coal tars have been examined using the
Knudsen Effusion method, modified for application to mixtures containing components
with a wide range of volatilities. The Knudsen effusion technique was selected because of
the thermally labile nature of the primary tars (those that have not undergone secondary
cracking). The technique permits measurements of vapor pressure at quite low
temperatures.
B.4.2.1. The Theory of the Knudsen Effusion Method.
The basic theory of the effusion method has been often reviewed in the literature
[Knudsen, 1909a; Knudsen 1909b; Hollahan, 1962; Dushman, 1962; Nesmeyanov,
1963]. The method is actually based upon the kinetic theory of gases. From these classical
results, Knudsen derived an expression for the slow isothermal flow out of a cell with a
small hole in it. According to Knudsen [1909a] the vapor pressure of a material in the cell
can be calculated from:
P =ω
tAo
2πRT
M{B.4}
The above result is called the ideal Knudsen equation, in which P is the vapor pressure, ω
is the weight loss during the effusion time interval, A0 is the orifice area, M is the
molecular weight in vapor phase, t is the effusion time , and T is the absolute temperature.
It is assumed when applying the basic effusion equation {B.4} to the effusion process
that:
• Thermal equilibrium exists throughout the cell.
• Chemical equilibrium obtains with in the cell. This includes assuming a uniform
composition in each phase, unit evaporation/condensation coefficients, and that the

44
equilibrium vapor pressure of the effusing species exists within the cell (This will generally
be true if for r << A; r is the orifice radius and A is the effective evaporation area ).
• The orifice walls do not intercept and return into the cell an appreciable fraction of
molecular current entering the hole. This equation is strictly applicable only if the thickness
of the wall, in which the orifice of area A0= πr2 is located, is vanishingly small compared
with the hole’s radius r. This means that the orifice should be located in an infinitely thin
wall or be cut such that the edge is exceedingly sharp (knife edge orifice).
• There is no back flux into the orifice exit from the surroundings - no molecules return
once they have passed through the orifice.
• Free molecular flow exists in the vapor. This means that the number of intermolecular
collisions in the vapor phase, occurring within the orifice, is negligible. This will be true if
the molecular mean free path in the vapor is long compared to the orifice diameter.
Knudsen’s criterion [Dushman, 1962] is adopted to evaluate this, that is, molecular flow
(collision free) occurs when λ ≥ D, where λ is the mean free path of vapor molecules
within the cell and D is the diameter of the orifice.
The equation (B.4) is the basic working equation for the technique. It has, however,
been modified by a number of authors, for various experimental conditions, to obtain a true
saturated vapor pressure from Knudsen effusion data. The corrections to the theory which
have been studied have included the effects of the shape of the orifice and cell, nonunit
evaporation coefficients, effects due to long mean free path (wall collisions more important
than gas phase collisions), effects due to short mean free paths as the flow goes from free
molecular to transition to hydrodynamical, and effects due effects to temperature gradients,
to surface diffusion, and due to specular reflection.

45
B.4.2.2. Real Cells, Samples and Orifices.
B.4.2.2.1. Nonideal Orifice, the Clausing Factor for an Orifice.
Under ideal conditions, the saturated vapor in an enclosure effuses out through a
perfect hole into a space in which the pressure of vapor is zero. In practice, the orifice is
not located in an infinitely thin wall and it has the form a of channel of finite length. Thus
the molecules may strike the orifice wall and be returned back to the cell. Therefore, the
simplest and most widely used modification of equation (B.4) takes into account the
resistance of the opening to the flow of vapor molecules, and has the following form:
P =ω
tAoWo
2πRT
M {B.5}
The transmission probability W0 (the Clausing factor) has values in the range zero to
unity and may be physically understood as a probability that a molecule entering the orifice
from the effusion chamber will reach the exterior of the orifice. It is assumed that molecules
enter the orifice from an isotropic gas phase, from a random direction, according to the
cosine law.
The determination of the Clausing probability factor W0 for an orifice is one of the
important requirements for performing reliable measurements by the Knudsen effusion
technique. The Clausing factor has been shown to be a function of the ratio of the length to
the radius of a cylindrical hole through which the molecules travel. There are two
approaches used for determining W0.
In the first approach, the cell can be fabricated so that the cell wall thickness and the hole
diameter are accurately known, such that W0 can be calculated using known empirical
expressions, or the value can be found from Clausing tables. Values of W0 for cylindrical
and rectangular orifices are given by Clausing [1932], Dushman [1962], and Kennard
[1938]. In order to calculate W0 for molecular flow, the following empirical formula
[Dushman, 1962] may be used:

46
W0 =1
1+ 3l8r
{B.6}
where l is the length and r the radius of the hole.
In the second approach, the effusion cell can be calibrated using reference materials for
which pressures are accurately known and W0 is back-calculated using equation {B.5}.
Even though the equation {B.5} is the most commonly used empirical equation, it has
been modified by a number of authors to correct for other determinate errors and obtain
more accurate equilibrium vapor pressures from Knudsen effusion data. These modified
equations have been developed for a cylindrical cell by Clausing [1932], Mortzefeld
[1955], Whitman [1952], and Balson [1961]. Carlson et al. [1963] have presented a
mathematically rigorous description of the distribution of the gas within spherical and
cylindrical cells.
B.4.2.2.2. Evaporation Coefficient, Cell Geometry.
At equilibrium the evaporative flux of molecules leaving the surface must be equal to the
condensation flux of molecules striking the surface. It should be noted that the opening in
the vessel disturbs the equilibrium between the condensed phase and vapor phase. Once an
opening has been provided for molecules to effuse, there is no longer a closed system and
the pressure over the sample is not the true equilibrium pressure Peq but something less
than this, a steady state pressure Pss. This is clearly a different situation than presented
above for an ideal equilibrium cell, and the real situation only approaches the ideal when the
rate of effusion is quite small compared to the rate of both escape of molecules from the
surface by evaporation and condensation onto the surface.
When this feature of the process is considered, equations for determination of the true
vapor pressure, Peq, must explicitly include consideration of the dynamic equilibrium at the
surface of the vaporizing liquid. This requires inclusion of a term that recognizes that the

47
surface evaporation and condensation processes have a rate proportional to the surface area
of the liquid, As.
Also, in a vaporization process which has attained equilibrium, the number of
molecules which strike the surface of the condensed phase and remain with the condensed
phase must equal the number of molecules which leave the surface. All of the molecules
which strike the surface may not, however, “stick”. Langmuir [1913] has shown that for
metal atoms condensing on a surface the value of the condensation coefficient (sticking
probability) may be assumed equal to 1 and Verhoek and Marshal [1939] showed that the
same assumption is justified in high boiling point organic liquids. Accurate values of
condensation coefficients are generally not available except for a very few materials.
Plausible reasons for coefficients to be close to unity have been advanced for the types of
materials of interest here. For the majority of cases they are probably between 0.7 to 1;
only in the case of vaporization of species whose molecular structure is quite different in
the gas than in solid or liquid (e.g. dimer liquids), are they thought to be very small,
0.001< α < 0.1. Thus there is generally less than unity probability of condensation for
every incoming molecule.
The geometry of the cell body and the location and area of the sample within it affect the
total rate of flow from the pinhole. Several authors have introduced the transmission factor
Wc, for a cell, which is the probability that a molecule leaving the bottom of the cell will
reach the orifice.
In addition to the above processes, there may exist some others that can cloud
interpretation of the results. Examples include interaction between cell walls and the
effusing molecules, surface diffusion and sorption, specular reflection, and reaction at the
walls.
The degree to which true equilibrium is maintained in an effusion cell depends upon the
sticking probability being high enough such that effusion does not compete as a vapor
48
phase molecular loss process with condensation. Thus the corrected equation has the
general form:
Peq = Peq( Pss, α, W0, Wc, A0, As ) {B.7}
where As is the sample area from which evaporation occurs. This is usually taken to be
the cross sectional area of the body of the cell (in the case of cylindrical cells).
For example, Whitman [1952] and Motzfeldt [1955] have shown that Peq and Pss are
related in the case of cylindrical cells through the equation:
P eq = Pss 1+W0A0
Ac
1
α+
1
Wc
− 2
{B.8}
Ward and Fraser [1968] have simulated the real effusion process by Monte-Carlo
calculations, and found that equation {B.8} has the correct form. For a cell of length equal
to its diameter, which is also the case for our cells, Wc~0.5 and equation {B.8} becomes:
P eq = Pss 1 +W0A 0
αAc
{B.9}
The effect of cell geometry has been observed in the case of an ideal sample (α=1) and
orifice (W0=1) [Carter, 1970], and predicted values of Pss/Peq range from 0.97 to 1.0 for
cells with the ratio of the orifice and cell radii (R0/Rc) in the range from 0.1 to 0.2.
Therefore one seldom finds any corrections made for the cell body geometry in the
literature. By applying equation {B.9} for orifices of different areas at similar experimental
conditions, it is possible to obtain the values of Peq and the condensation coefficient α from
a plot of Pss versus Pss(W0A0/Ac) [Margrave, 1967].
Equations {B.8 and B.9} have been used to study the vapor pressures of low volatile
organic compounds by several authors [De Silva and Monte, 1990; Pribilova and Pouchly,
1974; Boehncke et al., 1996]. However, Ribeiro Da Silva and Monte [1990] noted that in
using three different orifices, accurate values of α and Peq were not obtained.

49
The accuracy of different assumptions was checked here using materials of known
vapor pressure, as described below. Again, it is not likely that α will be much different
from unity, and A0<<Ac, so Peq=Pss will generally be assumed.
B.4.2.3. Implementation of the Method.
Equation {B5} has been successfully utilized to calculate equilibrium vapor pressures
of organic compounds by many workers [Morecroft, 1964; Wiedemann, 1972; DePablo,
1976; DeKruif, 1980; Colomina et al., 1980; Colomina et al., 1982; Kelley and Rice,
1964; Murray and Pottie, 1974]. As was noted above, the steady state pressure Pss may
be expected to be slightly less than equilibrium pressure Peq. On the other hand, the
corrections for evaporation coefficient and cell body are difficult to perform and will not be
significant in the case of coal tars. Thus more accurate values for Peq, involving further
corrections cannot normally be found in the literature [Ribeiro Da Silva and Monte, 1990].
Considering that the technique has been successfully applied to organic compounds without
making these corrections, and that concern is with a class of materials for which the extra
correction would not be expected to be important, it will be assumed that the corrections are
not needed in this work.
The main working equation has the general form as suggested by equation {B.5} and
the specific form:
P = 17.1463ω
tAoWo
T
M{B.10}
where P is the vapor pressure in torr, ω is the weight loss in grams during the effusion
time interval t in seconds, A is the area of the orifice in cm2, M is the molecular weight of
the effusing vapor in grams per mole, T is the absolute temperature in K, W0 is a Clausing
probability factor, obtained by interpolation from the table given by Dushman [1962].
As is evident from the above formula, it is necessary to know the molecular weight of
the vapor, and hence, the chemical composition of the vapor, in order to determine vapor

50
pressure by the effusion method. This is by no means always possible, especially in the
case of complicated mixtures such as coal tars.
If the vapor is composed of more than one gaseous species [Edwards and Franzen,
1995], then equation {B.10} must be written for each species, i:
P(i) =ω (i)
t A Wo
2 π R T
M(i){B.11}
However, the equation {B.10} can be used even in the case of a vapor with N species,
if the molecular weight is expressed as the appropriate value:
kM =ƒ(i)
M(i)1/2
i=1
N
∑
−2
{B.12}
where ƒ(i) is the mass fraction of the species i in the vapor, P = ∑ P(i) and
ω(i)=ω•ƒ(i). The value of Mk is close to the average vapor molecular weight M* of the
vapor phase, allowing {B.10} to be rewritten as follows:
P =ω
t A Wo
2 π R T
M *{B.13}

51
B.4.3. Knudsen Effusion System.
B.4.3.1. Effusion System.
A high vacuum system must be used, and the vacuum outside the cell (10-6 to 10-7
torr) should be achieved quickly, so that the beginning of an experiment can be registered
with sufficient temporal accuracy in work with mixtures. It is recommended that the
pressure external to the cell be at least one order of magnitude below the vapor pressure to
be determined [Ribeiro Da Silva and Monte, 1990].
The effusion system is represented schematically in Figure B.5. It consists of several
main items of equipment. A mechanical vacuum pump is used both for pre-evacuating the
system and for backing the oil diffusion pump. A 4 inch diffusion pump allows for
drawing the necessary vacuum to ensure that the residual gas pressure is approximately ten
times lower than the vapor pressure measured. It is connected to the microbalance chamber
through a liquid nitrogen trap. An ionization gauge tube (3) connected to a Varian 840
Gauge Controller is used for measuring the vacuum maintained in the system throughout
the effusion process. Two thermocouple gauges (1, 2) connected to Varian 801 TC Gauge
Controllers are used for leak detection and for measuring the vacuum in the system during
the pre-evacuation process. The needle valve (7) is used for filling the system with dry inert
gas (to atmospheric pressure) at the end of an experiment. During the filling, the pressure
in the system is measured using a pressure-vacuum gauge. The hardest vacuum reached in
this system was 10-8 mm Hg, which is sufficient for the range of pressures that can
reasonably be measured by this method.

52
B.4.3.2. TGA Apparatus.
The internal details of the effusion apparatus are schematically shown in Figure B.6.
The effusion cell is suspended on the arm of a CAHN 2000 recording electrobalance that
has a sensitivity 0.5 µg, capacity of 1.5 g and zero stability better than 10 µg. The
suspension system, which is 40 cm. long, consists of tungsten wire with a diameter of
0.25 mm and a small hook made of 0.05 mm diameter tungsten wire. The cell (mass
around 150 mg) itself actually hangs inside an aluminum capsule with a mass of 5 grams
(painted black to increase the effectiveness of radiative transfer), which surrounds, but
does not touch, the cell. This arrangement was found to be necessary in order to improve
heat transfer to the cell, and to allow accurate measurement of temperature in the immediate
vicinity of the cell. It has been used in performing both the traditional isothermal
experiments, as well as the new continuous non-isothermal experiments. The capsule is
intended to provide the cell with as close to an isothermal " black body" surrounding as
possible. The long equilibration times for the isothermal experiments have more to do with
how long it takes the capsule to come to a new thermal equilibrium than with how long it
takes the cell to equilibrate.
The capsule temperature is measured by a chromel/alumel thermocouple in direct
contact with the capsule, at a distance of no more than a few millimeters from the bottom of
the cell. The thermocouple is calibrated against a Fisher brand mercury thermometer and its
signal is recorded using an Omega DP85 digital indicator, with accuracy 0.1 K, interfaced
to a chart recorder.
A cold trap near the orifice of the Knudsen cell has been recommended in the literature,
in order to condense the vaporized compound and assist in keeping the back pressure low.
Provision has not been made here for a cold trap near the cell, and reliance was placed upon
a high pumping rate and a condenser slightly downstream of the cell, to give the necessary
low pressures outside of the cell. The water cooler shown in Figure B.6 is designed for
53
this purpose. The troublesome effects of static charges on the vaporization tube could be
eliminated by rinsing the outside of the tube with methanol or water.
Maintaining and measuring the cell temperature with a high accuracy is critical. It is
noted by Wiedemann [1972] that a change of a few tenths of a degree Kelvin can alter the
vaporization rate and lead to significantly erroneous values of vapor pressure, particularly if
the temperatures are low. Temperature control and recording instrumentation are used that
are capable of the required performance.
B.4.3.3. Heating System.
The heating system consists of an aluminum block oven surrounded by insulating
material. This is a high mass heating system and offers temperature control comparable to
an oil bath system. It does not have electromagnetic induction effects as would a resistance
furnace. The heat source for the temperature control system consists of a 300 W heater for
coarse regulation and 50 W heater for exact regulation. The latter is controlled by means of
a RFL Industries, Inc. temperature controller, which is designed to regulate temperatures
within a few tenths of a degree. The temperature in the block is measured using a
chromel/alumel thermocouple and recorded using an Omega DP85 digital indicator.
B.4.3.4. Effusion Cell.
A Knudsen cell of new design was developed for this work with solid or tarry
hydrocarbons. The design was limited by several special requirements: first it had to be
very light, less than 1 gram (determined by the capacity of the microbalance); second, it had
to allow using samples of a few tens of milligrams (large quantities of well-characterized
tars were not available); and finally, it had to preferably be inexpensive enough so as to be
disposable, to avoid concerns about cleaning. The result is a cylindrical sample container

54
with approximately 0.01 cm3 internal-volume, stamped from 25 µ m thick brass foil or 25
µ m thick oxidation-resistant stainless steel foil, and closed hermetically by pressing the
orifice plate to the cylinder with a hand press, thus ensuring no leak from the cell, except
through the orifice. The cell is outgased under vacuum for several hours at a temperature of
at least 300 C or cleaned by heating up to 1000 C using a propane flame. Unfortunately,
the hermetic closure of the cells has proven to be a possible problem, as discussed below.
The effusion holes in the foil are made using fine drills. The orifice diameter is
determined by use of an optical microscope. The determination is made at room
temperature, but it is not felt that thermal expansion should alter the dimensions of the hole
significantly. The Clausing factor is obtained by interpolation from the table given by
Dushman [1962].
Orifice diameter selection was guided by published results, and examined
parametrically. Morecroft has shown that the vapor pressure measurement is independent
of hole size [Morecroft, 1964], within the guidelines suggested above. It is has been noted
that it is necessary that the mean free path of the molecules be larger than the orifice
diameter in order to employ the Knudsen formula; for practical purposes, this would
normally be interpreted as a mean free path ten times large than the orifice diameter. Good
results can, however, still be obtained when the diameter is about the same as the mean free
path [Morecroft, 1964]. On the other hand, since the effusion rate is very small at low
pressures, a large orifice (diameter 3 to 5 mm) is required to give reasonable rates
[Wiedemann, 1972]. Very large holes can, however, yield erroneously low apparent values
for vapor pressures, owing to self-cooling of the sample and failure to maintain equilibrium
[Ribeiro Da Silva and Monte, 1990].
In addition to slow effusion rates, other problems also exist with small orifices. For
example, the existence of small leaks in the cell can cause problems if the effusion hole has
a small size. In this case, the effective effusion area is higher than believed, leading to a
calculated vapor pressure that will be considerably higher than the true value, as a result of

55
using the “wrong” orifice area. It is also reported by Winterbottom and Hirt [1962] that the
influence of surface diffusion increases as the radius of the hole decreases.
Holes with diameters from 0.6 to 1.1 mm were selected. Several replicate experiments
were done to check on systematic errors and cell design. The vapor pressures were found
to be independent of the hole size, and were reproducible.
B.4.4. Establishing the Performance of the Apparatus.
Analysis of the experimentally determined vapor pressure data was performed using the
integrated form of the Clausius-Clapeyron equation {A.8} by plotting the natural logarithm
of vapor pressure against the reciprocal of temperature. The latent heat of sublimation
(∆H), and the entropy of sublimation (∆S) , can be calculated using this equation. The ∆H
and ∆S values correspond to the average temperature of the measurement. The equivalent
expression can be written in the form:
lnP[torr] = −B
T+ A =−
∆H
RT+ A {B.14}
where P is in torr, T is in K, ∆H = B*R in kJ/mol, ∆S= (A - 4.893)*R J/mol K, and
R is ideal gas constant ( R = 8.314 J/mol K).
B.4.4.1. Effusion Technique Using the Isothermal Method.
The isothermal step method was used to check the performance of this technique. Our
results were compared with literature values. To verify that the procedures yielded accurate
vapor pressures of low-volatile compounds , the vapor pressures of anthracene, naphtacene
and phenanthrene were measured. Approximately 5% of each material was evaporated
before actual measurements, to eliminate occasional artifacts due to volatile impurities.

56
Anthracene (C14H10, FW = 178.24, m.p.= 218°C , b.p.= 340°C )
Anthracene of 99+% purity was obtained from the Aldrich Chemical Company, Inc.
This compound was tested because of the large number and generally good agreement of
experimental data in the literature. It is also an appropriate standard for study of coal related
compounds. Anthracene has been studied here at temperatures between 45 and 90°C and at
pressures from 3.85*10-5 to 8.97*10-2 torr.
In order to ascertain that the pinhole diameter was not a critical variable in the cell
design, experiments were performed with different size holes. The results are shown in
Figure B.7, together with a curve based on the mean of the data from the literature. The
mean curve was constructed by using each reference's recommended correlation applied to
the maximum and minimum temperatures of that study. This procedure is admittedly
somewhat arbitrary, but captures the essence of the data as the resulting correlation line in
Figure B.7a shows. The vapor pressure appears to be independent of the hole size. Our
results for anthracene lie near the average values of the literature data and give a heat of
sublimation over the measured temperature range of 100.8 kJ/mol. This is in quite good
agreement with the literature data.
The performance of the apparatus at higher temperatures was checked by measuring
the vapor pressures of naphthacene and pentacene.
Naphthacene (C18H12, FW = 228.29, m.p.= 357C , b.p.= unknown )
Naphthacene of 98% purity was obtained from the Aldrich Chemical Company, Inc.
This compound has been studied here at temperatures between 113 and 199°C and at
pressures from 2.6*10-5 to 3.6*10-2 torr.
Figure B.8 shows the results obtained for naphthacene. Again, there is excellent
agreement with the relatively few data in the literature. From these results, the latent heat
of sublimation can be estimated to be 125.2 kJ/mol.

57
Pentacene (C22H14, FW = 278.35, m.p.= above 300 , b.p.= unknown )
Pentacene of 98% purity was obtained from the Aldrich Chemical Company, Inc. This
compound has been studied here at temperatures between 170 and 210°C and at pressures
from 1.2*10-5 to 1.3*10-4 torr. Figure B.9. shows the results obtained for pentacene. The
values agree, within experimental error, with the literature values. The measured enthalpy
of sublimation (154.4 kJ/mol) is in good agreement with the values from the literature
data.
B.4.4.2. Non-Isothermal Technique.
The non-isothermal technique is identical to the isothermal technique, except that the
system temperature is continuously varied, and the mass loss rate is continuously
calculated.
Figure B.10. shows the results of measurements on anthracene performed using the
non-isothermal Knudsen Effusion technique at heating and cooling rates of 5 °C/min. It is
apparent that there is a significant deviation of the results from the isothermal technique
data. The fact that the heating data underpredict and the cooling data overpredict the real
vapor pressures might be anticipated. This performance suggests that the cell temperature is
lagging the surrounding capsule temperature, and that the heat transfer limitation has shifted
to the capsule-cell transport process. For this reason, it is logical to expect that by
decreasing the rate at which the capsule is driven in temperature, this limitation can be
minimized. This is borne out by the results obtained at 0.8 °C/min heating rate.
The new results for anthracene with a heating rate of 0.8 °C/min are seen in Figure
B.11. There is in this case good agreement between the results obtained from the non-
isothermal and isothermal techniques.
Figure B.12 and B.13 show the results of the non-isothermal technique applied to
naphthacene, in "cooling" and "heating" modes, respectively. As seen in Figures B.12 and
58
B.13, there is again good agreement between the results of isothermal and non-isothermal
heating and cooling runs. Thus the reliability of non-isothermal method appears to be
established and this technique is suitable for the vapor pressure measurements with heating
or cooling rates up to about 1 °C/min.
B.4.5. Conclusions.
Two different methods, effusion and transpiration, have been examined for measuring
the vapor pressures of coal tars. The former has been chosen as the more suitable for work
with mixtures. Two accurate effusion measurement methods, the isothermal and non-
isothermal Knudsen effusion methods, have been developed. It can be seen that there is
generally good agreement between the two techniques, and that both give results that agree
well with published values.
An effusion apparatus suitable for measuring vapor pressures from 10-2 to 10-6 torr
has been developed. The lower limit of measurable pressure is determined by the balance
sensitivity, noise in the recording microbalance system and the design properties of the cell
(thickness of the foil, diameter of the orifice). The upper limit is determined by the critical
Knudsen number. The reliability of the measurements was carefully established using
comparison of the results obtained here with literature values for well-studied materials.

59
Tar production[wire mesh reactor, tubular reactor or
fluidized bed reactor]
Tar collection & fractionation [preparative gel-permeation chromatography
(GPC) ]
Vapor pressure measurement:[Non-isothermal Knudsen
effusion technique]
Thermal behavior:DSC
Characterization:number average molecular weight [ VPO]characterization by chemical structure[ analytical GPC]elemental analyses
Figure B.1. General scheme for coal tar preparation and characterization.

60
0
0.1
0.2
0.3
0.4
0.5
0.6ab
sorb
ance
2000 70003000 4000 5000 6000 80001000
fr1
time [ sec ]Figure B.2. Typical preparative GPC chromatogram,
along with the dividing lines between fractions.
fr2 fr3 fr4 fr5 fr6 fr7 fr8 fr9

61
0
5
10
15
20
25
30
0
VPO
sig
nal [
mV
]
0.02 0.04 0.06 0.08 0.1Molarity [ mol/L ]
Figure B.3. VPO calibration constant determinations at 90°C using pyridine as the solvent.
3-hydroxy-1H-phenalen-1-onephenanthridinepyrene
mV = 0.00091861 + 330.12M
mV = 0.0060737 + 339.62M
mV = 0.0072007 + 355.04M

62
-0.2
0
0.2
0.4
0.6
0.8U
V a
bsor
banc
e
500 700 900 1100 1300
retention time [sec]Figure B.4. Selection of wavelength to maximize the UV-detector response
factor, using Bruceton coal tar. Uniform increase of absorbance is seen as the wavelengthapproaches 305 nm.
290 nm305 nm310 nm330 nm350 nm370 nm390 nm
1500
0.777
0.47
0.264
0.157
0.777/0.264 ≈ 0.47/0.157

63
1
2
3
4
liquidnitrogentrap
diffusion pumpmechanical pump
microbalance
aluminumblock oven
5
6
7
inert gas
cooling water
Figure B.5. General schematic of the effusion system; 1, 2 - thermocouple gauges3- ionization gauge; 4 - molecular sieve trap; 5, 6 - valves; 7 - needle valve.

64
Cahn microbalance
Vacuum
dry inertgas N2
thermocouple, type K
water cooler
Aluminum block oven
Cartridge heater
Thermistor A/D Converter
Voltmeter
Temperaturecontroller
computer
chart recorder
control unit
Figure B.6. Arrangment of an Effusion Apparatus with control and measurement system.

65
-12
-10
-8
-6
-4
-2
ln P
[to
rr]
0.0024 0.0026 0.0028 0.003 0.0032 0.0034
1/T[K]Figure B.7. The effusion method applied to
anthracene, using different diameter effusion orifices. The dashed line is a mean of the data from the literature.
D = 0.6480 mmD = 0.933 mmD = 0.991 mm

66
-14
-12
-10
-8
-6
-4
-2ln
P [
torr
]
2.4 2.6 2.8 3 3.2 3.4 3.6
1/T [K]*103
Figure B.7a. Mean of literature data for solid anthracene.
Macknick/Prausnitz, 1979DeKruif, 1980Hansen/Eckert, 1986Kelley/Rice, 1964Sonnefeld, 1983mean of literature
ln P [torr]= 28.549-12082/T[K]

67
-11
-10
-9
-8
-7
-6
-5
-4
-3
ln P
[to
rr]
0.0021 0.0022 0.0023 0.0024 0.0025 0.0026
1/T[K]Figure B.8. Effusion method applied to solid naphthacene.The solid points are from this study, and the open points
are calculated from references.
This laboratory.DeKruif, 1980.Stephenson/Malanowski, 1978.
ln P = 28.585 -15073/T
ln P = 29.442 -15406/T
ln P = 28.503-15058/T

68
-11.5
-11
-10.5
-10
-9.5
-9
-8.5
-8
-7.5
ln P
[tor
r]
0.00205 0.0021 0.00215 0.0022 0.00225 0.0023
1/T[K]Figure B.9. Effusion method applied to solid pentacene.
This laboratoryC.G.DeKruif, 1980Stephenson/Malanowski, 1987
ln P = 30.351 -18577/T
ln P = 30.324 -18522/T
ln P = 31.322 -19022/T

69
-9.5
-9
-8.5
-8
-7.5
-7
-6.5
ln P
[ to
rr ]
0.0029 0.00294 0.00298 0.00302 0.00306 0.0031
cooling
heating
1/T [ K ]Figure B.10. Comparison of results obtained using the non-isothermal
and isothermal effusion method on anthracene. Heating andcooling rates 5°C/min.
non-isothermal
isothermal step

70
-9
-8.5
-8
-7.5
-7
-6.5
-6
ln P
[ to
rr ]
0.00285 0.0029 0.00295 0.003 0.00305 0.00311/T [ K ]
Figure B.11. The non-isothermal effusion method applied to solid anthracene. Heating rate 0.8 °C/min. The solid curve is obtained from the non-isothermal
technique, and the solid line is a linear regression of these data.
non-isothermal
isothermal step
ln P [torr] = 28.835 - 12189/T[K]
ln P [torr] = 28.715 -12122/T[K]
The broken curve is a fit to data obtained by the traditional isothermal method (reported earlier). The difference in the curves is within experimental error.

71
-9.5
-9
-8.5
-8
-7.5
-7
-6.5ln
P [
torr
]
0.00235 0.0024 0.00245 0.0025
1/T [ K ]Figure B.12. Non-isothermal effusion method applied to naphthacene,
with continuous decrease of sample temperature.Cooling rate 0.8°C/min.
non-isothermal
isothermal step
ln P = 30.347 -15742/T
ln P = 29.442 -15406/T

72
-8.5
-8
-7.5
-7
-6.5
ln P
[ to
rr ]
0.00236 0.00238 0.0024 0.00242 0.00244 0.00246
1/T [ K ]Figure B.13. Non-isothermal effusion method applied to naphthacene,
with continuous increase in sample temperature.Heating rate 0.8 °C/ min.
non-isothermal
isothermal stepln P = 30.277 -15742/T
ln P = 29.442 -15406/T
73
Chapter C. Vapor Pressures of Polycyclic Aromatic
Hydrocarbons and Model Mixtures.
This chapter reviews the data available to us on the vapor pressure of high boiling
aromatic compounds. Also the measurements of vapor pressures for various large
polycyclic aromatic hydrocarbons (PAH), including those containing heteroatoms, and
some mixtures of these compounds are presented. The vapor pressures of pure compounds
and model "tars", consisting of mixtures of the PAH, are measured using the Knudsen
effusion technique in the ordinary isothermal step mode.
This part of the study was motivated by the lack of vapor pressure data on coal tar
related compounds, which tend to have a highly aromatic nature and which also contain a
significant number of heteroatoms.
C.1. Effects of Intermolecular Forces on Vapor Pressure - Overview.
There is a lack of information and understanding concerning the intermolecular forces
present in coal-derived products and in coal itself. It is known that the thermodynamic
properties of any pure substance are determined by intermolecular forces which operate
between the molecules of that substance.
The physical forces between molecules play an important role in determining the
properties of a solution. Properties which depend on interaction between molecules rather
than on the characteristics of the molecules which are isolated are called configurational
properties. For example, the energy of vaporization, vapor pressure and boiling point are
configurational properties, but the specific heat at low pressure is not. To interpret and
correlate thermodynamic properties of solutions, it is therefore necessary to have some
understanding of the nature of intermolecular forces. The case of a mixture is necessarily
more complicated, because consideration must be given not only to the interaction between

74
molecules belonging to the same component, but also to interactions between dissimilar
molecules. When a molecule is in the proximity of another, forces of attraction and
repulsion strongly influence its behavior.
The significance of the effect can be seen by considering the saturation vapor pressure of
some important classes of organic compounds. These will be categorized by general
structural features and actual measured vapor pressures from the literature will be used. It is
worth noting that only relatively small molecules, with molecular mass between 100 and
300 daltons, are considered. Distinctions are drawn between several classes of aromatic
compounds (aromatics are, of course, of considerable interest in this project). There are the
cata-condensed (linear) aromatics such as naphthalene, anthracene, naphthacene. There are
the other "non-linear" aromatics, including pericondensed. None of these have any
substitutents. A third class of aromatics are those with phenyl substitutents, such as
rubrene or hexaphenylbenzene. A fourth class of compounds is aromatics with alkyl
substitutents. A fifth class is aromatic ring hydrocarbons with heteroatoms (such as N, S
and O), and the sixth is those with hydroxyl groups (-OH) or hydroxyl/carboxyl
substitutents such as 6,11-dihydroxynaphthacene dione or 1-hydroxy-anthraquinone. The
vapor pressures of these classes of organic compounds at 75 °C are presented on Figure
C.1. As can be seen, vapor pressures can differ by many order of magnitude for the same
molecular weight. These compound-to-compound variations arise from differences in
molecule- molecule interactions.
It is important to keep this general result in mind, as data are presented for various
aromatics. The importance of the details of chemical structure will be alluded to often in
what follows.

75
C.2. Vapor Pressure Measurements for PAH .
The vapor pressures of thirteen hydrocarbons with molecular weights in the range of
178 to 300 g/mol were measured by the standard Knudsen Effusion Technique.
Literature data on heteroatom-containing aromatic hydrocarbons are extremely scarce. We
believe that our results might be among the first available on some of these materials.
All the chemicals were used as supplied. Only their thermal behavior was investigated
and melting point determined, using differential scanning calorimetry, to verify the
purity. The method has been described in the previous chapter. It should only be added
that in all cases at least 5% of the weight of each hydrocarbon sample was vaporized
before measurement. This was to assure that small amounts of volatile impurity would
not influence results. For each material, experimental results were obtained in two
independent series of experiments.
C.2.1. Polycyclic Aromatic Hydrocarbons.
The previous section gave some results on the vapor pressures of PAH (anthracene,
naphtacene and pentacene). Here, the results on several other PAH are considered.
Phenanthrene (C14H10, FW = 178.24, m.p. = 101 °C, b.p.= 338 °C)
Phenanthrene of 99% purity was obtained from Kodak, Inc. This compound has been
studied here at temperatures between 30 and 60 °C and at pressures between 2.78*10-4
and 7.5*10-3 torr. The results are given in Figure C.2. Reasonable agreement is noted
with the other values reported in the literature.

76
Pyrene ; (C16H10, FW = 202.3, m.p. = 156°C , b.p.= 393 °C)
Pyrene of 99% purity was obtained from the Sigma Chemical Company, Inc. This
compound has been studied here at temperatures between 35 and 125 °C and at
pressures between 1*10-4 and 6.7*10-3torr. The results are shown in Figure C.3
together with some literature values. Our data exhibits satisfactory agreement with the
literature data.
Coronene; (C24H12, FW = 300.36, m.p. = 438 °C , b.p.= 525 °C)
Coronene of 97% purity was obtained from the Pfaltz & Bauer, Inc. This compound
has been studied here at temperatures between 421 and 504 K and at pressures
between 1.4*10-5 and 7*10-3 torr. There are many fewer data to be found in the
literature on this compound than on the previous two and the data are widely
scattered. Comparison between our results and those in the literature is shown in
Figure C.4. It can be seen that we show good comparison with one of those sets, but
the results differ sharply from data obtained by the other two investigators calculated
to our temperatures. We are not discouraged by this, because the other two sets
appear to be of lower reliability; those given by Stephenson and Malanowski [1987]
are from a correlation without attribution or description of technique. Those
determined by Wakayama et al. [1967] are from a series of measurements on many
compounds, which consistently showed significant discrepancies from other
published studies. They cannot therefore be regarded as reliable.
Perylene (C20H12, FW = 252.3, m.p.= 278°C , b.p.= unknown )
Perylene of 99+% purity was obtained from the Aldrich Chemical Company, Inc. This
compound has been studied here at temperatures between 118 and 151°C and at
pressures between 3.9*10-5 and 9*10-4 torr. The results are shown in Figure C.5
together with values calculated from literature data. Additionally we present our

77
experimental data for perylene of 95% purity, obtained from Pfaltz & Bauer, Inc. The
data from our studies differ considerably from the results of two preceding studies,
obtained from a handbook [Stephenson and Malanowski 1987]. These literature data,
as described earlier in the case of coronene, could be of questionable reliability.
2,3-Benzofluorene (C17H12, FW= 216.28, m.p.= 209°C , b.p.= 402°C)
2,3-benzofluorene of 98% purity was obtained from the Aldrich Chemical Company,
Inc. This compound has been studied here at temperatures between 71 and 124.5 °C
and at pressures between 3.4*10-5 and 9.2*10-3 torr. There were no experimental
data for the vapor pressure of 2,3-benzofluorene in the literature. Results are shown
in Figure C.6.
C.2.2. Polycyclic Aromatic Hydrocarbons Containing Heteroatoms.
The following polycyclic aromatic hydrocarbons containing heteroatoms have also
been examined:
Phenanthridine ; (C13H9N, FW = 179.22, m.p. = 108°C , b.p.= 349°C)
Phenanthridine of 99% purity was obtained from the Aldrich Chemical Company, Inc.
This compound has been studied here at temperatures between 36 and 163.5 °C and at
pressures between 1.1*10-4 and 3*10-3 torr. The results are shown in Figure C.7
together with the only available literature data. The earlier study [McEachern et al.
1975] involved use of a restricted molecular flow apparatus [McEachern, 1973]. As
only these two data sets exist, it is difficult to comment on the reliability of one
against the other.

78
1,2-Benzodiphenylene sulfide; (C16H12S, FW= 234.32, m.p.= 188-190°C ,
b.p.= unknown)
1,2-benzodiphenylene sulfide of 99% purity was obtained from Aldrich Chemical
Company, Inc. The data were obtained for the temperature range from 51.5 to 100
°C and the pressure range from 7 *10 -6 and 1.3*10-3 torr. Literature references were
not found for this compound. The results are shown in Figure C.8.
1-Hydroxypyrene; (C16H10O, FW =218.26, m.p. = 179...182°C, b.p.= unknown)
1-Hydroxypyrene of 99% purity was obtained from the Aldrich Chemical Company,
Inc. This compound has been studied here at temperatures between 96 and 121 °C
and at pressures between 1.1*10-4 and 1.6*10-3 torr. Literature references were not
found for this compound. The results are shown in Figure C.9, together with those
for pyrene itself. These two compounds have very similar molecular weights, but that
containing the hydroxyl group displays the expected lower vapor pressure and
slightly higher enthalpy of vaporization.
Perinaphthenone ; (C13H8O, FW = 180.21, m.p. = 153...156 °C , b.p.=
unknown)
Perinaphthenone of 99% purity was obtained from the Aldrich Chemical Company,
Inc. This compound has been studied here at temperatures between 53 and 75 °C and
at pressures between 1.8*10-4 and 1.8*10-3 torr. Literature references were not
found for this compound. The results are shown in Figure C.10, together with those
for 3-hydroxy-1H -phenalen-1-one.

79
3-hydroxy-1H -phenalen-1-one; (C13H8O2, FW = 196.21 m.p. = 264°C , b.p.=
unknown )
3-hydroxy-1H -phenalen-1-one of 98% purity was obtained from the Adrich Chemical
Company, Inc. This compound has been studied here at temperatures between 129
and 159°C and at pressures between 5.4*10-5 and 1.3*10-3 torr. Literature
references were not found for this compound. Comparison with perinaphthenone
shows the enormous influence of the hydroxyl substitutent.
6,11-Dihydroxy-5,12-naphthacenedione; (C18H10O4, FW= 290.28 m.p.=
350°C, b.p.= unknown )
6,11-Dihydroxy-5,12-naphthacenedione of 98% purity was obtained from the Adrich
Chemical Company, Inc. This compound has been studied here at temperatures
between 153 and 173°C and at pressures between 1.1*10-4 and 7*10-4 torr.
Literature references were not found for this compound. The results are shown in
Figure C.11, together with the data for naphthacene.
Benz[g]isoquinoline-5,10-dione; (C13H7O2N, FW=209.21, m.p.=178...180°C,
b.p.= unknown )
Benz[g]isoquinoline-5,10-dione of 99% purity was obtained from the Adrich Chemical
Company, Inc. This compound has been studied here at temperatures between 61 and
108 °C and at pressures between 6.4*10-5 and 8.2*10-3 torr. Literature references
were not found for this compound. The results are shown in Figure C.12, together
with the literature data for anthraquinone [Bardi et al., 1973]. The substitution of a
nitrogen atom for carbon is seen to have only a modest effect on vapor pressure,
because no new hydrogen bonding interactions are introduced.
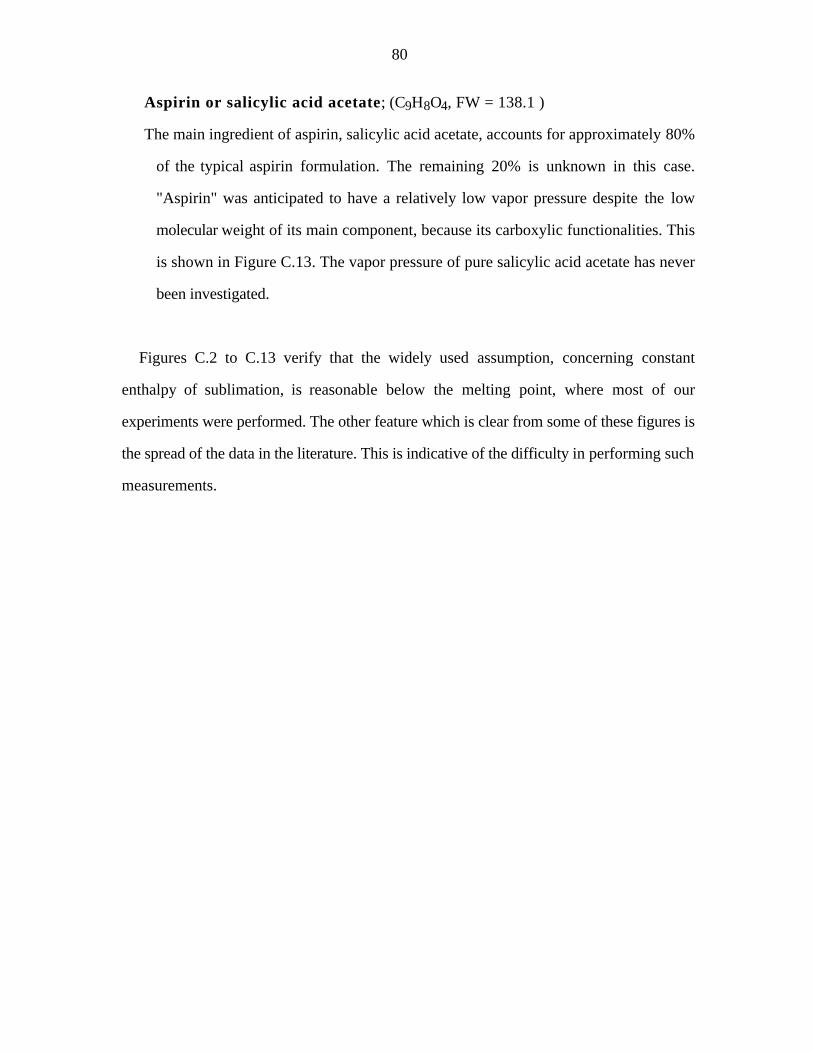
80
Aspirin or salicylic acid acetate; (C9H8O4, FW = 138.1 )
The main ingredient of aspirin, salicylic acid acetate, accounts for approximately 80%
of the typical aspirin formulation. The remaining 20% is unknown in this case.
"Aspirin" was anticipated to have a relatively low vapor pressure despite the low
molecular weight of its main component, because its carboxylic functionalities. This
is shown in Figure C.13. The vapor pressure of pure salicylic acid acetate has never
been investigated.
Figures C.2 to C.13 verify that the widely used assumption, concerning constant
enthalpy of sublimation, is reasonable below the melting point, where most of our
experiments were performed. The other feature which is clear from some of these figures is
the spread of the data in the literature. This is indicative of the difficulty in performing such
measurements.
81
C.3. Model Compounds for Coal Tars - Some Considerations.
It is known that the thermodynamic properties of any pure substance are determined by
intermolecular forces which operate between the molecules of that substance. The
comparison of structurally related compounds is one way to determine the different
energetic contributions and this has been done to a limited extent above. The heat of
vaporization can be considered as a measure of the energy required to transfer molecules
from the condensed state into the gaseous state, and therefore provides information on
intermolecular interaction energy. Further discussion of this point is found below.
C.3.1. Van der Waals Forces.
All compounds in a condensed phase are subject to van der Waals forces. Van der Waals
forces are defined as attractive forces between neutral or nonpolar molecules that are caused
by orientation (dipole-dipole), induction (dipole-induced dipole), and dispersion (induced
dipole-induced dipole) interaction. They are considered to be one of the primary forces
responsible for holding molecules together in the condensed state and they play the
dominant role in nonpolar systems regardless of molecular size. Except in small molecules
with large dipole moments, dispersion forces tend to dominate the other intermolecular
forces. Larger molecules generally exhibit lower vapor pressure since the summation of
van der Waals attractions is directly related to their size.
The ease with which an organic compound escapes to the vapor phase from a condensed
phase is controlled by the magnitude of ∆Hvap. This ∆Hvap gives the temperature
dependence of vapor pressure. Relationships have been sought between ∆Hvap and the
molecular weight. Here, most of the data obtained were actually ∆Hsub opposed to ∆Hvap.
This makes analysis somewhat easier, since the temperature dependence of ∆Hsub, is often
not significant. There have been several attempts to correlate ∆Hsub with the number of

82
carbon atoms in condensed aromatic hydrocarbons. Inokuchi et al.[1952] attempted to
establish a simple linear relationship, where each carbon was assigned an inner heat of
vaporization of 1.5 kcal/mol or 6.29 kJ/mol. De Kruif et al. [1980], assuming a linear
relationship, showed that the increase in ∆Hsub ( 25°C) has constant value 8.33 kJ/mol per
carbon atom, which is about 17% higher than the value derived by Inokuchi. Morawetz
[1972] has attempted to establish a better correlation by classifying the C-C bonds in
aromatic compounds according to eight different types.
The heat of sublimation for twenty PAH are plotted against their carbon numbers in
Figure C.14 and against their molecular weights in Figure C.14b. The enthalpies of
sublimation were calculated from the vapor pressure data found in the literature or
measured by us. The data shows such a correlation to be poor for accurate work. A
distinction needs to be drawn between linear and peri-condensed aromatic hydrocarbons.
From Figure C.14 we suggest 7 kJ/mol for linear aromatics and 5 kJ/mol for
pericondensed aromatics.
To emphasize this point further, it may be shown that there exist significant differences
between the vapor pressures of similar molecular weight aromatic hydrocarbons containing
exactly the same functional groups, or very similar structures. Figure C.15 shows
graphically results on aromatic compounds of identical molecular weight. It should be
noted that these are not compounds of vastly different structures. It is apparent from the
general similarity of the slopes of the curves in Figure C.15 that at least for this family of
condensed aromatics, the assumption of a similar latent heat of vaporization is not bad. The
vapor pressures at any temperature are however different by orders of magnitude.
It can be noted from appendix A.1 that the H/C atomic ratio for coal tars is around 1.
PAH have an H/C ratio around 0.5. This suggests that significant amounts of alkyl groups
are present in the coal tars. For example, the H/C ratio for trimethyl-anthracene (C17H16) is
0.94. The influence of alkyl and phenyl groups on the heats of sublimation of PAH is
shown in Figure C.16. The effect is small, but clear.

83
Figure C.17 shows the comparison of the solid vapor pressures for anthracene, 9,10-
dimethyl anthracene, and 5-butylanthracene. Clearly, alkyl substitutents do not necessarily
increase the vapor pressure of given aromatics just because they increase molecular weight.
Addition of the bulky t-butyl group, and all its mass, had surprisingly little effect on vapor
pressure. For a given molecular weight, they do generally lower the boiling point slightly,
as can be seen from Figure C.18. Many PAH thermally decompose before they reach their
atmospheric boiling points [Smith et al., 1980]. Figure C.18 and some other figures
presented earlier cannot therefore be extended to much higher molecular weight.
C.3.2. Polar Attraction.
As a result of the differing electron-attracting properties or electronegativities of the
various types of atoms included in organic compounds, specific intermolecular interactions
are possible. In coal tars, the main heteroatoms are O, S, N, which can contribute polar
interaction possibilities. Polar characteristics affect interactions in two ways. The first
involves permanent dipoles. A dipole will align itself with other dipoles resulting in
dipole:dipole attraction between molecules. Second, if a polar group is positioned near an
evenly charged structural region of an adjacent molecule, electrons in the neighboring
molecule will be displaced in response to the approaching polar unit, and an induced dipole
attraction will result.
The contribution of heteroatoms to the heat of sublimation of aromatic compounds of
various molecular weights is shown in Figure C.19. Generally, it can be seen that the
presence of heteroatoms does not have a consistent effect on the heat of sublimation though
clearly the earlier presented results (Figure C.9 and C.10) indicate that hydrogen bonding
substitutents can have a significant influence on both vapor pressure and ∆Hsub in
particular cases. The heteroatomic compounds of Figure C.19 generally do not have a

84
hydrogen-bonding character. The effect of heteroatoms in the aromatic ring is small unless
they can participate in polar (hydrogen bonding) interactions.
The influence of heteroatoms on the vapor pressure of structurally similar compounds
is shown in Figure C.20, and for some other structurally similar compounds in Figures
C.12 and C.21. A significant influence of the heteroatoms is seen on the vapor pressure in
some cases, but not in others. Again, it is clear that there is no easily generalized effect of
the heteroatoms. Large vapor pressure differences can occur. Once again, however, the
latent heat is relatively comparable for all the compounds. Thus depending upon subtle
details of the structure, large variations in vapor pressure can be seen, even when these
features do not show themselves in the latent heat. The latent heat depends most upon the
number of atoms, and thus crudely, upon molecular weight. This is why correlations such
as {A.1} work to some level of approximation. The correlation does not account for
potentially large variations in ∆Ssub.
The above results (in Figures C.20 and C.21) are generally striking in the terms of the
similarity of enthalpies of sublimation, but in none of these cases is hydrogen bonding
significant. This suggests that to a good approximation, structurally similar PAH molecules
have very similar sublimation enthalpies, if hydrogen bonding is not involved. Predicting
∆Ssub appears difficult. The key to correctly predicting vapor pressures for this class of
compounds is thus in the prediction of the entropy.
C.3.3. The Entropy of Sublimation.
The entropy of sublimation is associated with a change in the "ordering" of the
molecules in the system during vaporization and is a function of the molecular structure. In
the vapor phase molecules interact minimally, and the molecules are in a state of disorder.
Thus, the differences in ∆Svap can be interpreted in terms of differences in the internal
order in the condensed phase. This degree of order depends on the geometric and chemical

85
character of molecules. The values of the entropy of sublimation for some aromatic
compounds are plotted against their molecular weights in Figure C.22. Figure C.22 a
shows a weak correlation with the carbon number. The plot shows large a scattering in the
data, and the entropy per mole generally increases as molecular weight increases. Nonpolar
substances with spherical molecules are generally in a state of greater disorder than a
system containing asymmetric and polar molecules. A high degree of order is especially
pronounced for systems with hydrogen bonds. Increased ordering leads to high values of
∆Svap.
C.3.4. The Contribution of Hydrogen Bonding.
Hydrogen bonding interaction are a special, important subset of polar interactions. The
formation of hydrogen bonds in fluids modifies their physical and chemical properties in
many ways. In particular, hydrogen bonding substantially changes solubilities of various
substances, dielectric properties and electrical conductivity, freezing and boiling points,
density, vapor pressure and heat of vaporization. In a hydrogen bond, a hydrogen atom is
effectively shared by an other atom. The atom to which hydrogen is more tightly linked is
called the hydrogen bond donor, whereas the other atom is the hydrogen bond acceptor.
The latter carries a partial negative charge. Since the two atoms connected by the hydrogen
atom are highly electronegative, the hydrogen bond is a result of electrostatic interaction
between the nearly bare proton and the electron-rich atom.
Hydrogen bonds are stronger than van der Waals bonds but much weaker than covalent
bonds (10 to 20 times weaker) [Stryer, 1981], i.e., bond energies in the range 10 to 50
kJ/mol are associated with hydrogen bond formation. An important feature of hydrogen
bonds is that they are directional: in the strongest hydrogen bond, the donor, the hydrogen,
and the acceptor atoms are collinear. The bond becomes weaker with increasing the
acceptor atom angle to the line joining the donor and hydrogen atoms. Letcher et al. [1996]

86
has calculated the hydrogen bond interaction energies from partial molar enthalpies at
infinite dilution for liquids and show the order of hydrogen bond strengths OH...N >
OH...O > OH...S or SH....S > SH...O > SH...N or NH...S > NH...O > NH...N.
It will be shown in Chapter D that the contribution of the hydroxyl group to the heat of
sublimation of the sugar-like compounds is around 30 kJ/mol. The influence of hydroxyl
groups on the heat of sublimation of aromatic compounds is more complex. Comparison
of the literature values of some heats of sublimation [Stephenson and Malanowski, 1987]
is given in Table C.1.
Table C.1. The heats of sublimation for benzene, phenol and benzenediols.
compound benzene phenol 1,3-benzenediol 1,4-benzenediol
average T[°C] -10 -5 90 90
∆Hsub[kJ/mol] 69.8 93.3 92.7 101.7
OH contribution [kJ/mol] 23.5 11.3 16
Literature data [Stephenson and Malanowski, 1987] on the vapor pressures of
naphthalene, 1-naphthol and 2-naphthol are shown in Figure C.23. The hydroxyl group
contributions may be crudely estimated to be 25.1 and 19.6 kJ/mol for 1- and 2-naphthol
respectively. Our results for hydroxypyrene and pyrene in Figure C.9 suggest that the
hydroxyl group contribution to the heat of sublimation is around 28 kJ/mol.
A hydrogen bond may exist between two different molecules or within the same
molecule. Not all hydrogen bonding interactions need involve the same functional group.
For example, groups such as carbonyl (C=O) and tightly bound nitrogen (N:) display a
tendency to form hydrogen bonds with hydroxyl group. Comparison of the heats of
sublimation of perinaphthenone and 3-hydroxy-1H-phenalen-1-one in Figure C.10 show
the hydroxyl group contribution to be about 54 kJ/mol. Here, the carbonyl may be acting
as the H-bond acceptor. The hydroxyl group contribution in hydroxy anthraquinones and
87
dihydroxy anthraquinones can estimated to be between 7.5 and 45 kJ/mol [Stephenson and
Malanowski, 1987].
The formation of each hydrogen bond involves a significant decrease of free energy
and it is, therefore, obvious that systems will display a tendency to form all possible
hydrogen bonds to minimize free energy. Geometric or steric restrictions may preclude
hydrogen bond formation, if there is a large free energy penalty of some other kind
involved. Experimental evidence indicates that, as a rule, nature succeeds in building up
the unit cell of a crystal so that the hydrogen bonds would affect but slightly the
molecular packing density (for example water). The geometries of saturated hydrogen
bonds may be quite different depending on the arrangement of the donor and acceptor
groups in the molecule.
In summary, it is clear that structural elements of organic compounds are attracted to
each other in a manner that reflects several electronic forces operating simultaneously.
These attractions cause molecules to be "bound" to a condensed phase, and the stronger the
sum of the attractions, the lower the vapor pressure or the higher the boiling temperature of
the compounds will be.

88
C.4. Vapor Pressure of Coal-Tar Model Mixtures.
Coal tars are very complicated mixtures containing many hundred or thousands of
components. It is quite unclear what mixture models can be used to describe solid-vapor
and liquid-vapor equilibrium for tars. In practice ideal solution behavior has generally been
assumed for tars (or metaplast), but this is certainly suspect. Here, attention is focused
upon the special problem of mixtures of compounds containing significant amounts of
heteroatoms, as primary coal tars (and cellulose tars) would tend to have.
The mixtures for preliminary studies were prepared by the so called "quenching"
method. This involved transferring weighed amounts of two components into a stainless
steel capsule under an inert gas environment. After closing the capsule, the contents were
melted and homogenized by shaking. "Instant" cooling was achieved by dropping the
capsule into liquid nitrogen. The compositions of the mixtures were calculated from the
amounts of components added to the capsule, assuming perfect mixing. This was assumed
appropriate because no macroscopic phase separation was observed in any of the samples
reported on here.
Close to ideal mixture behavior was seen in the vapor pressures for aromatic
hydrocarbon mixtures, but care must be exercised in drawing conclusions concerning
mixture ideality. Examples of the data obtained are shown in Figures C.24 through C.26
The results reveal no major deviations from ideal mixture-like behavior, but as a result of
the choice of mixtures, a rigorous test of ideality is not possible.
Figure C.24 shows results for a mixture of anthracene and perylene, which should
form a nearly ideal binary liquid mixture (both are pure polycyclic aromatic hydrocarbons).
Results for the actual solid mixture are seen to be near the Raoult's law prediction, which in
this case is dominated by the vapor pressure of the more volatile component. Strictly
speaking, we cannot assure formation of a truly single phase system upon quenching -
phase separation might have occurred on a scale smaller than visual observation can reveal.

89
If the mixture were entirely phase separated, then behavior quite similar to what was
observed would also be expected, and the vapor pressure would be dominated by the vapor
pressure of the more volatile component. Bouwstra et al. [1985] compared "quenching"
and zone-leveling [Kolkert, 1975] techniques and showed that the preparation of mixed
organic crystals by quenching a liquid mixture often leads to inhomogenities in the solid
mixture. This is also supported by DeKruif et al. [1981b]. They showed that the vapor
pressures of the quenched samples are 10% higher than the vapor pressures of the zone-
leveled samples for p-dichlorobenzene/p-dibromobenzene mixtures. Thus, the present
results are of little value in distinguishing the nature of the mixture. Better agreement with
Raoult's law behavior might be anticipated if we performed our measurements with the
mixture in a liquid phase.
Figure C.25 shows the results for a mixture of 75% anthracene and 25%
benzofluorene. Again, this should be expected to be a nearly "ideal" system, given its
primarily PAH character. The predictions from Raoult's law are, however, again somewhat
low. Once more, phase separation must be suspected. In this case, the mixture vapor
pressure is actually quite close to the sum of the vapor pressures of the individual
components. This is precisely the behavior expected from a phase-separated mixture.
Figure C.26 shows results for a mixture of 25% anthracene and 75% benzofluorene.
Again, Raoult's law under-predicts the vapor pressure of the mixture. It should be
remembered that an under-prediction of one unit on the logarithmic scale corresponds to a
factor of 2.3 in actual vapor pressure. The curvature away from a straight line at higher
temperatures could be the result of the loss of the more volatile component during heating,
since this could influence the subsequent measurements of vapor pressure of the mixture.
There may be another explanation for the convergence with the Raoult's law results at high
temperatures as well. It is possible that the mixtures approach ideal liquid phase behavior as
the melting temperature of the mixture is approached.

90
It is noteworthy that the two different mixtures of the same pair of components gave
different mixture vapor pressures in Figures C.25 and C.26. This would argue against
purely phase-separated systems, since in that case slightly more than the vapor pressure of
pure anthracene would be obtained regardless of mixing ratio.
Coal tars are not pure polycyclic aromatic hydrocarbons, but may contain significant
numbers of heteroatoms. The mixture phenanthridine/1-hydroxypyrene gives vapor
pressure behavior as illustrated in Figure C.27. Clearly the mixture behaves highly non-
ideally, and the deviation from Raoult's law was substantial (about an order of
magnitude). The fact that the mixture shows a much lower vapor pressure was not
surprising. It is known that the hydroxyl functional group has a significant effect on the
vapor pressure. The mixture chosen for study here was selected to exhibit a very strong
interaction between a nitrogen base and the hydroxyl (OH) group. There is little doubt that
these sorts of interactions may exist in coal tars, since these materials contain both pyridinic
and hydroxyl functionalities. Finally, it should be noted that the mixture was deliberately
selected to exhibit a very strong, specific electron donor-acceptor interaction. It is likely that
in the real tar mixtures, the number of such interactions per unit volume will not be as
great.
These experiments were extended to study other heteroatom-containing mixtures that
would not exhibit such strong interactions. Results are shown in Figures C.28, C.29 and
C.30. Figure C.28 shows results for the same strong nitrogen base in mixture with a PAH
compound. The behavior is similar to what was observed in the absence of heteroatoms.
Again, it is impossible to say whether the result is simply near Raoult's law or that phase
separation has occurred. Once again, there is a tendency to approach the Raoult's law
behavior at higher temperatures.
Figures C.29 and C.30 show the results for a mixture of a cyclic sulfide and a nitrogen
base (at two different mixture compositions). Once again, aromatic mixtures containing
only sulfur and nitrogen heteroatoms exhibited vapor pressures quite close to those
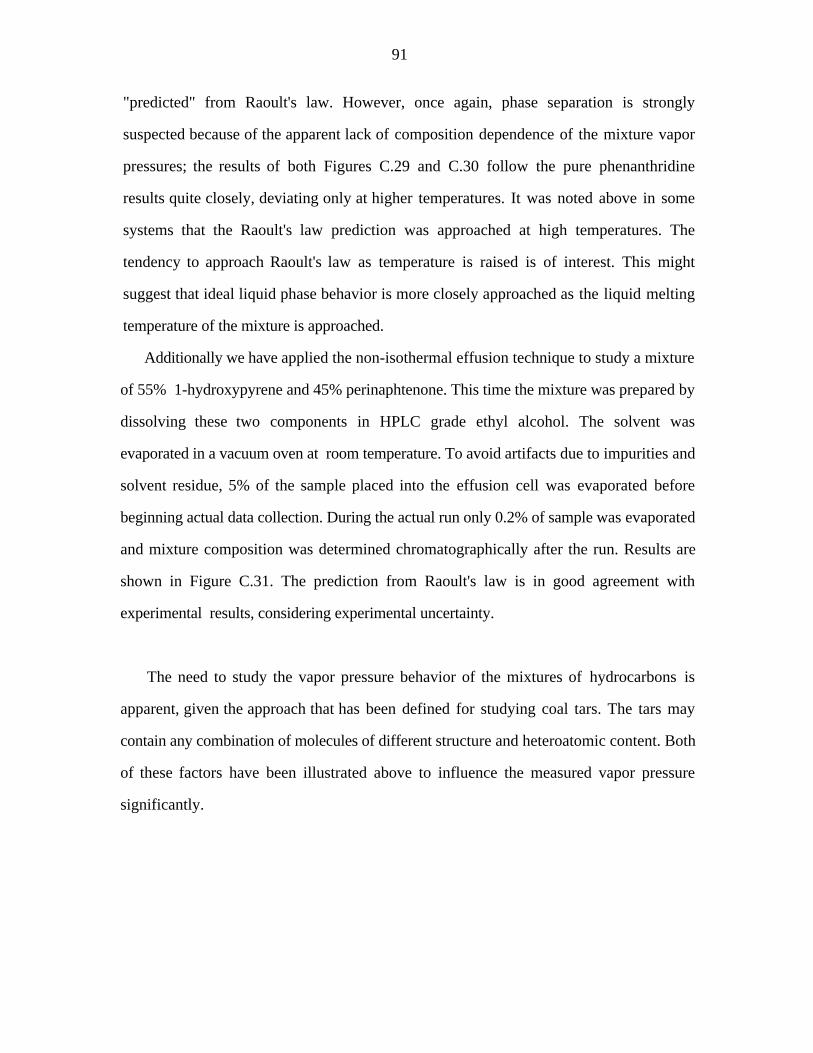
91
"predicted" from Raoult's law. However, once again, phase separation is strongly
suspected because of the apparent lack of composition dependence of the mixture vapor
pressures; the results of both Figures C.29 and C.30 follow the pure phenanthridine
results quite closely, deviating only at higher temperatures. It was noted above in some
systems that the Raoult's law prediction was approached at high temperatures. The
tendency to approach Raoult's law as temperature is raised is of interest. This might
suggest that ideal liquid phase behavior is more closely approached as the liquid melting
temperature of the mixture is approached.
Additionally we have applied the non-isothermal effusion technique to study a mixture
of 55% 1-hydroxypyrene and 45% perinaphtenone. This time the mixture was prepared by
dissolving these two components in HPLC grade ethyl alcohol. The solvent was
evaporated in a vacuum oven at room temperature. To avoid artifacts due to impurities and
solvent residue, 5% of the sample placed into the effusion cell was evaporated before
beginning actual data collection. During the actual run only 0.2% of sample was evaporated
and mixture composition was determined chromatographically after the run. Results are
shown in Figure C.31. The prediction from Raoult's law is in good agreement with
experimental results, considering experimental uncertainty.
The need to study the vapor pressure behavior of the mixtures of hydrocarbons is
apparent, given the approach that has been defined for studying coal tars. The tars may
contain any combination of molecules of different structure and heteroatomic content. Both
of these factors have been illustrated above to influence the measured vapor pressure
significantly.

92
C.5. Variation of Vapor Pressure with Temperature-Summary.
The latent heat of vaporization decreases with temperature and reaches zero at the
critical point. The problem of correlation and prediction of enthalpies of vaporization
between the triple point (Ttr) and the critical point (Tc) has not been fully solved [Svoboda
and Basarova, 1994]. The problem of extrapolating ∆Hvap to Tc arises because of a need to
describe two entirely different temperature dependencies. Above the normal boiling point to
about 2/3 of the distance to Tc, the decrease of ∆Hvap with temperature is quit slow. In the
last third there follows a steep decrease towards Tc [Svoboda and Smolova, 1994]. This is
a clear indication of the danger in blindly extrapolating vapor pressure data over a wide
range of temperatures. To illustrate the problem, consider some literature data presented in
Table C.2.Table C.2. Literature data for some aromatic compounds
compound MW[g/mol]
∆Hvap,tp[kJ/mol]
∆Hvap,bp[kJ/mol]
Tb [C]exper.
Tb[C]est
P error% at bp
naphthalene 128 50.9 43.18 218 208.5 25%
fluorene 166 62.3 58.15 294 287 35%
anthracene 178 59.9 52.35 341.5 336 25%
phenanthrene 178 69.1 52.72 338 313 50%
pyrene 202 72.9 65.81 393 378 30%
fluoranthene 202 78.8 66.52 383 374 40%
crysene 228 77.5 69.54 448 420 35%
The normal boiling points are used for comparison because of the lack of other
experimental values in the literature [White, 1986]. The experimental normal boiling points
and heats of vaporization at the boiling points are obtained from White [1986]. The heats of
vaporization at the triple point (∆Hvap,tp), estimated boiling points, and the vapor pressure
estimation error at the boiling point are shown. These estimates were calculated using
available vapor pressure data at the triple point. The errors in estimated boiling points using
the ∆Hvap values at the triple point suggest that the assumption of a constant heat of
vaporization is not so bad. If it is necessary to assume constant ∆Hvap in order to
extrapolate measured vapor pressure up to the boiling point for coal tars, these results give
us confidence in doing so. Figure C.32 graphically supports this assumption. In this case,

93
a constant ∆Hvap was assumed between the boiling and melting points. Thus, equation
{A.7} could be used for the purpose of correlating tar vapor pressures.
Experimental determination of the critical temperatures (Tc) for high molecular weight
substances has proven difficult and subject to high uncertainty because of thermal
decomposition and other reactions which occur near the critical point. Experimental values
are available only for benzene, naphthalene, anthracene and phenanthrene. There are
multiple ways of estimating Tb and Tc of large PAH, but unfortunately these show a lack
of agreement. For example, the critical temperatures for PAH with molecular weight 300
daltons can be estimated to be between 750 and 1100 °C, for 400 daltons to be between 900
and 1200, and for 600 daltons to be between 1100 and 1700 °C using the methods of
Forman and Thodos [Homann, 1984], Somayajulu [1989] and Joback [Löffler and
Homann, 1990] combined with several boiling point estimation techniques (Homann,
1984; Frenklach et al., 1984; Kroto and Mckay, 1988). Estimates of critical temperatures
and normal boiling points for some PAH, obtained from Wang and Frenklach [1994], are
listed in Table C.3.

94
Table C.3. Normal boiling points and estimated criticaltemperatures for some PAH.
compound MW Tb[C] Tc[C]
anthracene 178.2 340 628
phenanthrene 178.2 340 628
pyrene 202.3 393 695
1,2-benzofluorene 216.3 413 714
1,2-benzanthracene 228.3 435 723
chrysene 228.3 448 756
triphenylene 228.3 425 723
perylene 252.3 350...400 608...679
acenaphthanthracene 254.3 193.... 194 377...379
picene 278.3 518...520 827...829
coronene 300.4 525 838The critical temperatures were estimated by the group contribution technique
[Somayajulu, 1989]
The coal pyrolysis experiments of interest here occur in the temperature region between
500 and 1000°C. Thus pure compounds with molecular weights up to 300 daltons may not
even exist as a liquid at these temperatures, nor is it likely that mixtures very rich in these
compounds can either. Tars, however, are complicated mixtures of thousands compounds
exhibiting molecular weights that are well over 1000, centered in the range of 200 to 600
daltons and extending much higher in the "metaplast" phase of the coal. Thus, it is evident
that there cannot be a single critical point for a coal tar, but rather a continuous change of
critical conditions with different compositions, temperatures and pressures as the pyrolysis
process occurs. All that may be concluded is that the pyrolysis experiments are generally
far away from the gas-liquid critical region, and that the enthalpies of
sublimation/vaporization determined here have relevance.

95
C.6. Vapor Pressure Correlation for Aromatic Compounds.
As emphasized previously, the primary motivation of this work was to develop a vapor
pressure correlation for coal tars based upon actual measurements on the tars.
As a first step, a new vapor pressure correlation has been developed based on the
sublimation vapor pressure data for 34 model compounds, obtained either from our
measurements or from the literature. The purpose behind developing this correlation is to
provide a way of estimating vapor pressure over a broad range of pressure with the only
inputs being the temperature and molecular weight. This is similar to the empirical
correlation of vapor pressures proposed by Suuberg et al.[1979], where it is now assumed
that the heat of sublimation and the entropy of sublimation are functions of molecular
weight only, and that all compounds with the same molecular weight generate similar vapor
pressures. In this approach we use the integrated form of the Clausius-Clapeyron equation,
where the constants A and B are functions of the molecular weight, estimated from the raw
experimental values shown in Figures C.15, C.19 and C.22. Therefore, under sublimation
conditions for aromatic compounds:
P = 6.954 •108 exp(0.039M)exp −63M
T
{C.1}
In this expression, P is in torr, T is in K, and M is in daltons.
Under pyrolysis conditions, vaporization has been assumed to occur from the liquid
phase. The heat of vaporization ∆Hvap of the hypothetical liquid at any temperature below
the melting point may be considered as the difference between the heat of sublimation
(∆Hsub) at this temperature and the heat of fusion ∆Hfus (which is usually less than a fourth
of ∆Hsub). The calculation of the entropy of vaporization could be based on the common
identity that, at any temperature ∆S=∆H/T. The hypothetical subcooled liquid can be
considered as an imaginary liquid that is cooled below its melting point without allowing it
to crystallize.
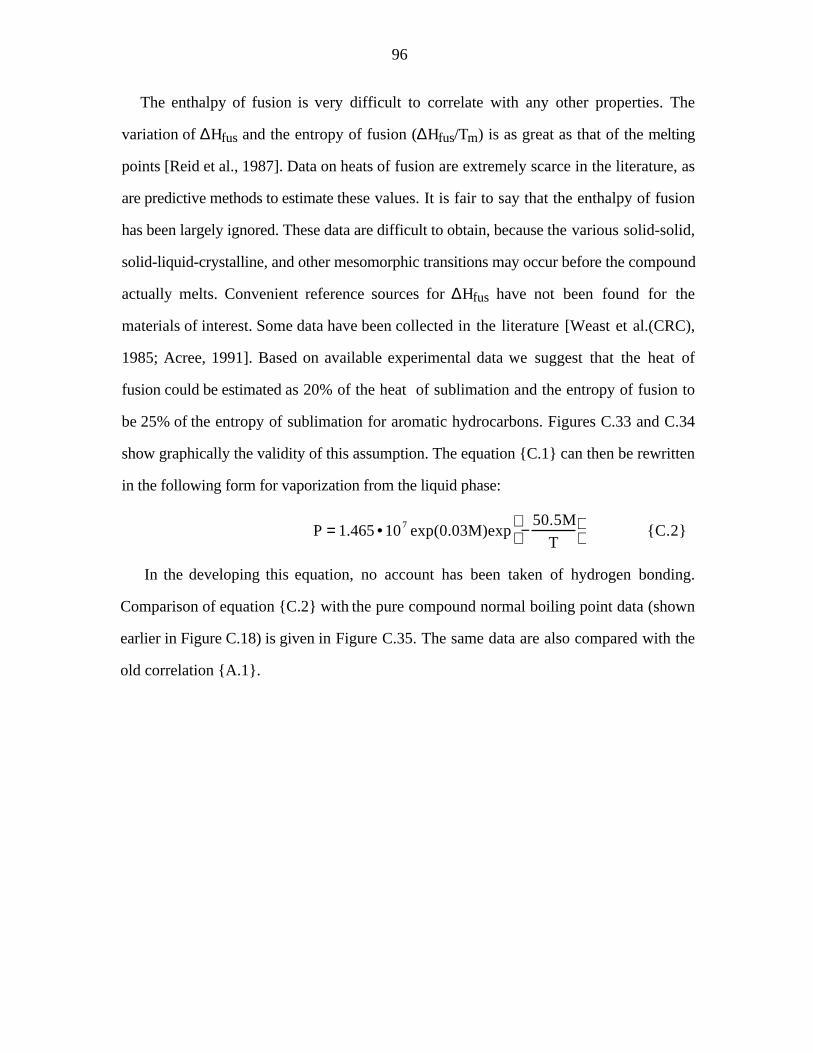
96
The enthalpy of fusion is very difficult to correlate with any other properties. The
variation of ∆Hfus and the entropy of fusion (∆Hfus/Tm) is as great as that of the melting
points [Reid et al., 1987]. Data on heats of fusion are extremely scarce in the literature, as
are predictive methods to estimate these values. It is fair to say that the enthalpy of fusion
has been largely ignored. These data are difficult to obtain, because the various solid-solid,
solid-liquid-crystalline, and other mesomorphic transitions may occur before the compound
actually melts. Convenient reference sources for ∆Hfus have not been found for the
materials of interest. Some data have been collected in the literature [Weast et al.(CRC),
1985; Acree, 1991]. Based on available experimental data we suggest that the heat of
fusion could be estimated as 20% of the heat of sublimation and the entropy of fusion to
be 25% of the entropy of sublimation for aromatic hydrocarbons. Figures C.33 and C.34
show graphically the validity of this assumption. The equation {C.1} can then be rewritten
in the following form for vaporization from the liquid phase:
P = 1.465 •107 exp(0.03M)exp −50.5M
T
{C.2}
In the developing this equation, no account has been taken of hydrogen bonding.
Comparison of equation {C.2} with the pure compound normal boiling point data (shown
earlier in Figure C.18) is given in Figure C.35. The same data are also compared with the
old correlation {A.1}.

97
-40
-35
-30
-25
-20
-15
-10
-5
0
ln P
[ t
orr
]
100 200 300 400 500 600
Molecular Weight [g/mol]
Figure C.1. Vapor pressure data for aromatic compounds at 75°C.
cata-condensednon-linearwith phenyl substitutentswith alkyl substitutentsS, N, O containingOH and OH/O containing

98
-8.5
-8
-7.5
-7
-6.5
-6
-5.5
-5
-4.5ln
P[
torr
]
0.003 0.00305 0.0031 0.00315 0.0032 0.00325 0.0033
1/T[K]Figure C.2. Effusion method applied to solid phenanthrene.
Solid points are from this study, open points are calculated from references shown.
This studyHansen, 1986DeKruif, 1989Kelley/Rice, 1964Sonnefeld, 1983
ln P = 29.494 -11423/T ln P = 26.709 -10503/T ln P= 27.766 -10912/T
ln P=31.239 - 12012.8/Tln P = 29.355 -11443/T

99
-11
-10
-9
-8
-7
-6
-5
-4
ln P
[ to
rr]
0.0027 0.0028 0.0029 0.003 0.0031 0.0032
1/T[K]Figure C.3. Effusion method applied to solid pyrene.
Solid points are from this study, open are calculated from references.
This studySonnefeld, 1983Malaspina, 1974Malanowski, 1987Sasse/Merlin, 1988Hoyer, 1958Bardley, 1953
ln P= 28.221-12130/T

100
-12
-10
-8
-6
-4
-2
0.0019 0.002 0.0021
ln P
[to
rr]
0.0022 0.0023 0.0024
lnP[torr] = 26.018 -15753/T lnP[torr] = 27.573 -16332/T lnP[torr] = 22.446 -13259/T
1/T[K]Figure C.4. Effusion method applied to solid coronene.
The effusion method was used by J.J. Murray and N. Wakayama.
this laboratoryMurray et al., 1974Stephenson/Malanowski 1987Wakayama/Inokuchi, 1967lnP[torr] = 13.582 -8251.8/T

101
-10
-9.5
-9
-8.5
-8
-7.5
ln P
[ to
rr ]
-7
-6.5
0.0024 0.00242 0.00244 0.00246 0.00248
1/T [ K ]Figure C.5. Knudsen effusion method applied to solid perylene.
Solid points are from this study, open are calculated from references.
this study ( 99%)Stephenson/Malanowski, 1987Stephenson/Malanowski, 1987this study (95%)
ln P = 29.993 -15621/T
ln P = 32.114 -16714/T
ln P = 31.799 -16599/T
ln P = 29.585 -15529/T
0.0025 0.00252

102
-11
-10
-9
-8
-7
-6
-5
-4
ln P
[ to
rr ]
0.0025 0.0026 0.0027 0.0028 0.0029 0.003
Figure C.6. Effusion method applied to solid 2,3-benzofluorene.
this studyln P = 31.432 -14354/T
1/T [ K ]

103
N
-8
-7.5
-7
-6.5
-6
-5.5
0.00295 0.00299 0.00303
ln P
[ to
rr ]
0.00307 0.00311 0.00315
1/T[K]
Figure C.7. Effusion technique applied to solid phenanthridine.
this study
McEachern, 1975
lnP[torr] = 28.71-11616/T[K]
ln P[torr] = 27.347 -11367/T[K]

104
S
-11
-10
-9
-8
-7
-6
-5ln
P [
torr
]
0.0025 0.0026 0.0027 0.0028 0.0029 0.003
1/T[K]Figure C.8. Effusion method applied to solid 1,2-benzodiphenylene sulfide.
1,2-benzodiphenylene sulfideln P= 29.163 -13461/T

105
OH
-10
-9
-8
-7
-6
-5
-4
ln P
[ to
rr ]
0.0025 0.0026 0.0027 0.0028 0.0029 0.003 0.0031 0.0032
1/TFigure C.9. Effusion method applied to solid 1-hydroxypyrene.
Data for pyrene are shown for comparison.
1-hydroxypyrenepyrene
ln P = 32.88 -15513/T
ln P = 28.221-12130/T

106
O
OHO
-10
-9.5
-9
-8.5
-8
-7.5
-7
-6.5
-6
lnP
[ to
rr ]
0.0023 0.0025 0.0027 0.0029 0.0031
1/T[K]
Figure C.10. Effusion method applied to solid perinaphthenone and 3-hydroxy-1H-phenalen-1-one.
perinaphthenone3-hydroxy-1H-phenalen-1-one
lnP[torr]= 27.308 -11690/T[K]
lnP[torr] = 35.544 -18220/T[K]
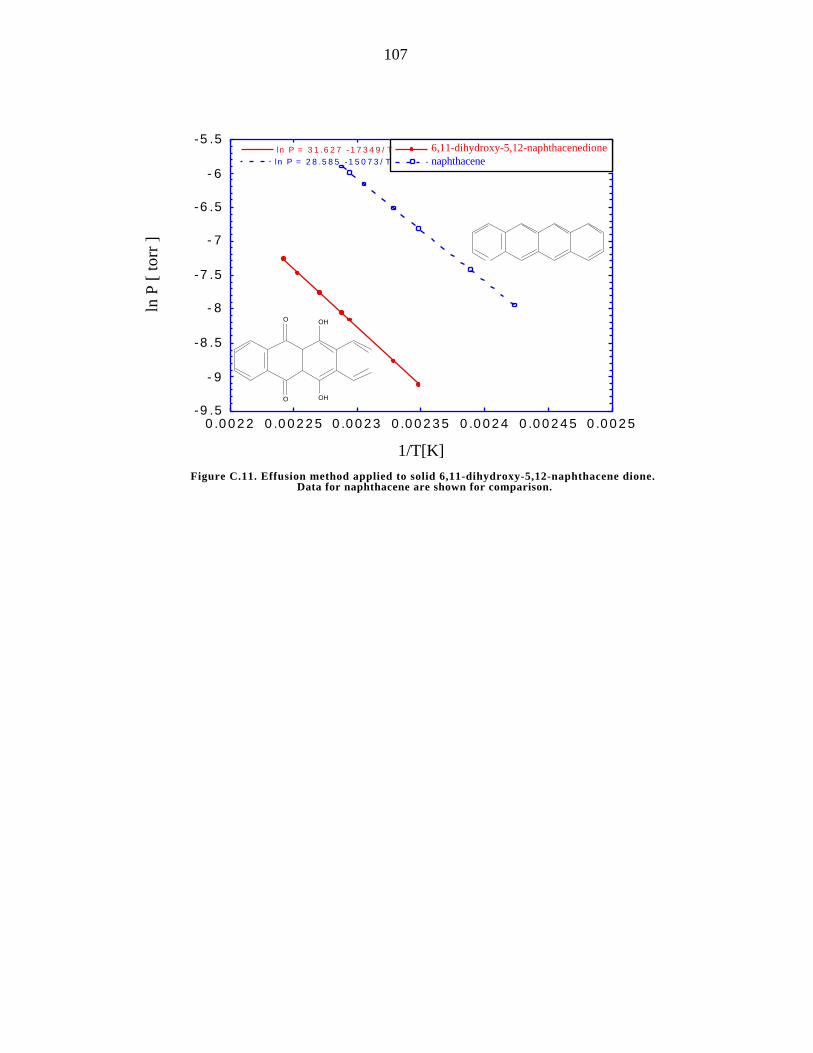
107
O
O OH
OH
-9.5
-9
-8.5
-8
-7.5
-7
-6.5
-6
-5.5ln
P [
torr
]
0.0022 0.00225 0.0023 0.00235 0.0024 0.00245
1/T[K]
Figure C.11. Effusion method applied to solid 6,11-dihydroxy-5,12-naphthacene dione. Data for naphthacene are shown for comparison.
6,11-dihydroxy-5,12-naphthacenedionenaphthacene
0.0025
ln P = 31.627 -17349/Tln P = 28.585 -15073/T
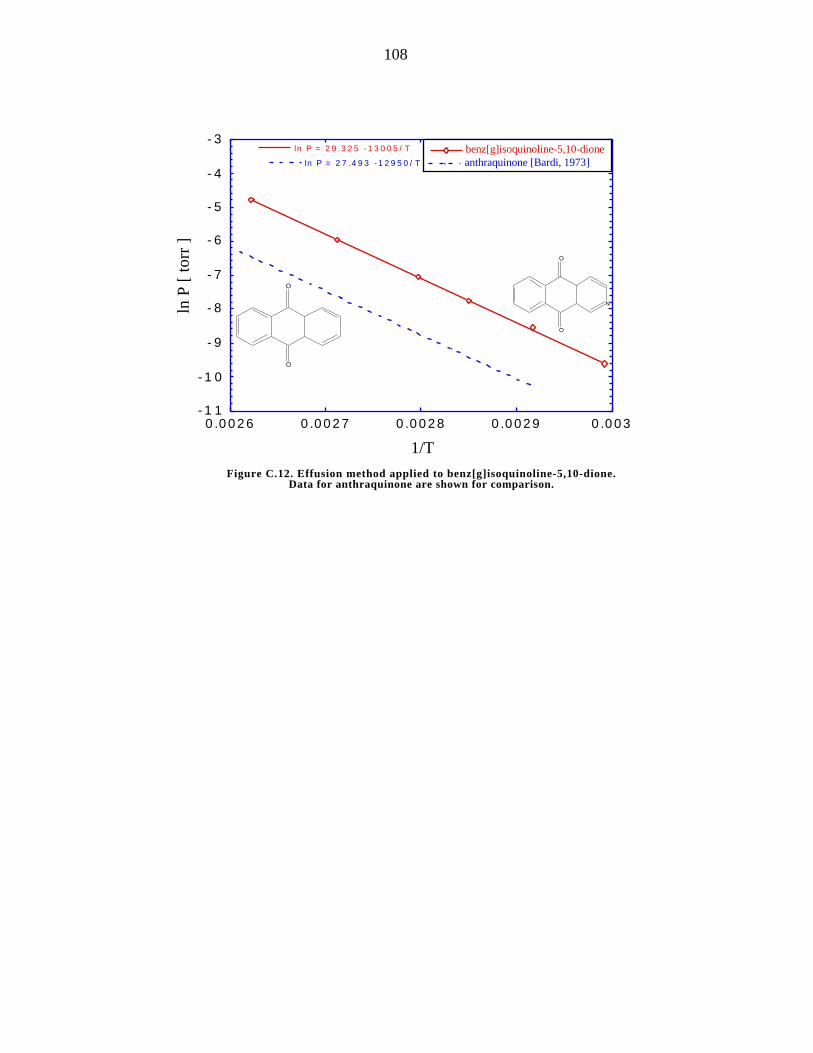
108
N
O
O
O
O
-11
-10
-9
-8
-7
-6
-5
-4ln
P [
torr
]
-3
0.0026 0.0027 0.0028 0.0029 0.003
1/T
Figure C.12. Effusion method applied to benz[g]isoquinoline-5,10-dione.Data for anthraquinone are shown for comparison.
benz[g]isoquinoline-5,10-dioneanthraquinone [Bardi, 1973]
ln P = 29.325 -13005/T
ln P = 27.493 -12950/T

109
COOH
OOCCH3
-9.5
-9
-8.5
-8
-7.5
-7
-6.5
-6
ln P
[to
rr]
0.00285 0.0029 0.00295 0.003 0.00305 0.0031
1/T [K]
Figure C.13. Effusion method applied to solid Aspirin.The main salicylic acid acetate component is illustrated.
ln P = 33.347 -13792/T

110
60
80
100
120
140
160
180
200
∆H [
kJ/
mol
]
5 10 15 20 25 30 35
C number
Figure C.14a. Enthalpy of sublimation against carbon number for PAH.
linear aromaticsother aromaticsperi-condensed aromatics

111
60
80
100
120
140
160
∆H [
kJ/
mol
]
180
200
100 150 200 250 300
MW [ g/mol]
Figure C.14b. Enthalpy of sublimation against molecular weight for PAH.
linear aromaticsother aromaticsperi-condensed aromatics
350 400

112
-8
-7.5
-7
-6.5
-6
-5.5
-5
-4.5
ln P
[mm
Hg]
0 .0022 0.0023 0.0024 0.0025 0.0026 0.0027 0.00281/T[K]
Figure C.15. Comparison of the vapor pressure data on selected aromatic hydrocarbons M(C1 8 H1 2 )=228.19
NaphthaceneChryseneTriphenylene
1,2-Benzanthracene

113
60
80
100
120
140
160
180
∆Hsu
b [ k
J/m
ol]
100 200 300 400 500 600
Molecular Weight [g/mol]
Figure C.16. Enthalpy of sublimation against molecular weight for alkyl and phenyl substituted PAH.
alkyl aromaticsphenyl aromaticslinear aromaticsperi-condensed aromatics

114
-16
-15
-14
-13
-12
-11
-10
-9
ln P
[ t
orr
]
0.00315 0.00325 0.00335 0.00345 0.00355
1/T[K]Figure C.17. Comparison of the solid vapor pressure data of anthracene (MW 178),
9,10-dimethylanthracene (MW 206) , and 5- butylanthracene (MW 234). [Data from Stephenson and Malanowski, 1987]
anthracene9,10-dimethylanthracene5-butylanthracene

115
200
250
300
350
400
450
500
550T
b[°C
]
100 150 200 250 300 350Molecular Weight [g/mol]
Figure C.18. Normal boiling point against molecular weight for PAH and alkyl substituted PAH. [Data from Bjorseth, 1983]
aromaticsalkyl aromatics

116
60
80
100
120
140
160
∆H [
kJ/
mol
]
100 150 200 250 300 350 400Molecular Weight [g/mol]
Figure C.19. Enthalpy of sublimation against molecular weight of heteroatom containing PAH.Data for linear and peri-condensed PAH are shown for comparison.
linear aromaticsperi-condensed aromaticsheteroatomic aromatics

117
S
O
O
-9
-8
-7
-6
-5
-4
-3
-2
-1ln
P [
mm
Hg
]
0.0029 0.003 0.0031 0.0032 0.0033 0.00341/T [K]
Figure C.20. Comparison of vapor pressures of four aromatic compounds. [fluorene from Sato et al., 1986; dibenzofuran, 9-fluorenone,
and dibenzothiophene from Hansen and Eckert, 1986]
fluorenedibenzofuran9-fluorenonedibenzothiophene
ln P= 28.086 -10530/T ln P = 25.732 -9513/T
ln P = 28.375 -11158/T ln P = 28.717 -11198/T

118
N
N
N
S
S
-9
-8
-7
-6
-5
-4
ln P
[ to
rr ]
-3
0.0028 0.00285 0.0029 0.00295 0.003 0.00305
1/T[K]
Figure C.21. Comparison of vapor pressures of four aromatic compounds.[data from Stephenson and Malanowski, 1987]
anthraceneacridinephenazinethianthrene
lnP = 28.715 -12122/Tln P = 27.288 -11099/T ln P = 26.589 -11042/T
lnP = 27.8 -11790/T
0.0031
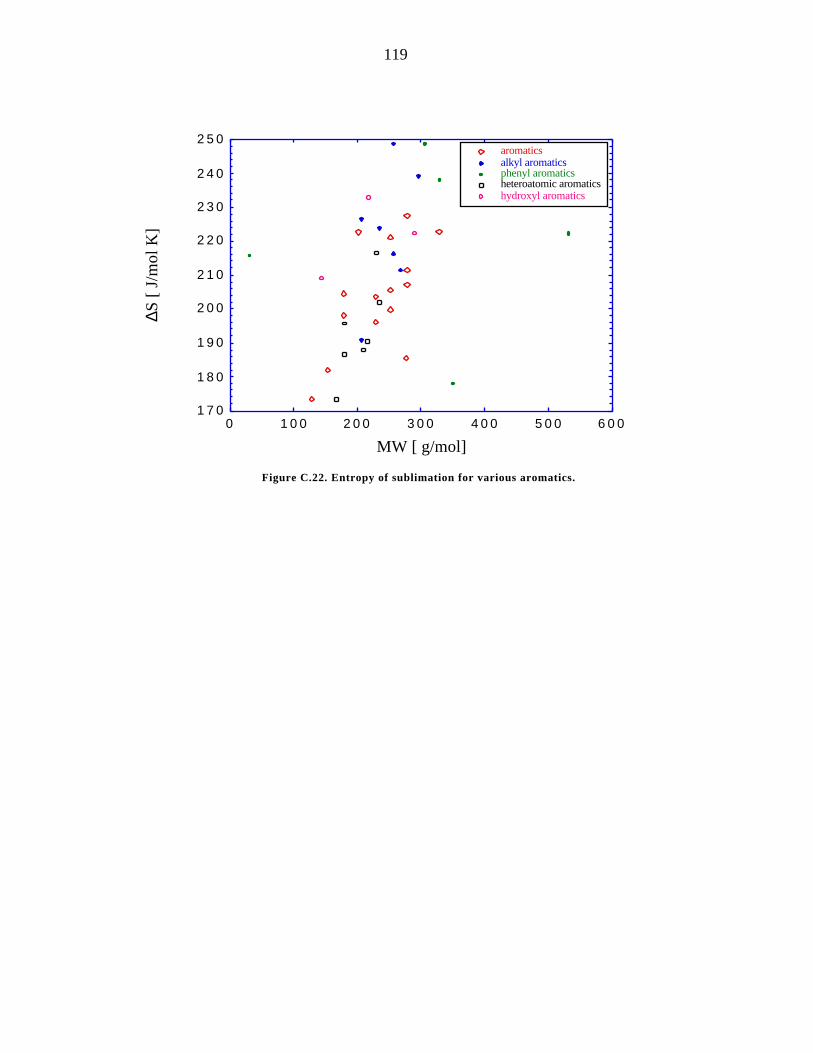
119
170
180
190
200
210
220
230
240
250∆S
[ J
/mol
K]
0 100 200 300 400 500 600
MW [ g/mol]
Figure C.22. Entropy of sublimation for various aromatics.
aromaticsalkyl aromaticsphenyl aromaticsheteroatomic aromaticshydroxyl aromatics

120
-11
-10
-9
-8
-7
-6
-5
-4
-3ln
P [
torr
]
0.00315 0.00325 0.00335 0.00345 0.00355
ln P = 30.127 -11225/Tln P = 26.902 -10561/T
ln P= 23.193 -8204.4/T
1/T [ K ]
Figure C.23. Comparison of vapor pressures of naphthalene, 1-naphtholand 2-naphthol. [Data from Stephenson and Malanowski, 1987]
1-naphthol2-naphtholnaphthalene
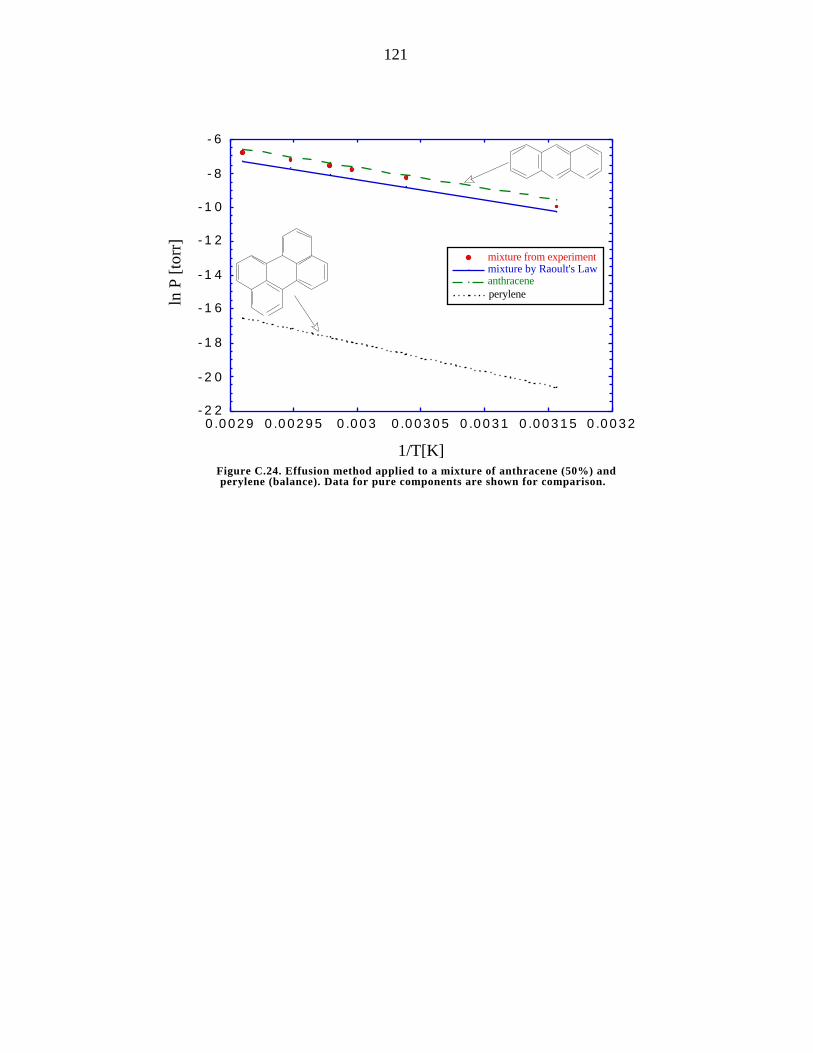
121
-22
-20
-18
-16
-14
-12
-10
-8
-6
ln P
[to
rr]
0.0029 0.00295 0.003 0.00305 0.0031 0.00315 0.0032
1/T[K]Figure C.24. Effusion method applied to a mixture of anthracene (50%) andperylene (balance). Data for pure components are shown for comparison.
mixture from experimentmixture by Raoult's Lawanthraceneperylene

122
-14
-13
-12
-11
-10
-9
-8
-7
-6ln
P [
torr
]
0.0029 0.00295 0.003 0.00305 0.0031 0.00315
1/T [ K ]Figure C.25. Effusion method applied to mixture of anthracene 75 % and
benzofluorene (balance). Data for pure components are shown for comparison.
experimentalRaoult's lawanthracenebenzofluorene

123
-14
-13
-12
-11
-10
-9
-8
-7ln
P [
torr
]
0.00295 0.003 0.00305 0.0031 0.00315
1/T [ K ]Figure C.26. Effusion method applied to mixture of anthracene (25%) and
benzofluorene (balance). Data for pure components are shown for comparison.
experimentalRaoult's lawanthracenebenzofluorene
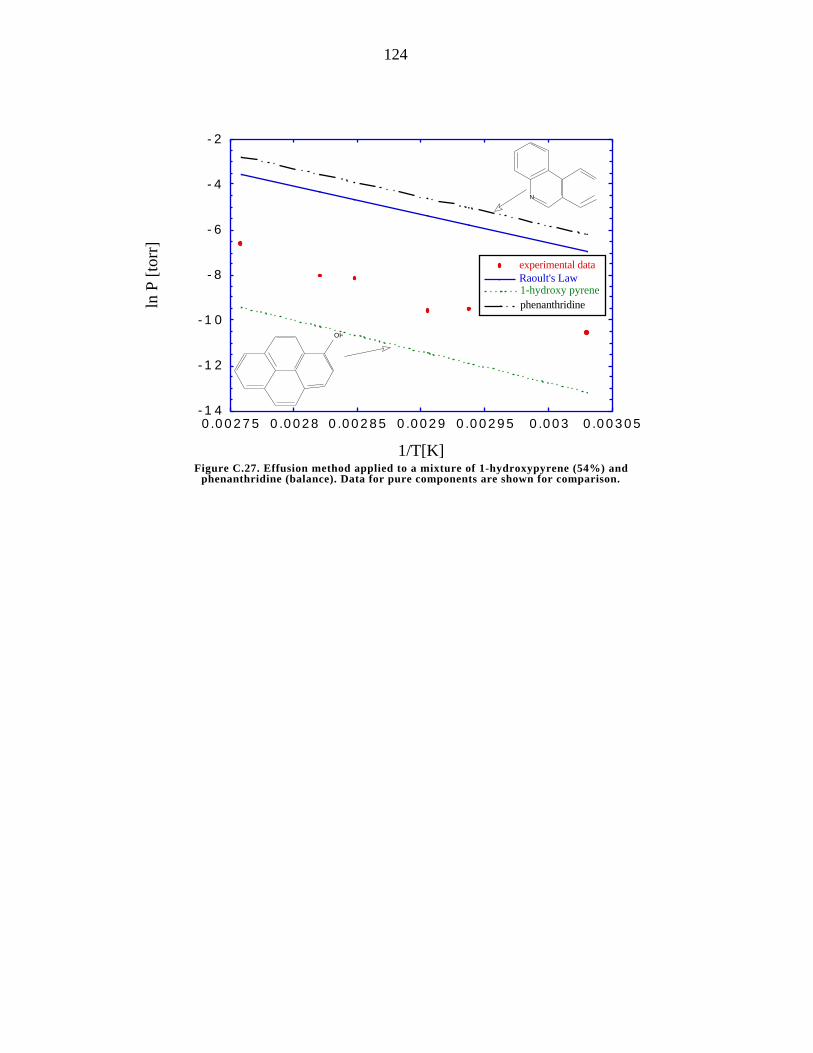
124
N
OH
-14
-12
-10
-8
-6
-4
-2ln
P [
torr
]
0.00275 0.0028 0.00285 0.0029 0.00295 0.003 0.00305
1/T[K]Figure C.27. Effusion method applied to a mixture of 1-hydroxypyrene (54%) and phenanthridine (balance). Data for pure components are shown for comparison.
experimental dataRaoult's Law1-hydroxy pyrenephenanthridine

125
N
-22
-17.5
-13
-8.5
-4
0.003075 0.003133 0.003192 0.00325
ln P
[tor
r]
1/T[K]Figure C.28. Effusion method applied to a mixture of phenanthridine (50%) and
perylene (balance). Data for pure components are shown for comparison.
experimental dataRaoult's Lawphenanthridineperylene

126
S
N
-15
-12.75
-10.5
-8.25
-6
0.00305 0.0031 0.00315 0.0032
ln P
[ to
rr ]
0.00325
1/T[K]Figure C.29. Effusion method applied to a mixture of phenanthridine (50%)
and 1,2-benzodiphenylene sulfide (balance). Data for pure components shown for comparison.
experimentalRaoult's lawphenathridine1,2-benzodiphenylene sulfide

127
S
N
-16
-14
-12
-10
-8
-6
ln P
[to
rr]
0.00305 0.0031 0.00315 0.0032 0.00325 0.0033
1/T[K]Figure C.30. Effusion method applied to a mixture of phenanthridine (75%)
and 1,2-benzodiphenylene sulfide (balance).Data for pure components are shown for comparison.
experimentalRaoult's lawphenanthridine1,2-benzodiphenylene sulfide

128
OH
O
-16
-14
-12
-10
-8
-6ln
P [
torr
]
0.00292 0.00295 0.00298 0.00301 0.00304
1/T [ K ]Figure C.31. Non-isothermal effusion method applied to a mixture
of 1-hydroxypyrene (mole fraction 0.55) and perinaphthenone (balance).
experimental1-hydroxypyreneperinaphthenoneRaoult's law

129
-8
-6
-4
-2
0
2
4
6
8
ln P
[ to
rr]
0.0015 0.002 0.0025 0.0031/T [ K ]
Figure C.32. The vapor pressure curve for pyrene.
Tboiling
T melting

130
10
15
20
25
30
35
∆Hfu
s/∆H
sub*1
00 [
%]
100 150 200 250 300
MW[g/mol]
Figure C.33. ∆Hfus
/∆Hsub
ratio for aromatic hydrocarbons.
aromaticsheteroatomic aromatics

131
15
20
25
30
35
∆Sfu
s/∆S su
b*100
[%
]
100 150 200 250 300
MW [g/mol]Figure C.34. ∆S fus/∆S sub ratio for aromatic hydrocarbons.
aromaticsheteroatomic aromatics

132
0
500
1000
1500
0 200
Nor
mal
boi
ling
poi
nt T
[ °
C ]
400 600 800 1000Molecular Weight [ g/mol]
Figure C.35. Comparison of the equation {C.2} and the Unger-Suuberg correlation {A.1} with pure compound boiling point data at a
pressure of 760 torr.
equation {C.2}
Suuberg et al. [1979]
aromaticsalkyl aromatics

133
Chapter D. Vapor Pressures and Heat of Vaporization of
Model Compounds and Primary Cellulose Tar.
In this laboratory, we have for some time been concerned with the behavior of cellulose
during pyrolysis. This material is of some interest as a model for "biomass", an often-
discussed alternative energy source. It was realized that this material presented both some
interesting questions in its own right, as well as some interesting opportunities as another,
simpler model for the kinds measurements we perform with coal tar.
There is some evidence that the mass transfer of tar plays a key role in cellulose
pyrolysis. Under conditions in which the tar cannot rapidly escape the solid phase it cracks
to char. This is similar to what happens during coal pyrolysis. Since the vapor pressure of
the tar may be a key factor in determining its escape rate, we decided to extend these
studies, using our equipment for vapor pressure measurements to primary cellulose tars.
The cellulose tar has a much narrower distribution of molecular weights than does coal tar,
and is much more homogenous. Thus it was better to develop the methods to be used for
coal tars on this simpler model system first.
D.1. Cellulose Tar Characteristics and Its Volatility.
Cellulose releases copious amounts of tar during pyrolysis. One difference between
cellulose and coal is the molecular weight of the tar species involved. In coal pyrolysis, the
tar exhibits molecular weight distributions up to order of a thousand daltons [Suuberg,
1985; Solomon et al., 1992]. The cellulose tar species in contrast have number average
molecular weights around 200 daltons and a narrower molecular weight distribution than
coal tars.
Another important difference between coal and cellulose pyrolysis is the temperature
range of tar evolution. Typical cellulose pyrolysis results obtained from the TGA apparatus

134
are illustrated in Figure D.1, which compares the rates of mass loss from a standard open
TGA pan, and from a DSC pan which was used to contain the sample in the TGA. Figure
D.1 shows that the tar evolution (which represents most of the mass loss) at 6°C/min
heating rate occurs in a narrow range of temperatures between 310 and 370°C. At
comparable heating rates coal pyrolysis occurs over a much broader range of temperatures,
not reaching completion until over 500°C [Solomon et.al., 1992]. This means that higher
molecular weight (and thus less volatile) tars can evaporate during coal pyrolysis because
of the higher temperatures that are involved.
To begin to address the cellulose tar volatility issue, experiments were performed in
which tar from cellulose pyrolysis experiments was collected and recoated onto a wire
mesh, which was then heated from room temperature in the heated wire mesh reactor. The
results are shown in Figure D.2. The experiments were performed at a heating rate of 60
°C/min, in inert gas. Each datum shows the result of a single experiment in which a few
milligrams of tar was heated to the indicated temperature at 60 °C/min, and then held for
one minute before being permitted to cool at a rate of several hundred degrees per second.
These experiments define a pseudo-distillation curve for the tar. Bubble formation in the
tarry mass was noted at around 260°C, suggesting boiling. More precise measurements of
vapor pressure will be shown below. The results of Figure D.2 indicate that most tar
evaporation occurs below the temperature range associated with active pyrolysis. Thus in
the absence of mass transport limitations, tars should immediately evaporate, as commonly
assumed [e.g., Ponder et al., 1992]. The results of Figure D.2 however emphasize that
there are finite kinetics associated with evaporative loss of tar, even from a heated wire
mesh. These will be considered further below.
A second notable feature in Figure D.2 is that the tar cannot all be vaporized. The
fraction of tar vaporized reaches an asymptote of around 76% at 320-350°C, which is the
range of temperature at which the pyrolytic pathways are active in cellulose itself. Since all
of the tar on the mesh had earlier vaporized (and had been soluble), its inability to

135
completely re-evaporate is associated with pyrolytic reactions driving some of the tar to a
non-volatile char. Alternatively, during reheating the tar might be undergoing reactions
involving pathways not available, or suppressed, during the original cellulose pyrolysis.
The heat of vaporization of cellulose tars has not been reported and direct calorimetric
measurements of this latent heat proved to be impossible, because the cellulose tar was
observed to thermally degrade in such experiments. The Clapeyron equation {A.2} relates
the heat of vaporization to the temperature derivative of the vapor pressure. Thus, the
enthalpy of sublimation of the tar can be estimated from the Clausius-Clapeyron equation,
using suitable vapor pressure data obtained under very low temperature conditions, at
which the tars do not degrade.
According to the literature [Haplern and Patai, 1969; Shafizadeh and Fu, 1973; Halpern
et al., 1973; Shafizadeh et al., 1979; Shafizadeh, 1975] the pyrolysis of the cellulose under
vacuum and atmospheric pressure gives a tar containing various amounts of 1,6-anhydro-
β-D-glycopyranose (known as levoglucosan), 1,6-anhydro-β-D-glycofuranose, α−and β-
D-glucose, disaccharides (cellobiose) and their further condensation products, consisting of
various oligo- and polysaccharides (polymeric materials, that are similar to condensation
products of levoglucosan), and some dehydration products ( 3-deoxy-D-hexosulose and its
isomer, levoglucosenone). It has shown also that the pyrolytic reaction may produce a
variety of products through concurrent and consecutive reactions. Vacuum or atmospheric
pyrolysis of cellulose provides a tar fraction containing mainly 1,6-anhydro-β-D-
glucopyranose and its condensation products (20 to 60 % of tars). The fraction of
levoglucosan in this mixture varies and depends upon conditions.
Because cellulose tar vapor pressures have not been previously determined, we set
about to do so. In order to validate the work performed with the tars, we have first obtained
results with model compounds.
D.2. Vapor Pressure of the Cellulose Tar Related Compounds.

136
In this study we have examined the vapor pressures of levoglucosan (of 99% purity,
from Adrich Chemical company, Inc.) between 71 and 140°C; D-(+)−glucose (of 99.5%
purity from the Sigma Chemical Company) between 122 and 133 °C; D-xylose or wood
sugar (of 99% purity, from Adrich Chemical company, Inc.) between 97 and 122 °C; and
cellobiose (of 99% purity, from Adrich Chemical company, Inc.) between 201 and 215
°C. The enthalpies of sublimation have been estimated from the vapor pressure data. Vapor
pressures and heats of sublimation of these solid compounds have not previously been
reported. Only one study of liquid levoglucosan has been found in the literature [Enstein,
1964].
The chemicals were used as supplied. As these materials are hygroscopic, 5% of each
sample's mass was evaporated as a precaution before beginning actual vapor pressure data
collection. The presumption was that any water present in the samples would be evaporated
in this initial 5% mass loss. Since these compounds are quite thermally labile, the
differential scanning calorimeter was used to study the thermal behavior of the compounds
in the temperature region of interest. The DSC would reveal where any thermally
significant reaction events took place, so that the temperatures of measurement could be
kept below such temperatures. The latent heats of fusion of the samples have been also
estimated from the DSC results. This latent heat is important, to the extent that any of the
measured vapor pressure results would be extrapolated to higher temperatures, at which the
materials of interest would be liquids as opposed to solids.
The vapor pressure data have been obtained using the isothermal method in both the
"forward" direction (the temperature was raised stepwise during data collection) and in the
"backward" direction (the temperature was decreased stepwise after achieving the highest
temperature of the experiment).
D.2.1. Vapor Pressure of Levoglucosan.

137
Levoglucosan or 1,6-anhydro-β-D-glycopyranose is known to be the major component
of cellulose tars [Ponder et al., 1992; Shafizadeh et al., 1979; Mok and Antal, 1983;
Arseneau, 1971]. Figure D.3 shows our Differential Scanning Calorimetry (DSC)
experiments for levoglucosan. Two well-established reversible phase transitions are
apparent from this plot at 113 °C and at 183°C. It has been suggested by Shafizadeh [1971]
that there is a plastic crystalline phase transition around 113°C and that melting occurs
around 180°C. Similar solid state transition behavior has also been shown for the stereo
isomers of the levoglucosan and for the 2-deoxy derivative, but not for the other closely
related compounds [Shafizadeh, 1971]. From our DSC experiments the heat of phase
transitions can be estimated 24.5 kJ/mol and 3.2 kJ/mol respectively. The second feature
visible on Figure D.3 is a levoglucosan decomposition event above 250°C. This is thought
to occur before boiling and therefore it is not possible to clearly determine the boiling point
from the DSC data.
The vapor pressure results before and after the first so called "solid state phase
transition" are shown in Figure D.4. If the assumption is made that the heat of sublimation
is not a function of temperature, then the integration of the Clausius-Clapeyron equation
gives ∆Hsub(I)=125.1 kJ/mol before the first phase transition and ∆Hsub(II)=100.3 kJ/mol
after the first phase transition. This gives 23.3 kJ/mol for the phase change, which is quite
consistent with our DSC data. Taking into account the enthalpy of the phase change of 3.2
kJ/mol at 183°C we may predict the normal boiling point for levoglucosan to be about
350°C. Our prediction is higher than an earlier estimate of the boiling point for
levoglucosan at 260°C [Mok et.al. 1983]. The earlier estimate appears to be more likely
associated with the decomposition of levoglucosan. The extrapolation is shown on Figure
D.5 together with other reported experimental data on liquid levoglucosan [Enstein et al.,
1964]. Those results also imply a boiling point of about 315°C. Enstein et al. measured
liquid levoglucosan vapor pressure at three different temperatures from 195 °C to 255°C

138
using the static method. These data give a heat of vaporization 92.3 kJ/mol, while our data
suggest 97 kJ/mol. Additional liquid levoglucosan data are given by Stephenson and
Malanowski [1987] in the "Handbook of the Thermodynamics of Organic Compounds".
However, there is reason to suspect based on a comparison of the cited temperature range
with that of Enstein et al. that they show erroneous data obtained from that study.
D.2.2. Vapor Pressures of Sugar Compounds.
Since "tars" are complicated mixture of many products we have studied the vapor
pressures of additional saccharides (D-xylose, D-(+)-glucose and cellobiose) that allow
comparisons to be drawn. Figure D.6 shows a comparison between the results of four
cellulose tar model compounds in the solid phase. The vapor pressure of levoglucosan
appears to be greater and its latent heat of sublimation appears to be lower than the same
quantities for the other similar molecular weight compounds, D-xylose and D-glucose. It is
important to note that a correlation based on molecular weight alone would show an
uncertainty of at least an order of magnitude about a mean. The intermolecular forces that
play important role in sugar-like compounds are van der Waals, polar attraction, and
hydrogen bonding. Our data imply the important role of hydrogen bonding interactions in
these materials, since the vapor pressure at any temperature decreases as OH content
increases. Likewise, the heat of sublimation and the entropy of sublimation both increase
with increase in OH content. Table D.1 summarizes the vapor pressure experimental results
for solid sugar like compounds:
Table D.1. Enthalpy and entropy of sublimation for sugar like compounds.

139
substance numberof (-OH)
MW[g/mol]
temperaturerange [°C]
A B ∆H[kJ/mol]
∆S[J/mol K]
levoglucosan 3 162.4 71...112 15085 34.175 125.5 234.4
D-xylose 4 150.1 97...122 19006 41.359 157.9 303.5
D-β-glucose 5 180.2 122...133 24142 50.565 194.5 360.6
Cellobiose 8 342.3 201...215 36260 65.397 301.3 503.1
Figure D.6a shows the variation of ∆Hsub and Figure D.6b shows the variation of
∆Ssub with hydroxyl content. There are not many points upon which to draw very general
conclusions, but a correlation is certainly implied.
The thermal behaviors for D-xylose, D-(+)-glucose and cellobiose are shown in
Figures D.7, D.8 and D.9 respectively. All of these compounds show signs of
decomposition shortly after melting. The heat of fusion and melting point values for the
compounds of interest are presented in Table D.2.
Table D.2. Measured melting points and heats of fusion for sugar-like compounds.
compound nr OH MW Tm [°C] ∆Hf [kJ/mol]
levoglucosan 3 162.4 113 24.5
D-xylose 4 150.1 152 30.5
D-β-glucose 5 180.2 172 34.5
Cellobiose 8 342.3 247
The increases in both the melting point and the heat of fusion are evident as the number
of hydroxyl groups increases.
In closing, it should be noted that these materials are characterized by extremely low
vapor pressures, considering their low molecular weights. This was anticipated, since
sugars are practically non-volatile at near ambient temperatures. The low vapor pressures
are attributable to the important role of hydrogen bonding interactions in these materials.
For example, consider the predicted 25°C vapor pressure of glucose (6.2*10-14 torr) with
that of a similar molecular weight alkane (hexadecane: MW 226, 1.26*10-3 torr [Bell and

140
Groszek, 1962]). The vapor pressures decrease monotonically with the number of
hydroxyl groups that the sugars carry.

141
D.3. The Vapor Pressure of Primary Cellulose Tar.
D.3.1. Production of the Cellulose Tar.
In this chapter we are interested in the vapor pressures of primary cellulose pyrolysis
tars. A flash pyrolysis apparatus, the so-called wire mesh reactor, was used to prepare the
cellulose tars. This apparatus permits rapid electrical heating of the cellulose within the
folds of a wire mesh. The fact that only a thin wire mesh that contains the particles becomes
hot minimizes the cracking of tars in the reaction vessel. The tars may therefore be
considered "primary" pyrolysis tars. The tars were prepared from two different cellulose
samples. One was Whatman fibrous cellulose powder (CF11). This cellulose powder
contains less than 0.009% ash. Some of the tars were prepared from Munktell's Filter
paper, with an average ash content 0.007%. The cellulose samples were not dried prior to
pyrolysis. The tars were felt to be similar from both sources, since earlier studies of
pyrolysis had indicated that their pyrolysis behaviors were similar. Thus the samples were
pyrolyzed together, as described below.
The cellulose samples consisted of two thin sheets of filter paper with a layer of
cellulose powder folded between them. This was necessary to prevent loss of the fine
cellulose powder through the holes of the wire mesh. Operating conditions were chosen
based upon the literature on cellulose pyrolysis. It was shown that the tar yield increases
with temperature to a maximum at 700 °C, and at these temperatures pyrolysis is completed
in 5 to 10 seconds.
Material that collected on the cold walls of the pyrolysis reactor is called condensed
material. The condensed material was collected at room temperature by supplying a flow of
cooling water to the jacketed walls of the reactor. Some condensed material was also
collected on a glass wool filter at the exit of the reactor. These materials were collected after
reaction by washing the primary collection surfaces with-high purity methanol and in one

142
case with a mixture of THF and methanol. This procedure left a small amount of solvent
insoluble residue in the reactor walls.
Condensed material includes tar, water, organic acids, and various low molecular
weight hydrocarbons. The subsequent handling of this material was intended to prepare a
tar sample by evaporation of water and light hydrocarbons. Solvent was evaporated from
the condensed material solution by drying in a vacuum oven at room temperature for 12
hours followed by additional vacuum drying at 55 °C for another 24 hours. It was
previously shown in this laboratory that vacuum drying at a temperature of 55°C will result
in the loss of some light material. All components with a vapor pressure equal to or greater
than that of naphthalene are lost, while there is better than 95% retention of materials with
vapor pressure of anthracene. For comparison it may be noted that the vapor pressure of
anthracene is of the order of 10-4 torr at the maximum temperature of drying, but
levoglucosan, which is assumed to be the major component of the tar, has a vapor pressure
of 10-6 torr at this temperature.
The cellulose tar was not fractionated prior to vapor pressure measurements.
Characterization work in this laboratory gave a fairly narrow molecular weight distribution
centered below 200 daltons.
D.3.2. Characterization of the Cellulose Tar.
The molecular weight distribution of the our samples has been examined using gel
permeation chromatography (GPC). The analyses were performed on a Water µ-Styragel
column using pyridine as the mobile phase. The detailed description of this technique is
given in the section B.3.2. Products eluting from the column were analyzed simultaneously
by ultraviolet detector and refractive index detector. Analysis of the tar products of

143
pyrolysis by GPC are shown as absorbance as a function of time in Figure D.10 using the
ultraviolet detector and in Figure D.11 using the refractive index detector. The UV detector
did not reveal high concentrations of UV-active compounds, which implies the absence of
high aromatics content in tar. Comparison of Figures D.10 and D.11 together with the
observation of a high content of UV-inactive low molecular weight material near an elution
time of 2700 seconds implies, that the broad UV-active peak represents small amounts of
secondary decomposition products. Attempts were made to make the analysis more
quantitative by using coal tar as a calibration material for aromatics. We estimated the
aromatic contents from the UV detector response curve. This gave 0.02 mg of aromatic
compounds in 0.75 mg cellulose tar or roughly 3.5 wt%. From refractive index detection,
as shown in Figure D.11, comparison of the peak elution times of the tar (2688 sec),
cellobiose ( 2080 sec), levoglucosan ( 2664 sec ), D-xylose ( 2672 sec) and, D-(+)-glucose
(2720 sec), it appeared that the cellulose tar consists manly of 6-carbon sugar residues
(note the shorter elution time for the tars, as compared with cellobiose, the glucose dimer).
Thus the cellulose tars are much lighter and have narrower molecular weight distribution
than coal tars.
The number of average molecular weight of the three different tars were determined to
be around 180 daltons (between 172 and 184 daltons) using vapor-phase osmometry. This
value is in good agreement with literature values and shows again that the tar is in a
molecular weight range consistent with single 6-carbon sugar residues. The vapor phase
osmometer was calibrated using β-D-glucose at 0.04, 0.07 and 0.1 M solutions in
methanol at 45 °C (See chapter B). The VPO and elemental analysis results for the tars are
shown in Table D.3. Corresponding values for levoglucosan, assumed to be the main
compound of tar, are shown for comparison. The values for glucose, also shown in Table
D.3, are not seen to be in as good agreement.

144
Table D.3. Elemental analysis results for cellulose tars.
material solvent MW C% H% O% H/C
levoglucosan 162 44.4 6.2 49.2 1.8
glucose 180 40.0 6.6 53.3 2.0
tar nr. 1 methanol 179 46.8 7.03 46.2 1.8
tar nr. 2 methanol 172 46.1 6.9 47.0 1.8
tar nr. 3 methanol/THF 184 46.5 7.3 46.2 1.9
This supports the previous hypothesis that levoglucosan could be a major component of
flash pyrolysis cellulose tar. The data on aged cellulose tars, seen in Figures D.10 and
D.11, will be discussed in the next section.
D.3.3. Vapor Pressure Measurements of Cellulose Tar.
Both the "isothermal step" and "non-isothermal" Knudsen effusion techniques were
applied to cellulose tars. The results for all three tars of Table D.3 are shown in Figure
D.12. The isothermal step Knudsen effusion technique was used to measure the vapor
pressures of tar 1 and tar 2. The vapor pressure of tar 3 was measured by a "non-
isothermal" technique with heating and cooling rates of 0.8 °C/min. The comparison of the
three experimental runs shows that the new "non-isothermal" Knudsen effusion technique
results are in good agreement with the traditional "isothermal" technique results. The
second conclusion from Figure D.12. is that the vapor pressure curves are reproducible if
the tar is produced under similar conditions.
It was seen in performing the vapor pressure measurements with cellulose tars that
vapor pressures could be significantly lowered by prolonged heating of the sample at
temperatures in excess of 100°C. This is the reason for the distinction between "fresh" and
"aged" tars in Figure D.12. In one case, the sample was deliberately heated to 155°C.
Figure D.13 presents the same data, emphasizing separation between the fresh tar and the

145
"aged" tar based on the data for cellulose tars 1 and 2 and a sample of pure levoglucosan.
The non-isothermal results of Figure D.12 can be understood in light of this behavior. As
temperatures approach 100°C, the non-isothermal results which initially follow the fresh
tar, low temperature isothermal results, begin to curve off towards lower vapor pressures.
There is a dramatic curvature at around 110°C, when the vapor pressure takes a steep drop,
and thereafter follows "aged" tar behavior.
Differential Scanning Calorimeter (DSC) studies of fresh tars were performed. These
experiments, the results of which are given in Figure D.14, showed several irreversible
processes occurred above 100°C, under slow heating conditions (5 °C/min). These
processes were not studied in any detail, but it is believed that both evaporative loss from
the DSC pan and reaction processes were involved.
The sharp endothermic peak at just above 110°C occurs at the temperature of the
dramatic decrease in vapor pressure. The peak was seen to be irreversible and is therefore
distinct from reversible plastic phase transition in levoglucosan. It is very sharp, just like
the levoglucosan phase change. Why one peak would be reversible and the other
irreversible is not presently understood. It may, however have to do with a reaction that
accompanies the phase change. If not heated above 100°C, a tar sample showed no shift in
its vapor pressure-temperature curve, over the course of an entire day’s measurements,
involving a loss of almost 50 wt% of the tar. The narrowness of the molecular weight
distribution for the fresh tar appeared to be supported by the constancy of its vapor
pressure in these experiments. The correlation derived from the data in Figure D.13 for the
fresh cellulose tars is of the form:
ln P [torr] = A - B / T [K] {D.1}
where A= 40.289 and B=16948 for fresh cellulose tars.
A downward shift of vapor pressure might be expected as a result of driving off lighter
components. The residue from an experiment in which about 44% of the mass of sample
had been driven off (at temperatures up to 155°C, over several days) was remeasured for

146
molecular weight, and yielded a value of 270 daltons. Such a shift could indeed indicate
evaporation of lower molecular weight fragments, but it is unreasonably large. The number
average molecular weight of the components that would have had to be driven off is
approximately 115 daltons, which is somewhat low, given how the samples were prepared
in the drying step. Thus we believe that the shift is instead related to formation of higher
molecular weight condensation products. It has been observed that reheated cellulose tars
become much more difficult to solubilize, suggesting formation of higher molecular weight
species. Some of the tar was insoluble in both methanol and in methanol/THF mixture.
Also, it should be recalled that Figure D.12 showed that a non-volatile residue was formed
from the tars upon heating. Analysis of the "aged" tar by GPC is shown in Figure D.10
using the ultraviolet detector and in Figure D.11 using the refractive index detector. Figure
D.10 indicates formation of some large molecules with aromatic nature and molecular
weight of several thousand daltons eluting at the elution limit of the GPC column. The data
of Figure D.11 show that part of the non-UV active materials also shift upward in
molecular weight. The fact that not all material shifts is important, in that this means that
there is still a significant fraction of low molecular weight material even after "aging". The
order of magnitude drop in vapor pressure that accompanies "aging" requires that even
though much of the material remains low molecular weight, that its properties change
drastically. This can be easily explained if there were, for example, one extra OH group
created per residue upon "aging".
The effusion data for the “aged” tars are seen to be more scattered, in part because the
shifting of molecular weight during the experiment occurs more rapidly at the higher
temperatures. The slope of the aged tar curve is however generally consistent with that
from the fresh tar, even if vapor pressures are lower. Assuming formation of high
molecular weight, non-volatile materials in the sample, and ideal solution behavior,
Raoult’s Law would predict the observed result provided that the concentration of the
volatile species were to decrease by an order of magnitude. As noted above, it is not clear

147
from Figure D.11 that this is realistic. Thus it remains unestablished whether the shift of
the vapor pressure curve is attributable to reacting away most of the higher vapor pressure
material, or whether the shift is more attributable to reacting away some fraction, and
merely reducing its concentration. We favor the former explanation by inference, from the
data of Figure D.11 as well as the implausibly of a reproducible 90% extent of reaction
irrespective of heating history. It may be noted that levoglucosan itself showed no thermal
instability up to 230°C. Cellulose tar contains a much broader range of materials, so it is
unclear which components, if not levoglucosan, itself contribute to its thermal instability.
It is also known that introduction of additives produce discernible modifications of the
levoglucosan thermogram [Shafizadeh and Lai, 1971], so reaction of levoglucosan itself
cannot be ruled out.
An important feature of Figures D.12 and D.13 is that the vapor pressures of the
cellulose tars are quite low (fractions of a torr, at the temperatures studied). The tar would
be quite non-volatile at 150°C (P=1.2 torr), but would have a vapor pressure of 86 torr at
200°C. This is consistent with the results shown in Figure D.12. Using the correlation
derived from the data of Figure D.13, the cellulose tar is predicted to boil at around 504 K
(=231 °C). We have not taken account the temperature dependence of ∆Hvap, so the actual
boiling point could be a bit higher. This is in fair agreement with the limited observations of
Figure D.12, which qualitatively indicated boiling at near 260°C. It is difficult to verify this
boiling point by DSC, because the tar appears to decompose at a lower temperature.
Using the Clausius-Clapeyron equation, d [ln P]/ d[ 1/T] = -∆Hvap/R, the enthalpy of
vaporization of the levoglucosan was 120 kJ/mol. The enthalpy of vaporization of the fresh
cellulose tar was 141 kJ/mol in the two experiments with fresh tar shown in Figure D.13.
In both experiments, there was a tendency for ∆Hvap to decrease with time if the tar was
heated to only around 100°C (because of chemical changes in the tar).
The value of 141 kJ/mol can be compared with the curve in Figure D.2, by assuming an
activated zero- or first-order mass loss process in which the rate of transport is proportional

148
to the vapor pressure, and thus, in which it is assumed that E=∆Hvap. The rate of mass loss
may be therefore represented by:
d(m/m0)/dt = - (k0/m0) • exp (-E/RT) (m)n {D.2}
where m is the mass, m0 is the ultimate mass loss, t is time, and n the order. The value
of k0 is 3•1013 min-1 for n=1, and k0/m0 = 2•1013 min-1 for n=0. For a transport process,
the zero-order form should be more realistic. It is seen that a reasonable, though not
outstanding, approximation to the curve is obtained with either model. If one were to take
into account a decrease in the value of ∆Hvap due to tar “aging” reactions, a better fit could
be obtained. It may be noted that the value of k0 obtained here is higher than that observed
for actual cellulose pyrolysis (for which k0=4.07 •1011 min-1, [Milosavljevic and Suuberg
1995]), but this is to be expected, since the physical situations are quite different in the two
experiments.
The value of heat of vaporization for the cellulose tar gives some explanation for the
reported kinetics of the cellulose pyrolysis processes, and this is discussed in the following
section.
C.3.4. Heat of Vaporization - Contribution to the Heat of Pyrolysis.
It is quite plausible that the measured "heat of pyrolysis" of cellulose is actually a
composite of several different contributions. The role of exothermic char formation is
counterbalanced by an endothermic heat of volatile release [Milosavljevic and Suuberg,
1995]. In this latter case there may be enthalpy effects associated with actual decomposition
reactions, and there is also a latent heat of evaporation of many primary decomposition
products (especially tars and oils). Milosavljevic et al. [1996] suggest that the yield of char
is the main factor determining whether the overall pyrolysis process is endo- or exothermic.
Also an experimental estimate of the enthalpy of volatiles release is available from this
work. The extrapolation of the results to zero char yield provides an estimate of the

149
enthalpy of pyrolysis, where there is no char formation at all. This yields an estimate of
about 538 J/g volatiles. Thus it would be expected that if char formation could be
experimentally suppressed, the actual heat of pyrolysis would be close to the extrapolated
value of 538 J/g. Comparing this value with the tar's enthalpy of vaporization of 735 J/g
shows that the major enthalpy sink during pyrolysis involves the enthalpy of vaporization
of the tars. This is explored in detail in Appendix C.
D.3.5. Cellulose Tar Evolution - Controlled Kinetics.
The global decomposition kinetics of cellulose appear to be heating rate dependent. At
heating rates below about 10°C/min, the pseudo-first order activation energy for pyrolytic
mass loss is 218 kJ/mol. At higher heating rates, there appears to be a cluster of data in the
literature implying an activation energy of around 140 kJ/mol [Milosavljevic and Suuberg,
1994]. The similarity of the enthalpy of vaporization for the fresh cellulose tar (141 kJ/mol)
and the activation energy for the global mass loss kinetics in the high temperature regime
(140 kJ/mol) is intriguing, particularly in light of the evidence that mass transport
limitations may be playing a role within quite small particles and external to the samples.
The tar evolution rate could be proportional to its vapor pressure if the tar escapes by either
diffusional processes or convective flow. The latent heat of vaporization of the tars
(approximately 141 kJ/mol) is suggested to be the origin of the temperature dependence of
mass loss kinetics at high heating rates. This is explored in detail in Appendix D.

150
D.4. Conclusions.
The vapor pressures of the fresh cellulose tars have been measured, and reveal a
material of limited volatility. The volatility of the tar is similar to that of a widely accepted
major component of the tar, levoglucosan. The cellulose tar exhibits the same magnitude of
vapor pressure as levoglucosan. The molecular weight of levoglucosan is 162 daltons,
which is near the average molecular weight of the actual fresh cellulose tar samples, which
ranged from 170 to 178 daltons. Also the heat of vaporization of real cellulose tars is close
that obtained for levoglucosan, 126 kJ/mol for levoglucosan and 141 kJ/mol for tar. It is
seen that the levoglucosan could be a reasonable model for the fresh tars, because the
thermophysical properties of tar are unknown.
The results prove that the approach used here give satisfactory results working with
simple system such as cellulose tar. The importance of thermal alteration of tars, and the
difficulties that this can cause, has also been explored. In the next chapter the work is
extended to coal tar.

151
-0.03
-0.025
-0.02
-0.015
-0.01
-0.005
0
0.005
d(M
/M
0)/
dt
* 1/H
.R. [
°C-1
]
100 150 200 250 300 350
Temperature [°C]Figure D.1. Mass loss rates during cellulose powder pyrolysis at different
heating rates in the TGA. The notation H.R. refers to heating rate, in °C/min.
400 450 500
Heavy curves-open TGA pans; thin curves-DSC pans (with mass transport limitations).Dashed curves-60°C/min; solid curves-6°C/min; dashed/dotted curves-1°C/min.

152
0
0.1
0.2
0.3
0.4
0.5
Mass
Loss
0.6
0.7
0.8
0 100 200
T[°C]Figure D.2. Mass loss from reheating cellulose tar at 60°C/min, in the heated wire mesh reactor. Dashed curve - zero order mass loss model;
Solid curve - first order mass loss model (see text).
300 400 500


154
O
HOOH
OH
CH3 O
-10
-8.4
-6.8
-5.2
-3.6
-2
0.0023 0.0024
ln P
[ to
rr ]
0.0025 0.0026 0.0027 0.0028 0.00291/T [ K ]
Figure D.4. Effusion method applied to levoglucosan.Solid points - before phase transition; open points - after phase transition.
before phase changeafter phase change
ln P= 34.068-15049/T
ln P = 26.295 -12066/T

155
-10
-5
0
5
10ln
P [t
orr]
0.0015 0.0018 0.0021 0.0024 0.0027 0.0031/T [K]
Figure D.5. The extrapolation of levoglucosan data up to the boiling point at 760 torr. Other reported experimental results for liquid levoglucosan [Enstein et al., 1964]
are shown for comparison.
solid levoglucosanafter the first phase transition
after the second phase transition
Enstein et al. [1964]

156
O
HOOH
OH
CH3 O
O
HOOH
OH
CH2OH
OH
O
HOOH
OH
OH
O
HOOH
OH
CH2OH
O
OH
OH
CH2OH
OH
O
-12
-9.75
-7.5
-5.25
-3
0.002 0.0022 0.0024 0.0026
ln P
[to
rr]
0.0028 0.003
1/T [K]Figure D.6. Effusion method applied to solid
D-xylose, levoglucosan, D-glucose and cellobiose.
D-xyloselevoglucosan
cellobioseD-glucose
ln P(D-xylose) = 41.398 -19006/T ln P (levoglucosan) = 34.174 -15085/T
ln P(cellobiose) = 65.406 -36264/T ln P (D-glucose) = 48.263 -23382/T

157
100
150
200
250
300
350
∆H [
kJ/m
ol]
2 3 4 5 6 7 8 9Number of (-OH) groups
Figure D.6a. Variation of sublimation enthalpy with hydroxyl group content.
∆H = 18.014 + 35.357 (OH)
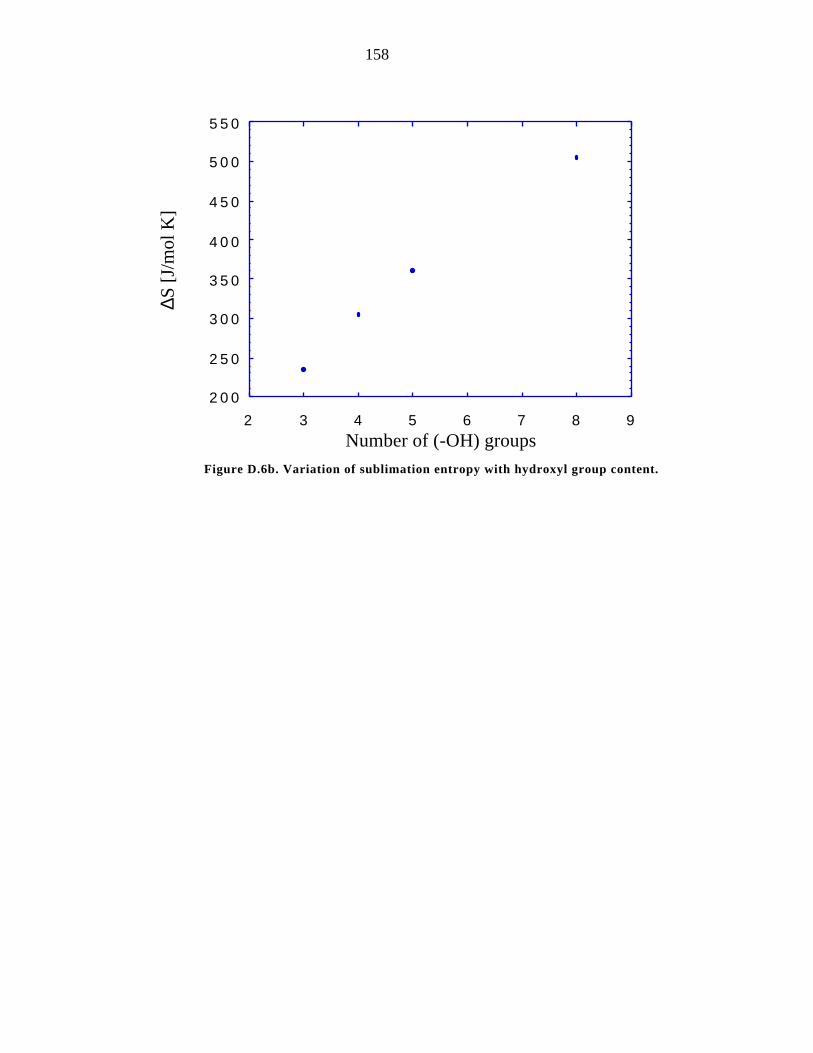
158
200
250
300
350
400
450
500
550
∆S [
J/m
ol K
]
2 3 4 5 6 7 8 9Number of (-OH) groups
Figure D.6b. Variation of sublimation entropy with hydroxyl group content.


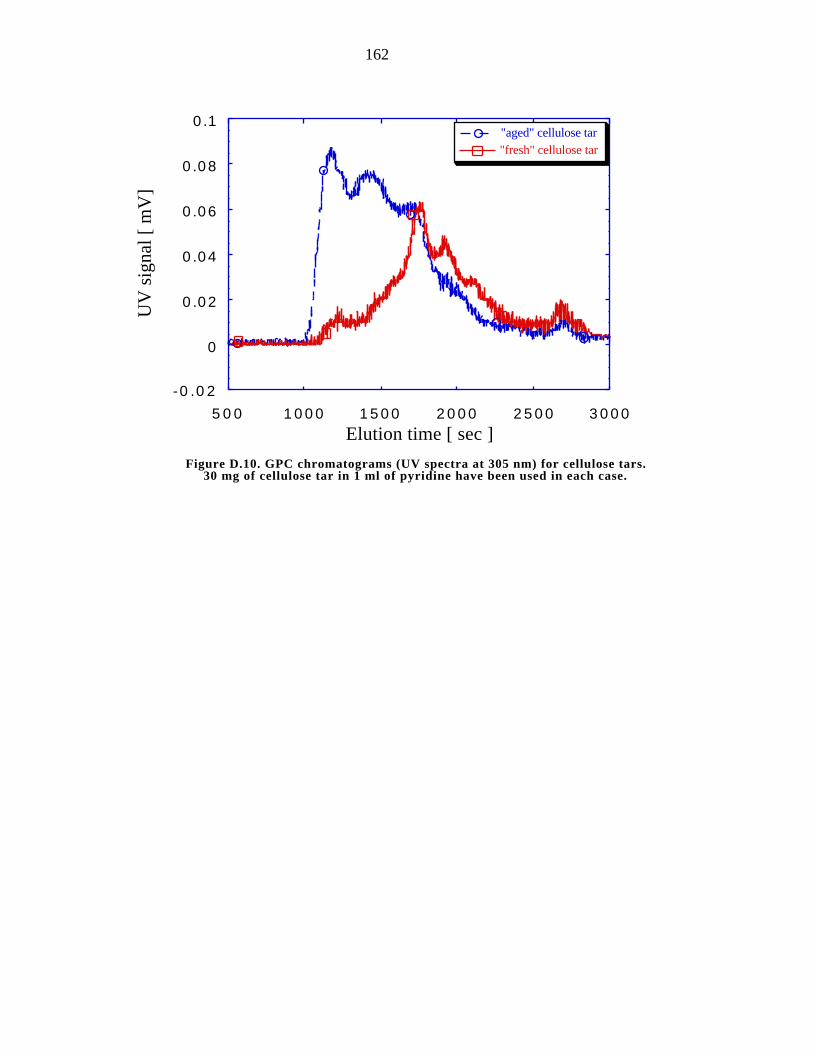
162
-0.02
0
0.02
0.04
0.06
0.08
0.1
UV
sig
nal [
mV
]
500 1000 1500 2000 2500 3000Elution time [ sec ]
Figure D.10. GPC chromatograms (UV spectra at 305 nm) for cellulose tars.30 mg of cellulose tar in 1 ml of pyridine have been used in each case.
"aged" cellulose tar"fresh" cellulose tar

163
-0.5
0
0.5
1
1.5
2
2.5
RI
sign
al [
mV
]
500 1000 1500 2000 2500 3000
Elution time [ sec ]
Figure D.11. GPC chromatograms (refractive index detector) for cellulose tars.30 mg of cellulose tar in 1 ml of pyridine have been used in each case.
"fresh" cellulose tar"aged" cellulose tar

164
-10
-9
-8
-7
-6
-5
-4
-3
0.0023
ln P
[ to
rr ]
0.00244 0.00258 0.00272 0.00286 0.003
Open points for "fresh" tars, solid points for "aged" tars, which have beenexposed to temperatures above 100°C.
levoglucosan
1/T [K]Figure D.12. Effusion data for cellulose tars and levoglucosan.
The isothermal effusion method was used for tars 1 (squares) and 2 (circles).The non-isothermal method was used for tar 3 (small data points).

165
-10
-9
-8
-7
-6
-5
-4
0.0024
ln P
[to
rr]
0.0026 0.0028 0.0031/T [K]
Figure D.13. Vapor pressure of "fresh" cellulose tar and levoglucosan as a function of temperature.Solid points-fresh cellulose tar; open points-cellulose after exposure to 155°C; crosses-levoglucosan.
"fresh" tar: lnP[torr] = 40.289 -16948/T[K]
levoglucosan: lnP [tor] = 34.173 -15084/T[K]


167
Chapter E. Coal Tar - Experimental Results and Discussion.
Tars were prepared from various coal samples. Four coals from the Argonne Premium
Coal Set [Vorres, 1990] - the Illinois No. 6, the Pittsburgh No. 8, the Pennsylvania
Upper-Freeport and the Wyodak - were selected for this study because of their specific
chemical and physical properties. They were used as received. These coals have been well
characterized with respect to bulk chemical and physical properties, and were mined,
stored, and processed in an inert atmosphere to prevent oxidation and/or chemical
alteration of the original coal samples. The samples studied were fairly fine powders of
<100 mesh size. Detailed petrographic, chemical, and physical analysis data on the coals
can be found elsewhere [Vorres, 1990]. The reported elemental compositions are given in
Table E.1 together with that of another Pittsburgh No.8 sample, the so-called Bruceton
standard coal [Suuberg et al., 1985], which was examined here in preliminary work.
Table E.1. Ultimate analyses dry (wt %) of coals studied.
Seam Rank C H O N S Ash
Upper-Freeport Low. Vol. Bit. 74.4 4.1 6.5* 1.3 0.7 13
Illinois No. 6 High Vol. Bit. 66 4.2 11.5* 1.2 2.1 15
Pittsburgh No. 8 High Vol. Bit. 75.7 4.9 8* 1.5 0.8 9
Wyodak Subbituminous 68.3 4.9 16.4* 1 0.4 9
Bruceton High Vol. Bit. 80.4 5.3 6.7 1.6 1.0 4.6*by difference.
The actual pyrolysis methods used to produce the tars were described in section B.2.2.
Attention is turned here to characterization of the tars.

168
E.1. Characterization of Coal Tars by GPC in the "Analytical Mode".
Since the rate of escape of tar from pyrolyzing coal particles depends upon the vapor
pressure of the tar, and this property is assumed to depend upon the molecular weight of
the tar, efforts were made to measure of tar molecular weight distributions. There is no
single absolute method available for measuring molecular weight distributions of coal tars.
The classical gel permeation chromatography (GPC) technique is one which has been
widely applied for this purpose.
The initial strategy was one of relating measured elution times of coal tars from the
analytical GPC column to their molecular weights. This strategy has often been followed
in other studies, in this laboratory and elsewhere [Unger and Suuberg, 1984; Oh et al.,
1986]. The separation of asphaltenes, bituminous resins, coal liquids and coal tars by size
exclusive chromatography using poly(divinylbenzene) or Styragel columns and solvents
such as THF, toluene and CH2Cl2 has been reported by several investigators [Unger and
Suuberg, 1984; Philip and Anthony, 1982; Strachan and Johns, 1985; Evans et al., 1985;
Bartle et al., 1986; Lafleur and Wornat, 1988; Lafleur et al., 1993]. The initial strategy
proved difficult to implement for the intended purpose, however.
A major problem was encountered in calibration of the GPC for coal tars. Several
factors preclude the direct determination of molecular mass distributions of coal tars by
GPC. The first problem is encountered in obtaining suitable calibration standards. Pure,
suitable model compounds are available in a limited molecular weight range and are also
limited structurally and functionally. This has earlier been addressed by use of fractionated
tars themselves. A more difficult problem in calibration is caused by the non size-
exclusion behavior of heterogeneous mixtures of moderate molecular weight compounds.
The separation is much more complex than that based upon the molecular size, as it is in

169
the case of single polymers. Besides molecular size, chemical characteristics such as
polarity can play an important role in separation. It has, for example, been observed that
neutral molecules elute much later than compounds which are known to form H-bonded
complexes with THF or pyridine, and appear to exhibit greater than expected linear
molecular size. Philip and Anthony [1982] observed that when THF is used as the mobile
liquid phase, certain molecules can form hydrogen bonds with the THF, thus lowering
their retention times, but when non-polar solvents such as toluene were used, the retention
times were more like those expected. Even in the case of aromatic hydrocarbons, the
separation depends upon more than molecular weight and there is difficulty in predicting
elution behavior. The pericondensed PAH show a reversal of the classical GPC separation
process and exhibit different behavior from the catacondensed PAH [Strachan and Johns,
1985; Lafleur et al., 1993; Evans et al., 1985]. This is attributable to an adsorption effect.
For this reason, it is not feasible to calibrate a GPC column with coal tar model
compounds.
In fact, a separation according to functionality allows lumping of similar components
into distinct groups and can be used for characterizing complex mixtures [Philip and
Anthony, 1982; Lafleur et al., 1993]. For example as shown in Figure E.1, Philip and
Anthony [1982] separated coal liquids using 100Å µ-Styragel columns and THF as mobile
phase into four fractions containing heavy nonvolatiles (polymers and colloidal carbons),
long chain alkanes and asphaltenes, phenols and aromatics. However, these fractions may
still strongly overlap. Evans et al. [1985] showed that the greatest deviation from the
molecular weight based calibration line constructed with PAH in THF is in the elution of
phenols. Molecules with more than one hydroxyl group elute very early. They used this
effect to separate coal tar into two fractions, which were examined by GC-MS, NMR
spectroscopy, infrared spectroscopy and elemental analysis. The earliest eluting fraction
(MW 285 by VPO in pyridine) contained high concentrations of phenols (by direct oxygen
analyses, and from the strong peak at ~ 3300 cm-1 in the infrared spectra ) and long chain

170
paraffins. Its oxygen content was 11.2 wt. %, nitrogen content 1.3 wt. %, sulfur 0.4 wt.
% and the H/C ratio 1.03 by elemental analyses. Based on this characterization, it can be
shown that an average molecule in this fraction would contain about 2 oxygen atoms,
therefore possibly 2 hydroxyl groups. The later fraction (MW 220) was composed
predominantly of polynuclear aromatics (N-heterocyclic, S-heterocyclic and O-heterocyclic
compounds), aliphatic carbon was present as side chains on aromatic rings. The OH band
was absent in the infrared spectrum of this fraction. Its oxygen content was 3.2 wt. %,
nitrogen content 1.2 wt. %, sulfur 0.8 wt. % and H/C ratio 0.8.
Similar conclusions may be drawn from Figures E.2 and E.3, constructed using the
experimental data on pure compounds obtained by Strachan and Johns [1985] and
Rodgers et al. [1987]. The columns used were 1000Å, 500Å and 100Å µ-Styragel
columns, with THF as the solvent. It is noted that our preparative GPC column should
show similar separation behavior, because a 100Å and 500Å µ-Styragel packing with
THF solvent was also used by us. It should be noted that the general order of elution is
aliphatic, substituted aromatics, heteroatomic aromatics, and pure aromatics.

171
E.1.1. GPC Chromatogram Characterization.
In this study, the analytical GPC column had Phenogel packing and pyridine was used as the
mobile phase. Figure E.4 shows some of the pure compound data obtained using this analytical
GPC column . Molecular weights and elution times are shown in Table E.2.
Table E.2. GPC elution data for compounds used as standards. Nr. compound formula MW retention
time [sec]
1 phenanthrene C14 H10 178 2310
2 pyrene C16 H10 202 2368
3 perylene C20 H12 252 2320
4 coronene C24 H12 300 2408
5 decacyclene C36 H18 450 2160
6. rubrene C42 H28 533 1936
7 2-butylbenzofuran C12 H14 O 174 2224
8 2-methyl naphthalene C11 H10 142 2336
9 vitamin K1 C31 H46 O2 451 1864
10 quinoline C9 H7 N 129 2304
11 phenanthridine C13 H9 N 179 2250
12 benzodiphenylene sulfide C16 H12 S 234 2288
13 benz[g]isoquinoline-5,10-dione C13 H7 N O2 209 2104
14 naphthol C10 H7 O 144 2032
15 hydroxypyrene C16 H10 O 218 2040
16 hydroxyphenalenone C13 H8 O2 196 2024
17 dihydroxynaphthalene C10 H8 O2 160 1856
18 dihydroxynaphthadione C18 H10 O4 290 1920
19 myricetin ( contains 6 OH groups) C15 H10 O8 318 1776
20 tetraphenyl cyclopentadione C29 H20 O 384 1904

172
It is apparent that there is no unique correlation of molecular weight with retention
time. In an ideal separation, it should be recalled that the compounds elute in reverse order
of molecular weight, i.e., higher molecular weight compounds should elute first. Note that
in fact the pure aromatic hydrocarbons elute last and the pericondensed PAH show an
elution behavior reversed from the expected separation process. The lower molecular
weight hydroxyl group-containing aromatics (e.g., 14) elute considerably earlier than the
much higher molecular weight PAH. This may be attributable to both the polar interactions
that the hydroxyls and pyridine could be involved in, as well as adsorption of the PAH.
This means that calibration of a GPC column must be performed with compounds of a
similar chemical nature to those of interest. This, in turn, requires that the column be
calibrated with narrow tar fractions of known molecular weight, because there are no other
obvious choices of good model compounds. Unfortunately, even this strategy is deficient,
due to the separation based upon chemical characteristics.
Figure E.5 shows the analytical GPC chromatograms for the first five fractions (in
terms of elution from the preparative GPC column) derived from Bruceton bituminous
coal tar. Figure E.6 shows the chromatograms of the last four fractions, as well as the
whole coal tar. The earliest eluting fractions, presumably those containing high molecular
weight components, are generally characterized as broad peaks with a well-defined
maximum (see Figure B.4). The higher the fraction number, the more bimodal the peak
becomes - this is particularly evident in Figure E.6. The whole tar is seen to comprise all
of these different features.
Figure E.7 shows that it is possible to curve fit the whole tar with the fractions by
calculating the total absorbance at any elution time using the following equation:
A j = x ii
∑ a ij {E.1}

173
where Aj is the total absorbance at j elution time, xi is the mass fraction of tar in
fraction i in the whole tar and aij is absorbance of fraction i at j elution time. The values of
xi were determined by evaporation of the fractions collected from the preparative column
and the values of the aij were obtained assuming a constant response factor for each
fraction, and from that, calculating each contribution to the whole tar. The values of xi for
the different fractions are shown in Table E.3 together with the number average molecular
weight of these fractions, as determined by VPO.
Table E.3. Relative amounts of different fractions from Bruceton coal tar.
fraction 0 1 2 3 4 5 6 7 8
MWi 820 520 395 320 310 275 250 275 290
mass % 1.2 8.1 16.6 23.6 22.9 15.4 7.5 2.8 1.9
From the values of xi, the number average molecular weight of the whole tar (MW )
could be calculated from the measured molecular weights of the individual fractions, MWi.
MW = yii
∑ MWi {E.2}
where yi is the mole fraction of the tar in fraction i. Note that yi ≠ xi, in general.
y i =
xi
MWi
x i
MWi
i∑
{E.3}
hence
MW =x i
xi
MWi
i∑i
∑ {E.4}

174
The number average molecular weight of whole tar measured by VPO (MW 341) is
similar to the value (MW 323) calculated from {E.4}, using measured fraction molecular
weights. Thus the separation is seen to be reliable, as far as accounting for all material is
concerned.
The separations in the two GPC systems (preparative and analytical) cannot be simply
compared. Clearly materials with similar elution times in THF can sometimes have very
different elution times in pyridine. This is particularly the case for the lower molecular
weight materials (or at least those with the longest elution times). The results for the final
three preparative scale fractions of Figure E.6 show very little shift in the analytical
column elution times of either of the two peaks that comprise the fractions. In the case of
these materials, there was obviously a significant difference in retention times when the
tars were dissolved in THF. When they were redissolved in pyridine, however, these
fractions behaved as though they were made up of differing proportions of the same two
components, whose sizes and chemical nature were comparable in all of these fractions.
Examined more closely, the peak positions of the later eluting peaks of these last three
fractions do slightly shift towards longer elution times, with increasing fraction number.
Considering the results of Figure E.4, it appears possible that the later eluting peaks in the
last three fractions might contain mainly aromatic hydrocarbons of progressively lower
molecular weight as fraction number increases, whereas the earlier eluting peaks contain
more polar fractions. It is also clear from Table E.3 that these later fractions also contain
most of the lower molecular weight material. Still, since as yet undefined polar interactions
appear to play a major role in determining the elution times of some components of these
fractions, there appears to be little hope of defining a reliable calibration curve based
purely on molecular weight vs. elution volume in this range of molecular weight.
175
It is immediately apparent that since many of the elution curves for different
preparative scale GPC fractions are composed of at least three peaks, no single calibration
curve could be drawn to relate molecular weight to elution volume. It is noted, however,
that there appear to be three general clusters of peaks - the first occurs at times less than
1820 seconds, the second between 1820 and 2050, and the third above 2050. For
example, the third, fourth and fifth fractions of Figure E.5 both show two merged peaks,
which are then more fully developed in later fractions (see Figure E.6). The whole coal tar
GPC curve also clearly indicates all three of the peaks. Figures E.8 to E.11 show the GPC
chromatograms for Pittsburgh No.8, Illinois No.6, Wyodak and Upper-Freeport coal tars
and their fractions. All show multiple peaks.
The relative position of the first peak, occurring at time less than 1820 sec, suggests
that it could contain long molecules. From our own work, we cannot say what these might
be. Our results from Figure E.4 suggest that at least some of the peak may be attributable
to poly-hydroxylated aromatics. Other compounds, not studied here, are more likely,
however. The effect of long alkyl substitutents in minimizing retention times of PAH has
been observed in several studies using THF as solvent [Strachan and Johns, 1985;
Rodgers et al. 1987; Philip and Anthony 1982; Lafleur and Wornat, 1988]. It has been
also noted by Calkins [1984] that the concentration of polymethylene (series of n-olefins-
paraffin pairs from C14 to C26 and higher) in pyrolysis tars increases with decreasing rank
from about 4% for high volatile bituminous coals compared to about 8% for lignites. The
alkyl nature of the peak in questions is supported by fact that more than 50% of this
fraction is volatile below 300°C, even though these fractions have number average
molecular weight between 300 and 700 daltons. Our elemental analysis show that fractions
of all tars with elution time below 1800 sec have a hydrogen/carbon (H/C) ratio above
1.2. For comparison, the polynuclear aromatic hydrocarbons have H/C ratio around 0.5
and long chain alkanes tend towards 2. Two of our choices for GPC calibration
compounds giving the correct elution times, #17 and #19 in Figure E.4, cannot be correct
176
models, since their H/C ratios are 0.8 and 0.7, respectively. Thus with molecules more
like #9, but with higher molecular weight, a more reasonable calibration could have been
obtained.
The second peak occurs between 1820 and 2050 sec. Comparison with the pure
compounds of Figure E.4 shows that these could be strong hydrogen bond forming
compounds (e.g., containing hydroxyl groups) with number average molecular weights
between 200 and 400 daltons, such as #17 or #18. As can be seen in Figure E.4, the
hydroxyl groups shift retention times to shorter times (compare #14 naphthol with #17
dihydroxy-naphthol, or #15 hydroxypyrene to #2 pyrene). The elemental analyses of this
peak still show a quite high H/C ratio between 1 and 1.2, and also high oxygen content.
This suggests hydroxyl group containing aromatics with several alkyl side groups, in
order to achieve the high H/C ratios.
The third peak occurs above 2050 sec. It is apparent from the fact that the molecular
weight of the later fractions increases with retention time above 2200 seconds, there could
actually be two superimposed peaks. The elemental analysis indicates increased nitrogen
content and lowering H/C when peak size increased. VPO results show the number
average molecular weight of this fraction between 200 and 300 daltons. Comparison with
the pure compounds of Figure E.4 also shows that here is no simple unique interpretation
of the general retention times with chemical characteristics. These late peaks will contain
unsubstituted aromatics, and aromatics which contain not particularly polar heteroatoms
(those not involved in strong hydrogen bonding), and alkyl aromatics with short
sidechains.
In summary, it may be said that there can be no simple conclusions drawn based upon
the GPC spectra. Separation occurs as a result of size and chemical functionality. Still,
GPC with pyridine as the mobile phase permits multimode separation of the tars into three
general fractions and therefore can be applied to the characterization of tars even if it does
not allow characterization by molecular weight. It can be crudely hypothesized that the first

177
peak consists of large molecules with significant polymethylene substitutents, the second
is enriched in hydroxyl groups, and the third contains PAH.
E.1.2. Absorbance
Another problem in use of GPC for quantitative analysis of the tars is encountered in
the dependence of absorbance on UV detector wavelength. The pure aromatic compounds
present absorb more strongly at progressively longer wavelengths with increasing
molecular weight, as the detector wavelength is changed from 230 to 350 nm [Bartle et al.,
1986]. This shift is significant in the case of pure compounds, but its importance in coal
tars, which are extremely complex and may contain several thousands of compounds is
unclear. Unger and Suuberg [1984] considered carefully the fact that different fractions of
the Bruceton coal tar might have different absorption characteristics and concluded that
there was linearity of the actual detector response with sample concentration over the entire
elution range studied.
This can be also supported by Figure E.12, which shows data of Figure B.4, replotted
by rescaling each peak to overlap near 1000 sec retention time. The maximum signal was
obtained using the UV detector at a wavelength of 305 nm (UV cutoff was found to be
slightly below 305 nm). Comparison of the normalized peaks at the six different
wavelengths in Figure E.12 shows that the absorbance increases uniformly over the entire
spectral range studied, up to 305 nm. This indicates that the relative amounts of UV light
absorbing species are accurately reflected, irrespective of choice of wavelength. This is
presumably because the main UV-absorbing species have polycyclic aromatic character,
and that there is no dependence of this character on elution time. The variation in intensity
with time reflects a variation in amount of the chromophoric species eluting with time.
This can be explained by assuming that the polynuclear aromatics making up the tar are all
of comparable ring cluster size. Substitutents have a small effect on the absorptivity of a

178
PAH chromophore and therefore the molar absorbance of most UV-absorbing species of
similar cluster size is nearly the same at any wavelength [Lafleur et al., 1993]. Thus, it is
unnecessary to concern oneself about the choice of the UV wavelength. The choice is
guided by detector response, which was highest at 305 nm (see Figure B.4).
The average molar absorbance is different for each tar from each different coal. The
following average molar absorbances were found for tars investigated:
Table E.4. Average molar absorbances of tars.tar absorbance before effusion
[area/mmol]absorbance after effusion [area/mmol]
Bruceton, HVB 339 * 106 552 * 106
Illinois No. 6, HVB 308 * 106 767 * 106
Pittsburgh No. 8, HVB 377 * 106 1082 * 106
Upper-Freeport, MVB 487 * 106 746 * 106
Wyodak, Subbituminous 236 * 106 547 * 106
Although a wavelength of 305 nm gave similar average molar absorbances for
Bruceton, Illinois No.6 and Pittsburgh No.8 coal tars, it was notably higher for Upper-
Freeport coal tar and lower for Wyodak coal tar. This could be explained in terms of the
pyrolysis products of these tars having different basic aromatic cluster sizes. There is
some evidence to support this from Solum et al.[1989]; aromatic cluster size in the parent
coal increases only slightly with rank. But it is also likely that a greater mole fraction of
the tars from the higher rank coals contain the highly UV-absorbing aromatic
chromophores because higher rank tars are more aromatic. Purely aliphatic materials
would not absorb at all. Moreover, observed increases in absorbance ranging from 35 to
65%, after effusional evaporation of the tars suggest an enrichment of the UV absorbing
fraction in the residue. There can be evaporation of non-aromatic and smaller aromatic
compounds, both of which can result in increased molar absorbance in the residue. Larger
aromatic cluster compounds tend to be more absorbing on a molar bases [Bartle et al.,
1986]. We favor an explanation which emphasizes a shift in remaining aromatic cluster
size (due to differential evaporation), because as will be shown later, the shape of the GPC

179
spectrum shows only minor evidence of differential evaporation, based on functional
character (see Figure E.22 and E.23). No one peak of the GPC is lost before all others.

180
E.2. Thermal Behavior and Stability of Tar.
E.2.1. DSC Results.
The thermal behavior of tar samples and their fractions was observed by DSC using
two different heating rates. Figures E.13 and E.14 present results for Pittsburgh No. 8 tar
with heating rates of 5°C/min and 0.5°C/min respectively. It is impossible to determine the
latent heat of fusion from these DSC results. Our vacuum sublimation experiments show
"melting" between 100 and 150°C for the tars and tar fractions examined. This can be
explained by the fact that tar is complex mixture of many compounds with very different
melting behaviors, and which are soluble in each other. There is no unique, pure
component melting point.
"Melting" and sublimation behaviors have been also determined by Freihaut et al.
[1993] for the following tars:
Table E.5. Sublimation behavior for some tars.tar Sublimation
[ °C ]
initialsoftening
[ °C ]
completemelting[ °C ]
Lignite , Lower Wilcox , TX NA 68-70 76-78
Pittsburgh No. 8, HVA 91-95 110-115 140-150
Pocahontas No. 3, MVB 85-90 90-95 135-140
Additional key data here are those for sublimation, which suggest a rather volatile
material. Moreover, the tars are in a softened state under temperature conditions such as we
use for vapor pressure measurement.
Since the actual DSC spectra show little information about tar thermal behavior, other
thermal experiments were performed. These experiments are discussed below.

181
E.2.2. Thermal Treatment of Tar and its Effect on Molecular Weight.
From the difference in the two DSC plots, it seems that there could be some slow
physical and chemical changes that occur during long term heating below 300°C. To
address this issue, experiments were performed in which glass capillaries were filled with
coal tar under an inert gas environment, closed hermetically and heated at desired
temperatures.
It should be noted that there was an increase in number average molecular weight of
Illinois No.6 coal tar of about 20% by VPO (from 310 to 380 daltons) after heating Illinois
tar about 2 hr at 200°C and there were also slight changes in the GPC spectra, as can be
seen in Figure E.15. Figure E.15 suggests that there are changes in the second (OH rich)
peak producing species eluting before 1700 sec. There is only a small increase in the
average molar absorbance, by 5%, after heating, but this is well within the experimental
error. This supports the hypothesis that the earlier cited change of between 35 and 65% in
average molar absorbance during an effusion experiment is a result of preferential
vaporization of the species smaller aromatic cluster size as opposed to formation of PAH by
reaction.
Figures E.16 and E.17 present GPC spectra for similar experiments carried out for
Wyodak and Upper-Freeport coal tars, respectively, using heating at 280°C two hours.
These data suggest that copious amount of what is believed to be very high molecular
weight compounds have formed during heating. The elution time suggests large polymer
type molecules with molecular weights several thousands daltons eluting near the elution
limit of the GPC column. The number average molecular weight change was from 350 to
620 for Wyodak coal tar and 320 to 440 for Upper-Freeport coal tar, confirming that the
shift is at least in large part a true molecular weight shift.
It is well known that the primary tar changes in its properties during storage periods.
Figures E.18 and E.19 show comparison of GPC chromatograms between fresh and old

182
Illinois and Pittsburgh tars respectively. The "old tar" is in this study defined as a tar,
which has been kept five months in dark amber bottles under nitrogen at room temperature.
There is an increase in the number average molecular weight of about 15% and also some
slight changes in the GPC spectra.
There is a concern about condensation-type reactions in primary tars. The GPC elution
time around 800 seconds strongly suggests the formation of materials of very large
molecular mass up to 10,000 daltons, the nominal column exclusion limit. This is
consistent with the results of Pindoria et al. [1997]. They showed that residue tars from a
coal gasification plant showed significant mass spectra up to 20,000 to 30,000 daltons.
Additionally, several percent of our tar became insoluble in THF or pyridine after reheating
at 200°C for several hours.
The data of Figures E.15 to E.19 are significant from the point of view of tar thermal
stability, and show that some changes in tar composition can occur even at very low
temperatures. This supports the original premise that the tars had to be analyzed for vapor
pressure at as low temperatures as possible.

183
E.3. Tar Volatility and Stability.
The majority of the collected pyrolysis tar presumably escaped the pyrolyzing coal
particles by evaporation. Then the presumption is that reevaporation is also possible. Crude
characterization of volatility has been made by revaporizing tars.
Freihaut et al. [1993] studied the tar volatility by revaporizing lignite and bituminous
coal tars in the wire mesh reactor. Figure E.20 shows their results and displays the mass
fraction of samples of primary lignite and bituminous coal tars that can be revaporized in
the heated grid apparatus. All tar could not be revaporized. The fraction of tar vaporized
reaches an asymptote of around 60 to 90% at 500°C, which is below the temperature range
associated with active pyrolysis. The fraction of tar vaporized is higher for lignite (Lower
Wilcox, TX) 90% and vacuum HVA bituminous coal tar (Pittsburgh No.8) 80%, and
around 65% for HVA bituminous (Pittsburgh No. 8) and MVB bituminous (Pocahontas
No. 3).
Such experimental results have important implications for our vapor pressure
measurements, showing that in no case could all tar be re-evaporated. This is presumably
mostly because of the thermal instability of tar, as was noted in the previous section of this
report. Again, the importance of keeping experimental temperatures low is reinforced.
There is the possibility, discussed by Suuberg et al. (1985) that physical entertainment
contributes to tar production. This material may have been non-volatile to start. Thus it
would be unrealistic to expect 100% volatility. The results of Figure E.20 confirm that
most is evaporable, however.

184
E.3.1. Vacuum Sublimation Experiments.
The tar volatility issue was addressed here in vacuum sublimation experiments that
involved tar separation based upon volatility. The preliminary vacuum sublimation
experiments were performed using a standard vacuum sublimator. Two isothermal steps
and a vacuum 5*10-2 torr were used to produce volatilized fractions, which were
investigated by GPC and VPO. The original tar was generally dark brown and was like a
paste or a very viscous liquid. The earlier and later GPC fractions were usually harder and
the middle fractions more like a viscous liquid. The fractions prepared by sublimation were
light brown. Each fraction evaporated at higher temperature was progressively darker, and
the residue left after evaporation was almost black. Thus sublimation may favor loss of
smaller, and thus less colored aromatic clusters, consistent with what was proposed above.
Results are shown in Figure E.21 for Bruceton coal tar. There are several features of
the data of Figure E.21 that need consideration. All three main GPC peaks are apparent in
the evaporated fractions. This shows that all of the different fractions, containing different
functional groups, can be revaporized. This also shows that the vaporized fractions have
character similar to the parent coal tar and indicates again that the separation is by structure
in the GPC column. The shift in peak retention times to lower values and increase in
average molar absorbance of higher temperature fractions suggests the tars evaporate in a
"distillation-like" fashion with earlier fractions both lower in molecular weight and in
aromatic cluster size or aromatic content. The average molar absorbances were 199*106,
329*106 and 991*106 respectively for fractions vaporized at 140°C, 280°C and the residue
left in the sublimator, respectively. The lower molecular weight portions of all three main
peaks evaporate first. Their lower molar absorbances suggest either a lower content of
aromatics, or a lower content of larger aromatic clusters. We cannot at present distinguish
between these possibilities, though we believe it is the latter.

185
The second conclusion from Figure E.21 is that there is reaction producing a new, early
peak. A simple mole balance in the form Ninitial = Nleft + Nevaporated shows that the
molecular weight of fraction that was left after heating at 280°C should be 486, instead of
the measured 628 daltons, unless a reaction took place. Additionally in support of
occurrence of a reaction was the fact that the fraction left in the sublimator was hardly
soluble in THF.
All of these features are consistent with the results of the experiments of Figures E.15
to E.20 and show the occurrence of some slow reactions during long term heating, leading
to formation of high molecular weight compounds. This will be analyzed in more detail
below.
Based on the preliminary sublimation data and the thermal treatment experimental
results, there developed a concern about condensation-type reactions influencing the results
of the vapor pressure measurements, even at the modest temperatures of interest below
250°C. Indirect evidence of a problem did come from the decreasing solubility of the tar,
and in the changes in the GPC spectra and number average molecular weight after heating
to higher temperatures. Figure E.21 suggested the formation of non-volatile residue. Thus,
if a non-volatile residue were to form during the vapor pressure measurement, then the
volume fraction of volatile species would be decreased, and assuming that ideal solution
behavior is maintained, the vapor pressure would decrease in proportion to the fraction of
non-volatile residue (accounting, of course, for the loss of more volatile material by
reaction).
E.3.1.1. Vacuum Sublimation/Knudsen Effusion Experiments.
The question of coal tar mixture behavior was pursued further, using the vacuum
sublimation/Knudsen effusion device under vapor pressure measurement conditions.
186
Figure E.22 presents GPC spectra for Wyodak coal tar, its four evaporated fractions
and the fraction left in the effusion cell following sublimation. Figure E.23 shows similar
results for Upper-Freeport coal tar. Again the absorbance increases in going from the
higher volatile fractions to the residue fraction. It was noted earlier that molecules with
larger aromatic clusters have higher absorbance factors. Comparison of the H/C ratios of
Wyodak coal tar sublimation fractions gives 1.15 at 150°C and 1.25 at 250°C. The increase
in H/C ratio is needed to compensate for a higher molecular weight and large aromatic
content in the higher temperature factions. It should be also noted that the GPC spectra of
fractions obtained at the higher temperatures are more like the GPC spectra of whole tar.
Unfortunately GPC with a constant wavelength UV detector cannot be used for quantitative
evaluation of the changes resulting from condensation type reactions.
Equation {E.1} has been used to curve fit the whole tar GPC spectra from the
absorbances of the evaporated and residue fractions at any elution time. Results are shown
in Figures E.24 and E.25 for Wyodak and Upper-Freeport coal tars respectively. The
notable feature from these plots is that the sum of the evaporated fractions (as well as the
fractions themselves) have the characteristics of the parent tar, but the characteristics of the
residue left after sublimation are different. The residue formed might well be less-volatile
under the vapor pressure experimental conditions. Again, the changes in the second (OH
rich) peak suggest the origin of the nonvolatile residue, in condensation type reactions. The
fact that less shift occurs in the case of the Upper-Freeport coal tar is probably consistent
with its lower hydroxyl content. Therefore, it would be concluded that most of the tar
could have been evaporated if reactions would have not occurred. A firm conclusion in this
regard requires a variety of further experiments, however.

187
E.3.1.2. Molecular Weight Determination for Evaporated Fractions.
The vacuum sublimation experiments were also important in determining the number
average molecular weights of fractions evaporated at certain temperatures. The number
average molecular weights of tar fractions were measured by VPO. The same data have
been also used in order to determine the vapor pressures from the effusion data by formula
{B.11}. The results are shown in Figures E.26 and E.27, and presented in Table E.6 for
Pittsburgh No.8, Wyodak and Upper-Freeport coal tars. The molecular weight
dependence on effusion temperature has been constructed and is shown in Figure E.26 for
Wyodak, Upper-Freeport and Pittsburgh No.8 coal tars. This plot is based upon the data
of Table E.6.
Table E.6. Molecular weights and amount of evaporated fractions.
Wyodak Upper-Freeport Pittsburgh No.8
fractions MW mass % MW mass % MW mass%
evaporated at 100°C 230 1.6 200 3.3 225 2
evaporated at 125°C 250 11.2 225 7.5 240 6
evaporated at 150°C 270 14.2 250 10 265 8
evaporated at 175°C 320 11.7 275 11.5 272 9.5
evaporated at 200°C 375 11.6 290 12.7 290 10.5
evaporated at 225°C 405 11.5 300 14 311 9
evaporated at 250°C 430 11.3 310 14.3 318 7
residue 935 26.9 575 26.7 990 48
original tar 340 276 320calculated from
fractions 392 318 426
calculated fromevaporated fractions 323 273 279
As noted above, each evaporated fraction has the characteristics of its parent coal tar.
Thus, compounds of very different molecular weight and chemical structure can be present

188
in each fraction. The molecular weights and amounts of fractions evaporated in the same
temperature intervals are different for different tars, reflecting differences in the starting
materials. The number average molecular weights of tars calculated from the evaporated
fractions and residue are higher than the measured molecular weights of the fresh tars
indicating once again that condensation reactions took place. On the other hand, the
molecular weights calculated from the evaporated fractions alone are lower, as expected due
to differential evaporation.
It may thus be seen that there is some shift in molecular weight during the effusion
experiments up to 250 °C. This confirms the results of Figure E.22 and E.23, which both
indicate a shift, in the residue, towards quite high molecular weights. It should, however,
be noted that very large species do not contribute as heavily to a number average molecular
weights as do smaller species. For example, if the residue molecular weight in the Upper-
Freeport coal tar case were 1000 rather than 575, the number average calculated from all
factions would shift only up to 341 daltons. Thus what appears to the eye to be a major
shift in the GPC behavior will not necessarily be highlighted in a number average
characterization, as shown in Table E.6.
Raoult's law is of course based upon mole fractions, and the actual molecular weights
of the residue will influence the mole fractions of the more volatile compounds rather little.
For example, using the measured 575 daltons for the Upper-Freeport coal tar residue, the
mole fraction of the fraction evaporating at 100°C is 5.2%. If the molecular weight of the
residue were instead 1000 daltons, the 100°C fraction would represent above 6% of the
mixture. In fact, it may be more reasonable to work with mixture rules based upon volume
fractions in this case. These would perhaps scale better with mass fractions. Regardless of
which way calculated, the largest, least volatile residue fraction may shift in molecular
weight but not influence the evaporative process very much, all else being equal.

189
E.3.1.3. Comparison with Pure Compounds.
Table E.7. presents data concerning volatility of pure aromatic compounds under
sublimation conditions, assuming that compounds with a vapor pressure of 10-3 torr can be
fully evaporated.
Table E.7. The temperature of volatility of pure aromatic compounds.volatility at T [°C]
compound Molecularweight
number ofaromatic rings
65 anthracene 178 3
75 pyrene 202 4
155 perylene 252 5
170 1,12-benzoperylene 276 6
200 coronene 300 7
315 ovalene 398 10
Comparing the volatility data in Tables E.6 and E.7 suggest that 7 ring aromatic
compounds (e.g. coronene) could be present in the coal tar in large amounts. This is not to
claim that they are, since this is not consistent with the literature data. Fletcher et al. [1993]
have shown the presence of 1, 2 and 3 ring aromatic compounds in Illinois No. 6 coal and
Zap lignite tars based on 1H NMR analysis. Nelson et al. [1988] showed that the
predominant components of Millmerran coal tar above 800°C were unsubstituted polycyclic
aromatic hydrocarbons with up to five rings. Hayashi et al. [1995] showed the presence of
up to 6 aromatic rings per molecule and that the two - to four-ring compounds predominate
in Wandoan coal tars. They also showed that secondary reactions hardly changed the ring-
size distribution. Essentially, the coal tars are not pure aromatic hydrocarbons and are
known to have heteroatomic and aliphatic character (see Appendix A).
Thus the low volatility of the coal tars has more to do with how many aromatic clusters
there are per molecule, and even more importantly, how many and what types of
sidegroups the clusters carry. Literature data presented in Figure C.17 suggested that alkyl

190
substitutents did not lower the volatility relative to the base aromatic compound. Consider
tetramethyl-pyrene, which has molecular weight 262 daltons and an H/C ratio of 1.1.
Tetramethyl-pyrene could be expected to evaporate below 100°C as does pyrene. Clearly,
this is not the correct model for coal tar, as seen in Table E.6, where almost all tar
evaporated above 100°C. This strongly suggests the important role of polar substitutents,
particularly hydroxyl groups in lowering vapor pressure. Adding even small amounts of
hydroxyl substitutent to 3 or 4 ring aromatics enormously decreases their vapor pressure
(see Figures C.9 and C.11 for example). Also the interactions between nitrogen bases and
hydroxyl groups could be important (see Figure C.27). This fact is significant from the
point of view of developing the vapor pressure correlations for coal tars.
E.3.2. The Effusion Experiments on Coal Tars.
The results of the experiments to measure the vapor pressures of Bruceton coal tar are
shown in Figure E.28. The vapor pressures of this and other primary coal tars and their
GPC fractions were examined using the non-isothermal Knudsen Effusion method,
modified for application to mixtures containing components with a wide range of
volatilities. The technique was described in detail in section B.4.2. The technique was
applied to a fresh unfractionated coal tar in this case. The tar was produced by the pyrolysis
of the Bruceton “standard” Pittsburgh No. 8 high volatile bituminous coal, in a fluidized
bed at approximately 550°C. The tar was collected in THF, and carefully dried prior to
measurement. The detailed procedure was described in section B.2.
In the vapor pressure experiments, the temperature of the tar sample was continually
raised from an initial value of 60 °C to a final temperature of 220 °C, at a rate of 0.5 °C/min.
Because the tar changes in composition during evaporative loss of its components, the
ability to relatively quickly scan the whole temperature space of interest is of great
importance. The results of Figure E.28 show again that the tars evaporate in a "distillation-

191
like" fashion. This is consistent with the results of the experiments shown in Figure E.21.
More volatile species are lost earlier in the process, leaving behind a progressively less
volatile residue. It can be noted that the vapor pressure remains in the range from about 7 x
10-5 to 7 x 10⁻³ torr as the temperature of the sample is raised from 60°C to 225°C, as a
result of the loss of progressively less volatile components.
The experiments of Figure E.28 involved tracking the vapor pressure during both
heatup and cooldown cycles. It can be seen that the trace of each heatup cycle (at a
progressively higher total level of mass loss) tracks well the immediately preceding
cooldown curve. This is not surprising, because during cooldown, the rates of mass loss
fall quite low, and until the temperature is again raised to considerably higher values, little
further mass loss occurs. Thus there should be little change in vapor pressure attributable to
composition change due to mass loss during the cooldown and early part of the next heatup
cycle.
It is unlikely that residue formation, as discussed above, can influence the results to
the extent shown by the shift of vapor pressure curves in Figure E.28. At any given
temperature, the shift of vapor pressure with cycling involves many orders of magnitude
of pressure. For the development of a non-volatile residue to influence the pressures this
much would mean that its concentration would likewise have to vary by orders of
magnitude from the beginning to the end of the experiment. No such variation is seen, so
the shifts are mainly attributable to the loss of progressively less volatile materials from the
tar. If the condensation type reactions take place, formation of some high molecular weight
residue does not affect the vapor pressure measurements very much. Thus, the main
influence of the condensation type reactions on the vapor pressure measurement can be
expected by virtue of removing some volatile material itself but not by forming non-
volatile residue. It was noted in section D that cellulose tar showed similarly dramatic
shifts of the vapor pressure curve, without the loss of all of the low molecular weight

192
fraction. It is, therefore important to know whether a similar sort of reaction might not be
taking place here. The answer comes from the data of Table E.6, which showed that
regardless of how long the tar was kept at a particular temperature, there was upper limit to
mass loss. In contrast with this, if not heated over 100°C, the cellulose tar could almost all
be evaporated at the lower temperatures.
Keeping in mind our earlier self-imposed temperature limit of 250°C for these
experiments, we now see that it is possible to examine at least half of the tar under such
conditions.

E.4. Tar Characterization.
E.4.1. Tar Composition.
The elemental compositions of tars and fractions investigated are given in Appendix B.
In addition, the comparison of the H/C and N/C ratios for the parent coal and tar are
presented in Table E.8.
Table E.8. Elemental analysis results for coals and tars studied.
coal tar MWH/Ccoal
H/Ctar
N/Ccoal
N/Ctar
Upper-Freeport 290 0.66 1.07 0.016 0.012
Pittsburgh No.8 320 0.77 1.09 0.017 0.015
Bruceton 347 0.79 1.13 0.017 0.013
Illinois No.6 273 0.773 1.15 0.015 0.014
Wyodak 324 0.85 1.21 0.013 0.011
These data show that the primary tar has a higher H/C ratio than its parent coal. The
H/C ratios are comparable to the results of the other investigators as given in Appendix A.
The exception is the low volatile bituminous Upper-Freeport coal tar which differs from
earlier results. These results above also show comparable nitrogen heteroatom content in
the tar and the parent coal.
Figure E.29 shows GPC chromatograms for the tars studied. As stated in a previous
section, GPC with a pyridine mobile phase separates tar into three fractions according to
chemical character, upon which is superimposed a separation based upon size. This allows
one to characterize tars in terms of compound classes by drawing lines designating the
regions of elution between large molecules with number average molecular weight over
400 daltons, hydroxyl-substituted aromatics, and aromatics without hydroxyl
functionalities. The actual assignments are still tentative. We cannot firmly assign them on
the basis of the limited data in hand.
193

194
Again, the GPC elution times below 1850 sec suggest large molecules. A GPC
fraction showing higher molar absorbance suggest bigger aromatic clusters or
characterization higher molar aromaticy. Thus the Upper-Freeport tar is most aromatic, but
is lighter than the other tars, and exhibits only a broad shoulder below 1820 seconds.
Taking into account the number average molecular weight of these early-eluting fractions
(between 400 and 700 daltons), such volatility strongly suggests a large amount of alkyl
character. This is consistent with the H/C ratio being higher than 1.2. These fractions may
even involve some amounts of polymethylene compounds or polymethylene substituted
aromatics [Calkins, 1984]. The elemental analysis also shows the presence of several
oxygen atoms and therefore possibly several hydroxyl functionalities per average
molecule.
The GPC elution time of the second peak (between 1820 and 2050 seconds) and the
fact that the H/C ratios are all around 1 for fractions showing a significant contribution of
this peak (see Appendix B) suggests that this peak contains mainly hydroxyl group-
containing alkyl substituted aromatics. It may also contain alkyl substituted big aromatic
molecules which contain oxygen in the ring structure.
The third peak elutes above 2050 seconds and as noted before cannot be easily
assigned. The fact that the third peak is relatively speaking the largest in the Upper-
Freeport coal suggests that it may involve structures that would be most characteristic of
that coal and least characteristic of low rank coal. This supports the notion that the size of
the aromatic clusters determines the size of the peak, as discussed above. Its height, in
Upper-Freeport coal tar, relative to the second peak, could indicate the relatively greater
importance of non-OH -containing clusters in the Upper-Freeport, compared with the
other coal tars. Thus this peak could be associated with alkyl aromatics in which long alkyl
chains play only a small role (the chains would not be polymethylene in character). This is
consistent with what is known about Upper-Freeport's structure.

195
A separation based upon crudely defined chemical characteristics allows one to
characterize tars using the areas under the three peaks. The hypothetical split into three
classes is shown in Table E.9.
Table E.9. Separation of tars by compound classes.
tar MW relative
absorbance
peak 1
wt%
peak 2
wt%
peak 3
wt%
Upper - Freeport 267 2.1 5% 60% 35%
Pittsburgh 320 1.6 10% 70% 30%
Bruceton 347 1.4 20% 60% 20%
Illinois 273 1.3 20% 60% 20%
Wyodak 324 1 60% 30% 10%
The values under the peaks are given in mass percents and the calculation is based on
fractions separated by preparative GPC. This characterization suggests a large amount of
hydroxyl substituted aromatics in all the tars. It also suggests the increase in aromatic
cluster size or aromaticity with rank, as noted above (see relative absorbance). A relatively
greater role of less substituted aromatics, with increasing rank, is also suggested by the
data on peak 3, which include most of these species.
The elemental analyses suggest that an average molecule of Pittsburgh No.8, Illinois
No.6 and Wyodak tar would contain about 2 oxygen atoms, therefore possibly 2 hydroxyl
groups. This is in good agreement with the elemental analyses performed by other
investigators (see Appendix A). It has also been noted that infra-red analysis of
bituminous coal tars shows a large amount of phenolic (-OH) character in spectra at 3400
cm-1 [Fynes et al, 1984; Evans et al., 1985; Pindoria et al., 1997]. Fynes et al. [1984]
identified that 4.7 to 6.1 wt. % of Linby HVB (811) coal tars could contain ionizable
protons in the form of OH (the oxygen atom content of these tars was measured to be
between 7.5 and 8.1 wt.%). The values assigned to peak 2 above suggest even higher
percentages.

196
E.4.2. Is the Tar an Ideal Mixture?
All tars show heteroatomic content comparable to the parent coals (see N/C ratio in
Table E.8), and likely contain a large amount of hydroxyl functionality. This means that
they could exhibit very strong electron donor-acceptor interactions. This may have an
important influence on the vapor pressure behavior of the tars, and suggests significant
departures could be observed from Raoult's Law. Here, we explored this issue further by
studying the vapor pressure of two artificially made mixtures consisting of a hetero-atom
rich pure compound and Illinois No. 6 coal tar fraction 4. Note that fraction 4 (MW = 270
by VPO) occupies 42% of the mass of the total tar, and that the GPC spectrum is
dominated by the second (probably OH rich) peak. Elemental analysis predicts that an
average molecule could contain about two hydroxyl groups and that every fifth molecule
contains N.
The first model mixture contained 50 mass percent of hydroxypyrene (C16H10O, MW
= 218) in tar and the second mixture 40 mass percent of phenanthridine (C13H9N, MW =
179) in tar. Each model mixture was prepared by dissolving the tar and the pure
component in THF, and then evaporating the solvent in a vacuum oven. The vapor
pressure was measured by the non-isothermal Knudsen effusion technique. Figure E.30
shows that the mixture with hydroxypyrene exhibited vapor pressures quite close to those
"predicted" from Raoult's law. The prediction was based on assuming the tar to be a
single pseudo-component of a binary mixture.
Figure E.31 presents the results for the mixture with phenanthridine and shows lower
vapor pressure than would be expected from Raoult's law. This is similar to the result
presented in Figure C.27. It is known that the formation of hydrogen bonds between
pyridinic or pyrrolic nitrogen (as exists in the coal) and hydroxyl groups is favorable. The
fact that the nitrogen compound lowers the vapor pressure is consistent with the results
shown in Table E.8, where it is seen that the tars have a slightly lower N/C ratio than the

197
parent coals. It is also worth noting that the difference in the results with hydroxypyrene
and phenanthridine would be expected. There is an excess of the phenolic hydroxyl in the
tar, compared to nitrogen. It would not be expected that addition of further phenolic
hydroxyl would result in many new specific donor-acceptor interactions. On the other
hand, addition of nitrogen species would be expected to help involve more of the
hydroxyls in specific strong interactions. The numbers of these interactions would be
larger than in the tar itself.
The above result suggests that assuming ideal mixture behavior could be acceptable for
rough pyrolysis modeling work despite the possibility of strong specific interactions
between certain functional groups.

198
E.5. Results of the Vapor Pressure Measurements.
Typical vapor pressure effusion results for coal tars are shown in Figure E.28 and
were discussed in section E.3.2. The experiment used to obtain the data in Figure E.28
involved the evaporation of tar in a "distillation-like" fashion, tracking the vapor pressure
during both the heat-up and the cool-down cycles. More volatile species are lost earlier in
the process, leaving behind a progressively less volatile residue. This experiment tracked
the vapor pressures of the tar as the lighter volatile fractions evaporated, starting at several
percent of mass loss.
The analysis of the effusion data, shown in Figure E.28, allows determination of a
vapor pressure curve as a function of mass loss, based on heat-up and cool-down cycle
data using equation {B.11}. It can be seen that the trace of each heatup cycle tracks well
the immediately preceding cooldown curve.
The curves diverge at high pressures, when mass loss rates become significant. In
order to better analyze the effusion data on mixtures, a theoretical vapor pressure
experiment was simulated based on experimental pure compound effusion rates and
assuming ideal mixture behavior. The idea was to study the effusion behavior of an
idealized mixture and to avoid the complications due to the experiment itself (e.g. heat
transfer, noise). The simulated results for a five component mixture are shown in Figure
E.32. The vapor pressure curves determined for mixtures left after the each cool-down are
in good agreement with the heat-up and cool-down cycle data. Several features are worth
noting in Figure E.32. First, the shape of the curves is quite similar to what is obtained in
an actual tar experiment (see Figure E.28). the curvature noted at the high temperature end
of each heat-up cycle reflects the fact that the vapor pressure is decreasing as volatile
species are being lost. Actually, this is observed as in increase in the temperature required
to maintain a particular pressure. As temperature is decreased (towards points 1 and 2), the

199
rate of mass loss decreases to such an extent that composition no longer is changing very
much with time. This is why both the cool-down curve, and the subsequent heat-up curve,
both approach the constant composition vapor pressure lines drawn through points 1 and
2.
Figure E.32 also shows that the extent of curvature observed depends very much on
the maximum temperature of a cycle. The lower the maximum temperature, the less the
change in composition, and the less curvature is observed. Thus the most reliable points
for drawing vapor pressure curves are points 1 and 2. Bisection of the cooling and
subsequent heating curves gives a realistic estimate of the vapor pressure at a well-defined
composition point.
As is evident from formula {B.11}, it is necessary to know the molecular weight of
the vapor in order to determine vapor pressure by the effusion method. As a coal tar vapor
is composed of hundreds of gaseous species, it was assumed that each evaporated fraction
can be considered as a single pseudo component, described by an average molecular
weight. The molecular weights of the evaporated coal tar fractions were determined from
vacuum sublimation experiments as described in section E.3.1 and were shown in Figures
E.21 to E.23. The results shown in Figures E.21 to E.23 suggest that vacuum
sublimation/effusion does not provide separation purely by molecular weight, size or
composition. There are several features of the data of Figures E.21 to E.23 that need
consideration. It is evident that each evaporated fraction has the characteristics of the
parent tar, and that each fraction can contain species with a wide range of molecular weight
and chemical structure; this is apparent from the GPC chromatograms. It is critical to
consider this when developing new vapor pressure correlations using the vapor pressure
data available. It is also interesting to note that the volatility increases from peaks 1, 2 to 3.
This may be seen in the relative growth of the peaks from lower to higher temperatures.
Our hypothetical structure-based characterization of the coal tars according to GPC peaks

200
is explained in section E.4. The most volatile peak (the third, at around 2200 seconds) is
that attributed to the lowest molecular weight, most hydrocarbon-like components. The
other peaks contain higher amounts of hydroxyl-containing tars.
The correlations used in pyrolysis models are based on the molecular weights of
vaporizable fractions. The calculations of whole tar vapor pressure is related to the vapor
pressure of fractions. Using the assumption of ideal mixture behavior of the tar, as was
suggested in section E.4, i.e., Raoult's law, the following relation applies:
P = x ii=1
∞
∑ Pi {E.5}
where xi is the mole fraction of fraction i in the condensed phase and the measured
total pressure P is the weighted sum of the vapor pressures Pi of the fractions. In order to
use equation {E.5} the mole fraction for each fraction i must be estimated from mass loss
results obtained from the effusion experiments, and molecular weight (MW) is obtained
from the vacuum sublimation results discussed earlier. It should be noted that the fractions
defined here are neither the fractions obtained by preparative GPC, nor the fractions
defined by the analytical GPC. These fractions are defined based upon the vaporization
experiments.
E.5.1. High Volatile Bituminous Coal Tars.
Two coal tars - Pittsburgh No.8 and Bruceton - are discussed together because of the
similarities in their vapor pressure behaviors. The GPC chromatograms of the high volatile
bituminous coal tars show all three of the usual peaks but the largest concentration is under
peak 2, believed to be associated with phenolic compounds. Elemental analysis predicts
that an average molecule of Pittsburgh No.8 and Bruceton coal tars would contain up to
two hydroxyl groups and every fourth molecule contains N.

201
Figure E.33 shows the constructed vapor pressure curves for Bruceton coal tar left
after the cool-down cycles, superimposed on the non-isothermal effusion data shown in
Figure E.28. Figure E.34 shows the analogous data for Pittsburgh No.8 coal wire mesh
tar, and Figure E.35 shows the same for Pittsburgh No.8 coal tubular reactor tar. The
vapor pressure curves could thus be obtained as a function of mass loss. To convert to a
molecular weight basis, the curves of Figure E.26 were used, together with the
temperature range of the experiment.
From these data the vapor pressure curves were constructed for evaporated fractions
(which, again are not the same as GPC fractions). Extrapolations of the correlations were
examined up to 800°C. It has been shown by Suuberg et al. [1985] that the yield of tar
from Bruceton coal is essentially complete with peak temperatures > 750°C at 164 kPa,
and in fact even by around 650°C, in the atmospheric pressure experiments. The vapor
pressure curves for evaporated fractions extrapolated up to 800°C together with the
estimates of the molecular weights in each interval are shown for Pittsburgh No.8 coal
wire mesh tar in Figure E.36, for Pittsburgh No.8 coal tubular reactor tar in Figure E.37
and for Bruceton coal fluidized bed tar in Figure E.38. In each case, the actual temperature
range over which data were obtained has been indicated. The fitted curves obviously
pertain to only limited portion of the raw data curves.
It is notable from Figures E.36 to E.38 that the slopes and intercepts for any given
molecular weight have quite similar values for the different tars studied which means that
they likely contain similar components. This suggests that tar volatility does not seem to be
a very sensitive function of tar preparation conditions.
Figure E.39 supports this view. This figure displays the vaporization enthalpy as a
function of molecular weight. A good linear correlation is seen, with data from all these tar
samples falling quite close to the same correlation line. The linear dependence of enthalpy
with molecular weight is not consistent with many earlier tar vapor pressure correlations in
which there was a fractional exponent on molecular weight.

202
Figure E.40 shows the data for the pre-exponential (A) from correlating vapor
pressure with temperature, by using an expression of form:
lnP torr[ ] = A −∆H vap
RT{E.6}
The correlation of A with molecular weight is much more scattered than that of
enthalpy with molecular weight, and strongly suggests systematic differences between
samples. Combining the results of these correlations, it is possible to see that
lnP[torr] = 28.72 + 0.04 ⋅MW −
77 ⋅ MW
T
For a typical temperature of interest of T = 873 K, the correlation would be:
ln P[torr, 873 K]=28.72 - 0.048 • MW
Under similar conditions, the Unger-Suuberg correlation predicts:
ln P[torr, 8773 K]= 15.3 - 0.292 • MW 0.586
For a typical tar of molecular weight 300, the two correlations give ln P = 14.32 and ln
P=7.04, respectively. It is apparent that the new results give much higher vapor pressures
than provided by the old correlation, which had been derived for pure aromatics, for the
most part.
Comparison with the pure compound vapor pressure curves in Figures C.2 to C.13
shows that the tar fractions have higher enthalpy and entropy of vaporization values than
the pure compounds chosen as models. This can be explained by the larger molecules and
existence of hydroxyl groups in the tars. It should of course be remembered that each
evaporated fraction contains a large number of compounds with very different chemical
character and molecular weight. The above cited results seem to strongly suggest that the
vapor pressure curve is heavily influenced by the hydrogen-bond forming compounds.
This suggests different volatility behavior than exhibited by alkyl-substituted aromatic
compounds or hydrogenated coal liquids, because of the more limited hydrogen bonding
opportunities in those model systems. The higher the enthalpy of vaporization the greater
the increase of vapor pressure with temperature.

203
E.5.1.1. Pittsburgh No.8 Coal Tar GPC Fractions.
Attempts were made to study the influence of chemical character on vapor pressure.
The idea was to separate the tar into fractions in the preparative GPC column and compare
the vapor pressure curves of these GPC fractions. These fractions have been shown to
contain differing proportions of different types of compounds. The comparison was based
on the general chemical character obtained from elemental analysis and analytical GPC
spectra. The characterizations of selected fractions are shown Table E.10, and also in
Appendix B (Tables BA.1a and BA.1b). These tars were produced in the tubular reactor.
Table E.10. Chemical characterization of the Pittsburgh No.8 coal tar and itspreparative GPC fractions.
wt%
of tarMW H/C N/C
mainpeak
numberin GPC
N/molecule
OH max/molecule*
relativewt% of
O*
tar 320 1.03 0.012 1 0.3 2 1.1
fraction 1 2.7 540 1
fraction 2 14.6 410 1.2 0.01 1 0.3 2.2 1
fraction 3 29 340 1.02 0.01 1 &2 0.25 2.1 1.1
fraction 4 33 310 1.09 0.012 2 0.25 2.2 1.25* maximum number OH per average molecule was estimated from elemental analysis data given in
Tables DA.1a and DA.1b assuming that all O is present as OH. Amount of S is considered not to besignificant based on Table E.1.
The raw data on fraction vapor pressures are shown in Figures E.41 to E.44. the
whole tar data were previously shown in Figure E.35. The extrapolated vapor pressure
curves are shown for these fractions in Figures E.45 to E.48 up to 800°C. The
comparable whole tar curve was given in Figure E.37. It can be seen that there is an
increase in the magnitude of both entropy and enthalpy terms with molecular weight.
Again, enthalpy is related to the slope of the ln P vs. 1/T curve, and entropy to the
intercept value. At the same time there is also a decrease of molecular weight from fraction
1 to 4. Comparison of the whole tar values with the GPC fraction values indicate that no

204
one fraction is fully representative of the tar, though some fractions clearly come closer.
This will be further considered below.
The estimation of the number average molecular weights for GPC fractions was based
on the correlation in Figure E.26 for Pittsburgh No.8 coal tar and correcting it by a factor
φ:
MW = 1.613 * T[K] * φ {E.7}
This relationship was obtained by tracking the extent of the molecular weight changes
in the tar fractions during vaporization using the effusion data and a simple mole balance.
The tracking was accomplished by using a suitable φ to obtain the same molecular weight
of the residue as that measured by VPO after the effusion experiment. The factor φ was
found to be close to the relative difference between the GPC fractions and whole tar
molecular weights (φ ≈ MWGPC fraction/MWtar). The results are shown in the Table E.11.
Table E.11. Comparison of the correction factor φ with the ratio MWGPC fract to MWtar initial MWby VPO
final MWby VPO
massloss %
φ MWfraction/MWtar
tar 320
GPC fraction 2 410 873 58 0.87 1.281
GPC fraction 3 340 415 49 1.06 1.063
GPC fraction 4 310 410 49.4 0.97 0.969
The value 0.87 for fraction 2 suggests the formation of high a molecular weight
residue caused by condensation type reactions. This is supported by comparison of the
GPC chromatograms of fraction 2 and evaporated fraction 2 in Figure E.49a. Thus, the
increase in MW with temperature is faster than predicted and the value 1.28 has been used
for estimation of effusing species molecular weight. It is apparent that since φ is nearly
unity for GPC fractions 3 and 4 that the model derived for the whole tar applies equally
well in this case. The GPC chromatograms in Figures E.49b and E.49c show no clear
signs of the condensation type reactions after effusion.
Figure E.49 shows the variation of the enthalpy of vaporization with molecular
weight, for the different fractions of the tar, superimposed on the data of Figure E.39.
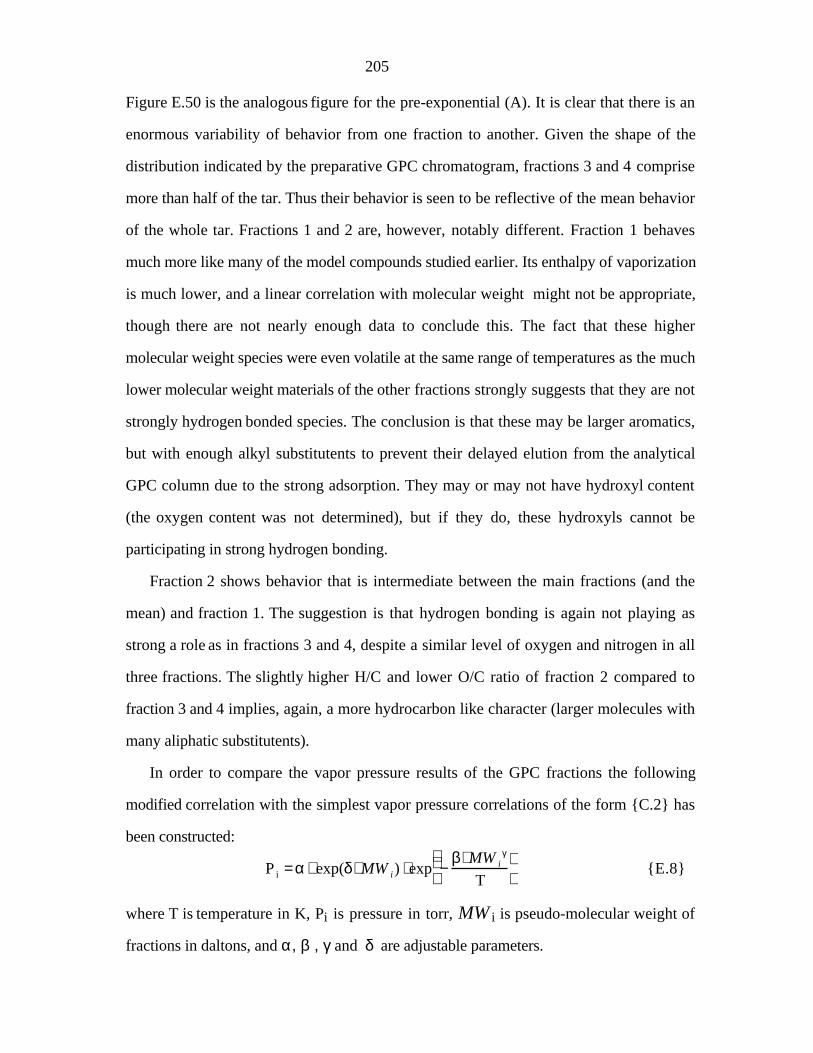
205
Figure E.50 is the analogous figure for the pre-exponential (A). It is clear that there is an
enormous variability of behavior from one fraction to another. Given the shape of the
distribution indicated by the preparative GPC chromatogram, fractions 3 and 4 comprise
more than half of the tar. Thus their behavior is seen to be reflective of the mean behavior
of the whole tar. Fractions 1 and 2 are, however, notably different. Fraction 1 behaves
much more like many of the model compounds studied earlier. Its enthalpy of vaporization
is much lower, and a linear correlation with molecular weight might not be appropriate,
though there are not nearly enough data to conclude this. The fact that these higher
molecular weight species were even volatile at the same range of temperatures as the much
lower molecular weight materials of the other fractions strongly suggests that they are not
strongly hydrogen bonded species. The conclusion is that these may be larger aromatics,
but with enough alkyl substitutents to prevent their delayed elution from the analytical
GPC column due to the strong adsorption. They may or may not have hydroxyl content
(the oxygen content was not determined), but if they do, these hydroxyls cannot be
participating in strong hydrogen bonding.
Fraction 2 shows behavior that is intermediate between the main fractions (and the
mean) and fraction 1. The suggestion is that hydrogen bonding is again not playing as
strong a role as in fractions 3 and 4, despite a similar level of oxygen and nitrogen in all
three fractions. The slightly higher H/C and lower O/C ratio of fraction 2 compared to
fraction 3 and 4 implies, again, a more hydrocarbon like character (larger molecules with
many aliphatic substitutents).
In order to compare the vapor pressure results of the GPC fractions the following
modified correlation with the simplest vapor pressure correlations of the form {C.2} has
been constructed:
P i = α ⋅ exp(δ⋅ MW i ) ⋅ exp −
β⋅ MW iγ
T
{E.8}
where T is temperature in K, Pi is pressure in torr, MW i is pseudo-molecular weight of
fractions in daltons, and α, β , γ and δ are adjustable parameters.

206
The enthalpy and pre-exponential variations with molecular weight were determined by
the linear fit to the data of Figure E.50 and E.51. The parameters obtained are shown in
Table E.12.Table E.12. Vapor pressure correlations for Pittsburgh No.8
coal tar and its GPC fractions.
α δ β γ
whole tar 2.98*1012 0.04 76.9 1
fraction 1 5.726*105 0.031 33.8 1
fraction 2 5.657*1014 0.009 54.9 1
fraction 3 2.212*1012 0.043 71.7 1
fraction 4 3.776*1011 0.067 83.2 1
The values in table E.12 show the expected increase in both enthalpy of vaporization
and pre-exponential with molecular weight. As these data and Figure E.50 and E.51
show, the main fractions (3 and 4) have a higher enthalpy of vaporization and pre-
exponential than do fractions 1 and 2, for any given molecular weight. The increase in
these quantities with molecular weight is also greater. This would be expected if the
fractions 3 and 4 are more polar, and that the number of polar interactions increases with
molecular weight. It might be anticipated with increasing value of molecular weight, van
der Waals-type interactions will become more important than polar interactions, because of
the numbers of van der Waals interactions is roughly linear in molecular weight, while
polar interactions are not. This is, however, not observed here.
Comparison with some of the existing vapor pressure correlations are shown in
Figure E.52a at 500°C and at 600°C in Figure E.52b. There are several features that
apparently need consideration. The data of Figures E.52a and E.52b are useful for
recognizing the complexity of the tar vaporization process during pyrolysis. The overall
vapor pressure, and therefore the tar evaporation process is determined by the chemical
character of tar. The above cited results seem to suggest that there are three very different
vapor pressure behaviors. The first is for the compounds with high molecular weight with

207
significant aliphatic content, the second for compounds with significant hydroxyl group
content and medium molecular weight, and the third for medium molecular weight
compounds without hydroxyl groups, including pure PAH. This is a bit different from
what may be seen in coal liquids which do not necessarily contain as large a variety of
constituents after a high degree of hydrogenation. Figures E.52a and E.52b imply that the
commonly employed correlations may easily be quite far off from the true behavior, in
critical ranges of molecular weight. This will be further discussed below, in the context of
data from a larger number of tars.
E.5.2. Upper-Freeport Medium Volatile Bituminous Coal Tar.
Upper-Freeport (medium volatile bituminous) coal gives a tar number average
molecular weight of 280 and an H/C ratio of 1.05. Elemental analyses predict that every
second molecule would contain one hydroxyl group and that every fifth molecule contains
N. The GPC shows few compounds with polymethylene character (peak 1) and the
chromatogram is dominated by the second and third peaks. The higher average molar
absorbance of this tar suggests a larger aromatic content than that in the other tars
investigated (see Table E.9). The experimental and extrapolated vapor pressure curves are
shown for Upper-Freeport wire mesh tar up to 800°C in Figure E.53. The raw data and
the curve fits for tar left after the cool-down cycles are shown in Figure E.54. The Upper-
Freeport coal tar generally has higher vapor pressure and a lower heat of vaporization for
any particular molecular weight than does than Pittsburgh No.8 coal tar (compare Figures
E.36 and E.53). This is consistent with the hypothesis of the influence of hydrogen
bonding, especially involving hydroxyl groups. Figure E.55 shows a comparison of the
∆Hvap/R of the Upper-Freeport coal tar with the fractions of the Pittsburgh No.8 coal tar.
This comparison suggest Upper-Freeport coal tar is similar to the Pittsburgh No.8 coal tar
fraction 2 or 3. Figure E.56 shows that the pre-exponential for the Upper-Freeport coal tar

208
extrapolates to that for the Pittsburgh No.8 coal tar fraction 2. It is apparent that the
behavior of the Upper-Freeport coal tar, on this basis, is somewhat similar to that of
fraction 2. The implication is that the Upper-Freeport coal tar is somewhat more
hydrocarbon-like in character than is most of the Pittsburgh No.8 coal tar in which fraction
2 is a small contributor. Still, the implication is that hydrogen bonding (through hydroxyl
groups) could be having some influence an behavior, because the results track Pittsburgh
fraction 2 not fraction 1. The latter was above judged to be most hydrocarbon like.
E.5.3. Wyodak Subbituminous Coal Tar.
The Wyodak subbituminous coal tar studied here has a number average molecular
weight of 350 and an H/C ratio of 1.2. Elemental analysis predicts that an average
molecule could contain about two hydroxyl groups and that every fifth molecule contains
N. The GPC shows a higher concentration of molecules enriched in polymethylene
substitutents and the lowest average molar absorbance implying the smallest aromatic
cluster sizes or aromatic content. This suggests more aliphatic character in the tar. The
experimental and extrapolated vapor pressure curves, up to 800°C, are shown for Wyodak
coal wire mesh tar in Figure E.57. The raw data and the curve fits for tar remaining after
the cool-down cycles are shown in Figure E.58. The enthalpy of vaporization and pre-
exponential are comparable to those seen in Pittsburgh No. 8 coal tar. Figure E.59
compares the variation in ∆Hvap of the Wyodak coal tar with the Pittsburgh No.8 coal tar
fractions. In this case, the whole Wyodak coal tar appears quite similar to fraction 3 of the
Pittsburgh No.8 coal tar. Since fraction 3 is the fraction that best characterizes the whole
Pittsburgh No.8 coal tar, the surprising result emerges that the enthalpies of the two tars
show a very similar molecular weight dependence. Figure E.60 shows that the
correspondence also carries over to the pre-exponential (A).

209
The experimental and extrapolated vapor pressure curves up to 800°C are shown also
for Wyodak coal tar fraction 1 in Figure E.61. It may be noted in Figures E.59 and E.60
that this fraction is quite similar to fraction 1 of the Pittsburgh No.8 coal tar, and therefore
quite different from the rest of the tar. The curve fits and raw data are shown in Figure
E.62. Fraction 1 has been shown to contain up to 50 % of the mass of the Wyodak coal
tar (see Appendix BA.5b) and elutes below 1820 sec from analytical GPC column.
Comparison with the results in Figure E.57 strongly suggests that the measured vapor
pressure behavior of this fraction is quite different than that of the fractions eluting above
1820 second (see Appendix BA.5b and Figure E.10). The whole tar and fraction one are
very different because the latter is presumably dominated by large hydrocarbons, whereas
the former shows a significant effect of polar functionality as well.
E.5 .4 . Comparison of Boiling Point Correlations at 760 Torr.
Figure E.63 presents the comparison of the atmospheric boiling point data of tars with
the Unger-Suuberg [1985], Fletcher-Grant-Pugmire (FGP) [1992], Oh et al. [1989],
Niksa-Kerstein [1991] correlations. These correlations were selected for comparison
because they are widely used in coal pyrolysis models.
All atmospheric boiling points are lower than predicted from the Unger-Suuberg
correlation. Unger and Suuberg [1985] developed this vapor pressure correlation based on
the boiling points of six aromatic hydrocarbons with molecular weights between 198 and
342 at a total pressure of 0.5 torr. The Unger-Suuberg correlation has been limited in its
application to typical coal pyrolysis condition. For example, Oh and coworkers [Oh et al.,
1989] found that the Unger-Suuberg correlation is consistent with high-temperature
pyrolysis data (T > 600°C) but not with low temperature data (T < 600°C). Solomon and
co-workers [Solomon et al., 1988] have used this correlation multiplied by a factor of 10

210
in order to fit tar and total volatiles yields. Thus, the general opinion was that the Unger-
Suuberg correlation over-predicts boiling point, or under-predicts vapor pressure.
As shown, there is fair agreement between the Oh et al. correlation and Wyodak coal
tar fraction 1 and Pittsburgh No.8 coal tar fraction 1 data. The correlation is especially
good for the low fraction numbers. It may be recalled that these fractions eluted below
1820 second from the GPC column and contain large molecules with highly alkylated
character. As hypothesized earlier, this may reduce the influence of hydrogen bonding in
this fraction. This agreement is not surprising, since Oh et al. again emphasized aromatic
hydrocarbons in developing their correlation..
The parameters in the vapor pressure correlation used by Niksa and Kerstein were
used as fitting parameters to achieve agreement with the measured molecular weight
distribution of the pyrolysis tars. This equation is used in the FLASHCHAIN pyrolysis
model. It is seen here to underpredict the estimated boiling points of all fractions.
The Upper-Freeport coal tar shows good agreement with the FGP correlation. The
FGP correlation was based on vapor pressure data of 12 narrow boiling point fractions
distilled from coal liquids produced from SRC-II processing of Pittsburgh seam
bituminous coal [Gray et al., 1983, 1985]. The FGP correlation agrees with the measured
vapor pressures of coal liquids and boiling points of pure compounds over a wide range of
pressures [Fletcher and Kerstein, 1992]. The Upper-Freeport coal tar elemental analyses
show comparable oxygen content to SRC-II coal liquids. Additionally, the coal liquids are
considered to be made up primarily of two- to five condensed ring compounds
[Tsonopoulos et al., 1986]. Thus the coal liquids are likely closest to Upper-Freeport coal
tar in terms of composition. They are the least polar. This could be reason why the FGP
correlation appears to apply best to Upper-Freeport coal tar.
Pure Pittsburgh No. 8 coal tar, its fractions 3 and 4, and Wyodak coal tar show a
rapid increase in boiling point with increasing temperature. In these tars, the phenolic
compounds, probably the major type of oxygen-containing compounds present, are
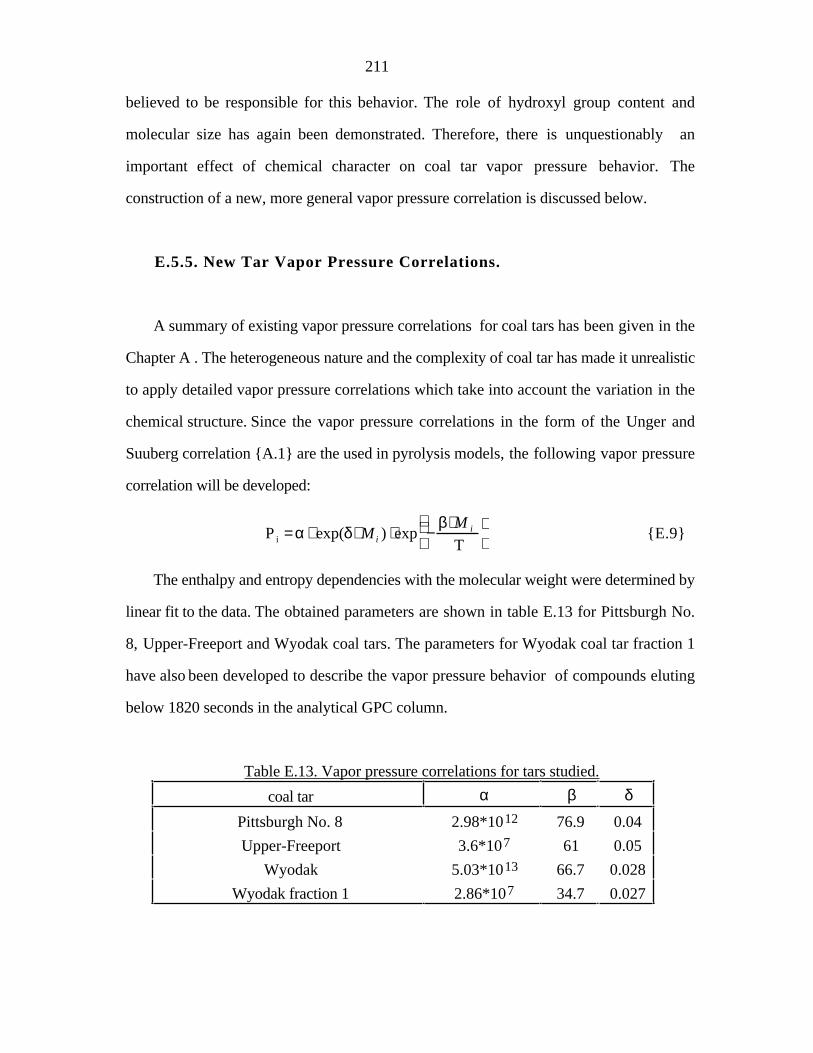
211
believed to be responsible for this behavior. The role of hydroxyl group content and
molecular size has again been demonstrated. Therefore, there is unquestionably an
important effect of chemical character on coal tar vapor pressure behavior. The
construction of a new, more general vapor pressure correlation is discussed below.
E.5.5. New Tar Vapor Pressure Correlations.
A summary of existing vapor pressure correlations for coal tars has been given in the
Chapter A . The heterogeneous nature and the complexity of coal tar has made it unrealistic
to apply detailed vapor pressure correlations which take into account the variation in the
chemical structure. Since the vapor pressure correlations in the form of the Unger and
Suuberg correlation {A.1} are the used in pyrolysis models, the following vapor pressure
correlation will be developed:
P i = α ⋅ exp(δ⋅ M i ) ⋅exp −
β⋅ M i
T
{E.9}
The enthalpy and entropy dependencies with the molecular weight were determined by
linear fit to the data. The obtained parameters are shown in table E.13 for Pittsburgh No.
8, Upper-Freeport and Wyodak coal tars. The parameters for Wyodak coal tar fraction 1
have also been developed to describe the vapor pressure behavior of compounds eluting
below 1820 seconds in the analytical GPC column.
Table E.13. Vapor pressure correlations for tars studied.
coal tar α β δ
Pittsburgh No. 8 2.98*1012 76.9 0.04
Upper-Freeport 3.6*107 61 0.05
Wyodak 5.03*1013 66.7 0.028
Wyodak fraction 1 2.86*107 34.7 0.027
212
The comparison with FGP, Unger-Suuberg and Niksa-Kerstein correlations are
shown at 300°C, 500°C and 700°C in Figures E.64 to E.66 respectively. The middle non-
striped area indicates the actual molecular weight region where the measurements were
performed. It is apparent that the new results validate the predictions of the vapor
pressures in this molecular weight range provided by the older correlations, but the new
correlations also show relatively weaker dependence on temperature. Again, the
correlation based on Wyodak coal tar fraction 1 data shows better agreement with the
Niksa-Kerstein correlation. The correlation based on Upper-Freeport tar data agrees better
with the FGP correlation as expected. The correlations based on Wyodak and Pittsburgh
No. 8 coal tars data are significantly different from the previous correlations; the vapor
pressures initially have very high values and then drop quickly with molecular weight. It
was suggested above that such vapor pressure behavior could be expected from polar
medium size molecules with molecular weight below 400 daltons. As molecular weight
increases, these vapor pressure correlations should change from being dominated by
species characteristic of Pittsburgh or Upper-Freeport coal tar to being dominated by
behavior such as that of Wyodak fraction 1.
The correlations indicate again the important effect of chemical character on coal tar
vapor pressure behavior. Again, the results suggest that there are three very different
vapor pressure behaviors (see section E.5.1.): first the compounds with high molecular
weight (Wyodak coal tar fraction 1), second the compounds of high hydroxyl group
content with medium molecular weight (Pittsburgh No.8 coal tar and Wyodak coal tar) and
third the medium molecular weight compounds without significant hydrogen bonding
character (Upper-Freeport coal tar).
In summary, vapor pressure correlations for the Pittsburgh No.8, the Wyodak and the
Upper-Freeport coal tars have been developed for use in pyrolysis models. It may be seen
that tar volatility is in no sense "simple" and is considerably more complicated than had
been believed. The volatility is quite different for different coal tars. It does not depend on

213
molecule size only. Based upon the work performed here, however, there is generally a
good possibility of developing a general vapor pressure correlation based on the molecular
weight and some certain specific chemical character. There is a notable dependence of coal
tar vapor pressure on hydroxyl group content .

214
1 2 3 4
0 10 20 30 40 50
Figure E1. Separation of coal-derived liquids by GPC based upon Philip and Anthony [1982]. Column µStyragel, THF flowrate 1ml/min. 1- polymers +colloidal carbons; 2 - alkanes(C14...C44) + asphaltenes; 3 - phenols; 4 - aromatics
retention volume [ ml ]

215
0
200
400
600
800
1000
20 22
Mol
ecul
ar W
eigh
t [g/
mol
]
24 26 28 30 32
Elution volume [ml]Figure E.2. GPC elution data for standard compounds (Strachan and Johns, 1985).
Conditions: Columns, 100Å and 500Å µStyragel; solvent THF.
aliphaticsaromaticsN,S,O aromaticsOH aromatics

216
0
100
200
300
400
500
600M
olec
ular
Wei
ght [
g/m
ol]
30 35 40 45 50
Elution volume [ ml ]Figure E.3. GPC elution data for standard compounds (Rodgers et al.,1987).
Conditions: Columns, 1000Å, 500Å and 100Å µStyragel; solvent THF
aromaticsphenyl aromaticsalkyl aromaticsalkanes

217
100
200
300
400
500
600
Mol
ecul
ar w
eigh
t [ g
/mol
]
1700 1800 1900 2000 2100 2200 2300 2400 2500
retention time [ sec ]Figure E.4. GPC elution data for standard compounds.
Solvent: pyridine, flowrate 0.3 ml/min; Column: packing - 10...100Å Phenogel, temperature: 30°C.
polar with OHslightly polar with S,N & C=Ounsubstituted aromatics phenyl aromaticsalkyl aromatics
6
20
19
17
18
15
14
16
9
13
5
4
2
3
1
8
7 11
12
10

218
-0.1
0
0.1
0.2
0.3
0.4
0.5
0.6
UV
abs
orba
nce
at 3
05 n
m
1000 1200 1400 1600 1800 2000 2200 2400
elution time [ sec ]Figure E.5. GPC chromatograms for Bruceton coal tar and the first 5 fractions,
collected from the preparative GPC column.
2600
tarfraction 1fraction 2fraction 3fraction 4fraction 5

219
-0.1
0
0.1
0.2
0.3
0.4
0.5
0.6U
V a
bsor
banc
e at
305
nm
0.7
1000 1200 1400 1600 1800 2000
elution time [ sec ]Figure E.6. GPC chromatograms for whole Bruceton coal tar and the last 4 fractions
collected from the preparative GPC column.
2200 2400
tar
fraction 6
fraction 7
fraction 8
fraction 9
2600

220
-0.01
0
0.01
0.02
0.03
0.04
0.05U
V a
bsor
banc
e at
305
nm
1000 1200 1400 1600 1800 2000 2200 2400
elution time [ sec]Figure E.7. Reconstruction of the curve for whole Bruceton coal tar by summing the contributions of tar fractions, where Aj is total absorbance at j elution time, xi is the mass fraction of fraction i
whole Bruceton coal tarconstructed from fractionsby A
j= ∑ x
a
ij
2600
and ai j
is the absorbance of fraction i at j elution time.

221
-0.1
0
0.1
0.2
0.3
0.4
0.5
0.6
0.7
UV
abs
orba
nce
at 3
05 n
m
1000 1200 1400 1600 1800 2000
elution time [sec]
Figure E.8. Analytical GPC chromatograms for Pittsburgh No.8 coal tar and its fractions, separated by preparative GPC.
tar
fraction 2
fraction 3fraction 4
fraction 5
fraction 6
2200 2400 2600

222
-0.2
0
0.2
0.4
0.6
0.8
1
1000 1200
UV
abs
orba
nce
at 3
05 n
m
1400 1600 1800 2000 2200 2400
elution time [ sec]
Figure E.9. Analytical GPC chromatograms for Illinois No.6 coal tar and its fractions, separated by preparative GPC.
tar
fraction 1
fraction 2
fraction 3
fraction 4
fraction 5
fraction 6
2600

223
-0.1
0
0.1
0.2
0.3
0.4
0.5
1000 1200
UV
abs
orba
nce
at 3
05 n
m
1400 1600 1800 2000 2200 2400
elution time [ sec ]Figure E.10. Analytical GPC chromatograms for Wyodak coal tar and
its fractions, separated by preparative GPC.
tar
fraction 1
fraction 2
fraction 3
2600

224
-0.2
0
0.2
0.4
0.6
0.8
1U
V a
bsor
banc
e at
305
nm
.
1000 1200 1400 1600 1800 2000
elution time [sec ]
Figure E.11. Analytical GPC chromatograms for Upper Freeport coal tar and its fractions, separated by preparative GPC.
tar
fraction 0
fraction 1
fraction 2
fraction 3
fraction 4
2200 2400 2600

225
-0.2
0
0.2
0.4
0.6
0.8
1
1.2U
V a
bsor
bam
ce
500 700 900 1100 1300
retention time [sec]Figure E.12. Normalized absorbance for whole Bruceton coal tar at different UV wavelengths.
305 nm310 nm330 nm350 nm370 nm390 nm
1500


228
0
0.08333
0.1667
0.25
0.3333
0.4167
0.5U
V a
bsor
banc
e at
305
nm
1000 1200 1400 1600 1800 2000
retention time [sec]Figure E.15. Comparison of Illinois No.6 coal tar GPC chromatograms before and after heating at 200°C for 2 hours. Comparison is based on 0.2 mg of each material
injected into the GPC column.
Illinois No.6 coal tarIllinois No.6 coal tar heated
2200 2400 2600

229
-0.2
0
0.2
0.4
0.6
0.8
1
1.2U
V a
bsor
banc
e at
305
nm
900 1325 1750 2175 2600Elution time [sec]
Figure E.16. Comparison of Wyodak coal tar GPC chromatograms before and after heating at 280°C for 2 hours. Comparison is based 0.5 mg of each
material injected into the GPC column.
Wyodak coal tar
Wyodak coal tar heated

230
-0.1
0
0.1
0.2
0.3
0.4
0.5
UV
abs
orba
nce
at 3
05 n
m
1000 1200 1400 1600 1800 2000 2200 2400 2600elution time [ sec]
Figure E.17. Comparison of Upper-Freeport coal tar GPC chromatograms beforeand after heating at 280°C for 2 hours. Comparison is based on 0.2 mg each material
injected into the GPC column.
Upper-Freeport coal tar
Upper-Freeport coal tar heated.

231
-0.2
0
0.2
0.4
0.6
0.8
1
UV
abs
orba
nce
at 3
05 n
m
1000 1200 1400 1600 1800 2000
elution time [ sec ]
Figure E.18. Comparison of the old and fresh Illinois No.6 coal tars, GPC spectra.
fresh , MW 270
old, MW 310
2200 2400 2600

232
-0.1
0
0.1
0.2
0.3
0.4
0.5U
V a
bsor
banc
e at
305
nm
1000 1200 1400 1600 1800 2000
time[sec]Figure E.19. Comparison of the fresh and old Pittsburgh No.8 coal tars,
GPC spectra.
fresh, MW 320
old, MW 340
2200 2400 2600

233
0
20
40
60
80
100
wei
ght p
erce
nt v
apor
ized
.
100 240 380 520 660 800
T[°C]Figure E.20. Relative volatility of lignite and bituminous coal tars
as a function of heated grid temperature [Freihaut et al., 1993].
lignitevacuum PittsburghPittsburghPocahontas

234
0
0.1
0.2
0.3
0.4
0.5
0.6
0.7
0.8
UV
abs
orba
nce
at 3
05 n
m
1000 1200 1400 1600 1800 2000
retention time [sec]Figure E.21. GPC chromatograms for Bruceton coal tar and its fractions
separated by vacuum sublimation. Comparison is made based on 0.2 mg of each material injected into the GPC column.
whole tar, MW 34711 % vaporized at 140°C, MW24036 % vaporized at 280°C, MW 27053 % left, MW 628
2200 2400 2600

235
-0.1
0
0.1
0.2
0.3
0.4
0.5
UV
abs
orba
nce
at 3
05 n
m
900 1325 1750 2175 2600
elution time [ sec ]
Figure E.22. GPC chromatograms for Wyodak coal tar and its fractions separatedby vacuum sublimation. Comparison is made based on 0.2 mg
of each material injected into the GPC column.
left after 250°C,MW 935at 250°C, MW 430
at 200°C, MW 360
at 150°C, MW 250
at 100°C, MW 230tar

236
-0.2
0
0.2
0.4
0.6
0.8
1U
V a
bsor
banc
e at
305
nm
1000 1200 1400 1600 1800 2000
elution time [ sec ]Figure E.23. GPC chromatograms for Upper-Freeport coal tar and its fractions
separated by vacuum sublimation. Comparison is made based on 0.2 mg of each material injected into the GPC column.
left after 250°C, MW 575
at 250°C, MW 300
at 200°C, MW 285
at 150°C, MW 240at 100°C, MW 200
tar
2200 2400 2600

237
-0.05
0
0.05
0.1
0.15
0.2
0.25
0.3
0.35U
V a
bsor
banc
e at
305
nm
900 1325 1750 2175 2600elution time [ sec ]
Figure E.24. Reconstruction of the GPC spectra for Wyodak coal tar by summing the contributions of tar vacuum sublimation fractions.
tar
evaporated
left + evaporated

238
-0.1
0
0.1
0.2
0.3
0.4
0.5
0.6
UV
abs
orba
nce
at 3
05 n
m
1000 1200 1400 1600 1800 2000
elution time [ sec ]
Figure E.25. Reconstruction of the GPC spectra for Upper-Freeport coal tar by summing the contributions of tar vacuum sublimation fractions.
evaporated fractions
left + evaporated
tar
2200 2400 2600

239
200
250
300
350
400
450
350
Mol
ecul
ar W
eigh
t [g/
mol
]
390 430 470 510 550
MW(Wyodak) =-5792.5+73.76*T(K)-0.32*T(K)+0.000589*T(K)-8.89*10-7*T(K)
MW(Upper-Freeport)=71.759-1.67*T(K)+0.0087*T(K)-8.89*10-6*T(K)
T[K]
Figure E.26. Vapor phase molecular weight dependence on effusion temperature.
Pittsburgh No.8 coal tar
Upper-Freeport coal tarWyodak coal tar
MW(Pittsburgh No.8)=0.613*T(K)
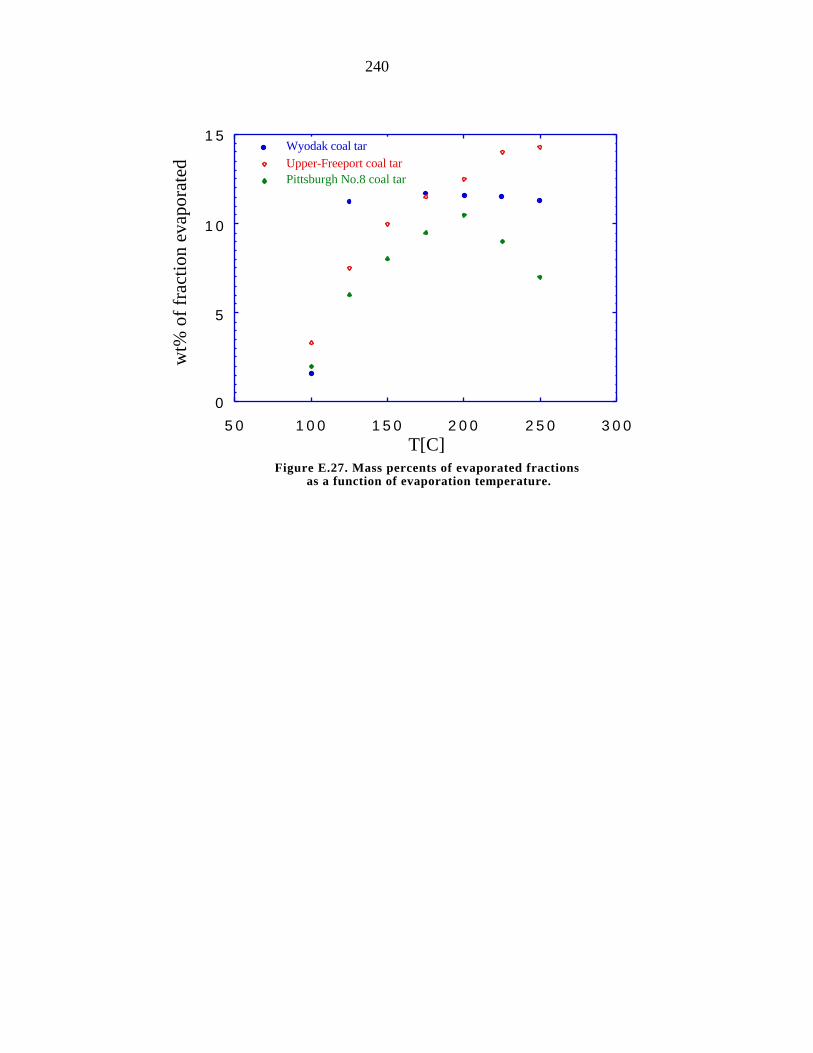
240
0
5
10
15
wt%
of
frac
tion
eva
pora
ted
50 100 150 200 250 300T[C]
Figure E.27. Mass percents of evaporated fractions as a function of evaporation temperature.
Wyodak coal tarUpper-Freeport coal tarPittsburgh No.8 coal tar

241
-10
-9
-8
-7
-6
-5
lnP
[ to
rr ]
-4
0.002 0.0022 0.0024 0.0026 0.0028 0.003
1/T[K]Figure E.28. The non-isothermal Knudsen effusion method applied
to whole Bruceton coal tar.
mass loss from 5% to 20%
mass lossfrom 20% to 37%mass loss 37% to 54%
mass loss from 54% to 68%
mass loss from 68% to 82%
0.0032

242
0
0.0875
0.175
0.2625
0.35
0.4375
0.525
0.6125
0.7U
V a
bsor
banc
e at
305
nm
1000 1200 1400 1600 1800 2000
elution time [sec]Figure E.29. GPC chromatograms for various coal tars studied.
Comparison is based on 0.2 mg of each material injected into the GPC column.
Pittsburgh No. 8 coal tarIllinois No. 6 coal tarBruceton coal tarUpper-Freeport coal tarWyodak coal tar
2200 2400 2600

243
-10
-9
-8
-7
-6
-5ln
P [
torr
]
0.0026 0.00265 0.0027 0.00275 0.0028
1/T [K]Figure E.30. Effusion method applied to a mixture of Illinois No.6 coal tar
GPC fraction 4 (50%) and 1-hydroxypyrene (balance).
fr.4+hydroxypyrene1-hydroxypyreneIllinois No.6 coal tar fr.4 Raoult's law
ln P = 40.048 -17839/T
ln P = 32.88-15513/T ln P = 47.029-20142/T
ln P = 40.323-17990/T
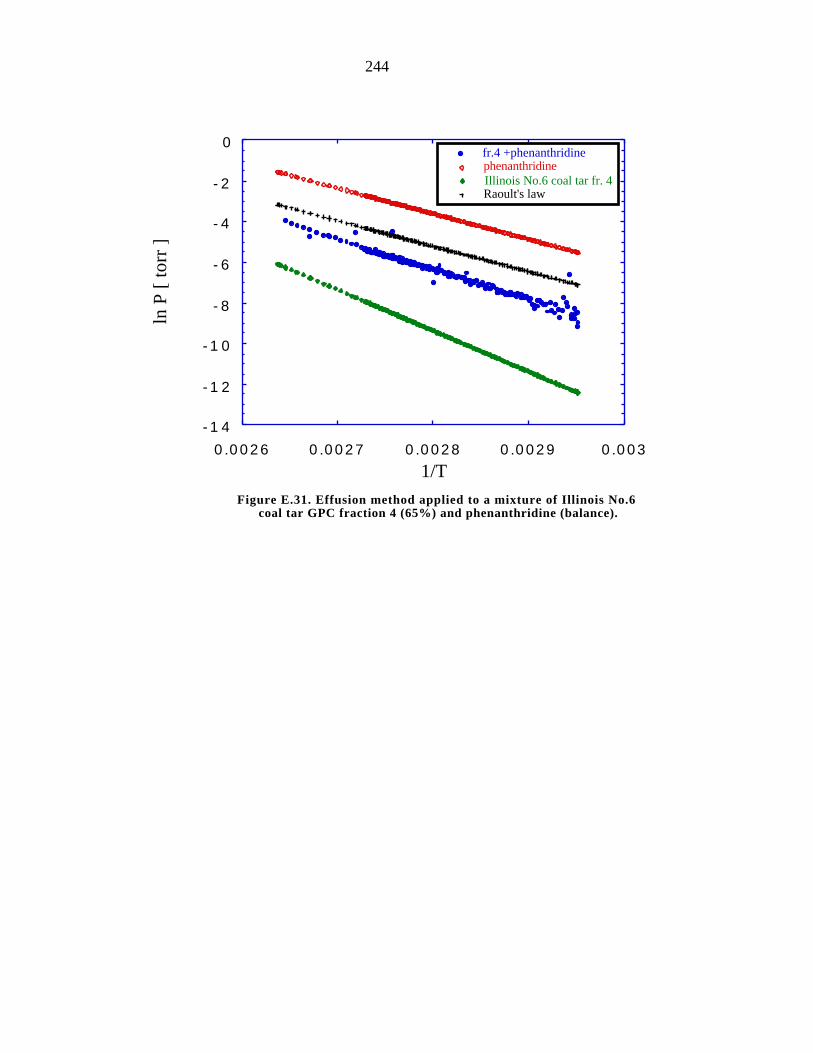
244
-14
-12
-10
-8
-6
ln P
[ to
rr ]
-4
-2
0
0.0026 0.0027 0.0028 0.0029
1/T
Figure E.31. Effusion method applied to a mixture of Illinois No.6 coal tar GPC fraction 4 (65%) and phenanthridine (balance).
fr.4 +phenanthridinephenanthridineIllinois No.6 coal tar fr. 4Raoult's law
0.003

245
-10.5
-10
-9.5
-9
-8.5
-8
-7.5
-7
-6.5ln
P [
torr
]
0.0023 0.002425 0.00255 0.002675 0.0028
Figure E.32. Simulated vapor pressure experiment. Open points are simulated effusion data. Solid points show the vapor pressure curve for mixture left after each cool-down cycle.
point 1
point 2
1/T [ K ]
simulated effusion datavapor pressure curve formixture at point 1vapor pressure curve formixture at point 2
cooling
heating
cooling
heating
heating
cooling

246
-9.5
-8.5
-7.5
-6.5
-5.5
-4.5
ln P
[ to
rr ]
-3.5
-2.5
0.002 0.0022 0.0024 0.0026 0.0028 0.003 0.00321/T [ K ]
Figure E.33. Raw vapor pressure data for Bruceton coal tar produced in the fluidized bed reactor.
4 wt% evaporated
20 wt% evaporated
37.5 wt% evaporated
54 wt% evaporated
68.5 wt% evaporated
82 wt% evaporated
ln P = 34.823 -14204/T
ln P = 35.919-15825/T
ln P = 36.221 -17216/T
ln P = 36.109 -18355/T
ln P = 36.557 -19541/T
ln P = 37.332 -21291/T

247
-9.5
-8.5
-7.5
-6.5
-5.5
-4.5ln
P [
torr
]
0.0018 0.00198 0.00216 0.00234 0.00252 0.0027
1/T [ K ]Figure E.34. Raw vapor pressure data for Pittsburgh No.8 coal tar
produced in the wire mesh reactor.
13 wt% evaporated
24 wt% evaporated
35 wt% evaporated
43 wt% evaporated
49 wt% evaporated
ln P = 37.283-18239/T
ln P = 37.911 -19755/T
ln P = 38.127-21263/T
ln P = 39.633 -22954/T
ln P = 40.639 -24396/T

248
-10
-8.125
-6.25
-4.375
-2.5
0.0016
ln P
[ to
rr ]
0.0018 0.002 0.00220.00240.00260.0028 0.0031/T [ K ]
Figure E.35. Raw vapor pressure data for Pittsburgh No.8 coal tar produced in the tubular reactor.
6 wt% evaporated16.5 wt% evaporated
30 wt% evaporated
48 wt% evaporated60 wt% evaporated
69 wt% evaporated75 wt% evaporated
ln P = 37.861 -17442/T
ln P = 38.763 -18862/T
ln P = 38.232 -19744/T
ln P = 40.791 -22449/T
ln P = 39.344 -23557/T ln P = 40.542 -25992/T
ln P = 41.391-27729/T

249
-40
-30
-20
-10
0
10
20
30
ln P
[to
rr]
0.0005 0.001 0.0015 0.002 0.0025 0.003 0.00351/T [K]
Figure E.36. The vapor pressure curves for Pittsburgh No.8 wire mesh coal tar. The heavier portion of the curves indicates the actual range of temperatures over
which the data were obtained.
MW 245
MW 265
MW 285
MW 300
MW 315
ln P= 38.636 -18148/T
ln P = 39.193 -19698/T
ln P = 39.45 -21075/T
ln P = 40.661 -22806/T
ln P = 42.096 -24396/T

250
-50
-40
-30
-20
-10
0
10
20
30ln
P [
torr
]
0.0005 0.001 0.0015 0.002 0.0025 0.003
ln P = 39.423 -17285/T
1/T [ K ]Figure E.37. The vapor pressure curves for Pittsburgh No.8 tubular
reactor coal tar. The heavier portion of the curves indicates the actual range of temperatures over which the data were obtained.
MW 230
MW 245
MW 265
MW 285
MW 315MW 340
MW 360
ln P = 40.034 -18799/T
ln P = 39.752 -19649/T
ln P = 42.043 -22431/T
ln P = 41.171-23557/T
ln P = 42.542 -25992/T
ln P = 43.391 -27729/T
0.0035

251
-40
-30
-20
-10
0
10
20ln
P [
torr
]
30
0.0005 0.001 0.0015 0.002 0.0025 0.003
1/T [ K ]Figure E.38. The vapor pressure curves for Bruceton coal tar.
The heavier portion of the curves indicates the actual rangeof the temperatures over which the data were obtained.
MW 233
MW 256
MW 275
MW 294
MW 315
0.0035
ln P = 37.262 -15748/T
ln P = 37.414 -17147/T
ln P = 37.403 -18227/T
ln P = 37.909 -19469/T
ln P = 38.928-21291/T

252
10
14
18
22
26
30
190 232.5
∆Hva
p/R [
K*
103 ]
275 317.5 360MW [g/mol]
Figure E.39. Vaporization enthalpy as a function of molecular weight for Pittsburgh Seam coal tars.
wire mesh reactortubular reactor
fluidized bed reactorsummary
∆Hvap
/R = -540.82 + 76.88*(MW)

253
37
38
39
40
41
42
43Pr
e-ex
pone
ntia
l A
44
200 240 280 320 360MW [g/mol]
Figure E.40. The pre-exponential (A) as a function of molecular weight for Pittsburgh Seam coal tars.
wire mesh reactor
tubular reactor
fluidized bed reactor
summary
A = 28.723 + 0.040012 (MW)
400

254
38
39
40
41
42
43
44
200
Pre-
expo
nent
ial A
240 280 320 360 400
MW [g/mol]
Figure E.40a. The pre-exponential (A) as a function of molecular weight for Pittsburgh No.8 coal tars, excluding fluidized bed data.
wire mesh reactor
tubular reactor summary
A = 31.106 + 0.033349 (MW)

255
-10.5
-9.5
-8.5
-7.5
-6.5
-5.5
0.0018 0.0019
ln P
[ to
rr ]
0.002 0.0021 0.0022 0.0023
ln P = 26.487 -15783/T
ln P = 27.78 -17406/T
1/T [K]Figure E.41. Raw data for Pittsburgh No.8 coal tar fraction 1
separated by preparative GPC.
4 wt % evaporated
12 wt% evaporated
23.5 wt% evaporated
27 wt% evaporated
ln P = 28.201-18973/T
ln P = 28.889 -20006/T

256
-9.5
-8.5
-7.5
-6.5
-5.5
-4.5
-3.5
0.0018
ln P
[to
rr]
0.002 0.0022 0.0024 0.0026
ln P = 35.534 -18080/T
ln P= 35.999 -19352/T
ln P = 37.456-21207/T
ln P = 38.863-23453/T
1/T [K]Figure E.42. Raw data for Pittsburgh No.8 coal tar fraction 2
separated by preparative GPC.
7.5 wt% evaporated18 wt% evaporated31 wt% evaporated45 wt% evaporated
0.0028

257
-9.5
-8.5
-7.5
-6.5
-5.5
-4.5
-3.5
-2.5
ln P
[ to
rr ]
0.002 0.0022 0.0024 0.0026 0.0028 0.003
ln P = 37.312 -16598/T
ln P = 37.728-18345/T
1/T [ K ]Figure E.43. Raw data for Pittsburgh No.8 coal tar fraction 3
separated by preparative GPC.
6 wt% evaporated
17 wt% evaporated
33.5 wt% evaporated
47.5 wt% evaporated
ln P = 38.984 -20289/T
ln P = 39.934 -21982/T

258
-9.5
-8.5
-7.5
-6.5
-5.5
-4.5
-3.5
0.002
ln P
[ to
rr ]
0.0022 0.0024 0.0026 0.0028 0.003
ln P = 40.52 -18510/T
1/T [ K ]Figure E.44. Raw data for Pittsburgh No.8 coal tar fraction 4
separated by preparative GPC.
16.5 wt% evaporated
32.4 wt% evaporated47.6 wt% evaporated
ln P = 41.216 -20034/T
ln P = 42.621 -21943/T

259
-20
-15
-10
-5
0
5
10
ln P
[to
rr]
15
20
0.0005 0.001 0.0015 0.002 0.0025
1/T [K]Figure E.45. The vapor pressure curves for Pittsburgh No.8 coal tar fraction 1
separated by preparative GPC. The heavier portions of the curves indicatethe actual range of temperatures over which the data were obtained.
MW 480
MW 515
MW 560
MW 580
ln P = 27.95-15613/T
ln P = 29.512 -17334/T
ln P = 29.355-18748/T
ln P = 30.716-20006/T

260
-40
-30
-20
-10
0
10
20
30
ln P
[to
rr]
0.0005 0.0009 0.0013 0.0017 0.0021 0.0025
ln P= 36.942 -17964/T
1/T [K]Figure E.46. The vapor pressure curves for Pittsburgh No.8 coal tar fraction 2
separated by preparative GPC. The heavier portions of the curves indicate the actual rangeof temperatures over which the data were obtained.
MW 325MW 350MW 370
MW 405
ln P = 37.377-19222/T
ln P = 38.681-21150/T
ln P = 40.341 -23453/T

261
-30
-20
-10
0
10
20
30
ln P
[to
rr]
0.0005 0.001 0.0015 0.002 0.0025 0.003 0.00351/T [K]
Figure E.47. The vapor pressure curves for Pittsburgh No.8 coal tar fraction 3separated by GPC. The heavier portions of the curves indicate the actual range
of temperatures over which the data were obtained.
MW 220
MW 245
MW 265MW 285
ln P = 39.002 -16545/T
ln P = 39.351 -18252/T
ln P = 40.526 -20188/T
ln P = 41.78 -21982/T

262
-30
-20
-10
0
10
20
30
40
ln P
[to
rr]
0.0005 0.001 0.0015 0.002 0.0025 0.003
ln P = 42.43 -18401/T
1/T [K]Figure E.48. The vapor pressure curves for Pittsburgh No.8 coal tar fraction 4separated by GPC. The heavier portions of the curves indicate the actual range
of temperatures over which the data were obtained.
MW 225
MW 240
MW 260ln P = 43.004 -19914/T
ln P = 44.148 -21943/T
0.0035

263
0
0.1
0.2
0.3
0.4
0.5
0.6
UV
abs
orba
nce
at 3
05 n
m
1000 1200 1400 1600 1800 2000 2200 2400 2600
retention time [sec]Figure E.49a. Comparison of Pittsburgh No.8 coal tar fraction 2
GPC chromatograms before and after effusion. Comparison is basedon the same signal height.
initial fraction, MW 410
58 wt.% evaporated,MW 870

264
-0.1
0
0.1
0.2
0.3
0.4
0.5
0.6
UV
abs
orba
nce
at 3
05 n
m
1000 1200 1400 1600 1800 2000 2200 2400 2600retention time [sec]
Figure E.49b. Comparison of Pittsburgh No.8 coal tar fraction 3 GPC chromatograms before and after effusion. Comparison is based
on the same signal height.
initial fraction, MW 340
49 wt.% evaporated,MW 415

265
0
0.1
0.2
0.3
0.4
0.5
0.6
0.7
UV
abs
orba
nce
at 3
05 n
m
1000 1200 1400 1600 1800 2000retention time [sec]
Figure E.49c. Comparison of Pittsburgh No.8 coal tar fraction 4GPC chromatograms before and after effusion. Comparison is based
on the same signal height.
initial fraction, MW 310
49.4 wt.% evaporated,MW 410
2200 2400 2600

266
10
14
18
22
26
30
200 250
∆Hva
p/R [
K]
300 350 400 450 500 550 600MW [g/mol]
Figure E.50. Vaporization enthalpy as a function of molecular weightfor Pittsburgh No.8 coal tar GPC fractions.
fraction 1 fraction 2
fraction 3
fraction 4 tar

267
25
30
35
40
45
Pre-
expo
nent
ial A
200 250 300 350 400 450 500 550MW [g/mol]
Figure E.51. The pre-exponential as a function of molecular weight for Pittsburgh No.8 coal tar GPC fractions.
fraction 1 fraction 2 fraction 3 fraction 4 tar
600

268
-20
-10
0
10
20
30
ln P
[to
rr]
40
50
0 100 200 300 400 500 600Molecular Weight [g/mol]
Figure E.52a. The vapor pressure correlation curves for Pittsburgh No.8coal tar and GPC fractions at 500°C.
The Unger-Suuberg [1985], Fletcher et al. [1992] and Oh et al. [1989]correlations are shown for comparison.
Pittsburgh No.8 tar
fraction 1 (3% of tar)
fraction 2 (15% of tar)fraction 3 (29% of tar)
fraction 4 (33% of tar)
Unger-Suuberg
Fletcher et al.Oh et al.
700 800

269
-10
0
10
20
30
40
50
0 100
ln P
[to
rr]
200 300 400 500 600 700 800
Molecular Weight [g/mol]Figure E.52b. The vapor pressure correlation curves for Pittsburgh No.8
coal tar and GPC fractions at 600°C. The Unger-Suuberg [1985], Fletcher et al. [1992] and Oh et al. [1989]
correlations are shown for comparison.
Pittsburgh No.8 tar
fraction 1 (3% of tar)fraction 2 (15% of tar)
fraction 3 (29% of tar)fraction 4 (33% of tar)
Unger-SuubergFletcher et al.
Oh et al.

270
-55
-45
-35
-25
-15
-5
5
ln P
[to
rr]
15
25
0.0005 0.001 0.0015 0.002 0.0025
1/T [K]Figure E.53. The vapor pressure curves for Upper-Freeport coal tar produced in the
wire mesh reactor. The heavier portions of the curves indicate the actual range of temperatures over which the data were obtained.
MW 215
MW 230
MW 234
MW 240
MW 250
MW 255
MW 260
MW 270
0.003 0.0035
ln P= 28.115 -12805/T
ln P = 28.498 -13063/T
ln P = 28.794 -14130/T
ln P = 28.776-14510/T
ln P = 29.367 -15103/T
ln P= 30.049 -15703/T
ln P = 30.462 -16724/T
ln P = 31.459 -17521/T

271
-9.5
-8.5
-7.5
-6.5
-5.5
-4.5
ln P
[ t
orr
]-3.5
0.002 0.00216 0.00232 0.00248 0.00264 0.0028
1/T [ K ]Figure E.54. Raw data for Upper-Freeport coal tar produced in the wire mesh reactor.
6 wt% evaporated
14 wt% evaporated
21 wt% evaporated
27 wt% evaporated
34 wt% evaporated
40 wt% evaporated
51 wt% evaporated
62 wt% evaporated
ln P = 26.574 -13097/T
ln P = 26.919 -13714/T
ln P= 27.851 -14522/T
ln P = 28.082 -14899/T
ln P= 28.479 -15408/T
ln P = 28.771 -15940/T
ln P = 29.467 -16968/T
ln P = 29.652 -17521/T

272
10
15
20
25
200 250 300
∆Hva
p/R
[K
] *
10-3
350 400 450 500 550 600
Molecular Weight [g/mol]Figure E.55. Vaporization enthalpy as a function of molecular weight
for Upper-Freeport coal tar. Pittsburgh No.8 coal tar fractions are shown for comparison.
Upper-Freeport tar
Pittsburgh No.8 tar fraction 1
Pittsburgh No.8 tar fraction 2
Pittsburgh No.8 tar fraction 3
Pittsburgh No.8 tar fraction 4

273
25
30
35
40
45
Pre-
expo
nent
ial (
A)
200 250 300 350 400 450 500 550Molecular Weight [g/mol]
Figure E.56. The pre-exponential (A) as a function of molecular weightfor Upper-Freeport coal tar. Pittsburgh No.8 coal tar fractions
are shown for comparison.
Upper-Freeport tar
Pittsburgh No.8 tar fraction 1Pittsburgh No.8 tar fraction 2Pittsburgh No.8 tar fraction 3Pittsburgh No.8 tar fraction 4
600

274
-40
-30
-20
-10
0
10
20
ln P
[ to
rr ]
30
0.0005 0.001 0.0015 0.002 0.0025 0.003
1/T [ K ]Figure E.57. The vapor pressure curves for Wyodak coal tar.
The tar was produced in the wire mesh reactor. The heavier portions of the curvesindicate the actual range of temperatures over which the data were obtained.
MW 240
MW 255
MW 280
MW 310
MW 345
0.0035
ln P = 38.451 -17292/T
ln P = 37.885-17636/T
ln P = 39.997 -19442/T
ln P = 38.891 -19752/T
ln P= 41.345 -21915/T

275
-10
-9
-8
-7
-6
-5ln
P [
torr
]
0.0021 0.00224 0.00238 0.00252 0.00266 0.0028
1/T [ K ]
Figure E.58. Raw data for Wyodak coal tar produced in the wire mesh reactor.
10 wt% evaporated
22 wt% evaporated
35 wt% evaporated47 wt% evaporated
59 wt% evaporated
ln P = 37.374 -17388/T
ln P = 37.095 -18121/T
ln P = 38.205 -19480/T
ln P= 37.592 -20086/T
ln P = 39.751 -21915/T
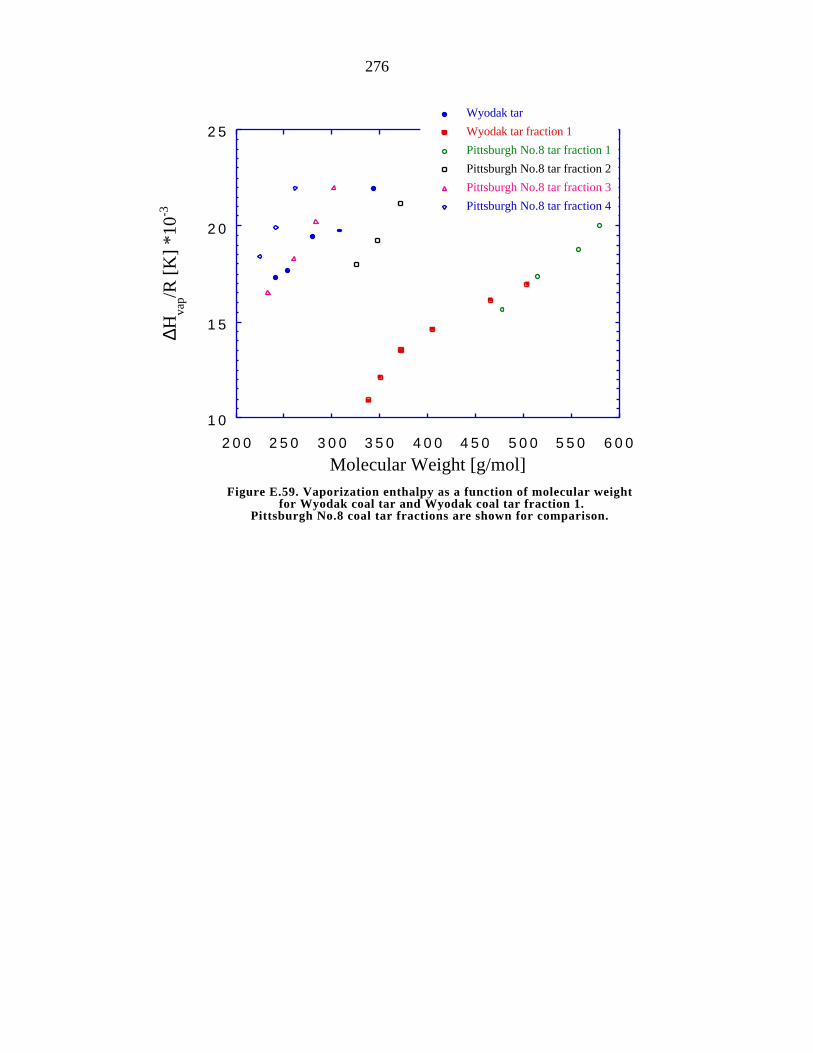
276
10
15
20
25
200 250 300
∆Hva
p/R [
K]
*10-3
350 400 450 500 550 600
Molecular Weight [g/mol]Figure E.59. Vaporization enthalpy as a function of molecular weight
for Wyodak coal tar and Wyodak coal tar fraction 1.Pittsburgh No.8 coal tar fractions are shown for comparison.
Wyodak tar
Wyodak tar fraction 1
Pittsburgh No.8 tar fraction 1
Pittsburgh No.8 tar fraction 2
Pittsburgh No.8 tar fraction 3
Pittsburgh No.8 tar fraction 4
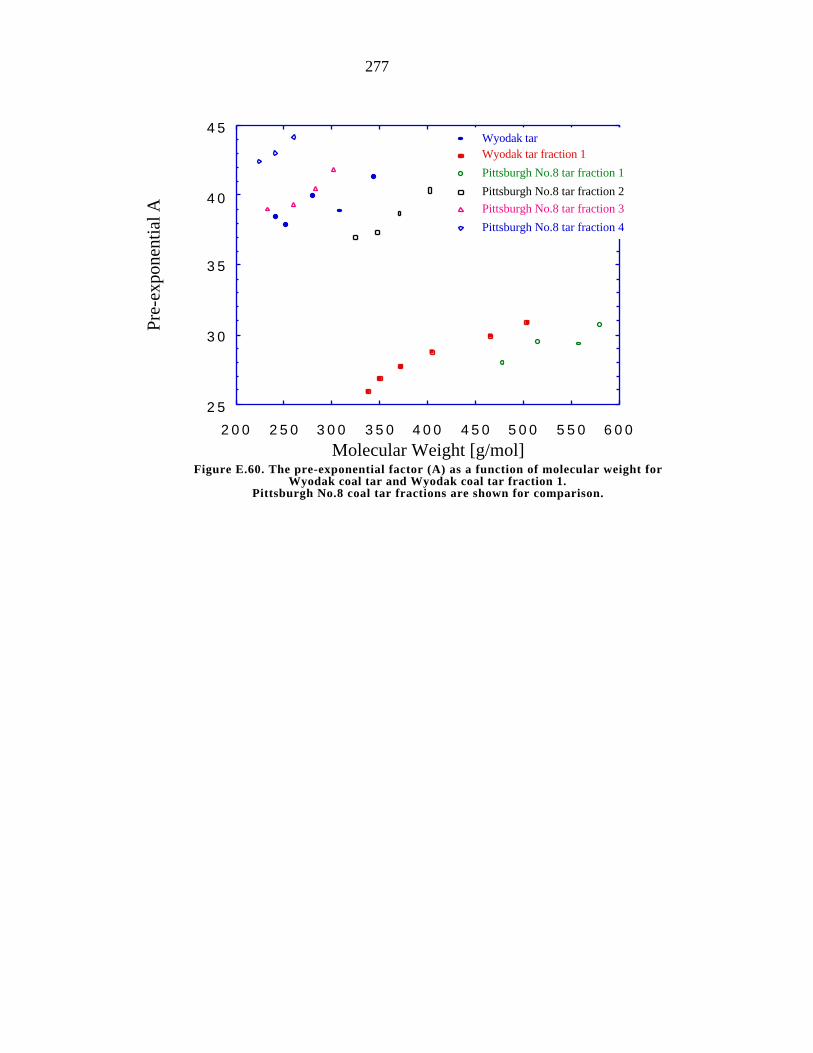
277
25
30
35
40
45
Pre-
expo
nent
ial A
200 250 300 350 400 450 500 550Molecular Weight [g/mol]
Figure E.60. The pre-exponential factor (A) as a function of molecular weight forWyodak coal tar and Wyodak coal tar fraction 1.
Pittsburgh No.8 coal tar fractions are shown for comparison.
Wyodak tarWyodak tar fraction 1
Pittsburgh No.8 tar fraction 1
Pittsburgh No.8 tar fraction 2
Pittsburgh No.8 tar fraction 3
Pittsburgh No.8 tar fraction 4
600

278
-35
-25
-15
-5
5
15
25ln
P [
torr
]
0.0005 0.001 0.0015 0.002 0.0025 0.003 0.0035
1/T[K]Figure E.61. The vapor pressure curves for Wyodak coal tar fraction 1
separated by GPC. The heavier portions of the curves indicate the actual rangeof temperatures over which the data were obtained.
MW 340
MW 350
MW 370
MW 405
MW 465
MW 505
ln P = 25.901 -10916/T
ln P = 26.892 -12102/T
ln P = 27.719 -13531/T
ln P = 28.769 -14597/T
ln P = 29.887 -16118/T
ln P = 30.873 -16959/T

279
-9.5
-8.5
-7.5
-6.5
-5.5
-4.5
-3.5
0.002
ln P
[ to
rr ]
0.002275 0.00255 0.002825 0.0031
ln P = 24.472 -11249/T
ln P = 25.45 -12328/T
ln P = 26.748 -13806/T
ln P= 27.524 -14783/T
ln P= 28.886 -16377/T
1/T [ K ]Figure E.62. Raw data for Wyodak coal tar fraction 1.
6 wt% evaporated
16 wt% evaporated
30 wt% evaporated
40 wt% evaporated
53 wt% evaporated
61 wt% evaporated ln P = 29.13 -16959/T

280
200
300
400
500
600
700
800
900T
b [K
] at
760
torr
100 200 300 400 500 600 700 800Molecular Weight [g/mol]
Figure E.63. Comparison of predicted coal tar boiling point at 760 torr withthe Unger-Suuberg [1985], Fletcher et al. [1992], Oh et al. [1989]
and Niksa-Kerstein [1991] correlations.
Pittsburgh No.8, wire mesh tarPittsburgh No.8, tubular reactor tarBruceton, fluidized bed reactor tar
Pittsburgh No.8 tar fraction 1Pittsburgh No.8 tar fraction 2Pittsburgh No.8 tar fraction 3Pittsburgh No.8 tar fraction 4Upper-Freeport, wire mesh tar
Wyodak, wire mesh reactor tarWyodak tar fraction 1Unger-SuubergFletcher et al. (FGP)
Oh et al.Niksa-Kerstein

281
-100
-80
-60
-40
-20
0
20
40
ln P
[to
rr]
0 200 400 600 800 1000Molecular Weight [g/mol]
Figure E.64. Comparison of the different vapor pressure correlations at 300°C (573 K).
Pittsburgh No.8 tarUpper-Freeport tarWyodak tar
Wyodak fraction 1Unger-SuubergFletcher et al.
Oh et al.Niksa-Kerstein

282
-60
-40
-20
0
20
40
ln P
[to
rr]
0 200 400 600 800 1000
Molecular Weight [g/mol]Figure E.65. Comparison of the different vapor pressure correlations
at 500°C (773.15 K).
Pittsburgh No.8 tar
Upper-Freeport tar
Wyodak tar
Wyodak fraction 1
Unger-Suuberg
Fletcher et al.
Oh et al.
Niksa-Kerstein
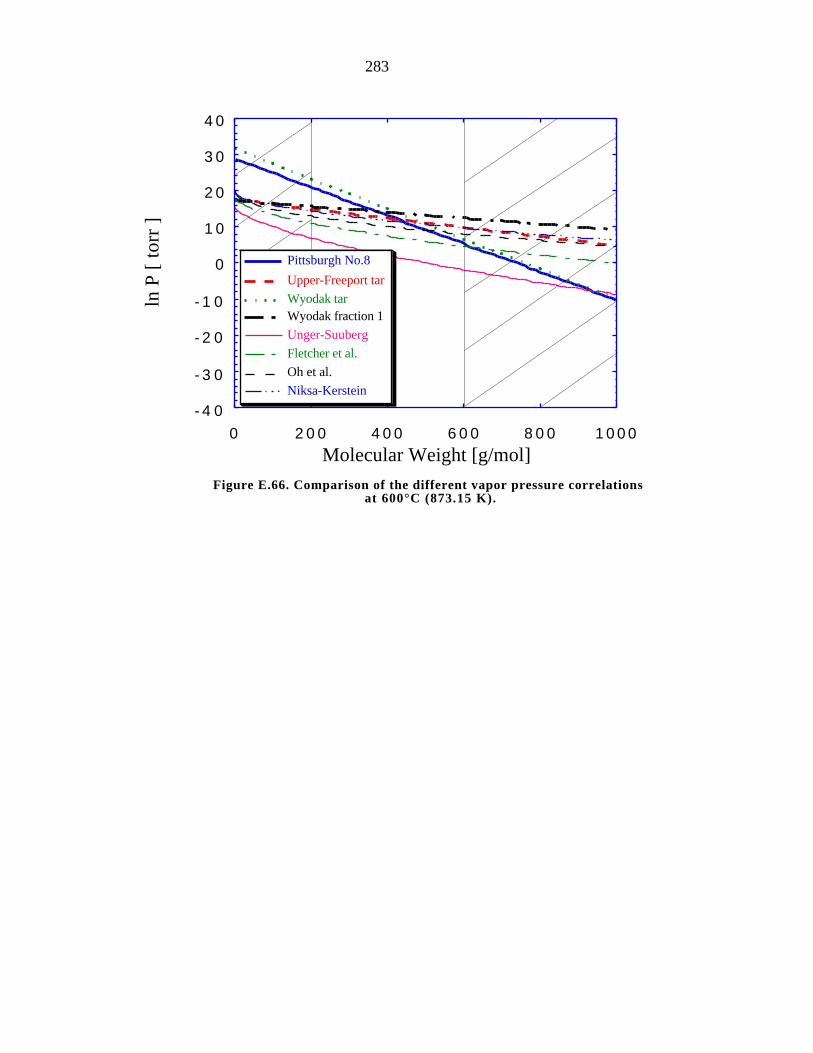
283
-40
-30
-20
-10
0
10
20
30ln
P [
torr
]
40
0 200 400 600 800 1000Molecular Weight [g/mol]
Figure E.66. Comparison of the different vapor pressure correlations at 600°C (873.15 K).
Pittsburgh No.8
Upper-Freeport tar
Wyodak tarWyodak fraction 1
Unger-Suuberg
Fletcher et al.
Oh et al.
Niksa-Kerstein

284
Chapter F. Concluding Remarks
As a consequence of the modular organization of this report,
conclusions have been offered on various subtopics throughout the report. Chapter A
reviewed the general nature of coal tars and offered a rationale for conducting this study. It
was shown that the heterogeneous nature and the complexity of coal tars have made it
unrealistic to apply detailed vapor pressure correlations developed for simpler organics.
Nevertheless there has been a strong driving force to develop simple correlations, since
these are critical in "advanced" pyrolysis models. There has always been the concern that
since all such correlations have been developed for "model" compounds, they may fail in
application to coal tars.
Chapter B summarized the main experimental approaches for coal tar preparation and
characterization, as well as the vapor pressure measurement device designs. A significant
aspect was the development of the new "non-isothermal" Knudsen effusion technique to
measure the vapor pressures of complicated mixtures. It is difficult to apply the traditional
method to complex mixtures of compounds, since the long time-scales required in the usual
measurement permit significant change in composition while waiting for pseudo-steady-
state. The new technique has been applied to polycyclic aromatics and pyrolysis tars.
Chapter C was concerned with the selection of the model compounds for coal pyrolysis
tars and reviews the data available to us on the vapor pressures of high boiling point
aromatic compounds. This chapter also dealt with the question of identifying factors that
govern the vapor pressures of coal tar model materials and their mixtures. The
measurements of vapor pressures for various large polycyclic aromatic hydrocarbons
(PAH), including those containing heteroatoms, and some mixtures of these compounds
were presented. We believe that our results might be among the first available on some of
these materials.

285
Chapter D covered the vapor pressures and heats of vaporization of primary cellulose
tars. Cellulose tar has a much narrower distribution of molecular weights than does coal
tar, and is much more homogenous. Thus it was better to develop the methods to be used
for coal tars on this simpler model system first. New vapor pressure data for sugar-
compounds (levoglucosan, D-xylose, D-glucose and cellobiose) and for cellulose tar were
presented. Again, we believe that some of these may be the first on some of the materials of
interest. The volatility of cellulose tar was seen to be similar to that of a widely accepted
major component of the tar, levoglucosan.
This work has also resulted in a hypothesis regarding the role of tar evaporation in the
global kinetics of cellulose pyrolysis. This study of the cellulose tar vapor pressure and
heat of vaporization has been the first in the field of biomass pyrolysis. Therefore, future
research could be directed at measuring the vapor pressures for the other biomass pyrolysis
tars and at developing the pyrolysis models which take into account the heats of
vaporization.
Chapter E presented the results of the main focus of this study. Coal tars were prepared
from various coal samples. Four coals from the Argonne Premium Coal set - the Illinois
No.6, the Pittsburgh No.8, the Pennsylvania Upper-Freeport and the Wyodak - were
selected for this study. Also another Pittsburgh No.8 sample, Bruceton standard coal, was
also examined. Characterization of tars was obtained via elemental analysis and gel
permeation chromatography (GPC). This characterization showed the heteroatomic
content of all tars to be comparable to the parent coal, and that tars likely contain a large
amount of hydroxyl functionality. The coal tar separation by GPC, using a Phenogel
column and pyridine as mobile phase, was a failure as far as separation of tar by molecular
weight, but allowed characterization of tars in terms of compound classes. This technique
could serve as a simple basis for characterizing complex mixtures such as coal tars. This
needs further verification by detailed chemical analysis.
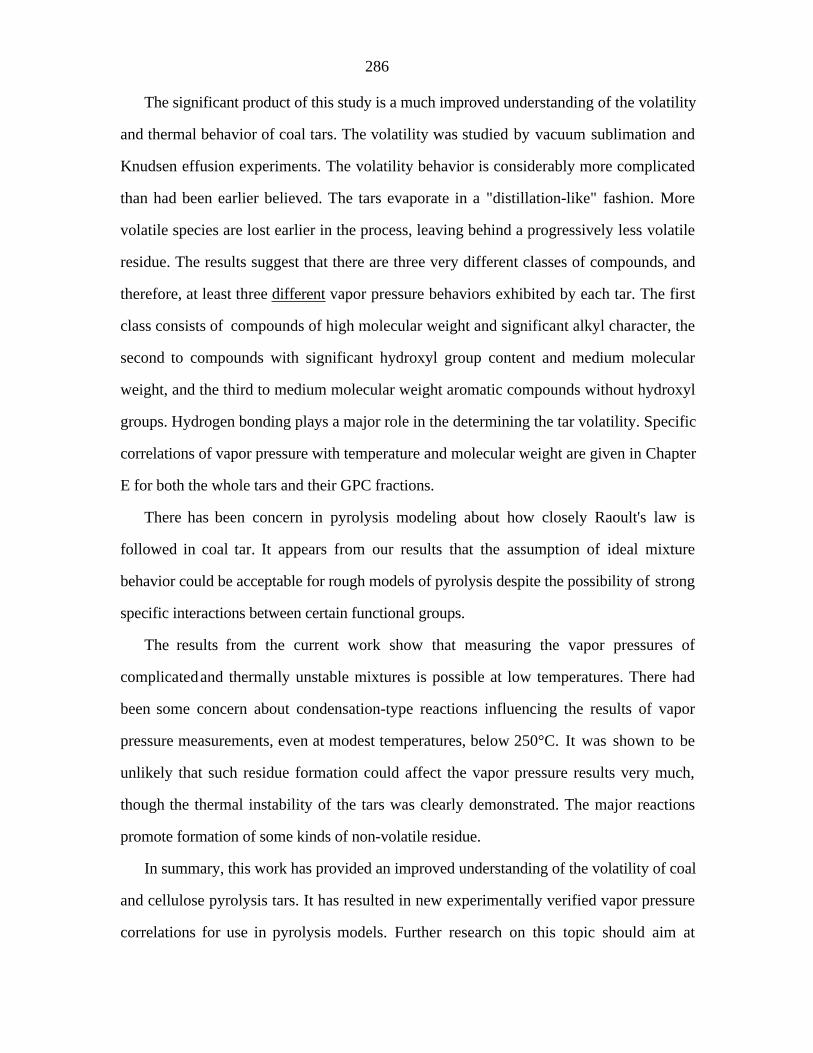
286
The significant product of this study is a much improved understanding of the volatility
and thermal behavior of coal tars. The volatility was studied by vacuum sublimation and
Knudsen effusion experiments. The volatility behavior is considerably more complicated
than had been earlier believed. The tars evaporate in a "distillation-like" fashion. More
volatile species are lost earlier in the process, leaving behind a progressively less volatile
residue. The results suggest that there are three very different classes of compounds, and
therefore, at least three different vapor pressure behaviors exhibited by each tar. The first
class consists of compounds of high molecular weight and significant alkyl character, the
second to compounds with significant hydroxyl group content and medium molecular
weight, and the third to medium molecular weight aromatic compounds without hydroxyl
groups. Hydrogen bonding plays a major role in the determining the tar volatility. Specific
correlations of vapor pressure with temperature and molecular weight are given in Chapter
E for both the whole tars and their GPC fractions.
There has been concern in pyrolysis modeling about how closely Raoult's law is
followed in coal tar. It appears from our results that the assumption of ideal mixture
behavior could be acceptable for rough models of pyrolysis despite the possibility of strong
specific interactions between certain functional groups.
The results from the current work show that measuring the vapor pressures of
complicated and thermally unstable mixtures is possible at low temperatures. There had
been some concern about condensation-type reactions influencing the results of vapor
pressure measurements, even at modest temperatures, below 250°C. It was shown to be
unlikely that such residue formation could affect the vapor pressure results very much,
though the thermal instability of the tars was clearly demonstrated. The major reactions
promote formation of some kinds of non-volatile residue.
In summary, this work has provided an improved understanding of the volatility of coal
and cellulose pyrolysis tars. It has resulted in new experimentally verified vapor pressure
correlations for use in pyrolysis models. Further research on this topic should aim at

287
developing general vapor pressure correlations for all coal tars, based on their molecular
weight together with certain specific chemical characteristics i.e. hydroxyl group content.
288
References
Abrams, D.S., Massaldi, H.A., and Prausnitz, J.M., Ind. Eng. Chem. Fundam. 1974 ,
13, 259.
Acree, W.E., Thermochimica Acta 1991 , 189, 37.
Aihara, A., J. Chem. Soc. Japan 1959 , 32, 1242.
Ambrose, D., and Davies, R.H., J. Chem. Thermodynamics 1980 , 12, 871.
Ambrose, D., and Patel, N.C., J. Chem. Thermodyn 1984 , 16, 459.
Ambrose, D., and Walton, J., Pure Appl. Chem. 1989 , 61, 1395.
Ambrose, D., Counsell, J.F., and Davenport, A.J., J. Chem. Thermodyn. 1970 , 2, 283.
Ambrose, D., J. Chem. Thermodynamics 1978 , 10, 765.
Ambrose, D., J. Chem. Thermodynamics 1986 , 18, 45.
Ambrose, D.", Vapor Pressures," Butterworth, University College, London, 1975 .
Angus, S.", Guide to the Preparation of Thermodynamic Tables and Correlation of Fluid
State," 1983 , COTATA Bull., No. 51.
Antoine, C., Compt. Rend. Acad. Sci. 1988 , Paris 107, 681, 836, 1143.
Arseneau, D.F., Can. J. Chem. 1971 , 49, 632.
Balson, E.W., J. Phys. Chem. 1961 , 65, 115.
Bardi, G., Gigli, R., Malaspina, L., and Piacente, V., J. Chem. Eng. Data 1973 , 18,
126.
Bardley, R.S., J. Chem. Soc. London 1953 , 2, 1690.
Bartle, K.D., Derek, G.M., Mulligan, M.J., Amaechina, I.O., Taylor, N., Anal. Chem.
1986 , 58, 2403.
Bell, H.G., and Grozek, A.J., J. Inst. Petrol. 1962 , 48.
Bidleman, T.F. Anal. Chem. 1984 , 56, 2490.
Bjorseth, A.", Handbook of Polycyclic Aromatic Hydrocarbons," Marcel Dekker, New
York, 1983 .
Blair, D.W., Wendt, J.D.L., and Bartok, W., 16h Symp.(Intern.) on Comb., The
Combustion Institute 1976 , 475.
Boehncke, A., Martin, K., Müller, M.G., and Cammenga, H.K., J. Chem. Eng. Data
1996 , 41, 543.
Borwitzky, H., and Schomburg, G., J. Chromatogr. 1979 , 170, 99 .
Boublik, T., Fried, V., and Hala, E.", The Vapor Pressures of Pure Substances," 2nd ed.,
Elsevier, Amsterdam, 1987 .

289
Bouwstra, J.A., Leeuw, V.V., and Van Miltenburg, J.C., J. Chem. Thermodyn. 1985 ,
17, 685.
Bouwstra, J.A., Oonk, H.A.J., Blok, J.G., and DeKruif, C.G., J. Chem. Thermodyn.
1984 , 16, 403.
Brown, J.K., Dryden, I.G.C., Dunevein, D.H., Joy, W.K., and Pankhurst, K.S., J.
Inst. Fuel. 1958 , 31, 259.
Brule, M.R., Lin, C.T., Lee, L.L., and Starling, K.E., AIChE J. 1982 , 28, 616.
Burkhard, L.P., Ind. Eng. Chem. Fundam. 1985 , 24, 119.
Calkins, W.H., and Tyler, R.J., Fuel 1984 , 63, 1119 .
Calkins, W.H., Fuel 1984 , 63, 1125.
Calkins, W.H., Hagaman, E., and Zeldes, H., Fuel 1984 , 63, 1113 .
Carlson, K.D., Gilles, P.W., and Thorn, R.J., J. Chem. Phys 1963 , 38, 2064.
Carrier, B., Rogalski, M., and Peneloux, A., Ind. Eng. Chem. Res. 1988 , 27, 1714.
Carter, E.D., Chapter 2A, Rapp. R.A., ed.", Physico-Chemical Measurements in Metal
Research," Vol. IV, part 1, New-York, John Wiley & Sons, 1970 .
Cerny, J., Energy Fuels 1991 , 5, 781 .
Chandar, S.C.R., and Singh, R.P., Fluid Phase Equilibria 1985 , 24, 177.
Chase, J.D., Ind. Eng. Chem. Res. 1987 , 26, 107.
Chung, K.E., Anderson, L.L., and Wiser, W.H., Fuel 1979 , 58, 847.
Clausing, P., Ann. Physik. 1932 , 12, 961.
Collin, P.J., Tyler, R.J., and Wilson, M.A., Fuel 1980 , 59, 483 .
Colomina, M., Jimenez, P., and Turrion, C., J. Chem. Thermod. 1982 , 14, 779.
Colomina, M., Jimenez, P., Perez-Ossorio, R., Roux, M.V., and Turrion, C., J. Chem.
Thermod. 1988 , 20, 575.
Cox, E.R., Ind. Eng. Chem. 1923 , 15, 592.
De Kruif, C.G., J. Chem. Thermodyn. 1980 , 12, 243.
DeKruif, C.G., Kuipers, T., Van Miltenburg, J.C., Schaake, R.C.F., and Stevens, G., J.
Chem. Therodyn. 1981 , 13, 1081.
DeKruif, C.G., Van Genderen, C.G., Bink, J.C.W., and Oonk, H.A.J., J. Chem.
Thermodyn. 1981b, 13, 457.
DePablo, R.S., J. Chem. Eng. 1976 , 21, 141.
Dushman, S.", Scientific Foundations of Vacuum Technique," New-York, John Wiley &
Sons, 2nd edition, 1962 .
Edwards, D., and Prausnitz, J.M., Ind. Eng. Chem. Fundam. 1981 , 20(3), 281.
Edwards, D., Van de Rostyne, C.G., Winnick, J., and Prausnitz, J.M., Ind. Eng. Chem.
Process Des. Dev. 1981 , 20(1), 139.

290
Edwards, D.R., and Prausnitz, J.M., J. Chem. Eng. Data 1981 , 26, 121.
Edwards, J.G., and Franzen, H.F., J. Phys. Chem. 1995 , 99, 4779.
Eggersten, V.T, Seibert, E.E., and Stross, F.H., Anal. Chem. 1969 , 41, 1175.
Enstein, J.V., Duronina, L.I., and Pashinkin, A.S., Zh. Prikl. Khim. 1964 , 37 (11),
2543.
Evans, N., Terry, M.H., Mulligan, M.J., and Thomas, K.M., Fuel 1985 , 65, 694 .
Fletcher, T.H., Bai, S., Pugmire, R.J.,Solum, M.S., Wood, S., and Grant, D.M.,
Energy Fuels 1993 , 7, 734.
Fletcher, T.H., Kerstein, A.R., Pugmire, R.J., and Grant, D.M., Energy Fuels 1990 ,
3, 54.
Fletcher, T.H., Kerstein, A.R., Pugmire, R.J., Solum, M.S., and Grant, D.M., Energy
Fuels 1992 , 6, 414.
Fredenslund, A., and Rasmussen, P., AIChE J. 1979 , 25, 203.
Fredenslund, A., Jones, R.L., and Prausnitz, J. M., AIChE J. 1975 , 21, 1086.
Fredenslund, A.,Gmehling, J., and Rasmussen, P.", Vapor-Liquid Equilibria Using
UNIFAC," Elsevier, Amsterdam, 1977 .
Freihaut, J.D., Proscia, W.M., and Mackie, J.C., Combust. Sci. Tech. 1993 , 93, 323.
Freihaut, J.D., Proscia, W.M., and Seery, D.J., Energy Fuels 1989 , 3 , 692 .
Frenklach, M, Clary, D.W., Gardiner, W.C, and Stein, S.E., 20th Symp. (Int.) on
Combustion, The Combustion Institute, Pittsburgh, 1984 , 887.
Frost, A.A., and Kalkwarf, D.R., J. Chem. Phys. 1953 , 21, 264.
Fynes, G., James, R.G., Ladner., W.R., and Newman, J.O.H., Fuel 1984 , 63, 896 .
Gomez-Nieto, M., and Thodos, G., Ind. Eng. Chem. Fundam. 1977 , 16, 254.
Gomez-Nieto, M., and Thodos, G., Ind. Eng. Chem. Fundam. 1978 , 17, 45.
Grant, D.M., Pugmire, R.J., Fletcher, T.H., and Kerstein, A.R., Energy Fuels 1989 , 3,
175.
Gray, J.A., Brady, C.J., Cunningham, J.R., Freedman, J.R., Wilson, G.M., Ind. Eng.
Chem. Process Des. Dev. 1983 , 22, 410.
Gray, J.A., Holder, G.E., Brady, C.J., Cunningham, J.R., Freeman,J.R., and Wilson,
G.M., Ind. Eng. Chem. Process Des. Dev. 1985 , 24, 97.
Hajaligol, M., Horward, J.B., Longwell, J.P., and Peters, E.A., Ind. Eng. Chem. Proc.
Des. Dev. 1982 , 21, 457.
Halpern, Y., Riffer, R., and Broido, A., J. Org. Chem. 1973 , 38, 204.
Hansen, P.C., and Eckert, C.A., J. Chem. Eng. Data 1986 , 31, 1.
Haplern, Y., and Patai, S., Israel J. Chem. 1969 , 7, 673.
Herod, A.A., Stokes, B.J., and Schulten,H., Fuel 1993b, 72, 31.

291
Herod, A.A., Stokes, B.J., Tye, E.R., Gaines, A.F., Li, C., and Kandiyoti, R., Fuel
1993a, 7 (9), 1321 .
Hinckley, D.A., Bidleman, T.F., Foreman, W.T., and Tuschall, J.R., J. Chem. Eng.
Data, 1990 , 35, 232.
Hollahan, J., J. Chem. Educ. 1962 , 39, 23.
Homann, K.H, 20th Symp. (Int.) on Combustion, The Combustion Institute, Pittsburgh,
1984 , 857.
Hortounian, H., and allen, D.T., Fuel 1989 , 68, 481.
Hoshino, D., Zhu, X.-R., Nagahama, K., and Hirata, M., Ind. Eng. Chem. Fundam.
1985 , 24, 115.
Hoyer, H., Electrochem. 1958 , 62, 61.
Inokuchi, H., Shiba, S., Handa, T., and Akamatu, H., J. Chem. Soc. Japan 1952,
25(5), 299.
Ivanov, G.A., Guglua, V.G., and Zhukhovitskii, A.A., Zavod. Lab. 1973 , 39, 15.
Jensen, T., Fredenslund, A., and Rasmussen, P., Ind. Eng. Chem. Fundam. 1981 , 20
239.
Kelley, J.D, and Rice, F.O., J. Phys. Chem. 1964 , 68(12), 3795.
Kennard, E.H.", Kinetic Theory of Gases," New-York, McGraw-Hill, 1938 .
Kesler, M.G., and Lee, B.I., Hydroc. Proc. 1980 , July, 167.
King, M.B., and Al-Najjar, H., Chem. Eng. Sci. 1974 , 29, 1003.
Knudsen, M., Ann. Physik .1909a, 28, 999.
Knudsen, M., Ann. Physik. 1909b, 29, 179.
Kolkert, W.J., J. Crystal Growth 1975 , 30, 213.
Kroto, H.W., and Mckay, K., Nature 1988 , 331, 328.
Lafleur, A.L., and Wornat, M.J., Anal. Chem. 1988 , 60, 1096.
Lafleur, A.L., Sarofim, A.F., and Wornat, M.J., Energy Fuels 1993 , 7, 357.
Langmuir, I., Phys. Rev. 1913 , 2, 329.
Lee, B.I., and Kesler, M.G., AIChE J. 1975 , 21, 510.
Lee, C., and Diehl, J.R., Comb. Flame 1981 , 42, 123.
Lee, C., Chaiken, R.F., and Singer, J.M., 16th Symp. (Int.) on Combustion , The
Combustion Institute, Pittsburgh, 1976 , 1459.
Lee., M.L., and Wright, B.W., J. Chromatogr. Sci. 1980 , 18, 345 .
Letcher, T.M., and Bricknell, B.C., J. Chem. Eng. Data 1996 , 41, 639.
Li, C-Z., Bartle, K.D., and Kandiyoti, R., Fuel 1993 , 72, 3.
Li, C-Z., Wu, F., Cai, H-Y., and Kandiyoti, R., Energy Fuels 1994 , 8, 1039.

292
Löffler, S., and Homann, K.H., 23rd Symp. (Int.) on Combustion, The Combustion
Institute, Pittsburgh, 1990 , 355.
Mackay, D., Bobra, A., Chan, D.W., and Shlu, W.Y., Environ. Sci. Technol. 1982 ,
16(10), 645.
Macknick, A.B., and Prausnitz, J.M., Ind. Eng. Chem. Fundam. 1979 , 18(4), 349.
Macknick, A.B., and Prausnitz, J.M., J. Chem. Eng. Data 1979 , 24, 176.
Macknick, A.B., Winnick, J., and Prausnitz, J.M., AIChE Journal 1978 , 24(4), 731.
Majer, V., Svoboda, V., and Pick, J.", Heats of Vaporization of Fluids," Elsevier, 1989.
Malanowski, S., and Anderko, A.", Modelling Phase Equilibria," John Wiley & Sons,
1992.
Malaspina, L., Bardi, G., and Gigli, R., J. Chem. Thermodyn. 1974 , 6, 1053.
Margrave, J.L.", The Characterization of High-Temperature Vapors," New-York, John
Wiley & Sons, 1967 .
Mato, F.A., and Carrier, B., Cem. Eng. Science 1991 , 46(10), 2445.
Maxwell, J.B., and Bonnell, L.S., Ind. Eng. Chem. 1957 , 49(7), 1189.
McEachen, D.M., J. Chem. Educ. 1973 , 50, 190.
McEachern, D.M., Inigues, J.C., and Ornelas, H.C., J. Chem. Eng. Data 1975 , 20, 3.
McGarry, J., Ind. Eng. Chem. Process Des. Dev. 1983 , 22, 313.
Milosavljevic, I., and Suuberg, E.M., Ind. Eng. Chem. Res. 1995 , 34, 1081.
Milosavljevic, I., Oja, V., and Suuberg, E.M., Ind. Eng. Chem. Res. 1996 , 35, 653.
Mishra, D.S., and Yalkowsky, S.H., Ind. Eng. Chem. Res. 1991 , 30, 1609.
Moelwyn-Hughes, E.A.", Physical Chemistry," 2nd ed., Pergamon Press, New York,
1961 .
Mok, W.S.-L., and Antal, M.J., Thermohimica Acta 1983 , 68, 165.
Morecroft, D.W., J. Chem. Eng. Data 1964 , 9, 488.
Morgan, D.L., and Kobayashi, R., Fluid Phase Equilibria 1994 , 94, 51.
Mortzfeldt, K., J.Phys. Chem. 1955 , 59, 139.
Murray, J.J., and Pottie, R.F., Can. J. Chem. 1974 , 52, 557.
Myers, H.S., and Fenske, M.R., Ind. Eng. Chem. 1955 , 47, 1652.
Nelson, P.F., Smith, I.W., Tyler, R.J., and Mackie, J.C., Energy Fuel 1988 , 2, 391.
Nesmeyanov, A.N.", Vapor Pressure of the Chemical Elements, " Elsevier, 1963 .
Niksa, S., and Kerstein, A., Energy Fuels 1987 , 66, 1389.
Niksa, S., and Kerstein, A., Energy Fuels 1991 , 5, 647.
Niksa, S., Energy Fuels 1991a, 5, 665.
Niksa, S., Energy Fuels 1991b, 5, 673.
Niksa., S., AIChE J. 1988 , 34, 790.

293
Oh, S.M., Peters, A.W., and Howard, J.B., AIChE Journal 1989 ,35 (5), 775.
Ohe, S.", Computer Aided Data Book of Vapor Pressure," Data Book Publishing
Company, Tokyo, 1976 .
Orning, A.A., and Greifar, B., Fuel 1956 , 35, 318.
Parker, J.E., Johnson, C.A.F., John, P., Smith, G.P., Herod, A.A., Stokes, B.J., and
Kandiyoti, R., Fuel 1993 , 72 (10), 1386.
Philip, C.V. and Anthony, R.G., Fuel 1982 , 61, 375.
Piacente, V., Pompili, T., Scardala, P., and Ferro, D., J. Chem. Thermodyn. 1991 , 23,
379.
Pitzer, K.S., J. Am. Chem. Soc. 1955 , 77, 3427.
Plank, R., and Reidel, L., Ing. Arch. 1948 , 16, 225.
Ponder, G.R., Richards, G.N., Stevenson, T.T., J. Anal. Appl. Pyro. 1992 , 22, 217.
Pribilova, J., and Pouchly, J., Collect. Czech. Chem. Commun. 1974 , 39, 1118.
Prigonine, I.", Molecular Theory of Solution," Amsterdam, North-Holland, 1957 .
Rachenko, L.G., and Kitaigorodskii, A.I., Russian J. Phys. Chem. 1974 , 48, 2702.
Reid, R.C., Prausnitz, J.M., and Poling, B.E.", The Properties of Gases and Liquids,"
4th ed., McGraw-Hill, New York, 1987 .
Ribeiro Da Silva, M.A.V., and Monte, M.J.S., Thermochimica Acta 1990 , 171, 169.
Rodgers, P.A., Creagh, A.L., Prange, M.M., and Prausnitz, J.M. Ind. Eng. Chem. Res.
1987 , 26, 2312.
Rogalski, M., Thermochimica Acta 1985 , 90, 125.
Ruzicka, K., and Majer,V., AIChE J. 1996 , 42(6), 1725.
Ruzicka, K., and Majer,V., Fluid Phase Equilibria 1986 , 28, 253.
Ruziska, V., Ind. Eng. Chem. Fundam. 1983 , 22(2), 267.
Sasse,K, and Merlin, J., Fluid Phase Equilibrium 1988 , 42, 287.
Sato, N., Inomata, H., Arai, K., and Saito, S., J. Chem. Eng. Japan 1986 , 19, 145.
Scott, D.W., and Osborn, A.G., J. Phys. Chem. 1979 , 83(21), 2715.
Scott, D.W., and Osborn, A.G., J. Phys. Chem. 1979 , 83, 2714.
Serio, M.A., Hamblen, D.G., Markham, J.R., and Solomon, P.R., Energy Fuels 1987 ,
1, 138.
Shafizadeh, F., and Fu, Y.L., Carbohyd. Res. 1973 , 29, 113.
Shafizadeh, F., and Lai, Y.Z., J. Org. Chem. 1972 , 37, 278.
Shafizadeh, F., Applied Polymer Symp. 1975 , 28, 153.
Shafizadeh, F., Furneaux, H.F., Cochran, G.T., Scholl, J.P., and Sakai, Y., J. Applied
Polymer Sci. 1979 , 23, 3525.
Shafizadeh, F., J. Polymer Sci. 1971 , 36, 21.

294
Sinke, G.C., J. Chem. Thermodyn. 1974 , 6, 311.
Sivaraman, A., Kragas, T., and Kobayashi, R., Fluid Phase Equilibria 1984 , 16, 275.
Skjold-Jorgensen, S., Fluid Phase Equilibria 1984 , 16, 317.
Skjold-Jorgensen, S., Ind. Eng. Chem. Res. 1988 , 27, 110.
Smith, G., Winnick, J., Abrams, D.S., and Prausnitz, J.M., Can. J. Chem. Eng. 1976 ,
54, 337.
Smith, K.L., Smoot, L.D., Fletcher, T.H., and Pugmire, R.J.",The Structure and
Reacttion Processes of Coal," Plenum Press, New York, 1994.
Smith, N.K., Stewart, R.C., Osborn, A.G., and Scott, D.W., J. Chem. Thermodyn.
1980 , 12, 919.
Solomon, P.R., and Colket, M.B., 17th Symp. (Intern.) on Comb., The Combustion
Institute 1979 , 131 .
Solomon, P.R., and Colket, M.B., Fuel 1978 , 57, 748 .
Solomon, P.R., Beer, J.M., and Longwell, J.P., Energy 1987 , 12(8-9), 837.
Solomon, P.R., Coal Structure, Advances in Chemistry Series 192, American Chemical
Society, Washington, DC, 1981 , 7.
Solomon, P.R., Hamblen, D.G., Carangelo, R.M., and Krause, J.L., 19h Symp.
(Intern.) on Comb., The Combustion Institute 1983 , 1139 .
Solomon, P.R., Hamblen, D.G., Carangelo, R.M., Serio, M.A., and Despande, G.V.,
Energy Fuels 1988 , 2, 405.
Solomon, P.R., Serio, M.A., and Suuberg, E.M., Prog. Energy Combust. Sci. 1992 ,
18, 133 .
Solomon, P.R., Serio, M.A., Despande, G.V., and Kroo, E., Energy Fuels 1990a, 4,
42.
Solomon, P.R., Serio, M.A., Hamblen, D.G., Yu, Z-Z., and Charpenay, S., Prepr. Pap.-
Am. Chem. Soc., Div. Fuel. Chem. 1990b, 35(2), 479.
Solomon, P.R., Squire, K.R., and Carangelo, R.M., Prepr. Pap.- Am. Chem. Soc., Div.
Fuel. Chem. 1984 , 29(1), 10.
Solum, S.M., Pugmire, R.J., and Grant, D.M., Energy Fuels 1989 , 3, 187.
Somayajulu, G.R., J. Chem. Eng. Data 1989 , 34, 106.
Sonnefeld, W.J., Zoller, W.H., and May, W.E., Anal. Chem. 1983, 55, 275.
Squire, K.R., Solomon, P.R., Carangelo, R.M., and DiTaranto, M.B., Fuel 1986 , 65,
833.
Stephenson, M.R., and Malanowski, S.", Handbook of the Thermodynamics of Organic
Compounds," Elsevier, New York, 1987 .
Strachan, M.G., and Johns, R.B., J. Chromatogr. 1985 , 329, 65.

295
Stryer, L.", Biochemistry," 2nd ed., W.H. Freeman and Company, San Francisco,
1981 .
Suuberg, E.M., in Chemistry of Coal Conversion 1985 , (R. Schlosberg, ed.), Plenum,
67.
Suuberg, E.M., Peters, W.A., and Howard, J.B., 17th Symp. (Intern.) on Comb., The
Combustion Institute 1979 , 117.
Suuberg, E.M., Peters, W.A., and Howard, J.B., Ind. Eng. Chem. Process. Des. Dev.
1978 , 17, 37.
Suuberg, E.M., Unger, P.E., and Lilly, W.D., Fuel 1985 , 64, 957 .
Svoboda, V., and Basarova, P., Fluid Phase Equilibria 1994 , 93, 167.
Svoboda, V., and Smolova, H., Fluid Phase Equilibria 1994 , 97, 1.
Swan, T.H., and Mack, E., J. Am. Chem. Soc. 1925 , 47, 2112.
Takagi, S., Shintani, R., Chihara, H., and Seki, S., J. Chem. Soc. Japan 1959 , 32,
1937.
Tsonopoulos, C., Heidman, J., and Hwang, S.-C.", Thermodynamic and Transport
Properties of Coal Liquids," John Wiley & Sons, 1986.
Tu, C.-H., Fluid Phase Equilibria 1994 , 99, 105.
Tyler, R.J., Fuel 1979 , 58, 680.
Tyler, R.J., Fuel 1980 , 59, 218.
Unger, P.E. , and Suuberg, E.M., Fuel 1984 , 63, 606.
Vadji, L.E., and Allen, D.T., Fuel 1989 , 68, 1389.
Van De Rostyne, C., and Prausnitz, J.M., J. Chem. Eng. Data 1980 , 25, 1.
Van Ekeren, P.J., Jacobs, M.H.G., Offrina, J.C.A., and DeKruif, C.G., J. Chem.
Thermod. 1983 , 215, 409.
Verhoek, F.H., and Marshall, A.L., J. Am. Chem. Soc. 1939 , 61, 2737.
Vorres, K.S., Energy Fuels 1990 , 4, 420, and ", Users Handbook for the Argonne
Premium Coal Samples," 1993.
Wagner, W., Cryogenics 1973 , 13, 470.
Wakayama, N., and Inokuchi, H., Bull. Chem. Soc. Japan 1967 , 40, 2267.
Wang, H., and Frenklach, M., Comb. Flame 1994 , 96, 163.
Ward, J.W., and Fraser, M.V., J. Chem. Phys. 1968 , 49, 3743.
Weast, R.C., Astle, M.J., and Beyer, W.H.", CRC Handbook of Chemistry and
Physics," 66th ed., CRC Press, Boca Raton, Florida, 1985 .
Weber, L.A., and Defibaugh, D.R., J. Chem. Eng. Data 1996 , 41, 382.
White, C.M., and Schmidt, C.E., Fuel 1987 , 66, 1030.
White, C.M., J. Chem. Eng. Data 1986 , 31, 198.

296
Whitman, C.J., J. Chem. Phys. 1962 , 37, 784.
Wiedemann, H.G., Thermochim. Acta 1972 , 3, 355.
Winans, R.E., J. Anal. Appl. Pyrol.. 1991 , 20, 1 .
Winans, R.E., McBeth, R.L., Hunt, J.E., and Melnikov, P.E., in "Proceedings of 1991
International Conference on Coal Science", 16-20 September, University of
Newcastle-on-Tyne, UK, Oxford, 1991 , p. 44-47.
Winterbottom, W., and Hirt, J., J. Chem. Phys. 1962 , 37, 784.
Wornat, M.J., Sarofim, A.F., and Longwell, J.P., Energy Fuels 1987 , 1, 431.
Yair, O.B., and Fredenslund, A., Ind. Eng. Chem. Process Des. Dev. 1983 , 22, 433.
Zia, T., and Thodos, G., Can. J. Chem. Eng. 1974 , 52, 631.
Zudkevitch, D., Krautheim, P.D., and Gaydos, D., Fluid Phase Equilibria 1983 , 14,
117.
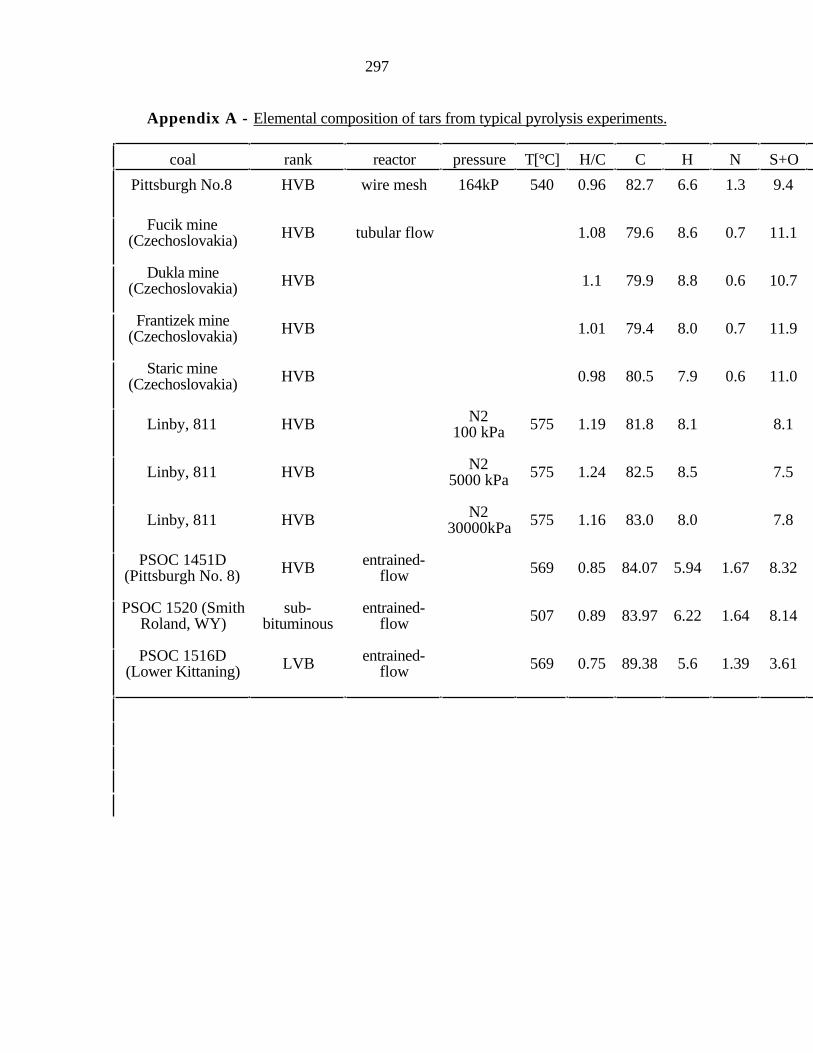
297
Appendix A - Elemental composition of tars from typical pyrolysis experiments.
coal rank reactor pressure T[°C] H/C C H N S+O
Pittsburgh No.8 HVB wire mesh 164kP 540 0.96 82.7 6.6 1.3 9.4
Fucik mine(Czechoslovakia) HVB tubular flow 1.08 79.6 8.6 0.7 11.1
Dukla mine(Czechoslovakia) HVB 1.1 79.9 8.8 0.6 10.7
Frantizek mine(Czechoslovakia) HVB 1.01 79.4 8.0 0.7 11.9
Staric mine(Czechoslovakia) HVB 0.98 80.5 7.9 0.6 11.0
Linby, 811 HVB N2100 kPa 575 1.19 81.8 8.1 8.1
Linby, 811 HVB N25000 kPa 575 1.24 82.5 8.5 7.5
Linby, 811 HVB N230000kPa 575 1.16 83.0 8.0 7.8
PSOC 1451D(Pittsburgh No. 8) HVB entrained-
flow 569 0.85 84.07 5.94 1.67 8.32
PSOC 1520 (SmithRoland, WY)
sub-bituminous
entrained-flow 507 0.89 83.97 6.22 1.64 8.14
PSOC 1516D(Lower Kittaning) LVB entrained-
flow 569 0.75 89.38 5.6 1.39 3.61
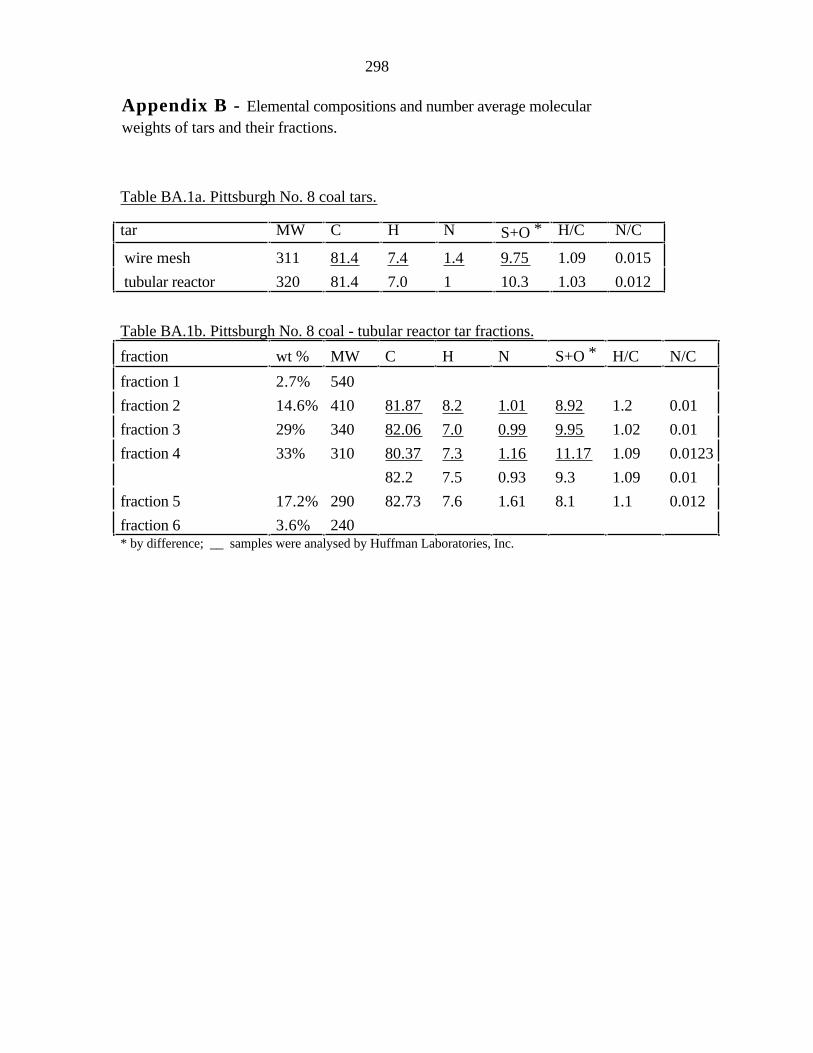
298
Appendix B - Elemental compositions and number average molecularweights of tars and their fractions.
Table BA.1a. Pittsburgh No. 8 coal tars.
tar MW C H N S+O * H/C N/C
wire mesh 311 81.4 7.4 1.4 9.75 1.09 0.015
tubular reactor 320 81.4 7.0 1 10.3 1.03 0.012
Table BA.1b. Pittsburgh No. 8 coal - tubular reactor tar fractions.
fraction wt % MW C H N S+O * H/C N/C
fraction 1 2.7% 540
fraction 2 14.6% 410 81.87 8.2 1.01 8.92 1.2 0.01
fraction 3 29% 340 82.06 7.0 0.99 9.95 1.02 0.01
fraction 4 33% 310 80.37 7.3 1.16 11.17 1.09 0.0123
82.2 7.5 0.93 9.3 1.09 0.01
fraction 5 17.2% 290 82.73 7.6 1.61 8.1 1.1 0.012
fraction 6 3.6% 240* by difference; __ samples were analysed by Huffman Laboratories, Inc.

299
Table BA.2a. Bruceton coal tar.
tar MW C H N S+O * H/C N/C
fluidized bed 347 82.08 7.7 1.22 9.0 1.13 0.013
Table BA.2b. Bruceton coal - fluidized bed reactor tar fractions.
fraction wt % MW C H N S+O * H/C N/C
fraction 0 1.2 820
fraction 1 8.1 520 86.7 8.9 2 2.4 1.23 0.02
fraction 2 16.6 395 86.5 8.25 1.34 2.4 1.14 0.013
fraction 3 23.6 320 82.7 8.1 1.04 8.2 1.17 0.011
fraction 4 22.9 310 82.4 7.8 0.82 9 1.13 0.009
fraction 5 15.4 275 82.0 7.9 0.91 9.2 1.16 0.01
fraction 6 7.5 250 83.57 7.3 1.10 7 1.05 0.011
fraction 7 2.8 275 82.5 7.8 1.24 8.4 1.13 0.013
fraction 8 1.8 290* by difference; __ samples were analysed by Huffman Laboratories, Inc.

300
Table BA.3a. Illinois No.6 coal tars.
tar MW C H N S+O * H/C N/C
wire mesh 281 75.6 6.7 1.08 16.6 1.07 0.012
tubular reactor 273 80.47 7.7 1.34 10.49 1.15 0.014
79.2 7.2 1.2 12.4 1.09 0.013
Table BA.3b. Illinois No. 6 coal - tubular reactor tar fractions.
fraction wt % MW C H N S+O * H/C N/C
fraction 1 2.6% 560
fraction 2 16.1% 395 78.8 8.3 0.9 12 1.26 0.01
fraction 3 27% 299 79.9 7.6 0.84 11.7 1.14 0.009
fraction 4 42% 270 80.9 7.4 0.92 10.7 1.1 0.01
fraction 5 10.7% 233 80.6 6.6 1.3 11.4 1.0 0.014
fraction 6 1.9% 248* by difference; __ samples were analysed by Huffman Laboratories, Inc.

301
Table BA.4a. Upper-Freeport coal tars.
tar MW C H N S+O * H/C N/C
wire mesh 290 87.16 7.8 1.3 3.74 1.07 0.013
tubular reactor 276 86.1 8.8 1.26 3.84 1.23 0.012
88.2 8.3 1.06 4.2 1.13 0.01
Table BA.4b. Upper-Freeport coal - tubular reactor tar fractions.
fraction wt % MW C H N S+O * H/C N/C
fraction 0 0.6
fraction 1 14.1 390 84.5 8.33 1.0 6.1 1.18 0.01
fraction 2 17.9 315 86 8.07 1.6 4.3 1.12 0.016
fraction 3 19.3 295 86.7 8.7.79 1.5 3.9 1.07 0.015
fraction 4 35.4 265 87.3 7.79 1 3.9 1.07 0.01
fraction 5 12.8 230* by difference; __ samples were analysed by Huffman Laboratories, Inc.

302
Table BA.5a. Wyodak coal tars.
tar MW C H N S+O * H/C N/C
wire mesh 325 78.49 7.9 1.03 12.58 1.208 0.011
tubular reactor 340 79.3 7.9 0.8 12 1.2 0.009
Table BA.5b. Wyodak coal tubular - reactor tar fractions.
fraction wt % MW C H N S+O * H/C N/C
fraction 1 53% 505 77.2 7.8 0.45 14.6 1.2 0.005
fraction 2 45.7% 290 78.9 6.7 0.65 13.75 1.0 0.007
fraction 3 1.3% 240* by difference; __ samples were analysed by Huffman Laboratories, Inc.