Embed Size (px)
Citation preview

Dr Scott Le Vine, Mr Jianlin Luan and Professor John Polak
October 2013
Van travel in Great BritainWhat do we know from the National Travel Survey?
Published by the Independent Transport Commission
The Independent Transport Commission (ITC) is one of Britain’s leading research charities with a mission to explore all aspects of transport and land use policy. Through our independent research work and educational events we aim to improve and better inform public policy making. For more information on our current research and activities please see our website: www.theitc.org.uk
Independent Transport Commission 70 Cowcross Street London EC1M 6EJ
Tel No: 0207 253 5510 www.theitc.org.uk
Registered Charity No. 1080134 October 2013 © Copyright Independent Transport Commission
Acknowledgements:
The ITC would also like to record its gratitude to our Core Benefactors, the report authors and all who have provided advice and assistance at the Department for Transport.
The authors would also like to thank Andrew Britton, Malcolm Jay, Peter Jones, Matthew Niblett, Lyndsey Melbourne and Gary Love for practical assistance and thoughtful feedback during this study. Without their input the depth of this research would not have been possible.
The views expressed within this work are those of the authors and do not necessarily reflect the corporate view of the ITC.
October 2013

1
INDEPENDENT TRANSPORT COMMISSION
Preface from the Chairman
‘What’s in a name?’ runs one of Shakespeare’s most famous phrases, and within that school-learnt quotation dwell the many challenges encountered by John Polak and colleagues in their investigation of van activity and usage, as part of the ITC’s wider ‘Road and Rail travel trends’ research study [for earlier reports in this series visit http://www.theitc.org.uk/dyn.php?page=32].
The Department for Transport (DfT) is clear in its latest Road Traffic Estimates that light goods traffic (which includes vans) has increased by over 30% since 2000 and is now at record levels.1 The problem our sleuths have encountered is that the National Travel Survey (NTS) data, which might have given us a clue as to what was happening within this general increase, is significantly out of kilter with the DfT’s own estimate - van usage appears to have fallen over the same decade according to the NTS (based on submissions made by van owners). Polak and colleagues have investigated this oddity and uncovered a series of reasons for this level of under-reporting by NTS. These are related to questions about how we define vans, who owns the vehicle, and the purposes for which the van is used, particularly since the NTS omits the delivery of a parcel or packet from “van use”. The later issue alone could answer much of the increased under-recording of van travel since it neglects the ways in which e-commerce is rapidly taking hold on our lives.
On behalf of the ITC, we applaud the authors’ diligence in unravelling these conflicting statistics and for providing a very cogent series of recommendations on how these anomalies could be resolved.
Why is this important? The ITC recognises that transport’s real function is as an engine for society and the economy. In this latter category we note that the use of vans in many different guises – whether delivering goods, engineering services; or, indeed, delivering people to their site of work – reflect the changing nature of society. The authors identify that most van users are still overwhelmingly male, middle-aged, self-employed and that they drive further in rural areas. More reliable data on van usage and trends would, we believe, illuminate much more clearly the way van use is shifting in response to changing patterns in our society. We might also develop a better idea of how van use reacts to changes in policy, such as congestion charging or parking fees.
We invite commentary on this report; the authors’ emails are referenced and our Secretariat can be emailed with comments on [email protected]. We are particularly interested in additional recommendations to those listed in Chapter 4 on how to improve data collection.
By thus recording van travel under all its names, we look forward to improved data that will enhance our understanding of this critical element of our transportation network.
Simon Linnett Chairman Independent Transport Commission
1 DfT Road Traffic Estimates, Quarter 2, 2013, p. 2 [https://www.gov.uk/government/uploads/system/uploads/attachment_data/file/226935/road-traffic-estimates-quarter-2-2013.pdf ]

Van travel in Great Britain What do we know from the National Travel Survey?
2

3
INDEPENDENT TRANSPORT COMMISSION
Van travel in Great BritainReport by Dr Scott Le Vine, Mr. Jianlin Luan and Professor John PolakImperial College, London
Table of Contents
Executive Summary 4
Report:
1. Introduction 7
2. Reconciling diverging time-trends 14
3. Van travel patterns: who is using vans and how? 27
4. Recommendations 36
5. Conclusions 42
Appendix: Make/model of vehicles mis-classified in NTS 44

Van travel in Great Britain What do we know from the National Travel Survey?
4
1. Vans comprise a growing share of the traffic on Britain’s roads. While car traffic has stagnated in recent years, van mileage has not and its share of all traffic has grown from 11% to 14% since the year 2000. Yet for various reasons the Department for Transport’s National Transport Model subjects van-traffic growth to only the most basic of analyses. This means that the National Road Traffic Forecasts, which play a vital role in the Department’s selection of infrastructure investment and policy strategies, are much less sensitive to factors affecting van use than they are for both cars and heavy goods vehicles.
2. More sophisticated forecasting of future van traffic levels will hinge on the quality of available data. The National Travel Survey (NTS) however reports a downward year-on-year trend in van traffic since 2003, which is at variance with the Road Traffic Estimates and DVLA’s (Driver and Vehicle Licencing Agency) database of vehicle registrations. The NTS is designed primarily to record personal travel – it does not attempt to record most types of commercial travel – but this alone cannot explain why the differences between the various data sources have been growing over time. The ITC has commissioned this study, as part of its ‘On the Move’ workstream looking at changing road and rail travel trends in Britain (for earlier reports see here: http://www.theitc.org.uk/dyn.php?page=32), to explore current trends in van travel and to understand why there seem to be discrepancies in the current data sources.
3. The main findings of this study are:
A. There is a growing discrepancy between whether an NTS respondent classifies a vehicle as a van and whether the DVLA’s vehicle-registration database does. We did not investigate in detail the reason(s) for this trend. Correcting for these classification problems accounts for about a fifth of the downward trend in van traffic as recorded by the NTS.
B. There is an increasing tendency for vans’ driving mileage to be omitted from NTS respondents’ travel diaries. Again, we have not identified why this has happened. This trend was uncovered by comparing the odometer readings of vans in the NTS sample taken before and after the NTS travel week. This has a stronger effect on the NTS’ estimate of van mileage than the mis-classification of vans.
C. Correcting for both of these two effects results in the NTS’ estimates of van traffic and private van registrations trending upwards over time rather than downwards. This is shown in Figure ES-1; this trend is more consistent with the Road Traffic Estimates (which are based on manual traffic counts) and DVLA’s administrative data on van registrations. It is plausible that the more-sharply upward trend in the Road Traffic Counts is due mainly to parcel deliveries (which are not recorded in the NTS), but this cannot be known for certain.
Executive Summary

5
INDEPENDENT TRANSPORT COMMISSION
Figure ES-1: Comparison of estimates of annual light van mileage across GB. Best-fit lines shown for years 2002-2010.
0
5
10
15
20
25
30
35
40
45
1995 2000 2005 2010
Bill
ions
Van mileage recorded in Road Traffic Estimates
NTS estimate (using DVLA vehicle classification) from 'before' and 'after' diary week readings of mile-o-meters of vans that are available for private use
NTS estimate from 'before' and 'after' diary week readings of mile-o-meters of vans that are available for private use
Standard NTS Estimate, from diary data and using respondent's self-report of vehicle class
NTS estimate using DVLA vehicle classification (and NTS vehicle classification if not matched in DVLA licencing database)
4. After correcting for the two biases described above, we investigated patterns of van usage using the NTS.
5. The findings of van usage were striking. First, it is clear that men drive vans much more than women; second these male drivers are predominantly middle-aged (30-60 years). Amongst different types of workers, self-employed non-professionals are the heaviest users of vans. And van drivers are light users of public transport and active transport (walking and cycling). As with cars, the greatest level of van driving per person is in the nation’s rural areas. We found, however, that van use relates with income in a distinctive way. Car use increases with income, right through to the top of the income scale. But van use is different – beyond the £30K – £40K per annum band of personal income there is a drop-off in per capita van driving mileage. This has important consequences for how van activity is modelled.
6. In the course of this study it was determined that some caution must also be exercised when interpreting the Road Traffic Estimates. There is no reliable data on trends in van traffic levels in the winter, and across the whole year at weekends and after 7:00 PM at night. Further, minibuses and larger people carriers are classified as vans in the Road Traffic Estimates, but are not classified as vans by the NTS or by DVLA’s administrative data. Therefore, their growth is contributing to estimated van traffic growth only in the Road Traffic Estimates, but not in other data resources.
7. On the basis of this study’s findings, we recommend the following steps to enhance our understanding of van travel trends:
Recommendation #1: Conduct an in-depth econometric study that identifies what lies behind the growing rate of private van ownership and use, making use of the National Travel Survey. This would dovetail with the Department’s present line of enquiry into whether light van traffic will grow linearly in future or will ‘saturate’ at some point.

Van travel in Great Britain What do we know from the National Travel Survey?
6
Recommendation #2: Further research to identify the cause(s) of increasing under-reporting in vans mileage in the NTS’ travel diaries, and whether they can be addressed.
Recommendation #3: The National Travel Survey should begin, from 2015, to gather limited information about the types of commercial travel that have historically been excluded. This makes efficient use of resources that the DfT already allocates to answer new research questions. There are a range of successful precedents for re-balancing the NTS’ interview topics to account for newly-emerging issues, though care is required to maintain continuity in the NTS time series.
Recommendation #4: A formal and inclusive process should be set in motion to scope the enhancements to the Department’s van-traffic forecasting procedures. These consultations might be undertaken as part of the Department’s new initiative on Openness and Transparency in National Transport Modelling (inaugurated in spring 2013).
Recommendation #5: The professional traffic counting teams ought in future to distinguish between light goods vehicles and minibuses/people carriers. This would provide (at little cost) a further improvement in the ‘data infrastructure’, facilitating future studies of their distinct traffic patterns and time trends as well as more direct comparisons with other data resources.
Recommendation #6: The Department for Transport’s historic manual traffic counts ought to be analysed to assess trends in how much van traffic takes place at different times of the day. This is a small-scale undertaking that would strengthen the evidence base on time trends in van traffic.
8. This study was undertaken to determine whether divergent trends in Britain’s van data resources can be reconciled. Much work remains to better understand the observed trends in van use, and it is good news indeed that the Department for Transport is pursuing this line of research. We hope that our recommendations will strengthen the evidence base regarding this poorly-understood but increasingly important part of the transport sector.

7
INDEPENDENT TRANSPORT COMMISSION
1.0.1 This study looks at van traffic, which has been growing rapidly – up by a quarter in the decade from 2001-2011, as compared to 2% growth for car traffic (see Figure 1.1). The latest figures from the Road Traffic Estimates (Q2 2013) show that light van traffic is now at its highest recorded level. Van traffic grew more quickly than cars and heavy goods vehicles before the onset of recession in 2008, and since then it has decreased to a lesser degree.
1.0.2 Britain relies profoundly on commercial vans – without them, tradesmen, equipment and deliveries of all sorts would be idled. But whilst Government continuously monitors how both cars and heavy goods vehicles are being used, and their usage is modelled in great detail to develop the official Road Traffic Forecasts used in infrastructure-investment appraisal, there is a major gap in knowledge when it comes to vans. Comparatively little is known about how they are used, despite their growing importance to both the economy and achieving sustainability targets.
Figure 1.1: Growth in van and other types of traffic, 1993-2013 Q2.
80
90
100
110
120
130
140
150
160
170
180
Ave
. 199
3
Q4
1994
Q4
1995
Q4
1996
Q4
1997
Q4
1998
Q4
1999
Q4
2000
Q4
2001
Q4
2002
Q4
2003
Q4
2004
Q4
2005
Q4
2006
Q4
2007
Q4
2008
Q4
2009
Q4
2010
Q4
2011
Q4
2012
Inde
x (a
vera
ge 1
993
= 1
00)
Cars Light vans All vehicles HGVs
Reproduced from DfT’s published table TRA2501
1.0.3 Past efforts in Britain to understand van activity have been fragmentary and one-off. This has been in part due to the design choices made for the first National Travel Survey in the mid-1960s, and in part due to a genuine difficulty in monitoring van use as compared to both smaller vehicles (mainly cars) and larger lorries.
1.0.4 This study follows on from 2012’s On the Move2, which looked in depth at the levelling-off of car traffic in the 2000s. The Department for Transport (DfT) invests much effort in the set of modelling practices used for analysing (and then forecasting) car traffic patterns – practices which are made possible in large measure by the nature, depth and fidelity of how the National Travel Survey records how, why,
1. Introduction
2 Le Vine, S. and Jones, P. (2012) On the Move: Making sense of car and train travel trends in Britain. Prepared for the Independent Transport Commission, Office of Rail Regulation, RAC Foundation, and Transport Scotland. Available at: http://www.theitc.org.uk/docs/47.pdf

Van travel in Great Britain What do we know from the National Travel Survey?
8
where and when people use cars. In On the Move the question was whether these techniques are adequately capturing the newly-emerging determinants of car traffic (e.g. trends in youth licence-acquisition, company car policy reform, a growing gap between London and elsewhere in Britain, changes in women’s social and economic roles, international migration, etc.).
1.0.5 In the present study the issue is somewhat different – for various reasons, the methods used by DfT to forecast van traffic are less sophisticated in comparison to car traffic. But the growing share of vans in the nation’s traffic means that they are becoming more relevant to forecasting overall road traffic levels. Yet future-year van traffic in England and Wales is forecasted using just a single equation to calculate a national growth rate (which is applied across the board) on the basis of only three indicators: GDP, population, and fuel price.
1.0.6 The structural changes in traffic patterns mean that vans’ contribution to future traffic streams can no longer be subject to light-touch analysis. Formulating sound roads policy requires, first, a deeper knowledge of what has ‘driven’ the growth in van traffic, and second much finer-scale assessment of how the various options on the public policy agenda would affect van traffic and their contribution to the economy.
1.0.7 For these reasons, policymakers and transport economists are increasingly focusing on commercial vans. The knowledge base to support informed policy interventions is however comparatively weak (relative to other types of road traffic), and it has recently become clear that the relevant data series show contradictory trends.
1.0.8 This matters in two respects. Firstly, the future-year forecasts must be based (subject to resource constraints) on the best available evidence and state-of-the-art methods, and secondly they should exhibit sensitivity to a range of plausible policy measures. On both of these measures, DfT’s van-forecasting methods are under-developed relative to cars and HGVs, and ripe for enhancement.
1.0.9 At the time of writing the DfT is presently engaged in extending its van traffic forecasting capability. The DfT is investigating whether there is any evidence to suggest that the relationship between GDP and van-traffic will over time flatten out (i.e. will not increase indefinitely in lockstep with GDP growth).
1.0.10 Beyond this much-needed research into establishing whether van activity is likely to be subject to saturation effects, further advances in the Department’s van-traffic forecasting practices will be required, which will take time and require substantial effort.
1.0.11 Whilst it must be recognised that no ‘perfect’ forecasting method exists, how much or how little imprecision there is in future year forecasts will impact infrastructure-investment and policy-appraisal outcomes and hence policy choices. But as with any modelling effort there are the linked questions of how to specify the models and whether the required data resources are available, or can be made available.
1.0.12 Van-usage is a complex phenomenon to model – or rather a complex set of phenomena, involving delivery, servicing activities, commuting, other personal travel, etc. Personal travel and HGV movements however also involve much complexity, and there is no compelling behavioural reason to model van activity at such a coarse level of granularity relative to these other types of travel behaviour. The key question is therefore the availability of suitable data resources.

9
INDEPENDENT TRANSPORT COMMISSION
1.0.13 Relevant data exist both within and outside of the DfT, and the necessary first step in enhancing the van-traffic forecasting methods is to identify what evidence exists and whether one can rely on it. This study’s contribution is to establish the fidelity of one such dataset – the National Travel Survey – with a view to assessing whether it can be useful to prospective follow-on efforts to strengthen vans-traffic forecasting practices.
1.1 Motivation
1.1.1 Van traffic counts (the DfT’s Road Traffic Estimates) show that vans have for some time been the fastest-growing segment of motorised road traffic use. Meanwhile, car traffic – which represents about four-fifths of road traffic, has stagnated.
1.1.2 But the National Travel Survey (NTS), which has tracked Britons’ travel in great detail since the 1960s, shows van use to have trended down since the early 2000s. While the NTS does not record all types of commercial travel, this has always been the case. It is unexpected for its estimate of van use to be tending to diverge over time from the Road Traffic Estimates. One hypothesis that has been raised is that the types of van use that are growing the fastest (e.g. delivery services) are not captured in the NTS. But this is an unsatisfying explanation, because to be true it requires, implausibly, other categories of van travel (e.g. tradesmen calling to job sites) to have fallen very sharply.
1.1.3 This is a small-scale study that aims first to identify why the vans data series have trended in opposite directions, in order to assess the fitness-for-purpose of the databases for prospective in-depth studies of van use in GB.
1.1.4 It next investigates, subject to the caveat that the NTS does not record all types of van use, the patterns of van activity that it is uniquely able to uncover. Other datasets are better-placed to provide the evidence required for certain questions about van use – this study recognises this and hence focuses on the unique evidence that the NTS provides. It is therefore complementary to other recent studies of van activity drawing from other data resources, which are discussed in Section 1.3.
1.1.5 Finally, this study concludes with a set of considered recommendations, which include suggestions for enriching the DfT’s relevant data resources to strengthen the evidence base regarding van activity.
1.2 Data resources
1.2.1 The DVLA publishes tabulations of the van fleet from its vehicle-registration database. The database contains, among other details, make/model information and whether the registered owner is an individual or company.
1.2.2 The DfT’s Roads Traffic Estimates data is sourced from a combination of automatic and manual traffic counts across the road network. Automatic traffic counting stations continuously monitor traffic (and classify passing vehicles) at 180 fixed locations; this is supplemented by around 10,000 manual traffic counts annually.
1.2.3 The National Travel Survey uses a seven-day travel diary to record personal travel by approximately 20,000 people annually, but as mentioned above by specification it

Van travel in Great Britain What do we know from the National Travel Survey?
10
captures only a fraction of commercial travel and hence much van use. It was initially designed in the 1960s to record some types of commercial travel but not others,3 and this has carried on up to the present day in the interest of consistency in the time series. As vans are predominantly used for commercial purposes, this means that the NTS does not tell the full story of how and why vans are being driven. Further, whilst the NTS sample4 is large, the sample of van drivers during any given year is much smaller (between 300 and 400 annually) – see Table 1.1.
Table 1.1: Annual unweighted sample sizes (2002 to 2010) of vans in the National Travel Survey sample
Number of ‘household’ vans (must be available for
private use)
Number of people in NTS sample that drove a van during their diary week
2002 334 423
2003 410 502
2004 347 408
2005 382 457
2006 391 433
2007 397 421
2008 353 386
2009 365 362
2010 350 336
Strengths and weaknesses of the National Travel Survey to monitor van activityStrength: It is a large-sample survey (currently 8,000 – 9,000 households/year), undertaken continuously since 1988 and with a scientific sampling protocol to ensure that it is nationally-representative.
Strength: It is conducted through in-depth face-to-face interviews, rather than by phone, post or online
Strength: It tracks van users’ van activity, as well as their use of cars and other forms of travel
Strength: NTS respondents report very detailed socio-economic information about themselves and their household, so the characteristics of van drivers can be directly compared with people in the same sample that do not drive vans
Weakness: It does not cover all types of commercial travel, notably when the primary motivation for a journey is to deliver any sort of item
Weakness: It does not collect certain types of detailed information about vans that are of interest – for instance, sub-categories of van-type, and a set of journey-purpose definitions which accounts for important differences in how vans are used (e.g. delivering a parcel, delivering equipment, making a service call, returning empty, etc.
Weakness: As discussed in Section 2, the time-trend in the level of van traffic estimated by the NTS has tended to diverge from other estimates of van traffic, which raises questions about the fidelity of the NTS regarding van activity
3 Commercial journeys undertaken primarily to deliver a person are in principle recorded in the NTS, but commercial journeys to deliver item(s) (e.g. post, other deliveries, tools, machinery, bulk material, etc.) are not.
4 Throughout this report we exclusively analyse the NTS’ ‘diary sample’, which includes only households for which every member took part in an interview and also completed a travel diary. There are also partially-responding households (whose interview data is known), which we do not consider in this study.

11
INDEPENDENT TRANSPORT COMMISSION
1.2.4 The Department’s occasional studies of vans have sometimes involved data collection – large-scale one-off surveys of vans were undertaken in 1987, 1993, 1998-99, 2003-05, and most recently in 2008. Though the methods have varied (and therefore time trends cannot be identified with confidence), the bespoke surveys have collected richer information on van use than the NTS does. For instance there is no breakdown of the ‘business’ journey purpose in the NTS, whilst the one-off van surveys have collected more-detailed data on the motivations for van journeys (delivering/collecting goods, carrying equipment, returning empty, etc.)
1.2.5 Other data resources capture certain aspects of van activity. HMRC publishes annually the number of vans that taxpayers claim as a benefit-in-kind on their tax returns. Traffic and parking violations involving vans are compiled by the relevant authorities.
1.2.6 Furthermore, there exists additional information on the van fleet that is not in the public domain. GPS tracking devices are widely used to monitor the movements of vans in commercial fleets; in some cases this data is stored. Industry organisations such as the Society of Motor Manufacturers and Traders (SMMT) maintain commercial databases, and firms dealing with vehicle transactions (e.g. Parkers, Glass, etc.) will have information that is more detailed than that which is publicly-available. But in addition to being unavailable these data are also of uncertain quality and are not subject to the same standards as the Department’s official National Statistics.
1.3 Background and recent van studies
1.3.1 Figure 1.2 shows that, as measured in the Road Traffic Estimates, van traffic fell as a share of all GB traffic from the immediate postwar period through the late 1980s, which roughly corresponds to the period when car traffic was growing rapidly. The relative drop occurred despite van mileage more than tripling between 1950 and 1980 (from 5 to 16 billion miles). Car traffic simply grew faster.
Figure 1.2: Van traffic as a percentage of all motorised traffic in Britain, 1950 to 2011
0%
1%
2%
3%
4%
5%
6%
7%
8%
9%
10%
11%
12%
13%
14%
15%
1950 1955 1960 1965 1970 1975 1980 1985 1990 1995 2000 2005 2010
Van
tra
ffic
as
a pe
rcen
t of
all
mot
oris
ed t
raff
ic in
Bri
tain
Source: DfT Road Traffic Estimates Table TRA0101

Van travel in Great Britain What do we know from the National Travel Survey?
12
1.3.2 From the late 1980s the relationship has reversed. Since stabilising at about 9% of all traffic in Britain van traffic has been a growing share of the nation’s traffic stream, and now accounts for just under 14% of all mileage driven.
1.3.3 Several recent studies of van activity are noteworthy. In 2013 Transport for London published a major report titled “Understanding Vans in London”.5 The key findings included: roughly half of vans that travel into London do so fewer than four times per year; opportunities exist to consolidate van-loads into fewer, more fully-loaded van journeys; evidence existed of vans increasingly being substituted for HGV movements; and the report forecasts continued growth in van activity in London.
1.3.4 In 2008 DfT undertook the most recent national survey of van activity (“Van Activity Baseline Survey”). Among other results, it was found that privately-owned vans generally were driven fewer miles per year than vans owned by companies, and that the ‘service provision’ business activity was responsible for 40% of all van mileage, about double the share of the ‘goods collection and delivery’ activity.
1.3.5 The Commission for Integrated Transport (CfIT) published “Vans and the Economy” in 2010.6 On the question of the future trajectory of growth in van activity, the study concluded that certain types of van use were likely to be relatively stable (e.g. utilities), whereas just-in-time deliveries and express parcel services were likely to be areas of growth.
5 AECOM (2013) Understanding Vans in London. Prepared for Transport for London (TfL). Final Report dated 15 May 2013.
6 Commission for Integrated Transport (CfIT) (2010) Vans and the Economy. Available at: http://webarchive.nationalarchives.gov.uk/20110304132839/http://cfit.independent.gov.uk/pubs/ 2010/vans/index.htm

13
INDEPENDENT TRANSPORT COMMISSION
What is a van?There is no single universally applicable definition of what is a light van, and this can lead to confusion and mis-interpretation.
The Road Traffic Estimates consider all goods vehicles up to 3.5 tonnes as ‘Light Goods Vehicles’. This is specified to exclude SUVs, but include:
• People carriers when built on a Ford Transit or Renault Traffic chassis (or larger) • Car wheel-based delivery vans with closed in rear windows • Medium carrying capacity vans • All mini-buses, with a transit van-type • Small pickup vans • Three-wheeled goods vehicles • Milk floats • All types of ambulances • Mowing machine (with or without trailer), a specialist ride-on grass cutting vehicle with
permanent cutting equipment • Pedestrian controlled motor vehicles (PCVs), i.e. a powered vehicle where the operator walks
with the vehicle and does not ride on it, such as a rotivator
As we shall see, the above is the guidance that applies to manual traffic counts, those performed by trained professional traffic-counting staff. Another set of data is also used to generate the Road Traffic Estimates, and the source of this data is automatic traffic counts. The technology used by the ATCs identify each vehicle that passes a fixed counting station as an LGV or not based on its estimated overall length and the percentage of its length that overhangs its wheelbase.
The Driver and Vehicle Licencing Agency defines the ‘light goods vehicle’ body type to include any four-wheel vehicle constructed for transporting goods that has a gross vehicle weight of 3.5 tonnes or less.
Her Majesty’s Revenue and Customs defines a vehicle as a van (and therefore not a car) if it is ‘of a construction primarily suited for the conveyance of goods or burden of any description’, where ‘goods or burden’ cannot include passengers. The presence of side windows behind the driver or passenger doors will in general lead HMRC to identify a vehicle as a car rather than a van.
The National Travel Survey uses a definition similar to HMRC: the presence of side windows behind the driver identifies a vehicle as a car, whereas light vans (which include pick-ups and car-based vans) do not have side windows. Sport utility vehicles are explicitly classed as cars, and the respondent is able to indicate whether their vehicle is a ‘light van’ or ‘some other type of van or lorry’. In the latter case it is classified in the ‘Other vehicle’ category along with caravans and other types of vehicles. Crucially, it is up to each NTS respondent to indicate whether their vehicle is a ‘light van’ or not. The NTS questionnaire is on a laptop, and the question routing in the vehicle section has changed over time.

Van travel in Great Britain What do we know from the National Travel Survey?
14
2. Reconciling diverging time-trends
2.0.1 This study aimed to reconcile differences between the Road Traffic Estimates, which show growing per-capita levels of van traffic in the 2000s, and the National Travel Survey, which shows a downward trend. These trends, shown in Figure 2.1, are conflicting and it is necessary to identify the ‘true’ trends in van activity. In 1995 the NTS was recording about 35% of the van traffic recorded in the RTEs; by 2010 this had fallen to 16%.
2.0.2 The NTS data have attractive properties – it is a long-term consistent time series and contains very in-depth information about many aspects of people’s transport – but the pattern shown in Figure 2.1 raises the fundamental question of whether one can rely on it to monitor time-trends in van activity.
Figure 2.1: Van traffic (1995 – 2010) in billions of vehicle-miles per year as recorded by the Road Traffic Estimates and National Travel Survey
0
5
10
15
20
25
30
35
40
45
1995 2000 2005 2010
Bill
ions
Van mileage recorded in Road Traffic Estimates
Estimate of van mileage from grossing up van mileage recorded in NTS
2.0.3 This study investigated a set of plausible reasons for the divergence in time trends:
Research question #1: The RTEs and NTS define vans differently – have these differences become more
important over time?
Research Question #2: The NTS relies on the willingness of people to respond to the survey. Are van users
becoming less well-represented in the NTS sample?
Research Question #3: Are van users continuing to take part in the NTS, but reporting less of their van use in
their travel diary?
2.0.4 We now look at each of these hypotheses in turn.

15
INDEPENDENT TRANSPORT COMMISSION
2.1 Are differences in vehicle classification between datasets increasingly important?
2.1.1 Here we look first (Figure 2.2) at the number of registered vans according to both the NTS dataset and DVLA’s vans registrations data. It is important to be aware that the NTS will only record vans that respondents keep overnight and can use for private use (as well as business), whereas the vans-registration database will also contain vans that are used for only commercial purposes. Therefore, we would expect the NTS’s estimate of the number of vans in GB to always be lower than the number of registered vans; it is the time trend that is of direct interest.
2.1.2 The NTS classifies vehicles into categories based on the owner’s self-report. The blue line in Figure 2.2 shows that using this classification method the number of light vans recorded by the NTS has been basically flat since 2002 (when there was a change of NTS contractor), whilst the number of van registrations (the pink line in Figure 2.2) reported by DVLA rose by 26% (2002 to 2010). The purple line tracks the number of people that drove a ‘non-household’ van during their NTS week; these are vans that they do not own and that are also not available for their continuous personal use. A van that belongs to an employer but which the employee drives for business would fall into this category.
2.1.3 Of particular interest, there is no large discontinuity in either of these two time-trends at any specific point in time, which would indicate a change in the way vehicle classes are defined as having a major impact.
2.1.4 But most NTS respondents that own (or otherwise keep) a vehicle (about 85%) report the registration mark, and it has recently become possible to link between this data (from 2002 onwards) and the DVLA database which provides a second source of information on each vehicle’s body type.
2.1.5 The dark red line in Figure 2.2 shows the number of vans recorded by the NTS, but using the classification based on the registration mark and DVLA make/model/body-type database rather than the respondent’s report7. The lighter of the green lines shows the combined number of vans whose details are recorded by the NTS and non-household vans (assuming one van per driver of a non-household van). Here we see an upward time trend that is more consistent with the time-trend in van registrations.
2.1.6 We can also see, by comparing Figure 2.1 and Figure 2.2, that using the DVLA definition of a van (versus the NTS respondent’s definition of whether their vehicle is a van) results in a greater uplift in the number of ‘vans’ in the NTS’ diary sample (35% on average) than in their mileage (24%). This is because vehicles classified as vans by the NTS-definition but not the DVLA-definition have higher average mileage than vice versa (8,063 v. 5,709 miles/year).
7 This definition also includes vans for which the NTS respondent refused to disclose the registration mark but which they self-reported as a light van.

Van travel in Great Britain What do we know from the National Travel Survey?
16
Figure 2.2: Number of light vans8 (grossed up to GB-wide number from NTS sample) and light goods vehicles (from DVLA’s registration data), 1995 to 2010
500,000
1,000,000
1,500,000
2,000,000
2,500,000
3,000,000
3,500,000
1994 1996 1998 2000 2002 2004 2006 2008 2010 2012
Registered vans in GB (DVLA licencing database)
Implied number of vans in NTS diary sample using DVLA classes (and NTS if missing)
Vans available for private use in NTS sample using DVLA classes (and NTS if missing)
Implied number of vans in NTS diary sample using NTS classes
Vans available for private use in NTS diary sample using NTS classification
People in NTS sample that drove a van that is not continuously available for their private use
2.1.7 The logical next question is what types of vehicles are being classified as light vans in the DVLA database but not by the NTS respondent who is the owner. Figure 2.3 investigates this question, and it can be seen that of three broad categories of vehicle types – Cars, Land Rovers/Jeeps, and ‘Other’ – there has been rapid growth in mis-classified light vans appearing in the ‘Land Rover/Jeep’ and the catch-all ‘Other’ class (by an average of +6 and +8 NTS-sample vehicles per year, respectively). There has also been growth in the ‘Car’ category, but this has been much slower (+1/year).
8 The bottom (purple) curve shows the number of people in the NTS sample that drove a van that they do not continuously have access to for their personal use (a ‘non-household’ van in standard NTS terminology). In this analysis one non-household van per driver of non-household van(s) is assumed. The complication arises because we do not know whether a driver drove just one or multiple non-household vans during their diary week.

17
INDEPENDENT TRANSPORT COMMISSION
Figure 2.3: Number of vehicles in NTS diary sample that are classified as light vans by DVLA vehicle-licencing database but not by vehicle owner in their NTS interview (NB: One light van was mis-classified as a motorcycle in both 2002 and 2006.)
0
50
100
150
200
250
2002 2003 2004 2005 2006 2007 2008 2009 2010
Num
ber
of v
ehic
les
(unw
eigh
ted)
Car
Landrover, Jeep
Other
38 46
25 36
43
36
37
46 50
16
30
41 50 50
57
45
71 65
39 15
59 58 62 82
64 85
99
2.1.8 The make and model of most vehicles (the roughly 85% whose registration mark is known and can be matched in the DVLA’s database) in the NTS sample is known, so a logical next step is to investigate further the characteristics of vehicles whose NTS and DVLA classifications do not agree. To do such an analysis rigorously is a resource-intensive task as the vehicle-model data in the current database are very detailed, with thousands of unique codes. The appendix to this report however lists the make/model of these vehicles from the 2010 NTS diary sample. On cursory review the list seems to mainly include vehicles designed for commercial use.
2.1.9 As the largest and fastest-growing share of vehicles classified as light vans by the DVLA database but not NTS respondents is in the NTS’ ‘Other’ category, Table 2.1 looks at the distribution of how vehicles classified as ‘Other’ by the NTS are classified by DVLA. What it shows is that most of the vehicles the NTS classifies as ‘Other’ are classified by DVLA as LGVs – and that this is increasingly so.
Table 2.1: Unweighted number of vehicles in NTS diary sample classified as ‘Other’, broken down by DVLA classification (2002-2010)
Buses & Coaches Cars Goods –
HeavyGoods –
LightAll other
categories
Registration mark not matched
2002 4 9 10 39 6 16
2003 2 3 15 1 3
2004 5 5 5 59 5 19
2005 6 6 12 58 2 12
2006 5 7 10 62 2 23
2007 3 5 3 82 5 25
2008 3 10 5 64 2 20
2009 4 6 7 85 9 22
2010 5 13 12 99 1 30

Van travel in Great Britain What do we know from the National Travel Survey?
18
2.1.10 The previous analyses looked at how mis-classification of vehicle type could be affecting the NTS’ estimate of how many vans there are, and we now turn to the question of how it affects its estimate of van traffic.
2.1.11 As can be seen in Figure 2.4, classifying vehicles in the NTS sample using DVLA categories rather than the NTS respondent’s report of vehicle-type results in substantial uplift in the aggregate estimate of van traffic. It also accounts for about 21% of the downward trend in the NTS van-traffic estimate – rather than decreasing by an average of -641 million vehicle-miles/year between 2002 and 2010, the downward trend becomes -505 million vehicle-miles/year.
Figure 2.4: Van traffic as recorded by the Road Traffic Estimates and National Travel Survey, with NTS estimate adjusted by re-classifying vans using the DVLA make/model code rather than the NTS respondent’s self-report. Best-fit lines shown for 2002-2010.
0
5
10
15
20
25
30
35
40
45
1995 2000 2005 2010
Bill
ions
Van mileage recorded in Road Traffic Estimates
NTS estimate using DVLA vehicle classification (and NTS vehicle classification if not matched in DVLA licencing database)
Standard NTS Estimate,from diary data and using respondent’s self-report of vehicle class
2.2 Are van users increasingly under-represented in the National Travel Survey sample?
2.2.1 This possibility was investigated by comparing changes between 2002-2010 in the profile of workers in the National Travel Survey sample with the changes over time as recorded in other large-scale surveys: the Labour Force Survey and the Census. While all of these datasets are subject to different errors and biases, the profile of workers in the Census in particular is likely to be the most reliable as it is thought there will be much less non-response bias. Thus, any evidence of a divergence over time in the profile of workers in the various datasets would support this hypothesis. As can be seen in Figure 2.5, van drivers tend to be in the ‘manual’ and ‘self-employed non-professional’ classes of workers.

19
INDEPENDENT TRANSPORT COMMISSION
Figure 2.5: Van drivers (L) and all adult (R) NTS respondents, broken down by socio-economic grouping (SEG)
0%
10%
20%
30%
40%
50%
60%
70%
80%
90%
100%
2002/4 2005/7 2008/10 2002/4 2005/7 2008/10 Van drivers All adults
Employer/manager
Professional
Non-manual
Personal service
Manual
Self-employed non-professional
Other working adults
Non-working adults
2.2.2 Figures 2.6, 2.7, and 2.8 show the breakdown of workers in the NTS (2002 and 2010), Labour Force Survey (2002 and 2010), Census (2001 and 2011) respectively. The classification schemes used are different in all three cases, therefore changes over time are relevant but the absolute shares cannot be reliably compared between the data sources.
Figure 2.6: Breakdown of workers in the National Travel Survey sample by socio-economic grouping, 2002 and 2010
1% 1% 6% 7%
25% 22%
7% 7%
41% 42%
6% 6%
14% 15%
0%
10%
20%
30%
40%
50%
60%
70%
80%
90%
100%
2002 2010
Employer/manager
Professional
Non-manual
Personal service
Manual
Self-employed non-professional
Other working adults

Van travel in Great Britain What do we know from the National Travel Survey?
20
Figure 2.7: Breakdown of workers in the Labour Force Survey sample by standard occupation classification, 2002 and 2010
12% 12%
8% 6%
8% 7%
7% 9%
12% 10%
13% 11%
14% 15%
12% 14%
14% 16%
0%
10%
20%
30%
40%
50%
60%
70%
80%
90%
100%
2002 2010
Managers & senior officials
Professional occupations
Associate professional and technical
Admin. & secretarial
Skilled trades
Personal services
Sales & customer services
Process, plant and machine operatives
Elementary occupations
Figure 2.8: Breakdown of workers in the Census by standard occupation classification, 2001 and 2011
12% 11%
8% 7%
8% 9%
7% 9%
12% 12%
13% 11%
14% 13%
11% 17%
15% 11%
0%
10%
20%
30%
40%
50%
60%
70%
80%
90%
100%
2002 2010
Managers & senior officials
Professional occupations
Associate professional and technical
Admin. & secretarial
Skilled trades
Personal services
Sales & customer services
Process, plant and machine operatives
Elementary occupations
2.2.3 Between 2002 and 2010, the combined share of workers in the ‘manual’ and ‘self-employed non-professional’ classes fell by two percentage points (31% to 29%) in the NTS sample. The categories used in the NTS are different from the other two surveys, but we may surmise that the ‘process/plant/machine operatives’, ‘skilled trades’, and ‘elementary’ classes have substantial overlap with them. The Labour Force Survey and Census show their share to have fallen from 32% to 28% and 32% to 30%, respectively.
2.2.4 All three of these data sources are consistent in showing the share of workers in heavy-van-use occupations to have decreased; we can conclude that there is no evidence that the NTS sample is becoming less representative of the types of workers that are likely to use vans.
21
INDEPENDENT TRANSPORT COMMISSION
2.3 Are van users reporting less of their van use in the travel diary?
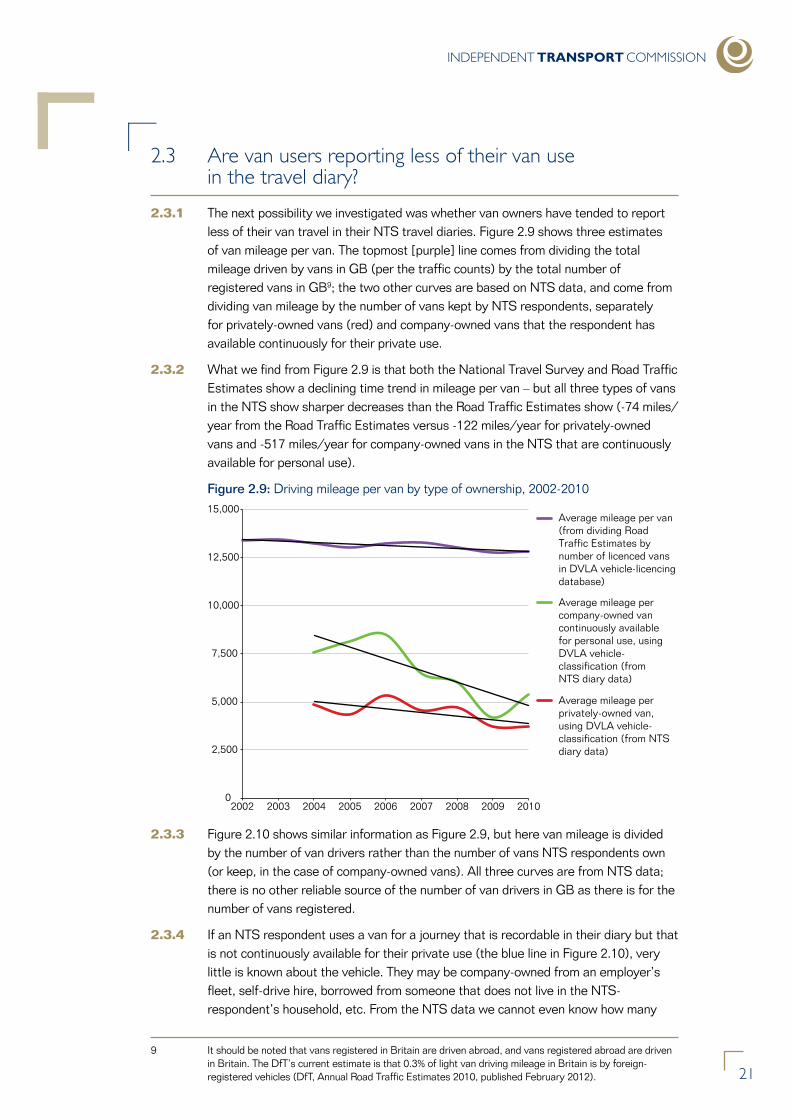
2.3.1 The next possibility we investigated was whether van owners have tended to report less of their van travel in their NTS travel diaries. Figure 2.9 shows three estimates of van mileage per van. The topmost [purple] line comes from dividing the total mileage driven by vans in GB (per the traffic counts) by the total number of registered vans in GB9; the two other curves are based on NTS data, and come from dividing van mileage by the number of vans kept by NTS respondents, separately for privately-owned vans (red) and company-owned vans that the respondent has available continuously for their private use.
2.3.2 What we find from Figure 2.9 is that both the National Travel Survey and Road Traffic Estimates show a declining time trend in mileage per van – but all three types of vans in the NTS show sharper decreases than the Road Traffic Estimates show (-74 miles/year from the Road Traffic Estimates versus -122 miles/year for privately-owned vans and -517 miles/year for company-owned vans in the NTS that are continuously available for personal use).
Figure 2.9: Driving mileage per van by type of ownership, 2002-2010
0
2,500
5,000
7,500
10,000
12,500
15,000
2002 2003 2004 2005 2006 2007 2008 2009 2010
Average mileage per van (from dividing Road Traffic Estimates by number of licenced vans in DVLA vehicle-licencing database)
Average mileage per company-owned van continuously available for personal use, using DVLA vehicle-classification (from NTS diary data)
Average mileage per privately-owned van, using DVLA vehicle-classification (from NTS diary data)
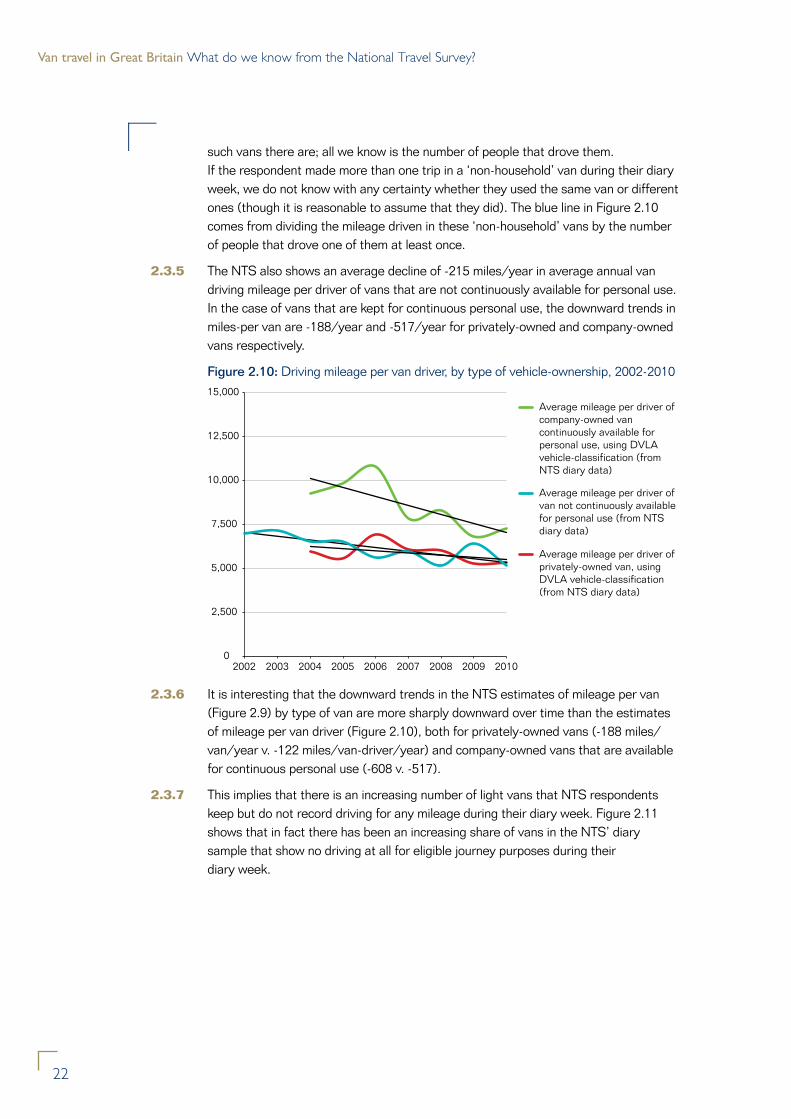
2.3.3 Figure 2.10 shows similar information as Figure 2.9, but here van mileage is divided by the number of van drivers rather than the number of vans NTS respondents own (or keep, in the case of company-owned vans). All three curves are from NTS data; there is no other reliable source of the number of van drivers in GB as there is for the number of vans registered.
2.3.4 If an NTS respondent uses a van for a journey that is recordable in their diary but that is not continuously available for their private use (the blue line in Figure 2.10), very little is known about the vehicle. They may be company-owned from an employer’s fleet, self-drive hire, borrowed from someone that does not live in the NTS-respondent’s household, etc. From the NTS data we cannot even know how many
9 It should be noted that vans registered in Britain are driven abroad, and vans registered abroad are driven in Britain. The DfT’s current estimate is that 0.3% of light van driving mileage in Britain is by foreign-registered vehicles (DfT, Annual Road Traffic Estimates 2010, published February 2012).
Van travel in Great Britain What do we know from the National Travel Survey?
22
such vans there are; all we know is the number of people that drove them. If the respondent made more than one trip in a ‘non-household’ van during their diary week, we do not know with any certainty whether they used the same van or different ones (though it is reasonable to assume that they did). The blue line in Figure 2.10 comes from dividing the mileage driven in these ‘non-household’ vans by the number of people that drove one of them at least once.
2.3.5 The NTS also shows an average decline of -215 miles/year in average annual van driving mileage per driver of vans that are not continuously available for personal use. In the case of vans that are kept for continuous personal use, the downward trends in miles-per van are -188/year and -517/year for privately-owned and company-owned vans respectively.
Figure 2.10: Driving mileage per van driver, by type of vehicle-ownership, 2002-2010
0
2,500
5,000
7,500
10,000
12,500
15,000
2002 2003 2004 2005 2006 2007 2008 2009 2010
Average mileage per driver of company-owned van continuously available for personal use, using DVLA vehicle-classification (from NTS diary data)
Average mileage per driver of van not continuously available for personal use (from NTS diary data)
Average mileage per driver of privately-owned van, using DVLA vehicle-classification (from NTS diary data)
2.3.6 It is interesting that the downward trends in the NTS estimates of mileage per van (Figure 2.9) by type of van are more sharply downward over time than the estimates of mileage per van driver (Figure 2.10), both for privately-owned vans (-188 miles/van/year v. -122 miles/van-driver/year) and company-owned vans that are available for continuous personal use (-608 v. -517).
2.3.7 This implies that there is an increasing number of light vans that NTS respondents keep but do not record driving for any mileage during their diary week. Figure 2.11 shows that in fact there has been an increasing share of vans in the NTS’ diary sample that show no driving at all for eligible journey purposes during their diary week.

23
INDEPENDENT TRANSPORT COMMISSION
Figure 2.11: Percentage of vans (using DVLA vehicle classification) that have no recorded driving-mileage in respondents’ travel diaries during their diary week, 2004 – 2010
0%
5%
10%
15%
20%
25%
30%
35%
40%
45%
2003 2004 2005 2006 2007 2008 2009 2010 2011
Privately-owned vans
Company-owned vans continuously available for personal use
2.3.8 Fortunately, in addition to the standard method of estimating driving-mileage per capita in the NTS (which involves summing up driving-mileage recorded by each respondent in their diary during their diary week and then dividing by the number of respondents), a second technique can also be used.
2.3.9 NTS respondents indicate the odometer readings of their vehicles at both the beginning and end of their diary week. By subtracting the ‘before’ reading from the ‘after’ reading, one can arrive at a second estimate of driving-mileage, which is not checked against respondents’ diary data and hence a somewhat independent estimate.
Figure 2.12: Percentage of vans (using DVLA vehicle classification) that have no recorded driving-mileage during their diary week, from subtracting the ‘before’ odometer reading from the ‘after’ reading (2004 – 2010)
0%
5%
10%
15%
20%
25%
30%
35%
2003 2004 2005 2006 2007 2008 2009 2010 2011
Privately-owned vans
Company-owned vans continuously available for personal use

Van travel in Great Britain What do we know from the National Travel Survey?
24
2.3.10 Figure 2.12 shows that, unlike Figure 2.11, there has not been an upward trend in the prevalence of zero-mileage vans when using this second definition.
2.3.11 Thus, we may conclude that there is increasing under-reporting of van driving mileage in the NTS’ travel diaries relative to comparing the ‘before’ and ‘after’ odometer readings. The NTS diaries are tending over time to capture a smaller share of the mileage that each van is driven.
2.3.12 The next question is how much of a difference this increase in under-reporting makes to the overall trend in van-mileage. Figure 2.13 investigates this issue.
2.3.13 The top (blue) line is the estimate of van driving mileage from the Road Traffic Estimates (in billions of miles per year), and the bottom (red) line is the standard NTS estimate of van usage. The next line above (green) shows the effect of estimating van driving mileage in the NTS using the ‘before’ and ‘after’ odometer readings rather than the recorded journeys in the NTS diaries. The change in estimation technique changes the downward trend from an average of -641 million miles/year to -200 million miles/year. The next line above this (purple) shows this effect combined with identifying whether a vehicle is a light van based on matching the number plate to the DVLA’s vehicle-licencing database (rather than the NTS respondent’s self-report of the vehicle’s class). When this is also taken into account, the time trend in van mileage becomes positive (+124 million miles/year).
2.3.14 The fact that this trend is increasing, as is the Road Traffic Estimate of van traffic, provides greater confidence in the NTS’ monitoring of van activity. The trend is still, however, not as strong as the growth shown in the RTEs. Therefore the implied proportion of van traffic captured in the NTS fell from 42% of the RTE estimate in 2002 to 37% in 2010.
Figure 2.13: Comparison of estimates of annual light van mileage across GB. Best-fit lines shown for years 2002-2010.
Van mileage recorded in Road Traffic Estimates
NTS estimate (using DVLA vehicle classification) from 'before' and 'after' diary week readings of mile-o-meters of vans that are available for private use
NTS estimate from 'before' and 'after' diary week readings of mile-o-meters of vans that are available for private use
0
5
10
15
20
25
30
35
40
45
1995 2000 2005 2010
Bill
ions
Standard NTS Estimate, from diary data and using respondent's self-report of vehicle class
NTS estimate using DVLA vehicle classification (and NTS vehicle classification if not matched in DVLA licencing database)
2.3.15 Figure 2.14 looks further at this by comparing the average annual mileage per van driver calculated from the Road Traffic Estimates and number of licenced vans on the one hand, and this revised estimate from the National Travel Survey on the other.

25
INDEPENDENT TRANSPORT COMMISSION
2.3.16 What we see is that vans observed in the NTS show consistently lower average mileage than vans in general (about 8,000 miles/year versus about 13,000). The two estimates show time trends that are divergent (+36 miles/year versus -74 miles/year, respectively), but both trends are very weak.
Figure 2.14: Van driving mileage per van, NTS and Road Traffic Estimates, with best-fit lines (2002-2010)
0
2,500
5,000
7,500
10,000
12,500
15,000
2002 2003 2004 2005 2006 2007 2008 2009 2010
Average mileage per van (from dividing Road Traffic Estimates by number of licenced vans in DVLA vehicle-licencing database)
NTS estimate of average mileage per van (using DVLA vehicle classification) from 'before' and 'after' diary week readings of mile-o-meters of vans that are available for private use and assuming one van per driver of van(s) not continuously available for usage
2.3.17 In conclusion, once the NTS estimate of van mileage is revised (by using the ‘before’ and ‘after’ odometer readings and an improved method for identifying vehicle type), it provides evidence consistent with the hypothesis that the growth in van traffic has been largely amongst high-mileage vans that are used more or less exclusively for commercial purposes. No error-free and bias-free dataset exists that could be used to establish with certainty that the trend shown by the purple line in Figure 2.13 is ‘correct’. We can conclude from this analysis however that the time-trend it shows is in line with what other datasets are showing and is also broadly in line with expectations, which is not the case when one looks at the red line in Figure 2.14.
2.4 Summary of data-fidelity analysis
2.4.1 We return now to the set of three research questions listed in the beginning of Section 2, summarising the findings.
1. Research Question #1: The RTEs and NTS define vans differently – have these differences become more important over time?
Increasing differences in what is classified as a van and what is not explain about a fifth of the downward trend in van traffic shown in the NTS. There is a growing divergence between what NTS respondents classify as vans and what the DVLA classifies as vans. Most of the divergence comes from DVLA-classified vans that NTS respondents classify as Land-Rover/Jeeps or the catch-all ‘Other’ category.

Van travel in Great Britain What do we know from the National Travel Survey?
26
Research Question #2: The NTS relies on the willingness of people to respond to the survey. Are van users becoming less well-represented in the NTS sample?
We found no evidence that the NTS sample is becoming less representative of van users, when compared with the Labour Force Survey and Census.
Research Question #3: Are van users continuing to take part in the NTS, but reporting less of their van use in their travel diary?
Van driving mileage is increasingly going unreported in NTS respondent’s travel diaries. This is detectable by comparing van driving mileage record in their travel diaries against the mileage calculated by subtracting vans’ odometer reading from before and after the same week.
2.4.2 After correcting for these two biases (mis-classification of vans and under-reporting of van mileage in travel diaries) the time-trend in overall van traffic estimated by the NTS is shown to be upward (rather than downward when not correcting for these biases).
2.4.3 But, even after correcting for these biases, the upward time-trend (the purple line in Figure 2.13) is not as sharp as the growth of van traffic shown in the Road Traffic Estimates (the blue line in Figure 2.13). This is consistent with the hypothesis that van use to make deliveries (which the NTS does not attempt to track) has grown faster than van use for other purposes.
2.4.4 On the basis of these findings, we can have more confidence in the NTS as a database of privately-owned van ownership and use. Section 3 therefore looks at such patterns.
27
INDEPENDENT TRANSPORT COMMISSION
3. Van travel patterns: who is using vans and how?
3.1 The National Travel Survey dataset is not traditionally used to analyse van activity; in the official tabulations of NTS data car and van activity is usually grouped together into the combined ‘car/van’ category.
3.2 Having established in Section 2 that the National Travel Survey seems to be subject to an increasing amount of under-reporting of van travel in the travel diaries, but not in the vehicle-odometer readings, this section provides a snapshot of the types of van-activity relationships that can be uncovered with the National Travel Survey data. It is not an exhaustive set of analyses that the data can support, but rather it is a subset and is intended to highlight the sorts of relationships that could be looked at in more detail in future efforts to model van activity.
3.3 Except where noted, the analyses in this section are based on the difference between the ‘before’ and ‘after’ odometer readings of vans in the NTS sample. Vans’ are identified by each NTS-sample vehicle with its record in the DVLA vehicle-licencing database. The NTS respondent’s self-report of whether their vehicle is a van is only used where the registration mark was not provided or cannot be matched in the vehicle-licencing database.
3.4 As this amended vehicle-classification is only available from 2002, the analyses that follow are based on the following year groups: 2002/4, 2005/7, and 2008/10. Grouping years together results in larger sample sizes and hence less noise in the time series.
3.5 We begin by looking at the types of people that drive vans, starting with income levels. We see in the left-hand side of Figure 3.1 the well-established positive relationship between income and car driving mileage. From the lowest through to the highest income bands there is a continuous upward trend in car driving mileage.
3.6 The right-hand panel shows that the relationship is not quite the same for van use – van use per person is roughly the same for income between £20K and £50K, but at the highest income band (£50K+) van use is somewhat lower than in the bands below. This type of relationship has implications for how van use is modelled; it highlights the need to distinguish between cross-sectional and longitudinal impacts of changes in income on van use.

Van travel in Great Britain What do we know from the National Travel Survey?
28
Figure 3.1: Average annual car and van mileage per person per year by personal income bands (RPI-adjusted to 2010 prices), 2002-2010. NB: van mileage scaled by a factor of 10
0
2,500
5,000
7,500
10,000
12,500
Zero to £9,999
£10K to £19,999
£20K to £29,999
£30K to £39,999
£40K to £49,999
£50K+ Zero to £9,999
£10K to £19,999
£20K to £29,999
£30K to £39,999
£40K to £49,999
£50K+
Car traffic (average annual mileage per person) Van traffic (average annual mileage per person, x10)
2002/4 2005/7 2008/10
3.7 Next we look at van use by age and gender, shown in Figure 3.2. Here we see that men are responsible for the vast majority of van mileage (about 88% in 2008/10), and that men’s van driving is at its highest level in middle age (ages 30 to 59). Interestingly, we do not observe a sustained downward trend in van-driving by young men, which was found to be the case for their car-driving mileage (see p.45 of On the Move).
Figure 3.2: Average annual van mileage per person per year by age and gender, 2002-2010.
0
250
500
750
1,000
1,250
16-19 years
20-29 years
30-39 years
40-49 years
50-59 years
60-69 years
70+ years
16-19 years
20-29 years
30-39 years
40-49 years
50-59 years
60-69 years
70+ years
Men Women
2002/4 2005/7 2008/10
29
INDEPENDENT TRANSPORT COMMISSION
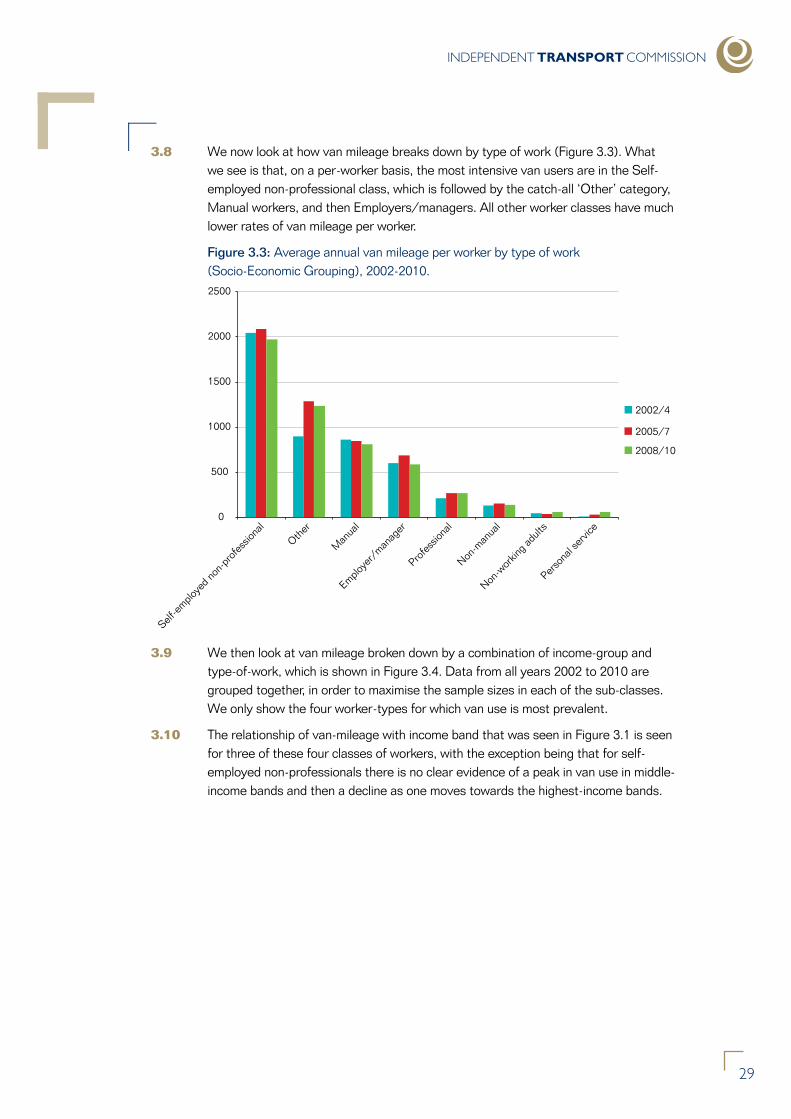
3.8 We now look at how van mileage breaks down by type of work (Figure 3.3). What we see is that, on a per-worker basis, the most intensive van users are in the Self-employed non-professional class, which is followed by the catch-all ‘Other’ category, Manual workers, and then Employers/managers. All other worker classes have much lower rates of van mileage per worker.
Figure 3.3: Average annual van mileage per worker by type of work (Socio-Economic Grouping), 2002-2010.
0
500
1000
1500
2000
2500
Self-e
mploye
d non
-pro
fess
ional
Other
Man
ual
Employe
r/man
ager
Profe
ssion
al
Non-m
anua
l
Non-w
orkin
g adu
lts
Perso
nal s
ervic
e
2002/4
2005/7
2008/10
3.9 We then look at van mileage broken down by a combination of income-group and type-of-work, which is shown in Figure 3.4. Data from all years 2002 to 2010 are grouped together, in order to maximise the sample sizes in each of the sub-classes. We only show the four worker-types for which van use is most prevalent.
3.10 The relationship of van-mileage with income band that was seen in Figure 3.1 is seen for three of these four classes of workers, with the exception being that for self-employed non-professionals there is no clear evidence of a peak in van use in middle-income bands and then a decline as one moves towards the highest-income bands.

Van travel in Great Britain What do we know from the National Travel Survey?
30
Figure 3.4: Average annual van mileage per worker by income band and type of work (Socio-Economic Grouping), all years 2002-2010 grouped together. L to R: Employer/manager, Manual, Self-employed non-professional, Other working adult
0
1,000
2,000
3,000
4,000
5,000
Zer
o to
£9,
999
£10K
to
£19,
999
£20K
to
£29,
999
£30K
to
£39,
999
£40K
to
£49,
999
£50K
+
Zer
o to
£9,
999
£10K
to
£19,
999
£20K
to
£29,
999
£30K
to
£39,
999
£40K
to
£49,
999
£50K
+
Zer
o to
£9,
999
£10K
to
£19,
999
£20K
to
£29,
999
£30K
to
£39,
999
£40K
to
£49,
999
£50K
+
Zer
o to
£9,
999
£10K
to
£19,
999
£20K
to
£29,
999
£30K
to
£39,
999
£40K
to
£49,
999
£50K
+
3.11 We next look at van drivers’ use of other types of travel, shown in Table 3.1. Here we see that van users drive cars an average of only about 15% fewer miles than adults that are not van drivers. Van users are relatively heavy users of ‘Other Private Transport’, which includes travel in lorries, but are light users of public transport services.
Table 3.1: Average annual mileage by various forms of travel, van drivers versus all other adults (2008/10)
Van drivers All other adults
Van driving 8,560 -
Car driving 3,485 4,081
Other private transport 401 103
National Rail 204 588
Motorcycle 102 42
Walking 85 188
Bicycle 41 48
Bus 28 402
Taxi/Minicab 22 60
3.12 Using the ‘before’ and ‘after’ odometer readings to estimate driving mileage means that, unlike the diary data, we cannot know the reasons why vans are used (the journey purposes) or when the vans are driven. Figure 3.5 looks at the journey-purpose distribution of vans driving mileage using the diary data, and how it has trended over time. The NTS data show a sharp downward trend in van use for Business purposes, a somewhat less-sharp decreasing trend in Commuting, and a slowly increasing trend in personal van use. Great caution is called for in interpreting this result as it is based on the NTS’ diary data which appears to be becoming less reliable over time, and there is no other more-reliable data source available with which to compare these time trends.

31
INDEPENDENT TRANSPORT COMMISSION
Figure 3.5: Average annual van driving mileage per person by journey purpose from NTS diary data, 2002-2010
0
10
20
30
40
50
60
70
80
90
100
2001 2002 2003 2004 2005 2006 2007 2008 2009 2010 2011
Commuting
Business
All other journey purposes
What is known about when are vans used? The National Travel Survey can provide a breakdown of van use by day-of-the-week and hour-of-the-day, but this is only part – and a possibly misleading part – of the picture because the van activity that is not recorded in the NTS (e.g. deliveries) is likely to be concentrated at particular times.
It turns out, however, that the Road Traffic Estimates also cannot provide a reliable estimate of how van traffic is distributed over time (day-of-the-week and hour-of-the-day).
The RTEs come from combining two sources of traffic-count information: manual traffic counts by professional traffic counting staff and automatic traffic counts (ATCs) that are recorded continuously at a fixed network of counting stations.
Whilst the automatic counts record 24/7/365, the manual counts are only performed from 7:00 AM to 7:00 PM on 110 weekdays of the year between March and October (the ‘on-hours’). So, no information from the manual traffic counts is available from 7:00 PM to 7:00 AM, at weekends, and on weekdays outside of the March to October window (the ‘off-hours’).
The ATCs record van traffic at these ‘off-hours’ times, but relative to the manual counts (which are believed to be more reliable) the ATCs have difficulty distinguishing vans from other types of traffic. The most recent study (c. 2002) by DfT of this issue found that 31% and 23% of vans were being classified as cars and 2-axle-rigid HGVs respectively, and that 4% and 46% of cars and 2-axle-rigid HGVs, respectively, were being mis-classified as vans.
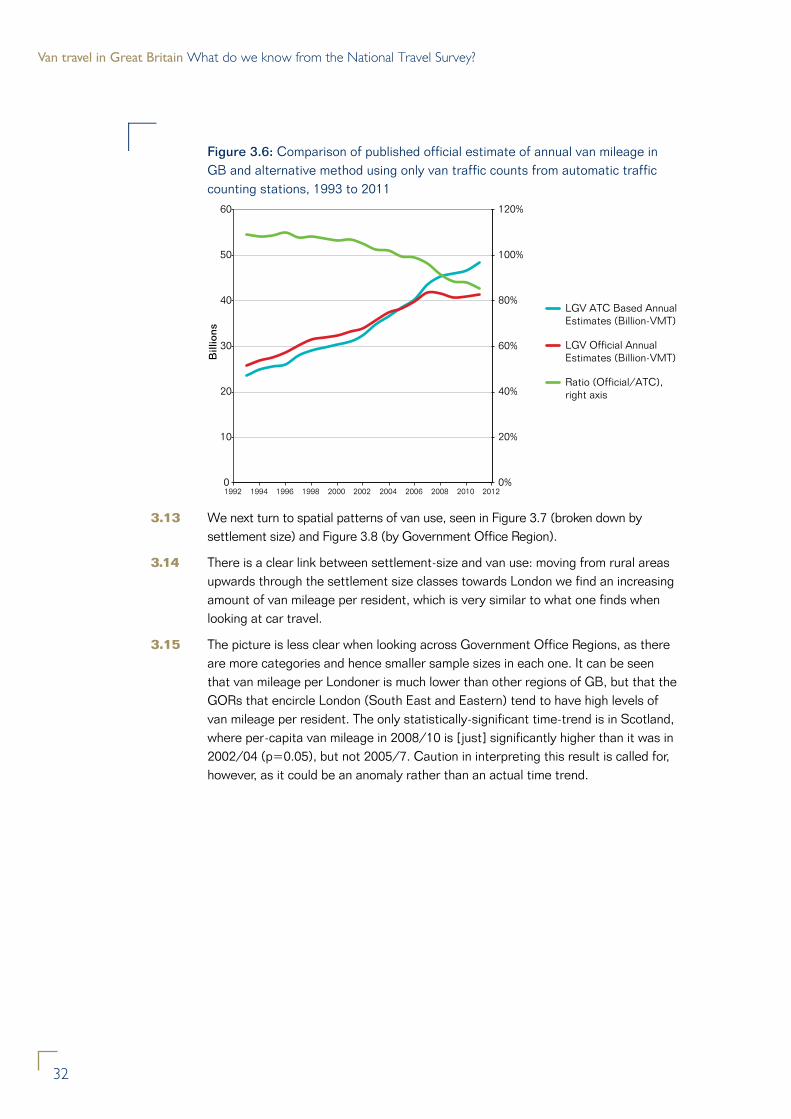
What is more, the ATCs seem to have become worse at identifying vans over time. Figure 3.6 shows that if one were to rely on the ATCs to estimate van traffic their estimated growth rate would be higher than the official estimates of van traffic, which are based principally on the level of van traffic recorded in the manual counts (and make an assumption, which cannot be tested, that the proportion of van traffic that is taking place in ‘off-hours’ is not changing).
What this means is that no one can know with any certainty how much van traffic takes place in the ‘off-hours’. According to the ATC data, in 2010 34% of van mileage took place either on weekends or overnight on weekdays when no manual counts are performed (leaving aside the issue that counting does not take place between November and February). To remedy this would be resource-intensive however, either involving a change of the technology used by the ATCs, or changes in when the manual traffic-counting teams are working.
Also, no one has yet calculated the hour-by-hour distribution of van traffic (and how it has changed over time) even during the ‘on-hours’. This analysis can however be done using the manual traffic count data that exist, and would be a logical step for strengthening the evidence base regarding the growth in van traffic.
Van travel in Great Britain What do we know from the National Travel Survey?
32
Figure 3.6: Comparison of published official estimate of annual van mileage in GB and alternative method using only van traffic counts from automatic traffic counting stations, 1993 to 2011
0%
20%
40%
60%
80%
100%
120%
0
10
20
30
40
50
60
1992 1994 1996 1998 2000 2002 2004 2006 2008 2010 2012
Bill
ions
LGV ATC Based Annual Estimates (Billion-VMT)
LGV Official Annual Estimates (Billion-VMT)
Ratio (Official/ATC), right axis
3.13 We next turn to spatial patterns of van use, seen in Figure 3.7 (broken down by settlement size) and Figure 3.8 (by Government Office Region).
3.14 There is a clear link between settlement-size and van use: moving from rural areas upwards through the settlement size classes towards London we find an increasing amount of van mileage per resident, which is very similar to what one finds when looking at car travel.
3.15 The picture is less clear when looking across Government Office Regions, as there are more categories and hence smaller sample sizes in each one. It can be seen that van mileage per Londoner is much lower than other regions of GB, but that the GORs that encircle London (South East and Eastern) tend to have high levels of van mileage per resident. The only statistically-significant time-trend is in Scotland, where per-capita van mileage in 2008/10 is [just] significantly higher than it was in 2002/04 (p=0.05), but not 2005/7. Caution in interpreting this result is called for, however, as it could be an anomaly rather than an actual time trend.

33
INDEPENDENT TRANSPORT COMMISSION
Figure 3.7: Average annual van mileage per resident by settlement size, 2002-2010.
0
100
200
300
400
500
600
Rural Urban over 3K to 25K pop.
Urban over 25K to 250K pop.
Other urban over 250K pop.
Metropolitan built-up areas
London Boroughs
2002/4 2005/7 2008/10
Figure 3.8: Average annual van mileage per resident by Government Office Region, 2002-2010. By decreasing average van mileage averaged over 2002-2010.
0
100
200
300
400
500
Eastern SouthEast
SouthWest
East Midlands
West Midlands
Wales Scotland Yorkshire & Humberside
NW & Merseyside
NorthEast
Greater London
2002/4 2005/7 2008/10

Van travel in Great Britain What do we know from the National Travel Survey?
34
Privately-owned and company-owned vansEmployers can allow their staff to use a company-owned van for their personal use, which in principle is a taxable benefit and the member of staff is required to claim it as a benefit-in-kind on their tax return (and pay tax on the benefit). There was a major change in tax policy relating to ‘company vans’ that was announced in 2005 and took effect in 2008. Up until 2008, an employee receiving the personal use of a company van as a benefit had to treat it as having earned about £500 of income. From 2008, however, this charge increased to £3,000, and another £500 applied if the employer also paid for the staff member’s fuel for personal use.HMRC tracks the number of taxpayers that claim a company van on their tax returns, and this can be seen in Figure 3.9 (the lowest [blue] line on the chart). Two points are of interest here. First, the number of ‘company vans’ claimed as benefit-in-kind peaked in the 2004/5 tax year and then fell year on year until levelling off in 2007/8; in other words all of the decline took place over several years before the policy change took effect (for reasons that HMRC does not fully understand). And second, grossing-up the NTS sample to the GB population level leads to a calculation of company-owned vans that are continuously available for personal use that is much larger than the number claimed on tax returns. The NTS does not show a decline in these vans until 2010. It is not clear why the two data series do not align; one possible explanation is that a large number of people no longer claim a company-owned van on their tax return but de facto still have access to one for their personal travel, and report this in their NTS interview. It is worth noting that the two topmost lines in Figure 3.9 show the number of vans in the DVLA vehicle-licencing database to individual persons and companies. The grey line shows that from 2008 there was a decrease in the number of company-owned vans, but the orange line shows that there was no clear break in the upward trend in privately-owned vans.Finally, it can be seen in Figure 3.9 that the number of privately-owned vans recorded by the NTS (and grossed up to the GB population level) is consistently lower by 20-30% than the number of privately-owned vans according to DVLA. But, the time trend is similar: both show a strong upward trend in the period 2004 to 2010. Thus the NTS seems to be tracking the growing prevalence of privately-owned vans reasonably well. By contrast, the NTS only captured 61% of company-owned vans in 2004 (this comes from summing the number of company-owned vans that are kept overnight by respondents for personal use plus the number of respondents that drove vans that are not available for their continuous personal use). This is not surprising because a large proportion of company-owned vans will not be available for continuous private use, and also not be used only for the types of travel that are recorded in the NTS diary, so will be completely missed by the survey. This rate fell from 61% in 2004 to 45% in 2010, however. This is consistent with the growth in company-owned vans taking place in vans that are never meant to be used for personal travel, though since both the NTS and HMRC datasets may be subject to serious under-reporting we cannot know for sure.
Figure 3.9: Number of vans by type of ownership (company or private individual)Vans registered to private owners in DVLA vehicle licencing database
Vans registered to companies in DVLA vehicle licencing database
Privately-owned vans in NTS diary sample using DVLA classes (and NTS if missing)
Implied number of compa-ny-owned vans in NTS diary sample
Company-owned vans continuously available for private use in NTS sample using DVLA classes (and NTS if missing)
People in NTS sample that drove a van that is not continuously available for their private use -
200,000
400,000
600,000
800,000
1,000,000
1,200,000
1,400,000
1,600,000
1,800,000
1994 1996 1998 2000 2002 2004 2006 2008 2010 2012

35
INDEPENDENT TRANSPORT COMMISSION
Conclusions and Summary of Key Findings
3.16 This Section established the patterns in per-capita private-van driving mileage shown by the NTS, when cross-tabulated with a set of spatial and socio-economic indicators. Vans use has, not surprisingly, a quite distinct profile.
• Van drivers are overwhelmingly male
• Van drivers tend to be middle aged (30-60 years)
• Self-employed non-professionals have the highest rate of van-use.
• Van mileage per capita is lowest in the biggest cities and highest in rural areas.
• Unlike car use, van use does not increase straight across the income scale, with people reporting the highest incomes showing less per-capita van driving than those on more moderate incomes. This last point has important implications for how the relationship between economic growth and van activity is modelled.
3.17 For all these results, it must be borne in mind that the NTS does not attempt to track the activity of purely-commercial vans, such as deliveries, so this analysis does not consider patterns in how they are used.

Van travel in Great Britain What do we know from the National Travel Survey?
36
4. Recommendations
4.1 This study looked at the National Travel Survey’s tracking of van activity, specifically at its previously unexplained downward time-trend in estimated light-van mileage. We concluded that there are two principal explanations for the unexpected decline in the NTS estimate of van mileage.
4.2 First, vehicles that are classified in DVLA’s vehicle-licencing database as light vans are increasingly not being reported as such by NTS respondents. Second, an increasing amount of the travel in vans that takes place during NTS respondents’ diary week is going unreported in their diary, but is identifiable by comparing the ‘before’ and ‘after’ odometer readings from vans kept by NTS-responding households.
4.3 Whilst we have identified this trend of increased under-reporting in the diary instrument, determining what has caused it remains a matter for speculation. It may be that it is linked with changes in taxation policy, but we cannot say with any certainty on the basis of this analysis.
4.4 The encouraging finding is that after correcting for these two effects, the time-trends in the NTS’ estimates of van ownership and use are generally in line with both what other datasets show and understanding of how van activity has trended. It suggests a moderate growth in the types of van travel that the NTS does monitor, and faster growth in use of vans for exclusively commercial purposes.
4.5 This means that the NTS data appears to be a viable data resource to support further research into the determinants of the growth in van activity. In its present form (the structure that has remained more or less consistent since the last major update in 2002), the NTS can support econometric models of privately-owned van ownership, and models of the mileage of both privately-owned vans and vans that are company-owned-but-continuously-available-for-personal-use. The increased under-reporting of van mileage in the NTS’ travel diaries means that past years’ NTS data is not, however, appropriate for modelling certain aspects of van use, such as the distribution of van use by time-of-day and for different journey purposes. Further, we do not know unambiguously from a van’s accumulation of mileage during its NTS diary week how much it was driven by its main driver versus other people. The NTS also cannot provide the information required to model the prevalence or driving mileage of vans that are used exclusively for commercial purposes.
4.6 On the basis of this analysis, we recommend the following:
Recommendation #1: We recommend an in-depth econometric study of the growing rate of
private van ownership and use, as part of its line of enquiry into light van ‘market saturation’.
4.7 An econometric study of privately-owned vans can be supported by the historic National Travel Survey data from 2002 through 2010, using disaggregate analytical techniques which in general are preferred to aggregate methods whenever it is feasible to use them. This prospective study would draw on the economic and socio-

37
INDEPENDENT TRANSPORT COMMISSION
demographic information the NTS collects about each respondent as explanatory variables, with van ownership and van-mileage (based on the before/after odometer readings) as the modelled quantities.
4.8 Such a study would provide quantitative evidence of the determinants of the rapid increase of privately-owned vans in the 2000s, and identify whether these determinants suggest any concavity (i.e. saturation) in future-year van traffic forecasts.
Recommendation #2: We recommend further study to identify the causes of increasing prevalence of
mis-classification of vans under-reporting in vans mileage in NTS diaries, and whether they can be addressed.
4.9 The increasing amount of under-reporting in van use in the NTS is cause for concern, and whilst this study identified this trend we do not know why it has happened.
4.10 It is urgently necessary to diagnose what lies behind this trend; depending on what is causing it it could be impacting on other outputs from the NTS. It may be limited to the vans-usage time series, or it could be affecting the NTS’ tracking of use of other modes of travel as well. Diagnostic techniques exist that would be well-suited for this analysis, such as those used to analyse non-response bias in the NTS.
4.11 It is hoped that the findings presented here can start this process; other researchers reading this study (particularly domain experts on logistics and freight-movement practices) may have insights into the causes of increased under-reporting in NTS diaries.
Recommendation #3: We recommend that the National Travel Survey gather limited information
about the types of commercial travel that have historically been excluded.
4.12 The NTS is a unique resource in that it has a rigorous, nationally-representative sampling protocol and takes place continuously, and will do so regardless of whether any revisions are made to improve its tracking of van activity. It is one of the Department’s major information assets, and observes approximately 600 light van users annually (See Table 4.1). Its main weakness for tracking van activity is that it is designed to capture personal travel. It does collect information on certain types of commercial travel but much of the travel that it does not record (e.g. parcel deliveries) directly relate to the ways vans are used.

Van travel in Great Britain What do we know from the National Travel Survey?
38
Table 4.1: Annual sample sizes (2002 to 2010) of vans observed in the National Travel Survey, with vans defined by DVLA vehicle-licencing database (Table 1 shows vans as defined by NTS respondents).
Number of ‘main drivers’ (a person that drives a specific light van more than anyone else drives it) of ‘household’ vans (must be privately-owned or continuously-available for private use) in NTS sample (unweighted, diary sample)
Number of people in NTS diary sample that drove a light van during their diary week (including both ‘main drivers’ of light vans kept for private use and people that drove vans that are not continuously available for their private use.
2002 391 502
2003 456 606
2004 448 563
2005 479 610
2006 515 625
2007 543 645
2008 465 578
2009 540 631
2010 520 593
4.13 Therefore enhancing the NTS’ tracking of van activity is a rather cost-effective means to collect such data, relative to bespoke van-activity surveys (which have their own strengths and may be necessary for other reasons).
4.14 There are very low set-up costs (e.g. the new NTS questions would need to be piloted, which is not cost-free) but no major ongoing costs beyond the already-programmed costs to administer the NTS. The trade-off to be considered is not principally monetary, but rather that the response burden on NTS respondents cannot be expanded indefinitely. Therefore the additional response burden from collecting more information about commercial travel should either be de minimis, or must replace other lower-priority questioning that is now part of the NTS. There are a number of options for improving the NTS’ tracking of van use, with correspondingly different implications in terms of respondent burden.
4.15 The gold standard in terms of travel/activity data are those that come from travel diaries, where people record each of their journeys and its details (start time, end time, distance, method of travel, purpose, party size, etc.) Revising the NTS’ diary instrument to capture commercial travel is fraught with complications, however, and would introduce a step-change in the response-burden (and therefore likely a drop in the response rate) affecting the precise group that is of interest. The last time that major revisions were made to the travel diary (in 2007) there were unanticipated discontinuities in the time series and subsequently further revisions to the diary instrument were required.
4.16. Rather than make changes to the diary instrument, we suggest that several questions be added to the interview part of the NTS instrument. At present, the NTS asks questions about driving mileage that is not eligible for recording in its travel diaries where the VEHICLE is the unit of analysis. The questions ask whether any vehicles

39
INDEPENDENT TRANSPORT COMMISSION
10 This is in the section of the pick-up NTS interview that begins with question ‘InElm1’.
11 Reproduced from: Department for Transport (undated) Manual traffic data collection for the GB Road Traffic Survey: Vehicle classification guidance.
kept by the responding household were used (and if so for how much mileage) for purposes that were not recorded in the household’s travel diaries.10
4.17 We recommend that similar questions be asked at the PERSON level, in addition to the VEHICLE level. One way to do this would be to ask whether any adult household member drove vehicles for several of the main reasons that are not tracked in the travel diary (including delivering/collecting goods), as well as a catch-all question for any other mileage driven for other reasons. If the respondent indicates that they did drive for a reason that is not reported in the diary, the follow-up questions would be: 1) how much mileage did they drive for this purpose, 2) what type of vehicle did they drive, and 3) were there any passengers. A possible treatment for the latter question would be to show the respondent a showcard (as is done in other parts of the NTS interview) with drawings of several representative vehicle types and ask them to indicate which most closely matches the type that they drove. In order to generate data that are as consistent as possible to the Road traffic Estimates, the drawings should match the guidance given to the staff that perform the manual traffic counts (see Figure 4.1 for an example).
Figure 4.1: Examples of schematic drawings of vehicle types used to instruct manual traffic counting staff how to distinguish between light vans and heavy goods vehicles.11
Light and Heavy Goods Vehicles: axles and general appearance
Category
LightGoodsVehicles
LGV 2 axles
HeavyGoodsVehicles
HVGR2 2 axles
Number of axles Image
4.18 The proposal outlined here would provide a self-reported estimate, for each NTS-responding adult, of how much mileage they drove during their NTS week (both diary-eligible driving and not-diary-eligible driving), broken down by vehicle-type and broad classes of journey purpose.
4.19 Generating an estimate of all driving mileage would be a similar data point to one collected in the USA’s National Household Travel Survey, which is comparable in many ways to the British NTS.

Van travel in Great Britain What do we know from the National Travel Survey?
40
4.20 The data from these added questions, combined with the rest of the information from their NTS interview, is precisely the evidence required to model van-driving mileage (as well as other vehicle types) at a disaggregate level. It would also allow the NTS to provide, for the first time, an estimate of all motorised travel by NTS respondents (and hence by Britons in aggregate).
4.21 This proposal would add a relatively low amount of respondent burden to the NTS, but conversely it would collect no data on certain important aspects of van use. This method would, for instance, provide no further information on the day-of-week or time-of-day pattern of when vans are driven, or van occupancy (number of passengers). Until the cause of the trend of increased van travel under-reporting in NTS diaries is identified, we also cannot have confidence in the breakdown of van use by purpose. Such information is very relevant and could in principle be collected, but would involve a higher degree of respondent burden and therefore the business case for making such changes must meet a higher threshold.
4.22 Decisions regarding changes to the NTS protocol must take account of the ways that the data will be used, and this can only follow a deliberative process of what is required in the enhancement of the Department’s van-traffic forecasting methods (see next recommendation). Therefore, rather than move quickly to make changes to the NTS instrument that could take effect for the calendar-year 2014 edition, we recommend that the target date for revisions be set to January 2015. This provides adequate time for a considered decision of what will be required of the NTS, from which will follow the specific revisions to the protocol to deliver the data resources that are needed. The 2008 Vans Activity Baseline Survey is instructive – it is unlikely that the level of detail in this survey can be gathered via the NTS without adversely affecting other uses of the NTS.
Recommendation #4: We recommend that a process be set in motion to scope the enhancements to
the Department’s van-traffic forecasting procedures.
4.23 Extending the Department’s van-traffic forecasting capability will mean taking decisions that will set the direction for a number of years. This set of decisions should not be taken lightly.
4.24 We recommend that consultations begin regarding enhancements to the National Transport Model’s vans-traffic forecasting methods. This should involve engagement with van-intensive industries as well as academics and transport-modelling practitioners both within and external to the Department.
4.25 These consultations might be undertaken as part of the Department’s new initiative on Openness and Transparency in National Transport Modelling (inaugurated in spring 2013).
4.26 The consultations might encompass, for instance, a call for evidence, commissioned papers, expert workshops etc. Building on the present study of the suitability of NTS data, it should include a wider study that investigates the properties of other possible sources of evidence to support the modelling tasks.

41
INDEPENDENT TRANSPORT COMMISSION
Recommendation #5: We recommend that the professional traffic counting teams be instructed in
future to differentiate between light goods vehicles and minibuses/people carriers, as these types of vehicles have quite different usage profiles.
4.27 This would provide a further improvement in the ‘data infrastructure’, which would facilitate future studies of their distinct traffic patterns and time trends and also facilitate more direct comparisons between the Department’s various datasets.
Recommendation #6: We recommend that historic manual traffic counts undertaken by the
Department for Transport be analysed to assess the degree of stability or change in time-of-day profiles of van traffic.
4.28 Two data sources exist that can feasibly be used to prepare time-of-day profiles of van mileage – the manual and automatic traffic counts (ATC) that the DfT collect to calculate the Road Traffic Estimates.
4.29 The ATCs have better temporal coverage (24/7/365) but poorer spatial coverage of the road network. Their major weakness though is that they are poor at identifying whether a passing vehicle is a van or not.
4.30 To the authors’ knowledge, no one has yet analysed the trends from the early 2000s up to present in the time-of-day profile of van mileage on the basis of the manual counts, which are thought to have less classification error than the ATCs.
4.31 Such an analysis should be undertaken; it is straightforward and it does not have a heavy resource requirement. To understand the growing overall levels of van use it will be very useful to have as reliable as possible (i.e. from the manual counts rather than the ATCs) of way the hour-by-hour distribution of van traffic has changed.
4.32 There is a broader question of whether to do any manual traffic counts outside of the 7:00 AM to 7:00 PM time window on the 110 neutral weekdays per year, given the imprecision in the Automatic Traffic Counts. This would however require a major shift or new allocation of resources, and has implications that go well beyond the phenomenon of growing van traffic. We note this issue here, but the breadth of the trade-offs associated with changing the methods used to generate the Road Traffic Estimates are outside of the scope of this study. This study considered only a small subset of the relevant issues this would entail.

Van travel in Great Britain What do we know from the National Travel Survey?
42
5. Conclusions
5.1 This study is part of a wider workstream sponsored by the ITC that is investigating contemporary mobility patterns and how they are changing. Previous studies focused on trends in car and rail activity, exploring why [unexpectedly] car traffic has been stagnant in the 2000s whilst rail usage has grown quickly. Satisfactory explanations to such questions are important, because forecasts of future traffic patterns are a key input to policymaking and infrastructure investment strategies.
5.2 The present study investigated divergences between several of the Department for Transport’s main datasets that record van activity. We found that the downward time trend in van traffic shown in the National Travel Survey is a data artefact that arises from increasing mis-classification of vans as other vehicle types and increasing under-reporting of van driving mileage in the travel diaries of van-owning NTS respondents.
5.3 We did not diagnose why these trends are happening. However, answering this question is a vitally important item for the future research agenda. Data fidelity is critical in allowing policymakers and analysts within the DfT and outside to trust that patterns and time-trends that underpin traffic forecasts are real.
5.4 Using the NTS to explore relationships between van activity and spatial/socio-economic factors, we found a number of distinctive patterns. Van driving mileage per capita is highest amongst self-employed non-professionals (i.e. tradesmen) and in rural areas. Vans are overwhelmingly driven by men, and their drivers tend to be in middle age. And, while car use increases from the bottom of the income scale right the way through to the top, van use follows a different pattern. People in the highest-income bands drive cars more than those on middle incomes, but they drive vans less. It will be important to account for these relationships when modelling future growth in van traffic.
5.5 On the basis of these findings, we make the following recommendations:
Recommendation #1: An in-depth econometric study of the growing rate of private van ownership and use
Recommendation #2: Further study to identify the causes of increasing prevalence of mis-classification of vans
and under-reporting in vans mileage in NTS diaries, and whether they can be addressed
Recommendation #3: The National Travel Survey gather limited information about the types of commercial
travel that have historically been excluded
Recommendation #4: A process be set in motion to scope the enhancements to the Department’s van-
traffic forecasting procedures
Recommendation #5: Professional traffic counting teams be instructed in future to differentiate between
light goods vehicles and minibuses/people carriers

43
INDEPENDENT TRANSPORT COMMISSION
Recommendation #6: Historic manual traffic counts undertaken by the Department for Transport be analysed
to assess the degree of stability or change in time-of-day profiles of van traffic
5.6 Our hope is that both the findings of this study and the ensuing recommendations will help to strengthen the ‘data infrastructure’ regarding this poorly-understood but increasingly important form of transport.
Dr Scott Le Vine [ [email protected] ] Mr Jianlin Luan [ [email protected] ] Professor John Polak [ [email protected] ]
On behalf of the Independent Transport Commission

Van travel in Great Britain What do we know from the National Travel Survey?
44
Appendix
Make/model Vehicle Codes
The list below contains the make/model codes of vehicles in the National Travel Diary’s dataset that were classified by matching the number plate with the DVLA’s vehicle-licencing database, but not by the vehicle’s owner, as light vans:
In cases where multiple vehicles with same make/model code are observed this is noted with the number of vehicles in brackets
SWB/MWB/LWB are shorthand for short/medium/long wheelbase respectively
BEDFORD UNKNOWN
CHEVROLET GMC UNKNOWN
CITROEN C 15D
CITROEN RELAY 33 HDI 100 MWB
FIAT DUCATO
FIAT DUCATO 14 DIES TURBO
FIAT DUCATO 35 130 M-JET LWB
FIAT DUCATO MAXI TD MWB
FIAT UNKNOWN (7)
FORD UNKNOWN
FORD TRAN 115 T330M TREND FWD
FORD TRAN CONNECT T230 LX TDCI
FORD TRANSIT 100 SWB
FORD TRANSIT 190 LWB (3)
FORD TRANSIT 280 SWB TD
FORD TRANSIT 300 SWB
FORD TRANSIT 350
FORD TRANSIT 350 LWB (3)
FORD TRANSIT 350 MWB TD
FORD TRANSIT 80 SWB (5)
FORD TRANSIT 85 T260S TREND FWD
FORD TRANSIT 85 T280S FWD
ISUZU PICK-UP 4X4 TD LWB
IVECO FORD TURBODAILY 59.12
IVECO UNKNOWN
LAND ROVER UNKNOWN
LDV 200 PILOT DIESEL
LDV 400 CONVOY D LWB
LDV MAXUS 3.5T 120 LWB
MERCEDES SPRINTER 210D MWB
MERCEDES SPRINTER 311 CDI LWB (2)
MERCEDES-BENZ SPRINTER 310 CDI
MERCEDES-BENZ SPRINTER 313 CDI
MITSUBISHI CANTER 35 SWB
MITSUBISHI FUSO CANTER 3C13-34 L
MITSUBISHI L200 2WD DIESEL
MITSUBISHI L200 WARRIOR LWB
NISSAN NAVARA D/C AVENTURA DCI A
NISSAN VANETTE DIESEL
PEUGEOT BOXER 270 MWB HDI
PEUGEOT BOXER 290 LX MWB HDI
PEUGEOT BOXER 290 LX SWB HDI
PEUGEOT BOXER 330 LX MWB HDI
PEUGEOT BOXER 335 MWB
PEUGEOT UNKNOWN
PEUGEOT PARTNER 800 LX HDI
RENAULT KANGOO 665 1.9D
RENAULT MASTER LM35 DCI 100 LWB
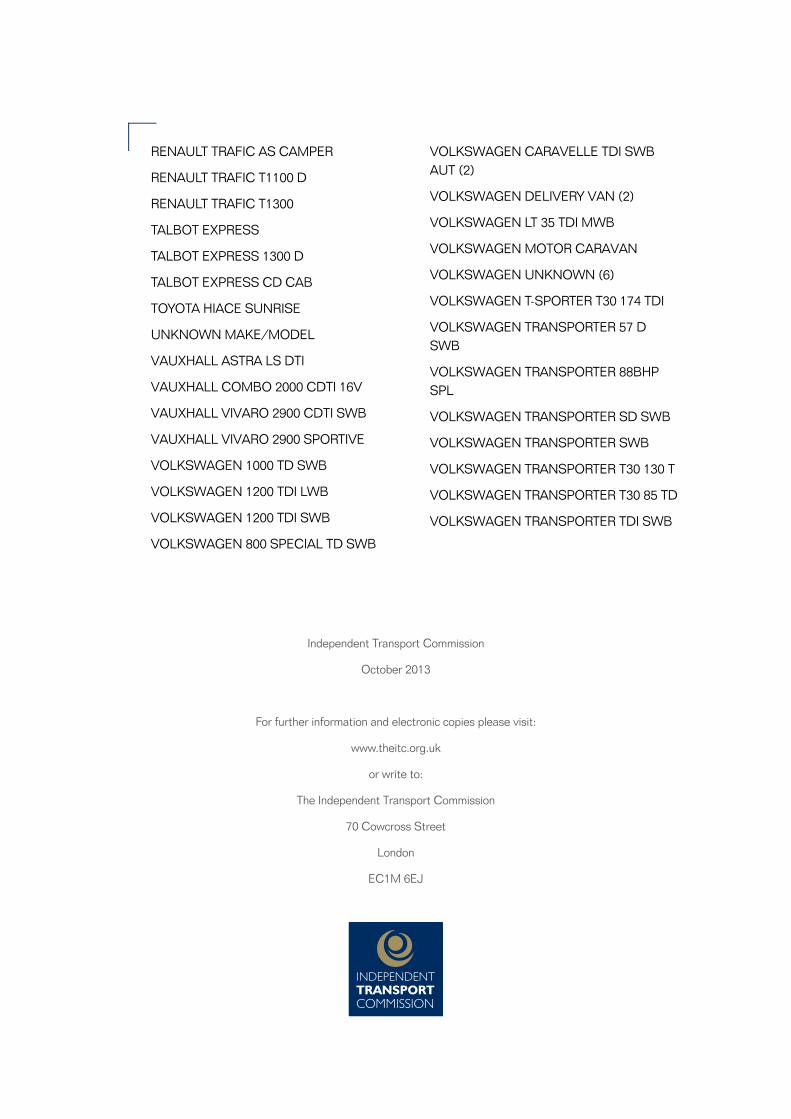
RENAULT TRAFIC AS CAMPER
RENAULT TRAFIC T1100 D
RENAULT TRAFIC T1300
TALBOT EXPRESS
TALBOT EXPRESS 1300 D
TALBOT EXPRESS CD CAB
TOYOTA HIACE SUNRISE
UNKNOWN MAKE/MODEL
VAUXHALL ASTRA LS DTI
VAUXHALL COMBO 2000 CDTI 16V
VAUXHALL VIVARO 2900 CDTI SWB
VAUXHALL VIVARO 2900 SPORTIVE
VOLKSWAGEN 1000 TD SWB
VOLKSWAGEN 1200 TDI LWB
VOLKSWAGEN 1200 TDI SWB
VOLKSWAGEN 800 SPECIAL TD SWB
VOLKSWAGEN CARAVELLE TDI SWB AUT (2)
VOLKSWAGEN DELIVERY VAN (2)
VOLKSWAGEN LT 35 TDI MWB
VOLKSWAGEN MOTOR CARAVAN
VOLKSWAGEN UNKNOWN (6)
VOLKSWAGEN T-SPORTER T30 174 TDI
VOLKSWAGEN TRANSPORTER 57 D SWB
VOLKSWAGEN TRANSPORTER 88BHP SPL
VOLKSWAGEN TRANSPORTER SD SWB
VOLKSWAGEN TRANSPORTER SWB
VOLKSWAGEN TRANSPORTER T30 130 T
VOLKSWAGEN TRANSPORTER T30 85 TD
VOLKSWAGEN TRANSPORTER TDI SWB
Independent Transport Commission
October 2013
For further information and electronic copies please visit:
www.theitc.org.uk
or write to:
The Independent Transport Commission
70 Cowcross Street
London
EC1M 6EJ

Published by the Independent Transport Commission
The Independent Transport Commission (ITC) is one of Britain’s leading research charities with a mission to explore all aspects of transport and land use policy. Through our independent research work and educational events we aim to improve and better inform public policy making. For more information on our current research and activities please see our website: www.theitc.org.uk
reac
hmar
ketin
g.co
.uk
2196
1 10
/13
Independent Transport Commission 70 Cowcross Street London EC1M 6EJ
Tel No: 0207 253 5510 www.theitc.org.uk
Registered Charity No. 1080134 October 2013 © Copyright Independent Transport Commission