Embed Size (px)
Citation preview
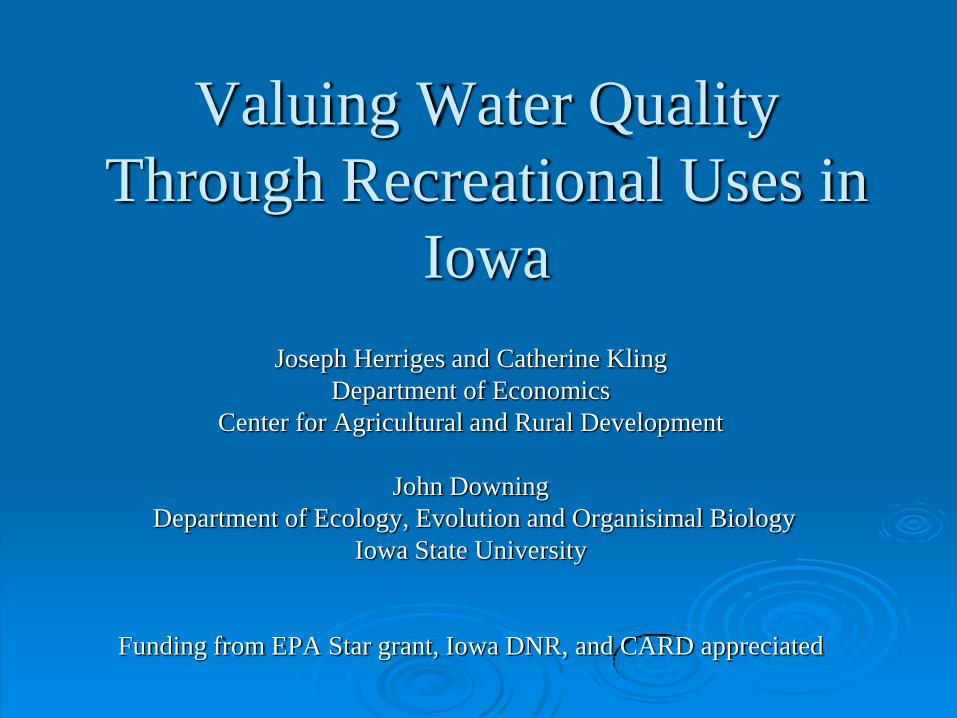
Valuing Water Quality
Through Recreational Uses in
Iowa
Joseph Herriges and Catherine Kling
Department of Economics
Center for Agricultural and Rural Development
John Downing
Department of Ecology, Evolution and Organisimal Biology
Iowa State University
Funding from EPA Star grant, Iowa DNR, and CARD appreciated
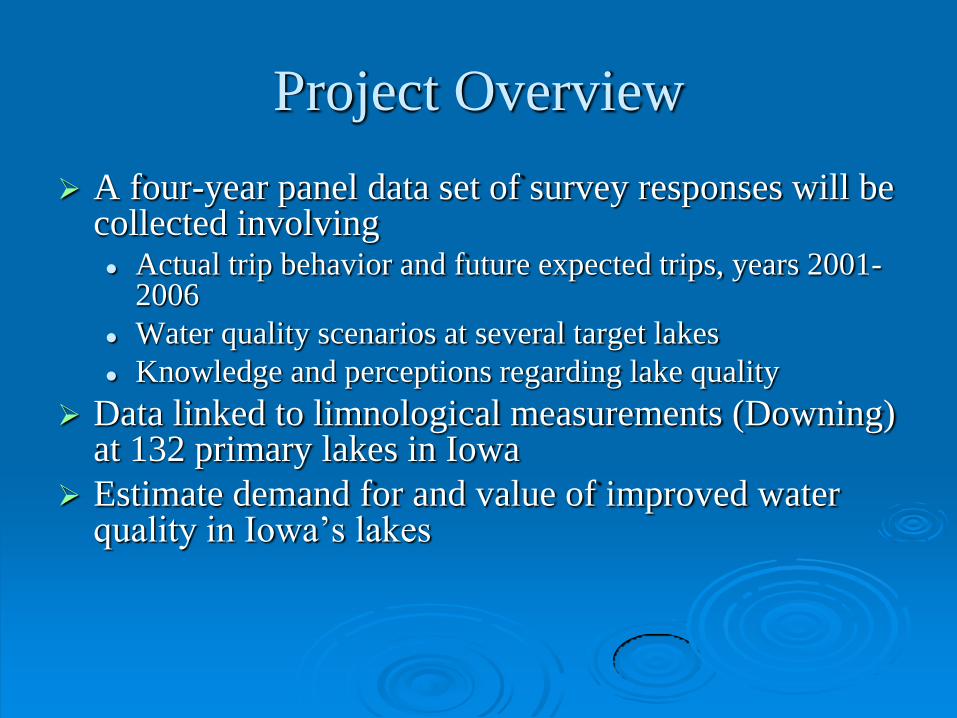
Project Overview
A four-year panel data set of survey responses will be collected involving
Actual trip behavior and future expected trips, years 2001-2006
Water quality scenarios at several target lakes
Knowledge and perceptions regarding lake quality
Data linked to limnological measurements (Downing) at 132 primary lakes in Iowa
Estimate demand for and value of improved water quality in Iowa’s lakes
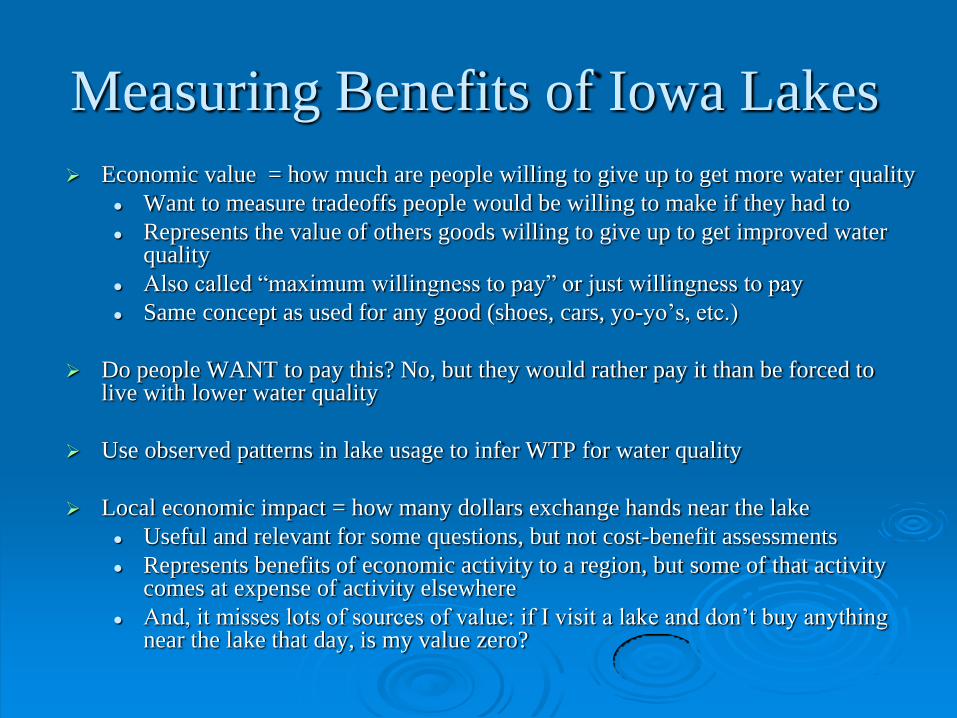
Measuring Benefits of Iowa Lakes
Economic value = how much are people willing to give up to get more water quality
Want to measure tradeoffs people would be willing to make if they had to
Represents the value of others goods willing to give up to get improved water quality
Also called “maximum willingness to pay” or just willingness to pay
Same concept as used for any good (shoes, cars, yo-yo’s, etc.)
Do people WANT to pay this? No, but they would rather pay it than be forced to live with lower water quality
Use observed patterns in lake usage to infer WTP for water quality
Local economic impact = how many dollars exchange hands near the lake
Useful and relevant for some questions, but not cost-benefit assessments
Represents benefits of economic activity to a region, but some of that activity comes at expense of activity elsewhere
And, it misses lots of sources of value: if I visit a lake and don’t buy anything near the lake that day, is my value zero?
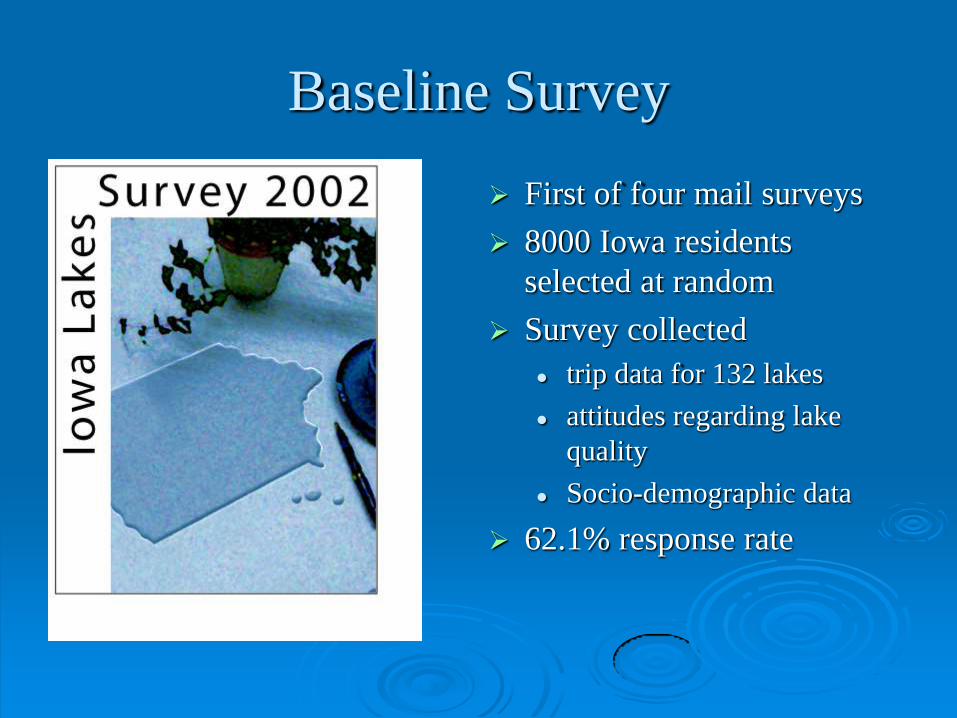
Baseline Survey
First of four mail surveys
8000 Iowa residents
selected at random
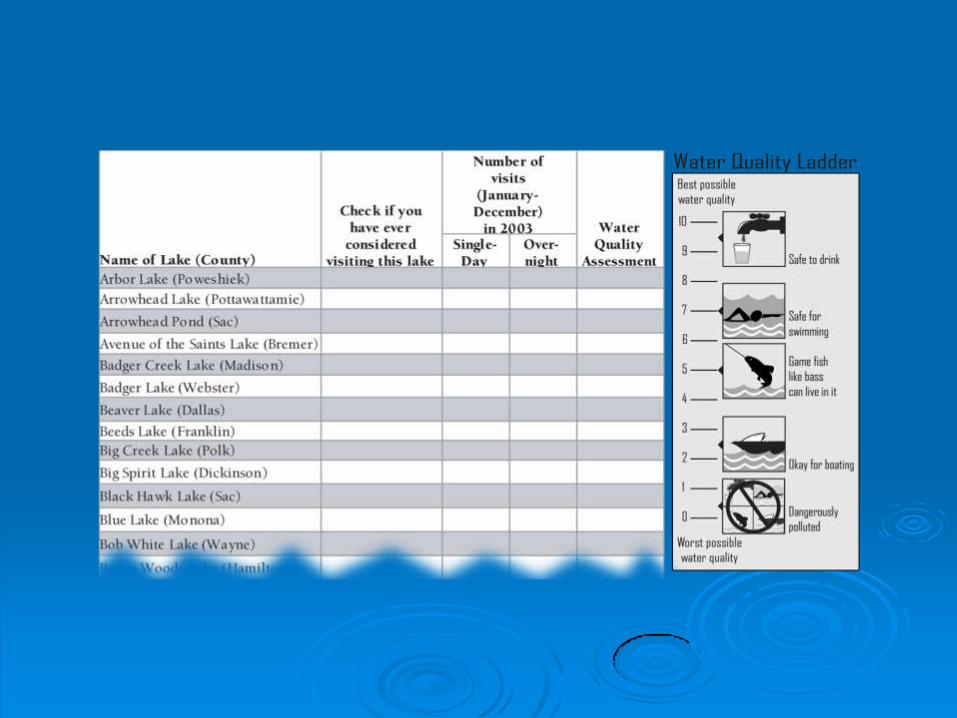
Survey collected
trip data for 132 lakes
attitudes regarding lake
quality
Socio-demographic data
62.1% response rate

Lakes included in Study
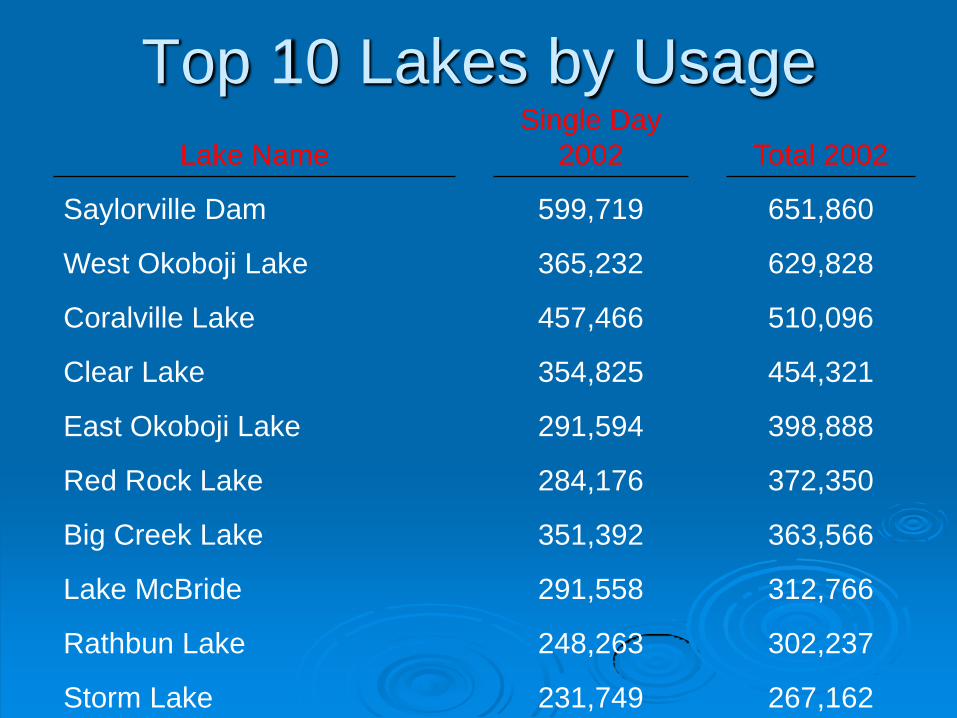
Top 10 Lakes by Usage
Lake Name
Single Day
2002 Total 2002
Saylorville Dam 599,719 651,860
West Okoboji Lake 365,232 629,828
Coralville Lake 457,466 510,096
Clear Lake 354,825 454,321
East Okoboji Lake 291,594 398,888
Red Rock Lake 284,176 372,350
Big Creek Lake 351,392 363,566
Lake McBride 291,558 312,766
Rathbun Lake 248,263 302,237
Storm Lake 231,749 267,162
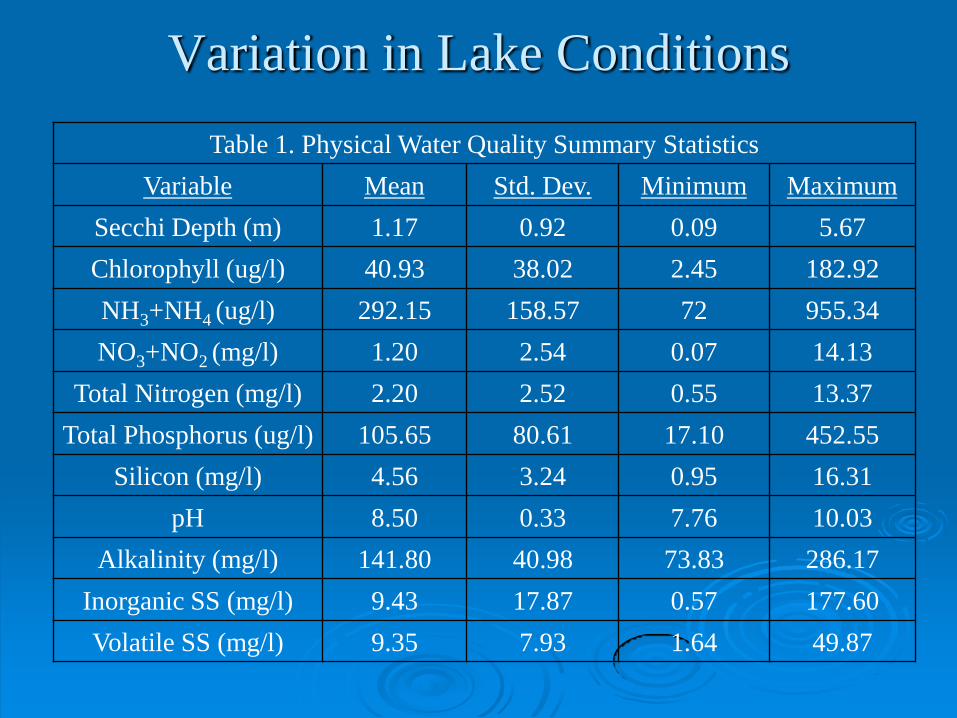
Table 1. Physical Water Quality Summary Statistics
Variable Mean Std. Dev. Minimum Maximum
Secchi Depth (m) 1.17 0.92 0.09 5.67
Chlorophyll (ug/l) 40.93 38.02 2.45 182.92
NH3+NH4 (ug/l) 292.15 158.57 72 955.34
NO3+NO2 (mg/l) 1.20 2.54 0.07 14.13
Total Nitrogen (mg/l) 2.20 2.52 0.55 13.37
Total Phosphorus (ug/l) 105.65 80.61 17.10 452.55
Silicon (mg/l) 4.56 3.24 0.95 16.31
pH 8.50 0.33 7.76 10.03
Alkalinity (mg/l) 141.80 40.98 73.83 286.17
Inorganic SS (mg/l) 9.43 17.87 0.57 177.60
Volatile SS (mg/l) 9.35 7.93 1.64 49.87
Variation in Lake Conditions
0
10
20
30
40
50
60
70
Percen
tage o
f H
ou
seh
old
s
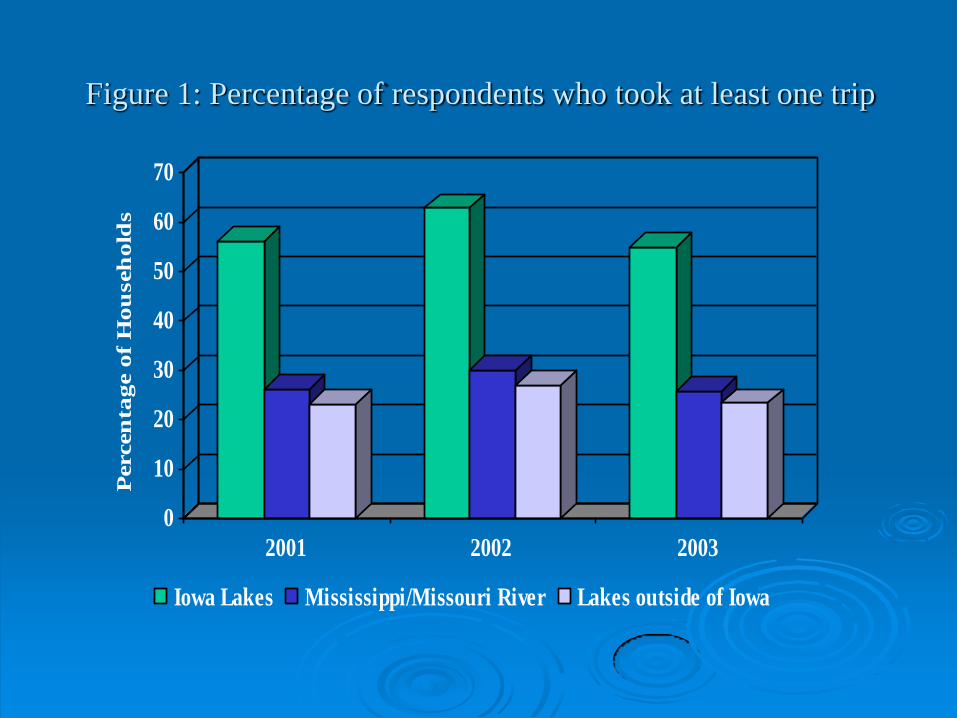
2001 2002 2003
Iowa Lakes Mississippi/Missouri River Lakes outside of Iowa
Figure 1: Percentage of respondents who took at least one trip
0
1
2
3
4
5
6
7
8
9
Av
era
ge N
um
ber o
f T
rip
s
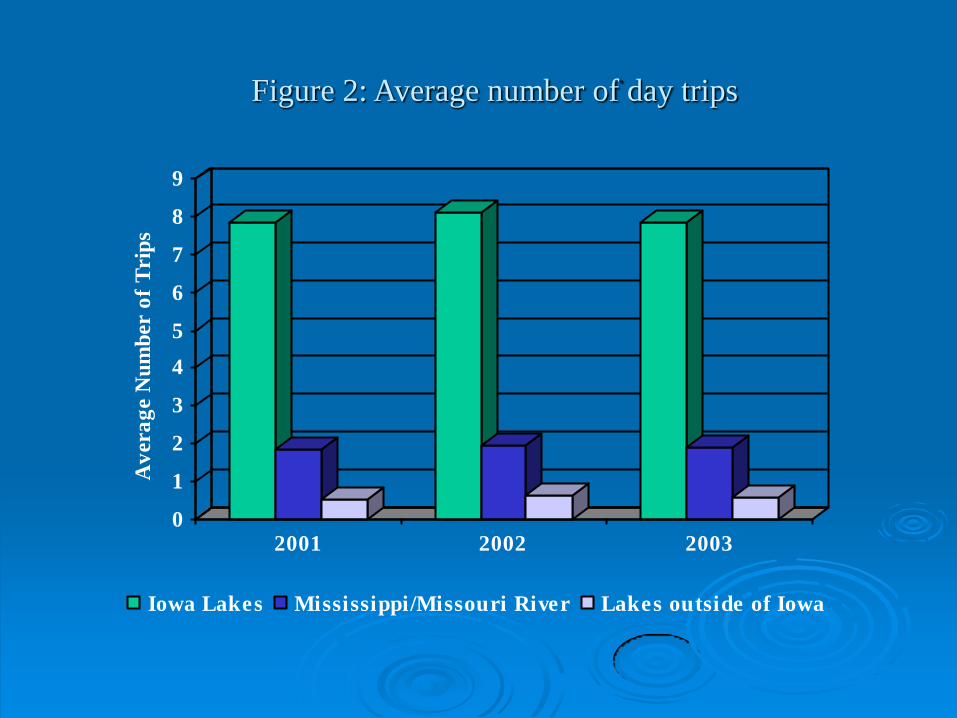
2001 2002 2003
Iowa Lakes Mississippi/Missouri River Lakes outside of Iowa
Figure 2: Average number of day trips
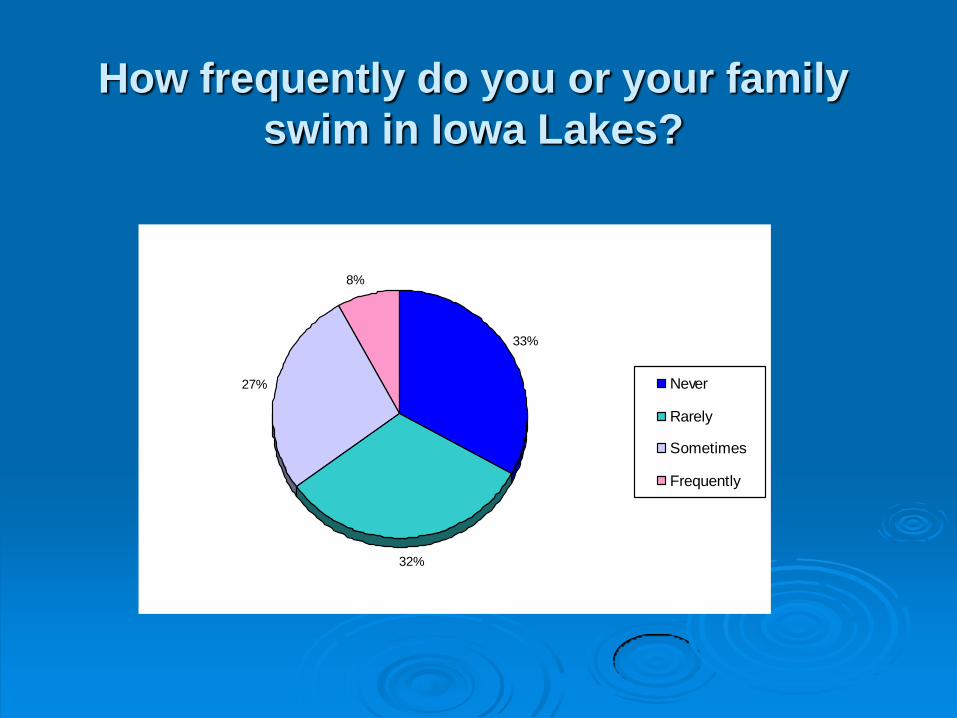
33%
32%
27%
8%
Never
Rarely
Sometimes
Frequently
How frequently do you or your family
swim in Iowa Lakes?

22
3211
18
9
5 3
Proximity
Water Quality
Location of Friends/Relatives
Park Facilities
Activities at the Lake
Activities in the Town
Other
Figure 3: Average allocation of importance points to factors important
in choosing a lake for recreation
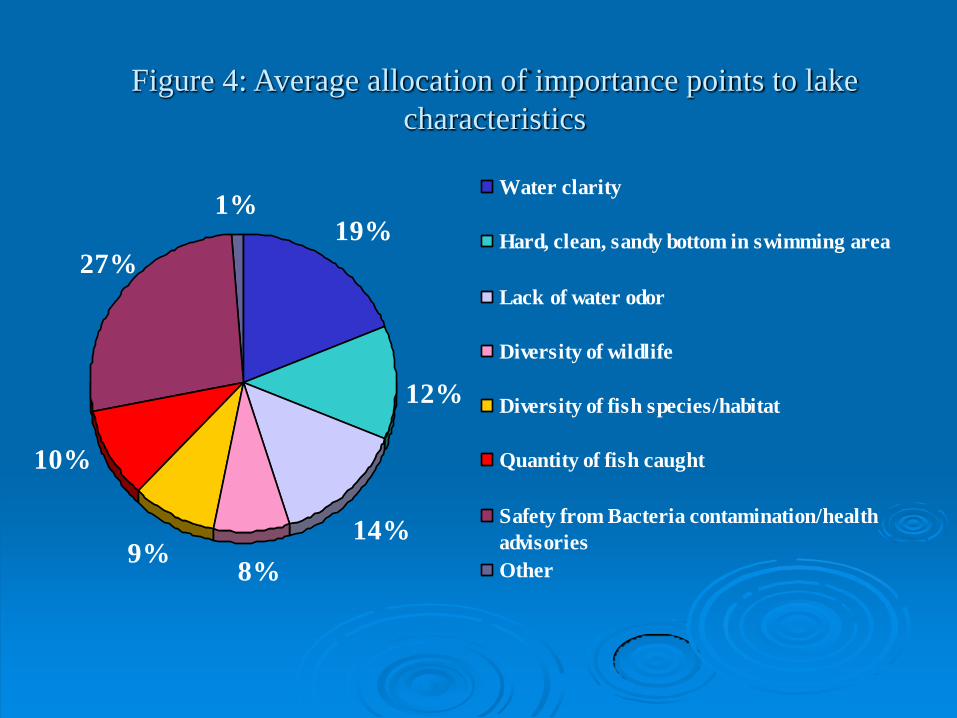
Figure 4: Average allocation of importance points to lake
characteristics
19%
12%
14%
8%9%
1%
10%
27%
Water clarity
Hard, clean, sandy bottom in swimming area
Lack of water odor
Diversity of wildlife
Diversity of fish species/habitat
Quantity of fish caught
Safety from Bacteria contamination/health
advisories
Other
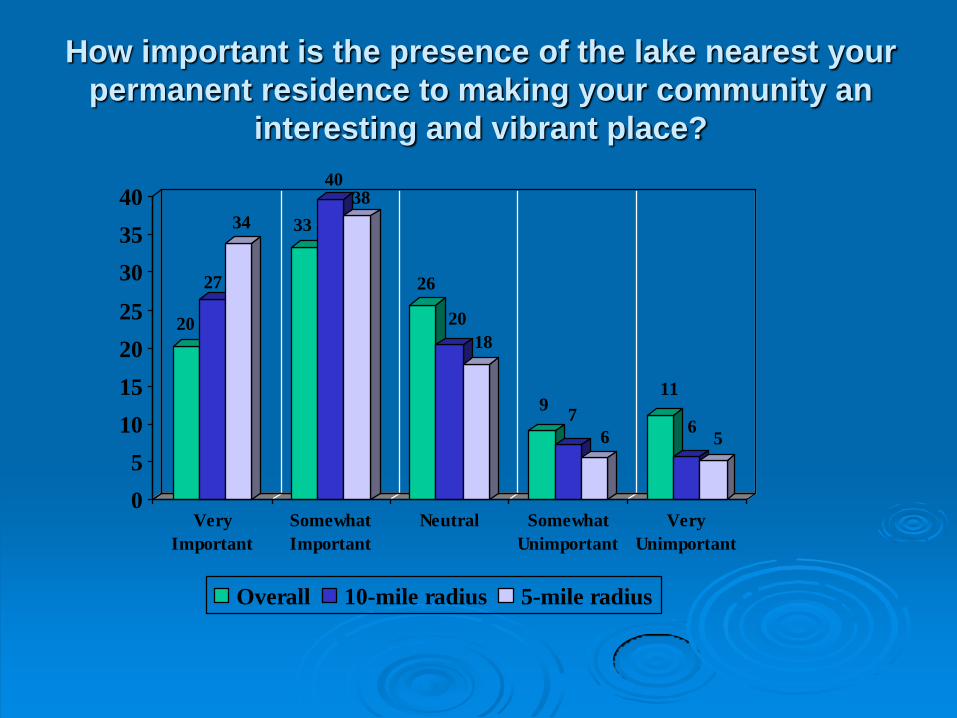
How important is the presence of the lake nearest your
permanent residence to making your community an
interesting and vibrant place?
20
27
34 33
4038
26
20
18
97
6
11
65
0
5
10
15
20
25
30
35
40
Very
Important
Somewhat
Important
Neutral Somewhat
Unimportant
Very
Unimportant
Overall 10-mile radius 5-mile radius

How important is the presence of the lake nearest your
permanent residence to retaining the interest of young
people to remain in your community or in attracting
prospective residents to your area?
17
21
24
30
33 32
27 2625
12 11
9
13
9 9
0
5
10
15
20
25
30
35
Very
Important
Somewhat
Important
Neutral Somewhat
Unimportant
Very
Unimportant
Overall 10-mile radius 5-mile radius
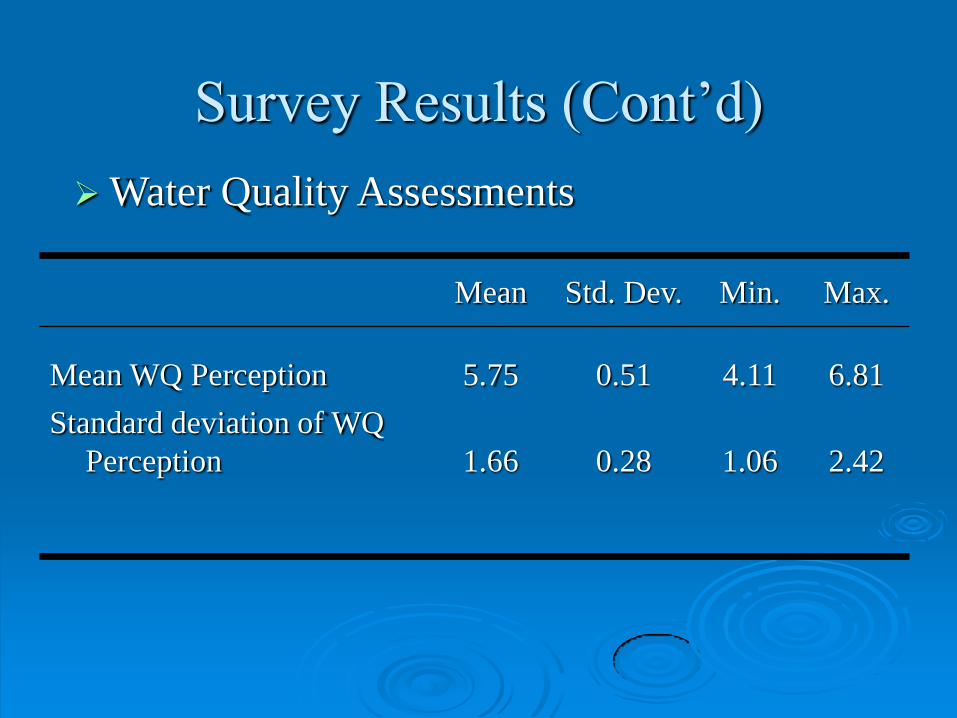
Survey Results (Cont’d)
Mean Std. Dev. Min. Max.
Mean WQ Perception 5.75 0.51 4.11 6.81
Standard deviation of WQ
Perception 1.66 0.28 1.06 2.42
Water Quality Assessments
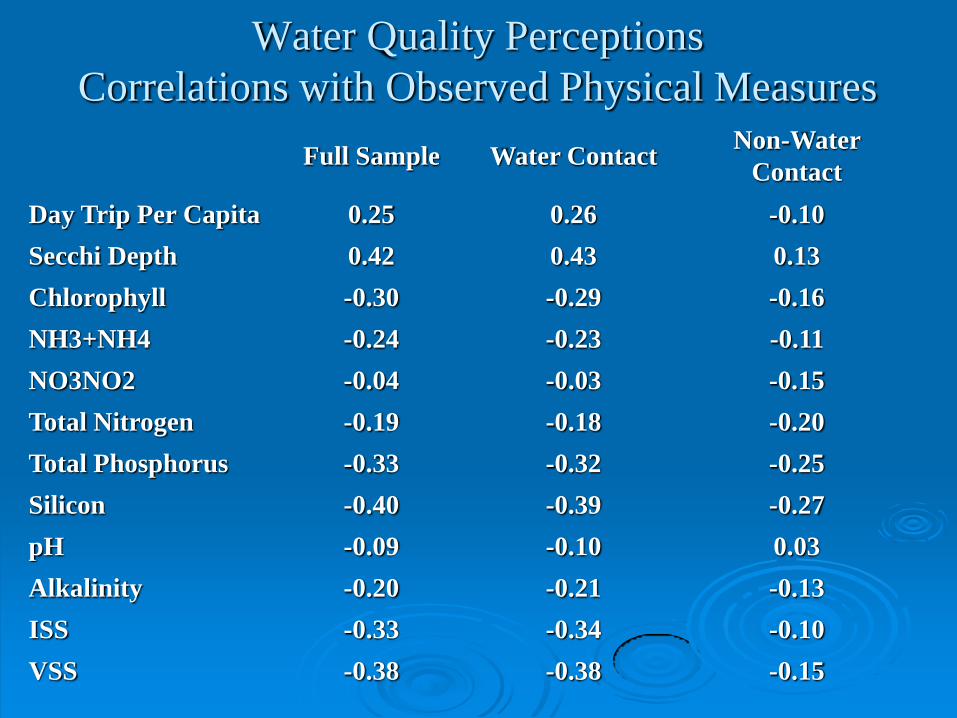
Water Quality Perceptions
Correlations with Observed Physical Measures
Full Sample Water Contact Non-Water
Contact
Day Trip Per Capita 0.25 0.26 -0.10
Secchi Depth 0.42 0.43 0.13
Chlorophyll -0.30 -0.29 -0.16
NH3+NH4 -0.24 -0.23 -0.11
NO3NO2 -0.04 -0.03 -0.15
Total Nitrogen -0.19 -0.18 -0.20
Total Phosphorus -0.33 -0.32 -0.25
Silicon -0.40 -0.39 -0.27
pH -0.09 -0.10 0.03
Alkalinity -0.20 -0.21 -0.13
ISS -0.33 -0.34 -0.10
VSS -0.38 -0.38 -0.15
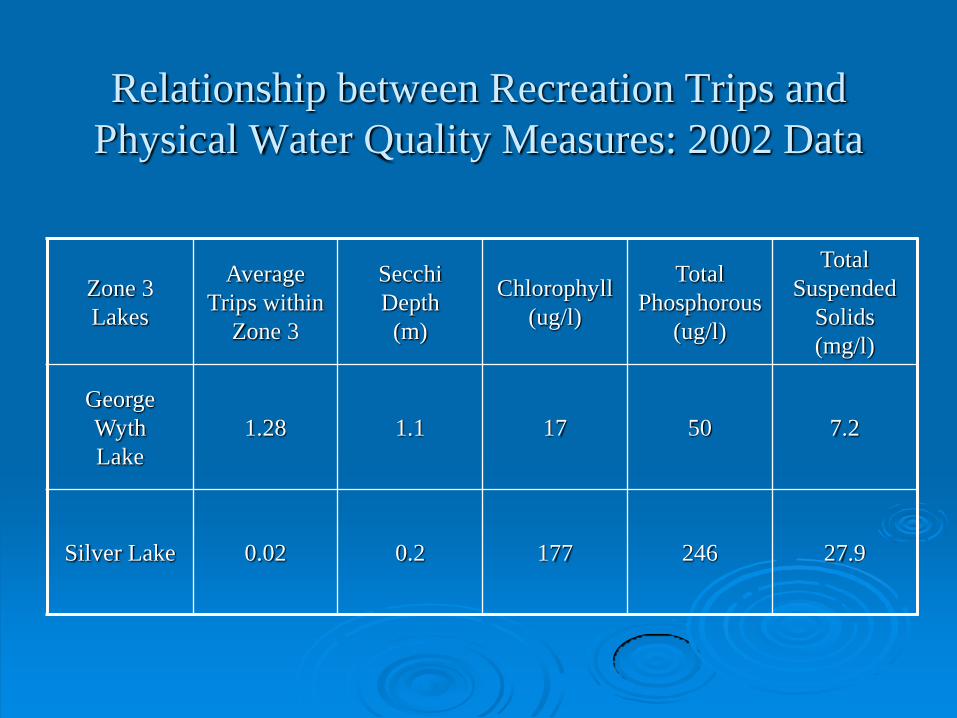
Relationship between Recreation Trips and
Physical Water Quality Measures: 2002 Data
Zone 3
Lakes
Average
Trips within
Zone 3
Secchi
Depth
(m)
Chlorophyll
(ug/l)
Total
Phosphorous
(ug/l)
Total
Suspended
Solids
(mg/l)
George
Wyth
Lake
1.28 1.1 17 50 7.2
Silver Lake 0.02 0.2 177 246 27.9
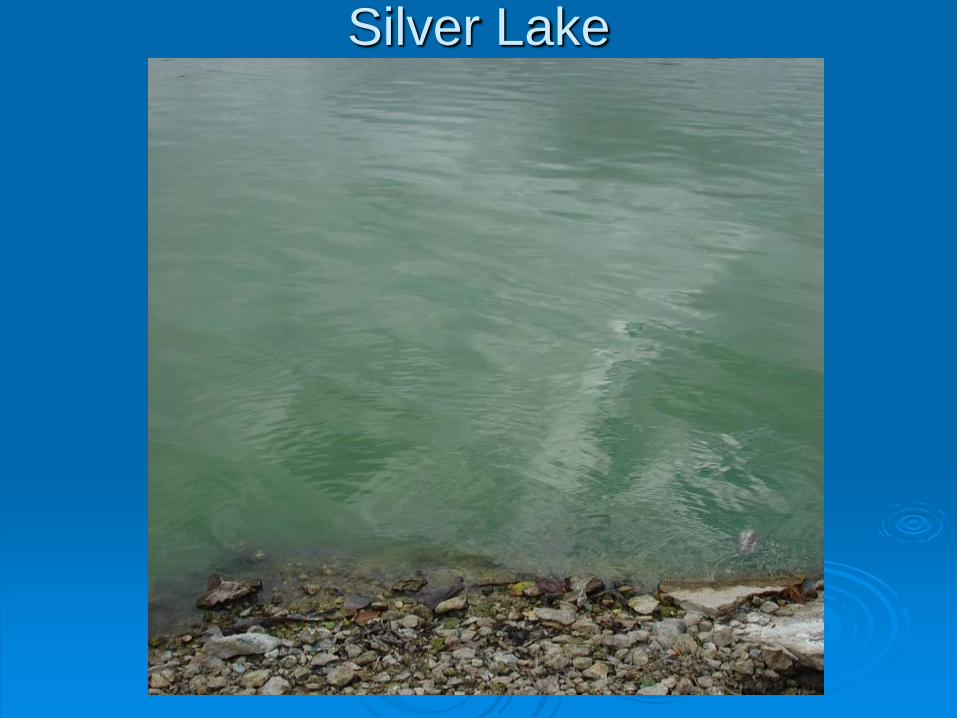
Silver Lake
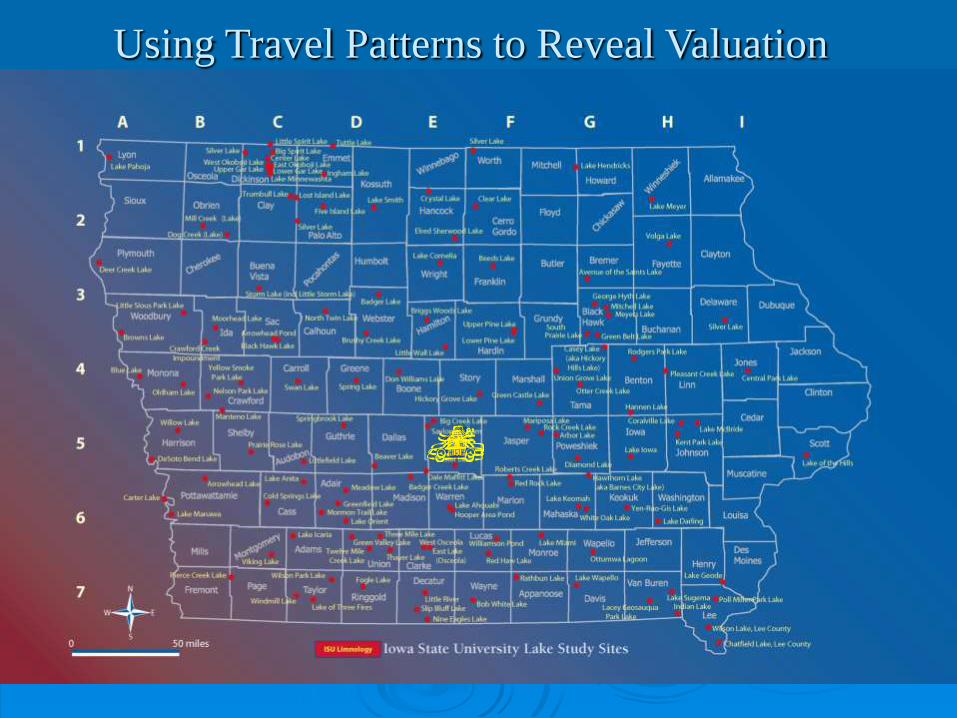
Using Travel Patterns to Reveal Valuation

Valuing Lake Restoration/Preservation
Lake restoration efforts can be costly, involving
dredging
watershed management
However, the benefits to Iowans can also be substantial
recreational benefits
benefits to local residents
non-use values
The benefits to any restoration “program” depends upon the mix of lakes being restored not just on the sum of benefits from each lake

A Lake Prioritization Analysis
The Cost Side
IDNR provided a list of 35 priority Lakes for possible restoration
Preliminary lake restoration costs were estimated for each lake by IDNR and John Downing, incorporating In-lake restoration costs including dredging to an average depth of 10 ft.
Permanent watershed protection (per acre)
Yearly watershed maintenance costs
Resulting lake changes were projected assuming a 70% reduction in total nitrogen, total phosphorous and suspended
solids
a 90% reduction in cynobacteria
corresponding changes in Secchi depth, chlorophyll, and total phytoplankton
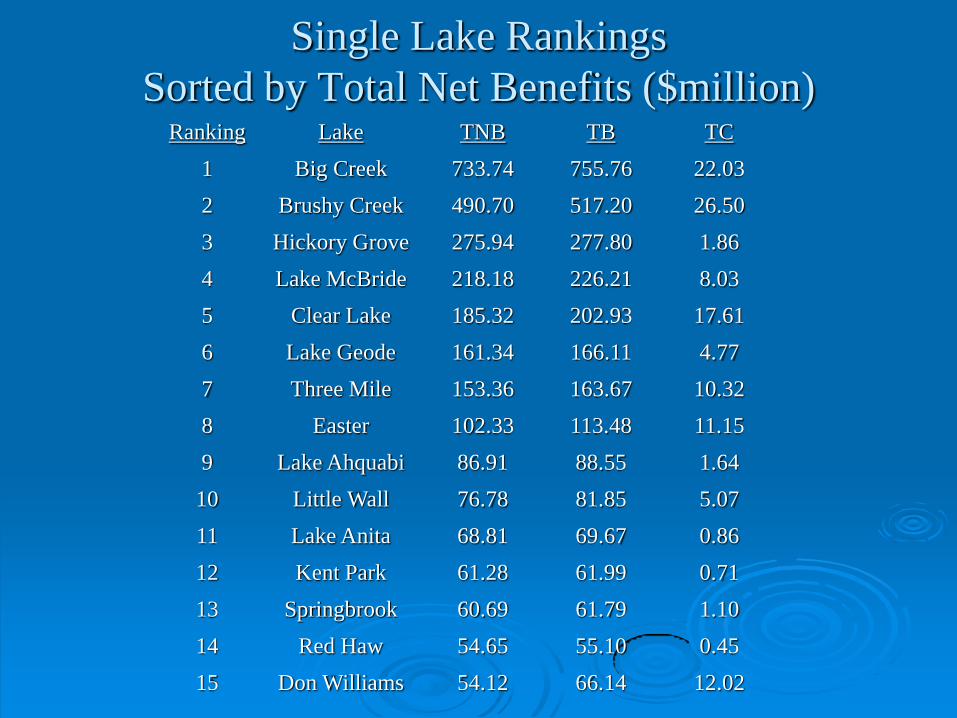
Single Lake Rankings
Sorted by Total Net Benefits ($million) Ranking Lake TNB TB TC
1 Big Creek 733.74 755.76 22.03
2 Brushy Creek 490.70 517.20 26.50
3 Hickory Grove 275.94 277.80 1.86
4 Lake McBride 218.18 226.21 8.03
5 Clear Lake 185.32 202.93 17.61
6 Lake Geode 161.34 166.11 4.77
7 Three Mile 153.36 163.67 10.32
8 Easter 102.33 113.48 11.15
9 Lake Ahquabi 86.91 88.55 1.64
10 Little Wall 76.78 81.85 5.07
11 Lake Anita 68.81 69.67 0.86
12 Kent Park 61.28 61.99 0.71
13 Springbrook 60.69 61.79 1.10
14 Red Haw 54.65 55.10 0.45
15 Don Williams 54.12 66.14 12.02
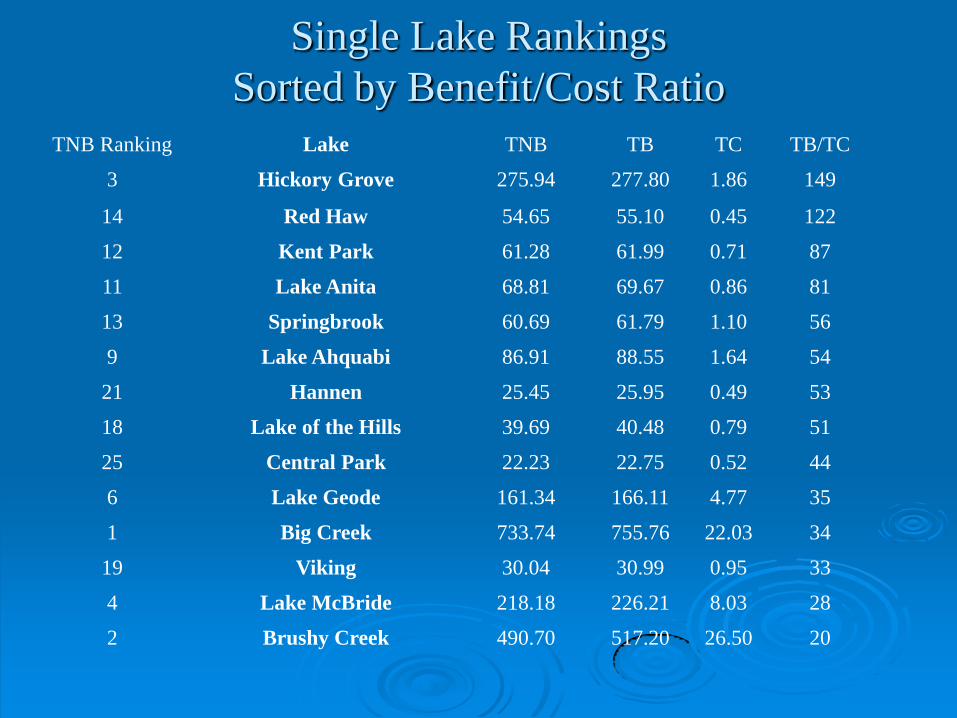
Single Lake Rankings
Sorted by Benefit/Cost Ratio
TNB Ranking Lake TNB TB TC TB/TC
3 Hickory Grove 275.94 277.80 1.86 149
14 Red Haw 54.65 55.10 0.45 122
12 Kent Park 61.28 61.99 0.71 87
11 Lake Anita 68.81 69.67 0.86 81
13 Springbrook 60.69 61.79 1.10 56
9 Lake Ahquabi 86.91 88.55 1.64 54
21 Hannen 25.45 25.95 0.49 53
18 Lake of the Hills 39.69 40.48 0.79 51
25 Central Park 22.23 22.75 0.52 44
6 Lake Geode 161.34 166.11 4.77 35
1 Big Creek 733.74 755.76 22.03 34
19 Viking 30.04 30.99 0.95 33
4 Lake McBride 218.18 226.21 8.03 28
2 Brushy Creek 490.70 517.20 26.50 20
Conclusions
Iowans value water quality, revealing this through
their patterns of lake usage
While the costs of lake restoration are substantial, they
have the potential to pay back within the first year,
improving the recreational opportunities within the
state

West Okoboji Lake