Embed Size (px)
Citation preview

Discounts and Premiums in Valuation

Challenges in ValuationOften value of a share depends on
the holder◦ A share is worth more in the hands of a
controlling shareholder◦ Shareholder types effectively have
different rights◦ Rights are priced in capital markets◦ Control is valuable and priced at premium

Challenges in ValuationValue of a share may also differ for
large and small shareholders◦ Absent control considerations, a larger
stake may be more difficult to monetize◦ Liquidity and control are seldom
independent◦ Exit option for minority is limited ◦ Hence share held by a large, controlling
shareholder is often more liquid

Challenges in ValuationShare value may also differ for
institutional vs. individual shareholders◦Tax treatments are different, which
affects the liquidityA share can also be more valuable
for a founding family due to emotional interest

Challenges in ValuationShare value may also differ for
strategic reasons◦ It is worth more for a strategic investor
than for a financial investor◦ Also be worth more to a diversified
than to an undiversified shareholder because of exposure to idiosyncratic risk

Levels of value &ownership characteristics

What if to apply both discounts????
Application of the discounts is multiplicative, not additive
Discount for control is applied first

Value of Control

Range of Control100 % Equity Ownership Position
Control Interest with Liquidating Control
51% Operating Control
Two equity holders, each with 50% interest
Minority with largest block of equity interest
Minority with “swing vote” attributes
Minority with “cumulative voting” rights
Pure minority interest – no control features

Value of ControlValue of controlling a firm derives
from the fact that ◦ you or someone else would operate the
firm differently from the way it is operated currently
Find out status quo valueRevalue the company with a
hypothetical “optimal” management team
Difference is value of controlling business

Value of Changing Management SAP is a business software manufacturing
company, headquartered in Germany. It has a well-deserved reputation for good
management, especially when it comes to new investments;
it reinvested 57.42% of its after-tax operating income back into the company and generated a return on capital of 19.93%.
On both dimensions, it did considerably better than its peer group. The management is, however, extremely conservative
When it comes to the use of debt and has a debt ratio of 14%; its resulting cost of capital is 8.68%.
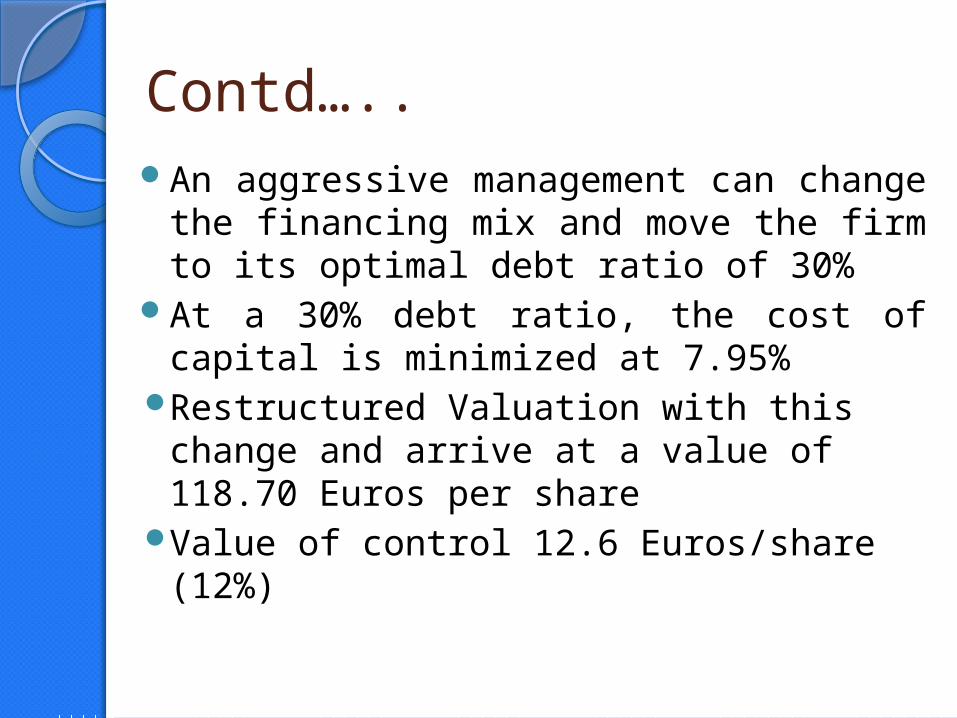
Contd…..An aggressive management can
change the financing mix and move the firm to its optimal debt ratio of 30%
At a 30% debt ratio, the cost of capital is minimized at 7.95%
Restructured Valuation with this change and arrive at a value of 118.70 Euros per share
Value of control 12.6 Euros/share (12%)
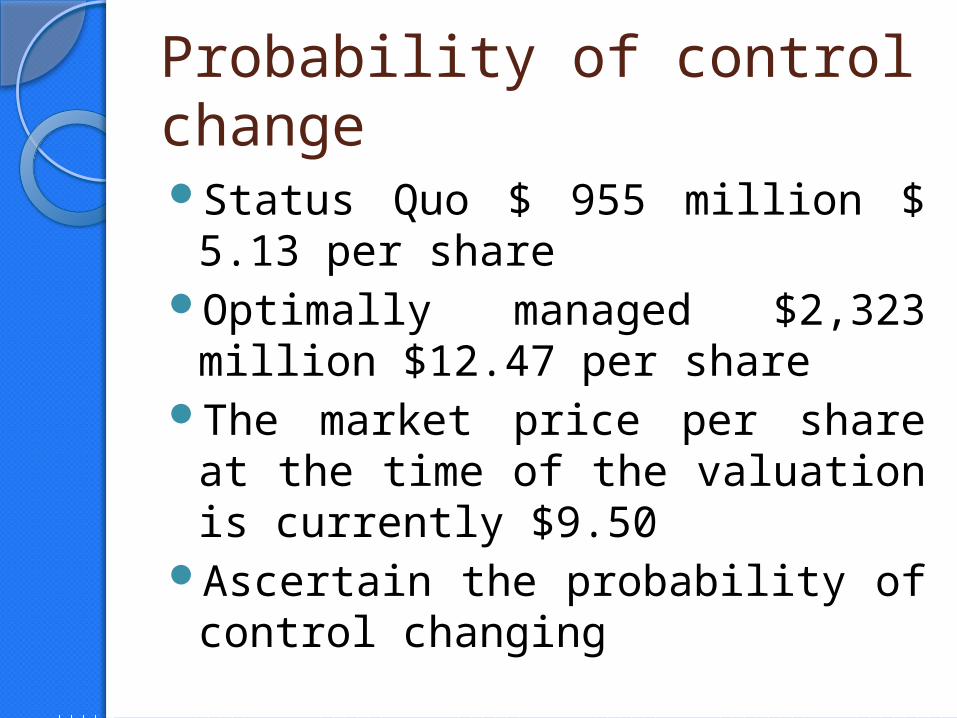
Probability of control changeStatus Quo $ 955 million $ 5.13
per shareOptimally managed $2,323
million $12.47 per shareThe market price per share at the
time of the valuation is currently $9.50
Ascertain the probability of control changing

SolutionExpected value per share =
Status Quo Value + Probability of control changing * (Optimal Value – Status Quo Value)
$ 9.50 = $ 5.13 + Probability of control changing ($12.47 - $5.13)
The market is attaching a probability of 59.5% that management policies can be changed.

Valuing voting and non-voting sharesWith existing management in
place, the value of a firm12.5 billion $ for the equity
With aggressive debt policy the firm is revalued at 14.7 billion $
There are 242.5 million voting shares and 476.7 non-voting shares in the company
Probability of management change is 20%
Estimate the value per non-voting and voting share

SolutionValue per non-voting share = Status
Quo Value/ (# voting shares + # non-voting shares)
= 12,500/(242.5+476.7) = 17.38 $/ share
Value per voting share = Status Quo value/sh + Probability of management change * (Optimal value – Status Quo Value)
= 17.38 + 0.2* (14,700-12,500)/242.5 = 19.19 $/ share

Quantification of VP
In Dual class Shares

Voting Premium – A variationEstimates of the voting premium have
been found to range widely across countries: ◦5–10% in the U.S. (Zingales, 1995), ◦80% in Italy (Zingales, 1994).
Factors that explain this variation include ◦ the degree of shareholder protection
(Nenova, 2003) and ◦ the likelihood of a change in control in the
company (Zingales, 1995)

How big is the value of control?Assume that the status quo value
for the firm is $ 100 million and the optimal value is $150 million,
You would be willing to pay 51% of optimal value ($150 million) for a controlling stake and
49% of the status quo value ($ 100 million) for a minority stake.
2% in voting rights translates into a difference of $26.5 million in value

Sources of Empirical DataMergerstat® Review – published
annually and quarterly Houlihan, Lokey, Howard and
Zukin, Inc. (HLHZ) Control Premium Study – Quarterly
SEC

Control Premium – Mergerstat data

Minority Discount

Valuing Minority interestHorizontal – computed by
comparison with other minority interest transactions
Top Down – control value less applicable discounts
Bottom Up – start with minority value and add premiums for control interest valuations
Most practitioners prefer horizontal and/or top down

Quantification of MD

Example from Mergerstat

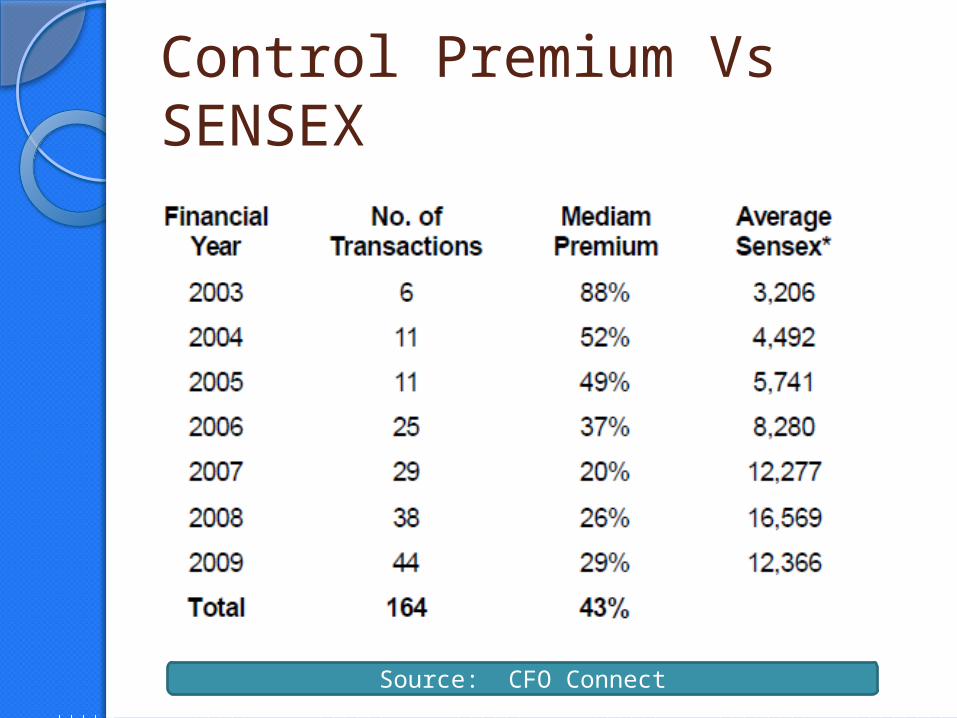
Control Premium Vs SENSEX
Source: CFO Connect

Use of Mercer’s Equation
Value of Liquidity
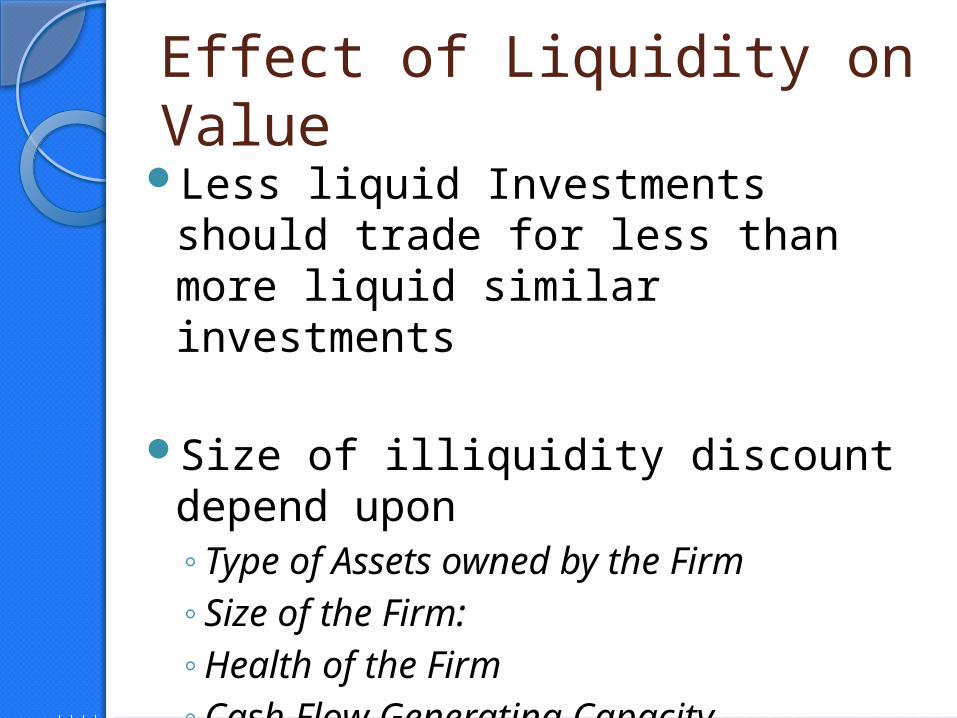
Effect of Liquidity on ValueLess liquid Investments should
trade for less than more liquid similar investments
Size of illiquidity discount depend upon◦Type of Assets owned by the Firm◦Size of the Firm:◦Health of the Firm◦Cash Flow Generating Capacity◦Size of the Block

Empirical EvidencesRestricted Stock
Private Placements
Bid Ask Spread
Pre-IPO studies

Studies on Restricted Stock

Cross Sectional Differences : Restricted Stock
Siber (1991)

Illiquid Discounts

Johnson Study 1999Total Sale Average Discount$00 – 10 M 23.5%$10 – 50 M 19.4%$50 – 200 M 17.7%Over $200 M 13.0%Total Net Income Average DiscountNegative 22.5%$0-1M 26.0%$1-10 M 18.1%Over $10M 06.3%

Johnson Study 1999Transaction Size Average Discount0-5 $M 26.7%5-10 $M 20.9%10-25 $M 17.0%Over 25 $M 10.8%Net Income Margin Average DiscountNegative 22.5%0-5 % 23.7%5-10 % 15.2%10-25 % 11.6%

Private Placements
Bajaj et al,

Bid Ask Spread Damodaran (2000) regressed the bid-ask spread
against annual revenues, with a dummy variable for positive earnings (DERN: 0 if negative and 1 if positive), cash as a percent of firm value and trading volume.
Spread = 0.145 – 0.0022 ln (Annual Revenues) -0.015 (DERN) – 0.016 (Cash/Firm Value) – 0.11 ($ Monthly trading volume/ Firm Value)
Plugging in the corresponding values – with a trading volume of zero – for a private firm should yield an estimate of the synthetic bid-ask spread for the firm.
This synthetic spread can be used as a measure of the illiquidity discount on the firm.

Other Discounts

Other Discounts in valuation
Small company risk discount Key person/thin management discountsLack of diversification discount Non-homogenous assets discount Specific company risk discount Market absorption and blockage discounts Investment company discount Information access and reliability discount Restrictive agreement discount Liquidation costs discount

Thank You