Embed Size (px)
Citation preview
AIN SHAMS MEDICAL JOURNAL Vol. 72, No., 2, June, 2021
227
VALUE OF MRI (DWI &ADC) IN DIFFERENTIATING BENIGN AND
MALIGNANT ORBITAL LESIONS
Eman Ahmed Shawky Geneidi , Eman Ahmed Fouad Darwish and
Selvia Samir Gowaid Isacc
ABSTRACT:
Background: Orbital and intraocular masses are relatively
uncommon compared to other mass lesions of the body. It has been
described that two-thirds of orbital tumors are benign and one third is
malignant. Differentiating between these causes based on clinical
findings may be difficult. Some lesions can be diagnosed easily
depending on their characteristics on MRI but sometimes their
characterization is still difficult. Diffusion weighted imaging (DWI) is
an advanced MR-based technique which has the ability to
characterize and differentiate morphologic features by measuring
differences in apparent diffusion coefficient (ADC) and so can aid in
differentiation of malignant and benign orbital lesions, which is focal
to planning further patient management.
Aim of the work: Is to investigate the utility of DW-MRI images
and generated ADC values in the differentiation between benign and
malignant orbital masses.
Patient and Methods: This study included 21 cases (13 females
and 8 males) proven to have an orbital mass by an available
radiological study.
Results: Of the 21 subjects, 10 out of 11 malignant lesions were
correctly classified as malignant (TP) & all of the 10 benign lesions
were correctly classified as benign (TN). A sensitivity of 90.9 % was
achieved, with a specificity of 100 %. The Positive predictive value
was 100 %, while the negative predictive value was 90.9%.
Conclusion: DWI and ADC maps with ADC value calculations
are useful for differentiating between malignant and benign orbital
tumors. Apparent diffusion coefficient value can solve some clinical
problems of the orbit that affect patient management.
Keywords: Orbit; Diffusion weighted MRI; ADC; Benign;
Malignant masses.
INTRODUCTION:
Orbital and intraocular masses are
relatively uncommon compared to other
mass lesions of the body. It has been
described that two-thirds of orbital tumors
are benign and one third is malignant
Differentiating between these causes
based on clinical or traditional radiographic
findings may be difficult
Magnetic resonance imaging (MRI) may
help in characterization of the various orbital
masses as there are some pathognomonic
features for particular masses. But for cases
without these pathognomonic characteristics
it remains difficult to deliver a diagnosis
based on MR imaging features because there
are often unspecific and overlapping
imaging findings. Aggravating this situation,
rare tumor entities are unexpected and
therefore may be misdiagnosed
Diagnostic Radiology Department,
Faculty of Medicine, Ain Shams
University, Tropical & National
Hepatology Medicine Research
Institute, Cairo
Corresponding author
Selvia Samir Gowaid Isacc;
Mobile: (+2) 01200499767
E.mail:
Received: 18/2/2021
Accepted: 10/3/2021
Online ISSN: 2735-3540

Value of MRI (DWI & ADC) In Differentiating Benign and Malignant Orbital Lesions
228
Diffusion weighted imaging (DWI) is
an MR-based technique in which dedicated
phase-defocusing and -refocusing gradients
allow evaluation of microscopic water
diffusion within tissues. It has been
considered a means to characterize and
differentiate morphologic features, including
edema, necrosis, and tumor tissue, by
measuring differences in apparent diffusion
coefficient (ADC) caused by water proton
mobility alternations
Diffusion-weighted MR imaging has
been used for differentiation between benign
and malignant head and neck masses,
cervical lymph nodes, parotid tumors, and
thyroid nodules. A few studies discussed the
role of diffusion MR imaging in the
diagnosis of malignant orbital tumors, the
differentiation of lymphoma from pseudo
tumor and other orbital masses, the
assessment of orbital cellulitis, as well as in
the characterization of optic nerve lesions
AIM OF THE WORK:
The aim of this study is to investigate
the utility of DW-MRI images and generated
ADC values in the differentiation between
benign and malignant orbital masses.
PATIENTS AND METHODS:
This study was conducted from
December 2019 to September 2020 and
included 21 patients (13 females and 8
males).
Inclusion criteria:
Patient of any age and of either sex
proven to have an orbital mass by an
available radiological study.
Exclusion criteria:
Patients with contraindications to MRI,
e.g. an implanted magnetic device,
pacemakers or claustrophobia.
Patients with contraindication to
contrast media e.g. elevated renal
functions.
Patients who underwent previous
surgery for the current orbital mass and
patients who received chemotherapy or
radiotherapy.
Official permission was obtained from
the radio diagnosis department, faculty of
medicine Ain-Shams University and
informed consents were obtained from all
patients or their legal guardians if they were
younger than 18years.
Study procedures:
After obtaining full medical history and
checking serum creatinine, all patients
underwent magnetic resonance imaging
on a 1.5-T MR system (Achieva;
Philips).
An attending anesthesiologist was
responsible for administration of sedation
and any preparation required prior to that if
the patient was unable to remain stationary
throughout the procedure.
The sequences of conventional MRI
orbit protocol were taken; Axial T1WI,
Axial T2WI, Axial STIR, Coronal
TIWI, Coronal T2WI. This was
followed by intravenous administration
of Gadolinium- DTPA (0.3 mg/kg), and
contrast enhanced T1WI in axial,
coronal and sagittal planes.
Then Diffusion-weighted MR imaging
was obtained using a multi section
single-shot echo planar imaging
sequence with b values of 0 and 800
s/mm . The ADC maps were generated
automatically by the MRI software.
Image analysis:
Conventional images were analyzed for
localization of the lesions and
identification of solid non necrotic, non-

Eman Ahmed Shawky Geneidi, et al.,
229
hemorrhagic, non-calcified enhancing
part of the tumors.
Qualitative assessment of signal
intensity of the solid parts of the lesions,
relative to surrounding ocular muscles
was done and were described as either
hyperintense, isointense, or hypointense.
A lesion was designated as restricted if
it showed high signal intensity on b
value 800 images and low signal
intensity on the corresponding ADC
map.
Quantitative analysis was done by
drawing (ROI) around the margin of the
solid, enhancing part of the orbital mass,
taking care to exclude cystic, necrotic,
calcified and hemorrhagic areas and
average ADC value was calculated.
Statistical analysis:
The data were analyzed using Statistical
Package for Social Science (IBM Corp,
released 2013. IBM SPSS statistics for
windows, V. 22.0. Armonk, NY. USA).
Parametric quantitative data were expressed
as mean ± standard deviation (SD).
Qualitative data were described as frequency
and percentage. The categorical variable was
analyzed with Fisher's Exact Test and
Pearson Chi-Square test. Independent
sample t test was used for parametric
quantitative continuous data. Analysis of
Receiver operator characteristic (ROC) was
performed to determine the optimal cut off
value, the sensitivity, specificity, PPV, NPV
and accuracy were calculated. For all tests P
values were two-tailed and P-value <0.05
was considered statistically significant.
RESULTS:
21 patients (13 females and 8 males)
were included in this study. Their ages
ranged from 1 – 68 years.
Histopathological analysis and MRI
features revealed that 10 and 11 of the
orbital lesions in this study were benign and
malignant respectively.
The benign lesions comprised 3
histocytosis (30%), 2 pseudotumor (20%), 2
cellulitis (20%), 1 cavernous hemangioma
(10%), 1 capillary hemangioma (10%) and 1
lacrimal pleomorphic adenoma (10%)
(Diagram 1).
Diagram (1): Pie chart showing the percent of different benign orbital lesions as diagnosed by
histopathology and/or MRI features.
The malignant lesions comprised 3 optic
nerve gliomas (27.3%), 3 lymphomas
(27.3%), 2 metastases (from breast cancer
and neuroblastoma) (18.2%), 1 melanoma
(9.1%), 1 rhabdiomyosarcoma (9.1%) and 1
retinoblastoma (9.1%) (Diagram 2).

Value of MRI (DWI & ADC) In Differentiating Benign and Malignant Orbital Lesions
230
Diagram (2): Pie chart showing the percent of different malignant orbital masses as diagnosed by
histopathology.
There was significant association
between lesional signal intensity on DWI,
ADC map and nature of the orbital lesions;
the majority of malignant orbital lesions
(54.5 %) were hyper intense as opposed to
90 % of benign lesions which were
hypointense on DWI, with a significant
difference between benign and malignant
lesions (p-value = 0.001). The majority of
malignant orbital lesions (63.6 %) were
hypo intense on ADC as opposed to 70 % of
the benign lesions which were hyperintense
on ADC with a significant difference
between benign and malignant lesions (p-
value = 0.002) (Table 1).
Table (1): DWI signal intensity and ADC signal intensity among benign and malignant orbital lesions Benign Malignant P value Sig
No of lesions 10 (47.6%) 11 (52.4%)
SI in DWI
Hypointense
Isointense
Hyperintense
9 (90%)
1 (10%)
0 (0%)
2 (18.2%)
3 (27.3%)
6 (54.5%)
0.001* S
SI in ADC
Hypointense
Isointense
Hyperintense
0 (0%)
3 (30%)
7 (70%)
7 (63.6%)
3 (27.3%)
1 (9.1%)
0.002* S
* Fisher's Exact Test
When the orbital lesions were
categorized as benign or malignant, both
groups could be differentiated using mean
ADC values. Benign tumors showed
statistically significantly higher mean ADC
values with (P < 0.001) (Table 2).
Table (2): Mean ADC values for benign and malignant groups. Data are expressed in median,
interquartile range and range
ADC Benign Malignant P value
Mean (± SD)
Median
Range
IQR
1.31 (±0.100)
1.33
1.20 – 1.49
1.20 – 1.39
0.82 (±224)
0.72
0.60 – 1.21
0.63 – 1.08
P < 0.001

Eman Ahmed Shawky Geneidi, et al.,
231
Using an ADC cut-off value of ≤1.145;
10 out of 11 malignant lesions were
correctly classified as malignant (TP) while
only one lesion (Optic Nerve Glioma) had
an ADC of more than 1.145; (1.21) and was
incorrectly classified as benign (FN). All of
the 10 benign lesions had ADC values that
were more than 1.145 and were correctly
classified as benign (TN). No benign lesions
had an ADC value of less than or equal
1.145; no (FP).
The ADC values of benign and
malignant subgroups in this study could not
be compared owing to the small sample size
of the individual subgroups, however the
ADC values of all benign and malignant
lesions can be seen in (Table 3).
Table (3): Descriptive data of ADC value among all different benign and malignant orbital lesions in
this study
Mean SD Median Max Min IQR 25th 75
th
Optic nerve glioma 1.13 0.07 1.09 1.21 1.08 0.13 1.08 1.21
Retinoblastoma 0.64 - 0.64 0.64 0.64 0 .64 .64
Melanoma 0.74 - 0.74 0.74 0.74 0 .74 .74
Rhabdiomyosarcoma 0.98 - 0.98 0.98 0.98 0 .98 .98
Lymphoma 0.62 0.02 0.63 0.63 0.60 0.03 .60 .63
Metastasis 0.71 0.02 0.71 0.72 0.69 0.03 .69 .72
Cavernous Hemangioma 1.34 - 1.34 1.34 1.34 0 1.34 1.34
Pseudotumor 1.44 0.07 1.44 1.49 1.39 0.1 1.39 1.49
Histocytosis 1.21 0.02 1.20 1.24 1.20 0.04 1.20 1.24
Lacrimal Pleomorphic adenoma 1.40 - 1.40 1.40 1.40 0 1.40 1.40
Capillary hemangioma 1.33 - 1.33 1.33 1.33 0 1.33 1.33
Cellulitis 1.27 0.10 1.27 1.34 1.20 0.14 1.20 1.34
The lowest ADC values were seen in cases of lymphoma with a mean ADC (± standard
deviation) of 0.62 (±0.02) x10-3
mm2/s and in metastasis where the mean ADC (± standard
deviation) was 0.71 (±0.02) x10-3
mm2/s. The highest ADC values were in cases of
pseudotumor with a mean ADC (± standard deviation) of 1.44 (±0.07) x10-3
mm2/s
A B
D
C
Figure (1): A 10 years old male patient with left sided orbital
pseudotumor. (A) axial T2WI shows enlargement of left lateral
rectus muscle by virtue of isointense soft tissue which implicates
the belly as well as the tendinous insertion of the muscle, (B) axial
T1WI post-contrast shows homogenous enhancement of the
thickened muscle, (C) DWI reveals that the lesion is of low signal
intensity consistent with the lack of diffusion restriction, and (D)
ADC map shows that the lesion is of increased signal intensity
with a mean ADC value = 1.39 x10⁻³
mm2/s.

Value of MRI (DWI & ADC) In Differentiating Benign and Malignant Orbital Lesions
232
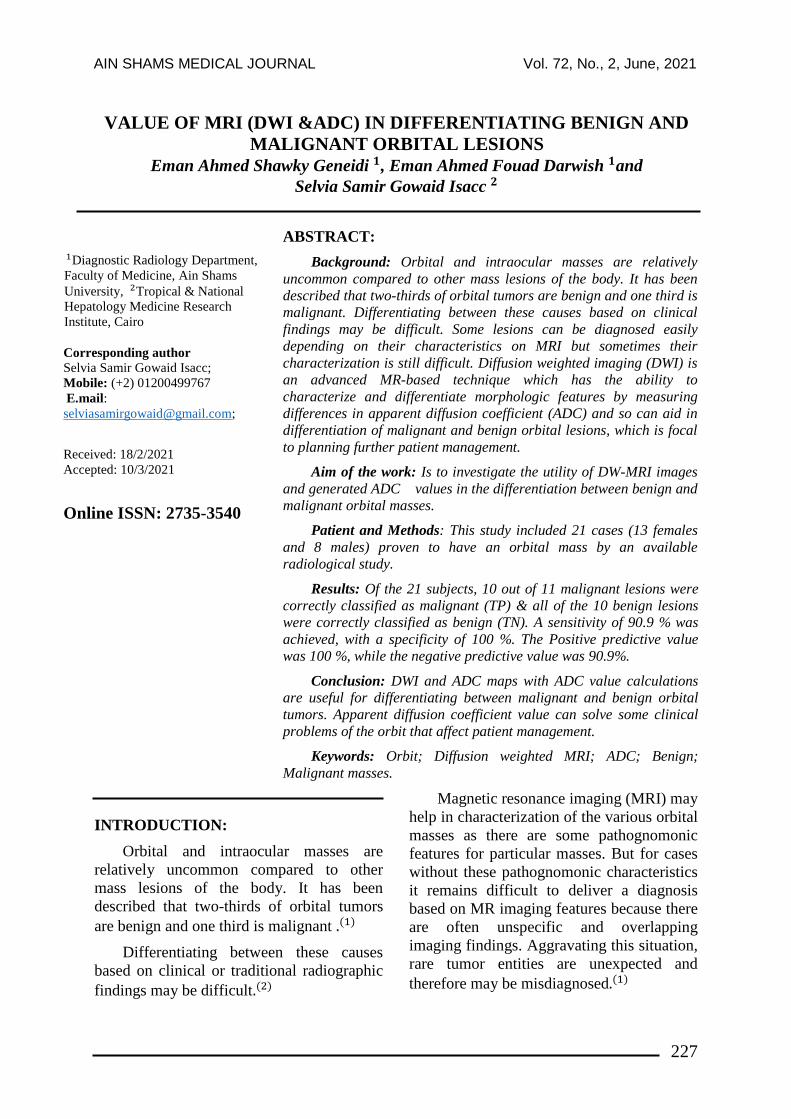
Figure (2): A 17 years old male patient with bilateral orbital lymphoma. (A) Axial T2WI and (B) axial
non-contrast T1WI show iso to hypointense soft tissue masses involving both lacrimal glands and
extending posteriorly into the orbit more on the right side. (C) axial T1WI post-contrast shows
homogenous enhancement of the orbital masses, (D) DWI and (E) ADC map confirm the restricted
diffusion of the masses as denoted by the increased signal on DWI and the homogenously low signal
on the corresponding ADC map with a mean ADC value= 0.63 x10⁻³
mm2/s consistent with the well-
documented dense cell packing of lymphomas, a diagnosis which was verified by histopathology.
A B C
D E

Eman Ahmed Shawky Geneidi, et al.,
233
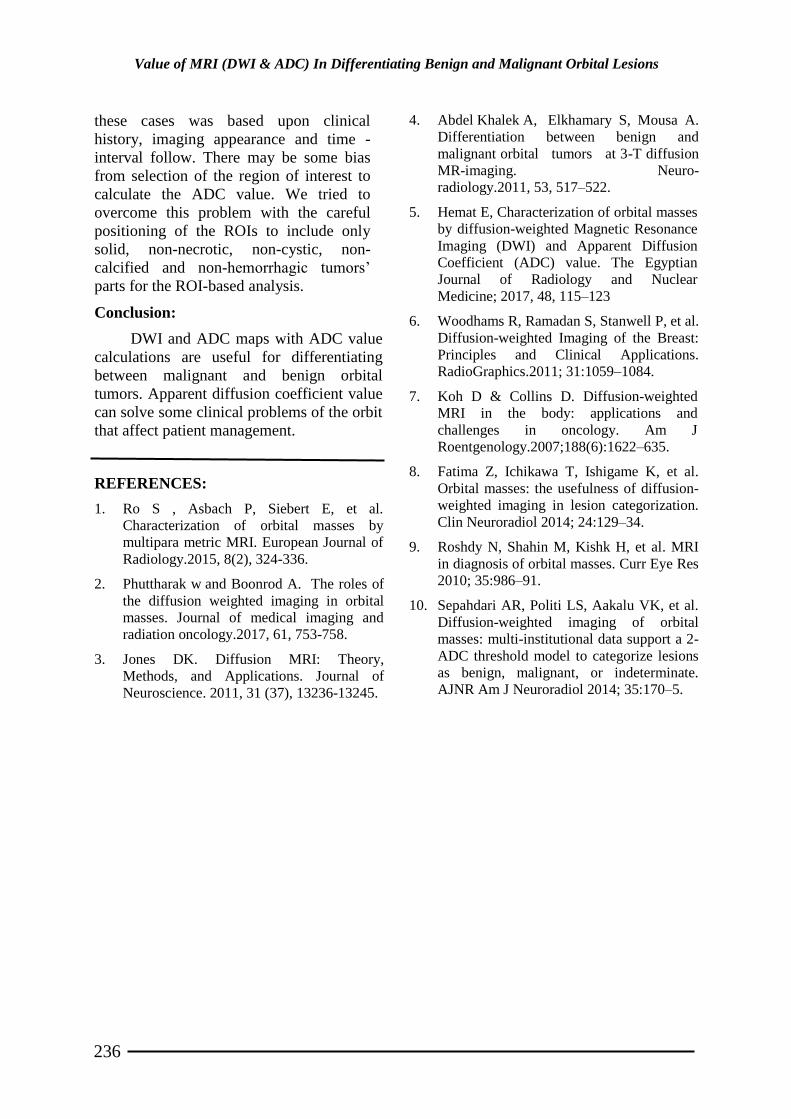
Figure (3): A 10 years old female patient with histologically proven left optic nerve glioma. (A) axial
T2WI shows a hyperintense well defined mass of left optic nerve, (B) axial non-contrast T1WI shows
an isointense mass of the left optic nerve (C) axial T1WI post-contrast shows mild hetrogenous
enhancement of the mass, (D) DWI and (E) ADC map display facilitated diffusion within the mass as
denoted by the increased signal intensity of the mass on both DWI and ADC with a mean ADC value
= 1.21 x10⁻³
mm2/s. Despite being malignant, optic nerve gliomas are known to be low grade lesions
with low cellularity which is responsible for the confounding results on diffusion imaging. The
increased signal intensity of the lesion on DWI is likely attributed to the T2 shine through effect.
DISCUSSION:
Using magnetic resonance imaging
(MRI), some lesions can be diagnosed easily
depending on the imaging findings such as
typical location and enhancement pattern,
but for lesions without these pathognomonic
characteristics, their characterization as
inflammatory, benign or malignant orbital
masses may be difficult.
Diffusion-weighted imaging is a
modality that makes use of magnetic
resonance (MR) imaging to depict the
diffusivity of water molecules in a defined
voxel by means of the application of motion-
probing gradients. This imaging property is
unique and provides a different contrast
mechanism than that observed on
conventional T1- and T2- weighted MR
images. In addition, the analysis of apparent
A B C
D E

Value of MRI (DWI & ADC) In Differentiating Benign and Malignant Orbital Lesions
234
diffusion coefficient (ADC) value can be
undertaken
Restriction in the diffusion of water
molecules (high signal in DWI and low
signal in ADC) is directly proportional to the
degree of cellularity of the tissue. This
restricted diffusion is observed primarily in
malignancies, hypercellular metastases, and
fibrosis. In contrast, in a microenvironment
with fewer cells and a defective cell
membrane, water molecules are able to
move freely (i.e. diffusion is less
restricted)
Our study supported the fact
mentioned above by revealing a significant
association between signal intensity of
lesions on the ADC map and nature of the
orbital lesions as confirmed by
histopathological analysis, where the
majority of malignant orbital lesions (63.6
%) were hypointense on ADC as opposed to
70% of the benign lesions which appeared
hyperintense on ADC with significant
difference between benign and malignant
lesions (p-value = 0.002). This was in
agreement with Fatima et al who
reported that the signal characteristics on
ADC maps (hyperintensity: hypointensity,
17:4 in benign lesions and 3:15 in malignant
lesions; p-value ≤ 0.0001) with significantly
different in benign vs. malignant lesions.
Similar to Roshdy et al who reported
that on DWIs, (50%) of benign lesions
appeared hypo intense “free diffusion” and all (100%) malignant tumors appeared hyper
intense “restricted diffusion”, this study
revealed that 54.5% and 90% of malignant
and benign orbital lesion appeared
hyperintense and hypointense on DWI
respectively with significant difference
between benign and malignant lesions (p-
value = 0.001). However, caution must be
exercised during assessment of DW images
as the signal intensity on DWI can be
affected by both the diffusivity of the tissue
and the T2 relaxation; the so-called T2 shine
through effect, which explains why Fatima
et al reported that visual assessment of
DWI images did not reveal a significant
difference (hyperintensity: hypointensity,
17:4 in benign lesions and 16:2 in malignant
lesions; p-value = 0.66) between benign and
malignant lesions.
Several older studies demonstrated that
malignant masses have significantly lower
ADC values than benign lesions. Abdel
Razek et al reported that the mean ADC
value for malignant masses was 0.8 ± 0.34
x10-3
mm2/s, and for benign lesions it was
1.53 ± 0.35 x10⁻³
mm2/s with a significant
difference (P=0.001). Fatima et al reported that the mean ADC value for
malignant masses was 0.77 ± 0.38 x10-
3mm
2/s, and for benign lesions it was1.23 ±
0.42 x10⁻³
mm2/s. Sepahdari et al
reported that the mean ADC value for
malignant masses was 1.02 ± 0.42 x10-
3mm
2/s, and for benign lesions it was 1.36 ±
0.41 x10⁻³
mm2/s with a significant
difference between both groups (P=0.0001).
Hemat found that the mean ± SD for
ADC values in malignant and benign orbital
masses was 0.77 ± 0.22 x10⁻³
mm2/s and 1.41
± 0.38 x10⁻³
mm2/s respectively revealing a
significant difference (p-value < 0.001).
Consistently the mean ADC value for
malignant orbital masses in this study was
0.82 ±0.224 x10⁻³
mm2/s (range 0.60 – 1.21
x10-3
mm2/s) while for benign lesions it was
1.31 ±0.1 x10⁻³
mm2/s (range 1.20 – 1.49
x10-3
mm2/s) with significant difference
between benign and malignant lesions (p-
value < 0.001). The reason for this behavior
is thought to be because of the peculiar
enlarged and deformed nuclei and
hypercellularity characteristics of malignant
lesions, thus reducing the available diffusion
space for water protons in both the
extracellular and intracellular spaces
In this study, an ADC cut-off value of
≤1.145 x10⁻³
mm2/s could differentiate
malignant tumors from benign lesions with a
sensitivity of 90.9%, a specificity of 100%
and an accuracy of 95.2%.

Eman Ahmed Shawky Geneidi, et al.,
235
Similarily Abdel-Razek et al found
using an ADC cut-off value of 1.15 x10-
3mm
2/s yielded a sensitivity of 95%,
specificity of 91% and accuracy of 93 % in
differentiation of malignant and benign
lesions. Fatima et al however, used a
lower ADC cutoff value of 0.84 x10⁻³
mm2/s
and this resulted in 83.33% sensitivity and
85.71% specificity for distinguishing
malignant from benign lesions. Hemat found that by using ADC cutoff value of
0.93 x10⁻³
mm2/s the sensitivity was 80%, the
specificity was 83.3% and the accuracy was
82%.
ADC has important role in different
clinical orbital problems that affect patient
management, for example in differentiating
orbital lymphoma from pseudotumor that
may simulated in clinical presentation and
MR imaging appearance. Prompt early
diagnosis is needed as the management
differs greatly The ADC values of benign
and malignant subgroups in this study could
not be compared owing to the small sample
size, however the results of this study
showed that the ADC values of lymphomas
were markedly lower than those of
pseudotumor with no overlap found between
their ADC values. The high cellularity and
enlarged nuclei of orbital lymphoma leads to
relative reduction in extracellular and
intracellular diffusion spaces with a resultant
decrease in the ADC value. The low mean
ADC value of 0.62 x10⁻³
mm2/s (range 0.60 -
0.63 x10⁻³
mm2/s) of lymphomas in this study
was comparable to values published by
previous studies including mean ADC value
of 0.67x103mm
2/s reported by Abdel-Razek
et al , and by Sepahdari et al , and
0.61 x10⁻³
mm2/s reported by Fatima et
al
On the other hand, interstitial edematous
change in idiopathic orbital inflammatory
pseuotumor gives rise to increase ADC,
promoting a significant difference in the
ADC value than lymphoma. This explains
the high mean ADC value of 1.44 (±0.07)
x10-3
mm2/s (range 1.39 – 1.49 x10
-3mm
2/s)
of psuedotumor in this study which was
comparable to values published by previous
studies including mean ADC value of 1.40
(0.31) x10-3
mm2/s reported by Sepahdari et
al , and 1.57 (± 0.38) x10-3
mm2/s (range
1.1 – 2.2 x10⁻³
mm2/s) reported by
Hemat .
In agreement with Abdel-Razek et al and Hemat who found that the mean
ADC value of metastasis was significantly
higher than that of lymphoma, the mean
ADC value of metastasis in this study (0.71
x10-3
mm2/s, range:0.69 – 0.72 x10
-3mm
2/s)
was higher than lymphoma with no overlap
among their individual values.
Hemat explained this by the fact that
lymphoma has high cellularity which even
exceeds the high cellularity of other
malignant tumors. Nevertheless, the mean
ADC value for metastasis in this study was
lower than the mean ADC values of 0.98
x10-3
mm2/s and 1.04 x10
-3mm
2/s reported by
Abdel-Razek et al and Hemat respectively for metastasis. This difference
could be attributed partly to the limited
number and variety of metastases included
in this study.
A single optic nerve glioma with a
high ADC value of 1.21 x10⁻³
mm2/s was
misdiagnosed as a benign tumor, thus
constituting the single false negative result
in this study. The low cellularity and
proliferative index of optic nerve gliomas as
well as being low grade tumors classified
histologically as pilocystic astrocytomas, is
thought to explain their high ADC values.
Similar observations were made by Fatima
et al and Hemat .
The limitations of this study included
the limited number of cases enrolled in the
study and the small sample size of each
subgroup which could have affected the
accuracy of our results. Histopathological
analysis was not available for some of the
benign lesions, so the final diagnosis of
Value of MRI (DWI & ADC) In Differentiating Benign and Malignant Orbital Lesions
236
these cases was based upon clinical
history, imaging appearance and time -
interval follow. There may be some bias
from selection of the region of interest to
calculate the ADC value. We tried to
overcome this problem with the careful
positioning of the ROIs to include only
solid, non-necrotic, non-cystic, non-
calcified and non-hemorrhagic tumors’
parts for the ROI-based analysis.
Conclusion:
DWI and ADC maps with ADC value
calculations are useful for differentiating
between malignant and benign orbital
tumors. Apparent diffusion coefficient value
can solve some clinical problems of the orbit
that affect patient management.
REFERENCES:
1. Ro S , Asbach P, Siebert E, et al.
Characterization of orbital masses by
multipara metric MRI. European Journal of
Radiology.2015, 8(2), 324-336.
2. Phuttharak w and Boonrod A. The roles of
the diffusion weighted imaging in orbital
masses. Journal of medical imaging and
radiation oncology.2017, 61, 753-758.
3. Jones DK. Diffusion MRI: Theory,
Methods, and Applications. Journal of
Neuroscience. 2011, 31 (37), 13236-13245.
4. Abdel Khalek A, Elkhamary S, Mousa A.
Differentiation between benign and
malignant orbital tumors at 3-T diffusion
MR-imaging. Neuro-
radiology.2011, 53, 517–522.
5. Hemat E, Characterization of orbital masses
by diffusion-weighted Magnetic Resonance
Imaging (DWI) and Apparent Diffusion
Coefficient (ADC) value. The Egyptian
Journal of Radiology and Nuclear
Medicine; 2017, 48, 115–123
6. Woodhams R, Ramadan S, Stanwell P, et al.
Diffusion-weighted Imaging of the Breast:
Principles and Clinical Applications.
RadioGraphics.2011; 31:1059–1084.
7. Koh D & Collins D. Diffusion-weighted
MRI in the body: applications and
challenges in oncology. Am J
Roentgenology.2007;188(6):1622–635.
8. Fatima Z, Ichikawa T, Ishigame K, et al.
Orbital masses: the usefulness of diffusion-
weighted imaging in lesion categorization.
Clin Neuroradiol 2014; 24:129–34.
9. Roshdy N, Shahin M, Kishk H, et al. MRI
in diagnosis of orbital masses. Curr Eye Res
2010; 35:986–91.
10. Sepahdari AR, Politi LS, Aakalu VK, et al.
Diffusion-weighted imaging of orbital
masses: multi-institutional data support a 2-
ADC threshold model to categorize lesions
as benign, malignant, or indeterminate.
AJNR Am J Neuroradiol 2014; 35:170–5.

Eman Ahmed Shawky Geneidi, et al.,
237
أهميت الرويه المغىاطيسي )خاصيت الاوتشار و معامل الاوتشار الظاهري( في التمييز بيه آفاث الحداج
الحميذة و الخبيثت
سلفيا سمير خىيذ اسحك ,ايمان أحمذ فؤاد درويش , ايمان أحمذ شىلي خىيذي*
قض الأشعح اىرشخيصيح ، مييح اىطة ، ظاعح عي شش، *
حاز الأشاض اىرىطحاىعهذ اىقىي لأت
جواىنثذ تاىقاهش
ذعذ ذنرلاخ اىحعاض و ذنرلاخ داخو اىعي غيش شهىسج ضثيا تاىقاسح تالآفاخ اىرنرييح الأخشي تاىعض الممذمت:
حيس ذ وصف أ شيصي أوسا اىحعاض حيذج و شيصها خثيصح. وقذ ينى اىصعة اىرييز تي هزج الأصثاب ضرذا عيي
الامييينيح. قذ يضاعذ اىشي اىغاطيضي في وصف ذنرلاخ اىحعاض اىخريفح لأ تعضها ىه صفاخ خاصح اىعراد اىرائط
يعذ اىرصىيش تخاصيح الارشاسعرذا عيي اىشي اىغاطيضي ذقيح وىن في الأغية يصعة اىرييزتي هزج اىصفاخ.
خلاه قياس الاخرلافاخ في عاو الارشاس حذيصح حيس ىه اىقذسج عيي ذىصيف و ذييز اىخصائص اىىسفىىىظيح
طيظ في علاض اىظاهشي اىرغيشاخ وتزىل ذضاعذ في اىرييز تي آفاخ اىحعاض اىخثيصح و اىحيذج واىري هي حىس اىرخ
اىشيط.
هى اىثحس في فائذج ذصىيش اىشي اىغاطيضي تخاصيح الأرشاس و اىقي اىاذعح عاو :الهذف مه الذراست
الأرشاس اىظاهشي في اىرييز تي اىرنرلاخ اىحيذج و اىخثيصح تاىحعاض.
س( يعاى وظىد ذنرلاخ رمى 8ااز و 21) شيط 12اشريد هزج اىذساصح عيي المرضي و طرق البحث:
تاىحعاض و رىل صثد خلاه فحص أشعح راغ.
تي واحذ و عششي شيط وظذ أحذ عشش حاىح يعاى أوسا خثيصح تاىحعاض و عشش حالاخ ىذيه الىتائح:
ىعششج الأخشي ذنرلاخ حيذج ،تىاقع عششج أصو أحذ عشش حاىح ايعاتيح صثرح تىظىد وس خثيس و ظيع اىحالاخ ا
%...2 و ضثح ذشخيص عاىيح ذصو اىي % 9..9ذنرلاخ حيذج تضثح دقح ذصو اىي صثد ىذيها وظىد
هاك أهيح مثيشج ىخاصيح الارشاس و خشائظ عاو الارشاس اىظاهشي و قيها في اىرييز تي أوسا الخلاصت:
ظاهشي ذحو اىنصيش اىشامو الامييينيح في اىحعاض و اىري ذؤشش اىحعاض اىخثيصح و اىحيذج. ما أ قي عاو الارشاس اى
في خطح علاض اىشيط.