Embed Size (px)
Citation preview

VVAALLUUAATTIIOONN RREEPPOORRTT
Value of a 1 Percent Minority Interest in Real
Estate LLC
As of December 31, 2012
Valuation Report for Real Estate LLC
March 26, 2013 Ross & Company CPA, PLLC Page 2 of 38
TABLE OF CONTENTS
Important Notices
Section 1: Valuation Summary
Section 2: The Valuation Assignment
Section 3: U.S. Economic Outlook
Section 4: Valuation Analysis
Appendices
Appendix A: Professional Qualifications
Appendix B: Real Estate Information
Appendix C: Closed End Fund Descriptions
Appendix D: Certification and Conditions

Valuation Report for Real Estate LLC
March 26, 2013 Ross & Company CPA, PLLC Page 3 of 38
DETAILED TABLE OF CONTENTS
TABLE OF CONTENTS ...................................................................................................................................................................... 2 DETAILED TABLE OF CONTENTS ........................................................................................................................................................ 3 INDEX OF CHARTS AND TABLES ......................................................................................................................................................... 4
IMPORTANT NOTICES ..................................................................................................................................................................... 5 COPYRIGHT ........................................................................................................................................................................................ 5 LIMITED COPYRIGHT LICENSE ........................................................................................................................................................... 5 TERMS AND CONDITIONS ................................................................................................................................................................... 5
SECTION 1: VALUATION SUMMARY ............................................................................................................................................ 6 OWNERSHIP AND VALUE .................................................................................................................................................................... 6 VALUATION ASSIGNMENT TERMS AND CONDITIONS ......................................................................................................................... 7
SECTION 2: THE VALUATION ASSIGNMENT ............................................................................................................................ 8 DESCRIPTION OF REAL ESTATE .......................................................................................................................................................... 8 OWNERSHIP AND MANAGEMENT ........................................................................................................................................................ 8 RENTAL INCOME REVIEW .................................................................................................................................................................. 8 DESCRIPTION OF ASSETS AND LIABILITIES ......................................................................................................................................... 9 DESCRIPTION OF REAL ESTATE ........................................................................................................................................................ 10
SECTION 3: THE U.S. ECONOMIC OUTLOOK .......................................................................................................................... 11 GENERAL OVERVIEW ....................................................................................................................................................................... 11 GROSS DOMESTIC PRODUCT AND THE INFLATION OUTLOOK ........................................................................................................... 13 THE INTEREST RATE OUTLOOK ....................................................................................................................................................... 15 SUMMARY ........................................................................................................................................................................................ 16
SECTION 4: VALUATION ANALYSIS .......................................................................................................................................... 17 THE VALUE OF AN ECONOMIC INTEREST ......................................................................................................................................... 17 REAL ESTATE PRICE-TO-NAV CALCULATION ................................................................................................................................. 18 PRICE-TO-NAV CALCULATIONS ...................................................................................................................................................... 21
Closed End Funds Used for Cash .............................................................................................................................................. 21 PRICE-TO-NAV ANALYSIS ............................................................................................................................................................... 21 THE LACK OF MARKETABILITY/LIQUIDITY DISCOUNT .................................................................................................................... 22 THE VALUE OF THE MINORITY INTEREST ......................................................................................................................................... 26
APPENDIX A: PROFESSIONAL QUALIFICATIONS .................................................................................................................. 27 GLEN A. ROSS, CPA CVA ............................................................................................................................................................... 27
APPENDIX B: REAL ESTATE INFORMATION ........................................................................................................................... 28 APPENDIX C: CLOSED END FUND DESCRIPTIONS ................................................................................................................ 29 APPENDIX D: CERTIFICATION AND CONDITIONS ................................................................................................................ 37
APPRAISAL CERTIFICATION ............................................................................................................................................................. 37 STATEMENT OF CONTINGENT AND LIMITING CONDITIONS .............................................................................................................. 38

Valuation Report for Real Estate LLC
March 26, 2013 Ross & Company CPA, PLLC Page 4 of 38
INDEX OF CHARTS AND TABLES
TABLE 1-1: VALUE OF A 1 PERCENT MINORITY INTEREST IN REAL ESTATE AS OF 12/31/2012 ............................................................... 6 TABLE 2-1: RENTAL REAL ESTATE INCOME AND EXPENSES .................................................................................................................... 8 TABLE 2-2: BALANCE SHEET ................................................................................................................................................................... 9 TABLE 2-3: PORTFOLIO FOR REAL ESTATE ............................................................................................................................................ 10 TABLE 3-1: REAL GDP GROWTH FORECAST.......................................................................................................................................... 13 TABLE 3-2: REAL GDP FORECAST IN BILLIONS OF DOLLARS ................................................................................................................ 13 TABLE 3-3: INFLATION FORECAST ......................................................................................................................................................... 14 TABLE 3-4: NOMINAL GDP FORECAST IN BILLIONS OF DOLLARS ......................................................................................................... 15 CHART 3-5: INTEREST RATE FORECAST ................................................................................................................................................ 15 TABLE 4-1: GUIDELINE PUBLICLY TRADED REAL ESTATE PARTNERSHIPS AS OF APRIL/MAY 2012 ..................................................... 19 TABLE 4-2: PRICE-TO-NAV FOR SELECTED CLOSED-END FUNDS ........................................................................................................ 20 TABLE 4-3: BUILD UP OF PRICE-TO-NAV OF REAL ESTATE ASSETS..................................................................................................... 20 TABLE 4-4: PRICE-TO-NAV CALCULATION FOR CASH AS OF 12/31/2012 ............................................................................................. 21 TABLE 4-5: BUILD-UP OF PRICE-TO-NAV ............................................................................................................................................. 22 TABLE 4-6: REPRESENTATIVE STUDIES THAT ATTEMPT TO MEASURE THE LIQUIDITY DISCOUNT ........................................................ 23 TABLE 4-7: VALUATION OF THE MINORITY INTEREST AS OF DECEMBER 31, 2012 ................................................................................. 26 TABLE B-1: REAL ESTATE BALANCE SHEET .......................................................................................................................................... 28 TABLE B-2: REAL ESTATE RENTAL REAL ESTATE INCOME AND EXPENSE ............................................................................................ 28 TABLE C-1: CLOSED END FUND DESCRIPTIONS ..................................................................................................................................... 29 TABLE C-2: REAL ESTATE PARTNERSHIP DESCRIPTIONS ....................................................................................................................... 30

Valuation Report for Real Estate LLC
March 26, 2013 Ross & Company CPA, PLLC Page 5 of 38
IMPORTANT NOTICES
COPYRIGHT
All information and materials in this report are copyright 2013 Ross & Company, CPA.
All rights are reserved, except as noted below. Copyright in the text and numerical
information, in the layout of the information in this report, and in the graphical displays of
the information is owned by Ross & Company, CPA unless otherwise indicated. The
text, numerical, and graphical information in this report may not be redistributed, copied,
sold, transferred, or modified, without the express written permission of Ross &
Company, CPA.
LIMITED COPYRIGHT LICENSE
Ross & Company grants to Real Estate LLC and their professional advisors a limited
copyright license to use this Valuation Report in support of activities for that company as
long as the information is attributed as “provided by Ross & Company, CPA.”
TERMS AND CONDITIONS
The business valuation result contained in this report is subject to the Appraisal
Certification, and Statement of Contingent and Limiting Conditions. Appendix D of this
report contains these documents.

Valuation Report for Real Estate LLC
March 26, 2013 Ross & Company CPA, PLLC Page 6 of 38
SECTION 1: VALUATION SUMMARY
Ross & Company, CPA, herein referred to as Ross & Company, has been engaged to
determine the value of a 1% minority interest in Real Estate LLC, as of December 31,
2012. The purpose of the valuation is for gifting of minority interests to family members.
Real Estate LLC, herein referred to as Real Estate, is an LLC formed under the laws of
the State of New York, and established on October 26, 2011.
OWNERSHIP AND VALUE
John Brown is the managing member of Real Estate LLC, which owns one condominium
in Manhattan, New York and a 50% interest in ABC LLC, which owns 15 condominiums
in Manhattan. The market value of the subject properties has been established by a real
estate appraisal as of April 12, 2012. The fair market value of a 1 percent minority
interest in Real Estate (on a non-controlling, non-marketable basis) as of December 31,
2012 is $23.403, as shown below.
Table 1-1: Value of a 1 Percent Minority interest in Real Estate as of 12/31/2012
Source: Ross & Company
Value of a 1 Percent Minority Interest in Real Estate LLC Source/Formula As of 12/31/2012 1) Net Asset Value of Real Estate LLC Table 2-3 Net Asset Value 4,553,969 $
2) Value of a 1% Minority Interest Before Discounts Row 1 * 1% 45,540 $
3) Calculation of Discount Due to Lack of Control Table 4-5 Price to NAV Discount 31.69% 4) Reduction in Value due to Lack of Control Discount Row 2 * Row 3 14,432 $
5) Adjusted Net Asset Value (non-controlling, marketable basis) Row 2 - Row 4 31,180 $
6) Estimated Discount for Lack of Marketability and Transfer Restrictions Section 4 25.00% 7) Reduction in Value due to Lack of Marketability and Transfer Restrictions Discount Row 5 * Row 6 7,777 $
8) Fair Market Value of a 1% Minority Interest (on a non-controlling, non-marketable basis) Row 5 - Row 7 23,403 $

Valuation Report for Real Estate LLC
March 26, 2013 Ross & Company CPA, PLLC Page 7 of 38
VALUATION ASSIGNMENT TERMS AND CONDITIONS
Ross & Company is independent of Real Estate and related organizations, and neither
Ross & Company nor I have any financial interest in the securities subject to appraisal.
Our fee for this valuation is in no way influenced by the result of our valuation
conclusion. This valuation report is prepared solely for the purpose stated herein.
The remaining sections and appendices further describe the analyses performed and the
conclusions reached during this valuation. The attached certification, limitation of
liability, statement of contingent and limited conditions, and qualifications are integral
parts of this valuation opinion.
Glen Ross, CPA, CVA
Ross & Company CPA, PLLC
Date

Valuation Report for Real Estate LLC
March 26, 2013 Ross & Company CPA, PLLC Page 8 of 38
SECTION 2: THE VALUATION ASSIGNMENT
DESCRIPTION OF REAL ESTATE
Real Estate was established on October 26, 2011 in the state of New York as an LLC.
The entity owns one condominium in Manhattan, New York and a 50% interest in ABC
LLC, which owns 15 condominiums in Manhattan. Real Estate’s income comes from the
rent from these properties.
We have been provided with the following documents pertaining to this valuation:
Real Estate & ABC’s Federal Tax Return for 2011
Updated 2012 financial statements for Real Estate & ABC
Real Estate Appraisals for the properties at 155 West 71st Street, New York,
NY 10023.
OWNERSHIP AND MANAGEMENT
John Brown is the managing member of Real Estate and owns an 82% interest of the
company.
RENTAL INCOME REVIEW
We have reviewed the rental income and expenses information from ABC’s 2011
Federal I Tax Return. ABC’s gross rents are $457,907. The company’s net rental real
estate income, gross rents less total expenses, is $163,973. ABC’s expenses include the
payment of legal and professional fees, taxes, insurance, and depreciation of fixed
assets. A summary of this is shown below.
Table 2-1: Rental Real Estate Income and Expenses
Source: ABC 2011 Federal Tax Return
2011
Gross Rents $457,907
Expenses: Insurance $3,550 Other expenses $150,217 Taxes $117,108 Depreciation $23,059
Total Expenses $293,934
Net Rental Real Estate Income $163,973

Valuation Report for Real Estate LLC
March 26, 2013 Ross & Company CPA, PLLC Page 9 of 38
DESCRIPTION OF ASSETS AND LIABILITIES
As of the valuation date, the assets of ABC primarily consist of real estate, and cash.
The table below displays ABC’s federal income tax return balance sheets for the tax
year ending 2011.
Table 2-2: Balance Sheet
Source: Real Estate 2011 Federal Tax Return
As of December 31, 2011, according to the federal tax return, ABC’s assets consist of
$864,023 in cash, $661,140 in fixed assets, and $119,657 in land.
According to the tax return’s detailed information as of December 31, 2011, the liabilities
of ABC consist of security deposits that amount to $46,238. In addition, there is
$1,197,286 in the partners’ capital accounts. The client has provided updated
information stating that as of September 30, 2012, the company’s cash level is $19,904,
and security deposits payable of $60,938, which is applicable to the valuation date of
December 31, 2012. Additionally, as of December 31, 2012 Real Estate had a cash
balance of $239,588 and fixed assets of $593,350.
For the real estate holding, we have been provided with information on the properties’
market values for 2012. Real Estate provided appraisals written by Charles J
Kunzmann Inc. as of April 12, 2012.
The assets by account and type, as of the valuation date, are shown in the table below.
Concepts Line Assets 2011
1 Cash $864,023
9a Buildings and other depreciable assets $661,140
9b Less accumulated depreciation $401,296
9b Net Buildings and other depreciable assets $259,844
11 Land (net of any amortization) $119,657
14 Total Assets $1,243,524 Liabilities and Shareholder's Equity
20 Other liabilities $46,238
21 Partners’ capital $1,197,286
22 Total liabilities and capital $1,243,524
End of Tax Year
Valuation Report for Real Estate LLC
March 26, 2013 Ross & Company CPA, PLLC Page 10 of 38
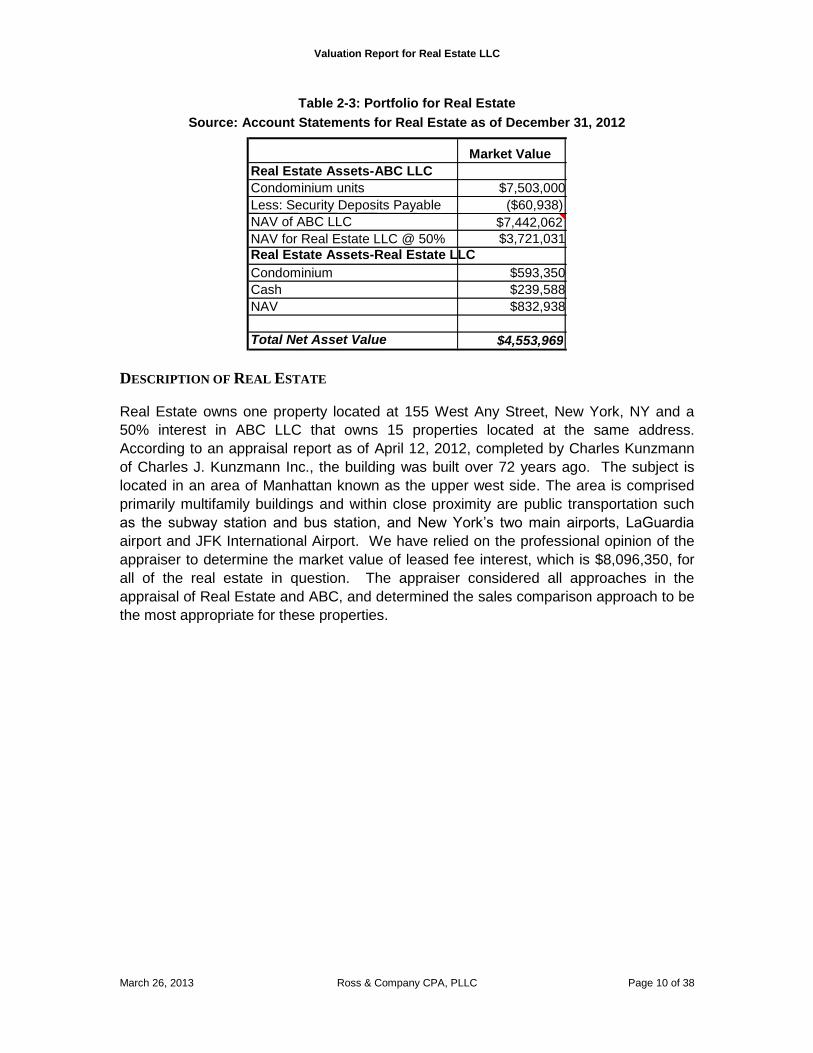
Table 2-3: Portfolio for Real Estate
Source: Account Statements for Real Estate as of December 31, 2012
DESCRIPTION OF REAL ESTATE
Real Estate owns one property located at 155 West Any Street, New York, NY and a
50% interest in ABC LLC that owns 15 properties located at the same address.
According to an appraisal report as of April 12, 2012, completed by Charles Kunzmann
of Charles J. Kunzmann Inc., the building was built over 72 years ago. The subject is
located in an area of Manhattan known as the upper west side. The area is comprised
primarily multifamily buildings and within close proximity are public transportation such
as the subway station and bus station, and New York’s two main airports, LaGuardia
airport and JFK International Airport. We have relied on the professional opinion of the
appraiser to determine the market value of leased fee interest, which is $8,096,350, for
all of the real estate in question. The appraiser considered all approaches in the
appraisal of Real Estate and ABC, and determined the sales comparison approach to be
the most appropriate for these properties.
Market Value Real Estate Assets-ABC LLC Condominium units $7,503,000 Less: Security Deposits Payable ($60,938) NAV of ABC LLC $7,442,062 NAV for Real Estate LLC @ 50%
Real Estate Assets-Real Estate LLC $3,721,031
Condominium $593,350 Cash $239,588 NAV $832,938
Total Net Asset Value $4,553,969

Valuation Report for Real Estate LLC
March 26, 2013 Ross & Company CPA, PLLC Page 11 of 38
SECTION 3: THE U.S. ECONOMIC OUTLOOK 1
GENERAL OVERVIEW
The contours of the global economy have changed dramatically in the last twelve
months. Economic slowdowns in China, India, and Brazil coupled with financial fractures
in the Euro zone, leaves the U.S. as one of the few economies that will be on an upward
growth trajectory in the next six to twelve months. Although the U.S. economic recovery
is modest by any measure of economic performance, two factors have developed that
are likely to generate significant incremental economic demand over the next two years.
The primary driver is the degree of excess inflation adjusted liquidity available to support
the purchase of goods and services which in turn will drive employment. The second
factor relates to the credit system which was severely damaged in the financial crisis and
now has recovered allowing the excess liquidity to find its way to various parts of the
capital markets. While housing has been a weak spot for some time, the bottom has
been reached. Demand for housing will increase substantially over the next eighteen
months, giving rise to strong demand for related consumer durables. In short, the
economic expansion will likely increase at a faster pace during the second half of 2012
than in any time during the economic recovery to this point.
This more upbeat view will not likely be side tracked by election year politics or short-
term factors impacting the price of oil which has increased significantly, driven by the
Iranian trade embargo. Interest rates, which remain at historically low levels, will not
increase significantly between now and year end. Inflation will also be contained. While
faster pace economic activity is usually associated with rising inflation, this will not be the
case in 2012. The central reason is that global demand will not be pressing up against
global capacity. Put differently, national economic cycles are not in sync which reduces
price pressures globally as weaker economies supply needed resources to economies
that are expanding relatively faster. The U.S. economy is the primary beneficiary of
these developments.
The upshot is that real economic growth in 2012 will be about 3.0% with growth in 2013
registering 3.6%. First, the growth in excess real liquidity (real M2 growth less its two
year moving average) continues to expand at a rapid pace. This development always
translates to a period of sustained real economic growth. Second, C&I loans have been
increasing since August of 2011 indicating that the banking system has returned to a
more healthy condition. Recent stress tests appear to support this conclusion. These
factors normally support above trend economic growth.
The unemployment rate will fall below 8% by year-end. We expect inflation to stay below
2% for the remainder of 2012 but begin to increase during the first half of 2013 as
inflationary expectations associated with renewed global expansion take hold. Both
1 Based on the Terra-Firma Economics Semi-Annual Industry Forecast, Spring/Summer 2012

Valuation Report for Real Estate LLC
March 26, 2013 Ross & Company CPA, PLLC Page 12 of 38
short- and long-term rates will begin rising during the first half of 2013, with long rates
increasing by more than short rates.
Although there has been flight to the dollar, we view this as a relatively short-term
phenomenon. In the longer term, we expect the dollar to depreciate against a market
basket of currencies. There are three main factors driving this. The first is the increase in
dollar availability associated with Fed actions. The second is a continuation by the
world’s central banks of diversifying their reserve base away from the dollar. The Yuan,
which currently is loosely pegged to the dollar, has begun to trade, which means it is
only a matter of time before the Yuan becomes part of the global reserve base. The
dollar will continue to be the dominant reserve currency, but its status will diminish.
At this juncture, the major risks to this outlook are predominately political. The first takes
the form of potential military hostilities with Iran being the major protagonist. The second
emanates from the perceived fallout from global capital flows and open markets which
place enormous pressures on U.S. business to compete. The inability and/or
unwillingness of U.S. businesses to compete in a global market accompanied by lack of
sustained employment growth creates incentives for affected constituencies to petition
the government to protect them, at least temporarily, by limiting imports, restricting
outsourcing to lower-wage countries, and preventing or limiting foreign ownership of U.S.
assets.
In an election year with both political parties not inclined to cooperate on defining issues
like taxes and the size of government, there is little that the public sector can do other
than wait until we know the outcome of the Presidential election. Monetary easing by the
Federal Reserve will do little to promote additional real growth given the economy is
already awash with liquidity, and interest rates are already at historically low levels.
Although the rest of the world is still dependent on U.S. economic activity, it is far less
dependent than in the past. Developing economies in Asia and South America are
expanding organically, albeit at a slower rate than last year, creating a demand for U.S.
goods and services. We expect demand from developing countries to be a major
economic force going forward.

Valuation Report for Real Estate LLC
March 26, 2013 Ross & Company CPA, PLLC Page 13 of 38
GROSS DOMESTIC PRODUCT AND THE INFLATION OUTLOOK
Table 3-1 and Table 3-2 below present our forecast for real GDP growth and real GDP
respectively.
Table 3-1: Real GDP Growth Forecast
Source: Spring/Summer 2012 Economic Forecast
Table 3-2: Real GDP Forecast in Billions of Dollars
Source: Spring/Summer 2012 Economic Forecast
2008 2009 2010 2011 2012 2013 2014 2015 2016 2017
Gross domestic product -0.30% -3.50% 3.00% 1.70% 3.05% 3.62% 3.51% 3.29% 3.40% 3.53%
Personal consumption expenditures -0.60% -1.90% 2.00% 2.20% 3.32% 4.03% 3.64% 3.41% 3.69% 3.99%
Durable goods -4.90% -5.40% 7.20% 8.20% 7.26% 7.75% 5.94% 5.57% 5.94% 6.00%
Nondurable goods -1.20% -1.80% 2.90% 1.70% 3.02% 6.04% 5.83% 5.48% 5.83% 6.04%
Services 0.40% -1.40% 0.90% 1.40% 2.32% 2.52% 2.32% 2.12% 2.32% 2.67%
Gross private domestic investment -10.20% -25.00% 17.90% 4.80% 4.35% 4.85% 5.54% 4.64% 4.65% 4.67%
Fixed investment -7.10% -18.80% 2.60% 6.80% 4.54% 4.94% 5.64% 4.72% 4.73% 4.74%
Nonresidential -0.80% -17.80% 4.40% 8.80% 4.47% 4.57% 5.22% 4.18% 4.18% 4.18%
Structures 6.40% -21.20% -15.80% 4.60% 5.33% 6.77% 5.62% 4.99% 4.99% 4.99%
Equipment and software -4.30% -16.00% 14.60% 10.40% 2.98% 3.93% 5.10% 3.93% 3.93% 3.93%
Residential -23.90% -22.20% -4.30% -1.30% 4.58% 6.55% 7.44% 6.99% 6.99% 6.99%
Change in private inventories
Net exports of goods and services 8.80% 4.20% -1.20% 1.80% 16.55% 18.12% 13.05% 8.69% 12.71% 15.99%
Exports 6.10% -9.40% 11.30% 6.70% 5.62% 6.45% 6.10% 5.74% 6.12% 8.10%
Goods 6.30% -12.00% 14.40% 7.40% 6.77% 7.08% 6.77% 6.44% 6.77% 9.07%
Services 5.60% -3.50% 5.00% 4.90% 2.75% 4.89% 4.40% 3.92% 4.40% 5.47%
Imports -2.70% -13.60% 12.50% 4.90% 7.69% 8.84% 7.64% 6.43% 7.69% 10.07%
Goods -3.80% -15.60% 14.80% 5.70% 8.35% 9.67% 8.35% 7.01% 8.35% 10.94%
Services 3.60% -3.50% 2.90% 1.10% 3.74% 4.44% 3.73% 3.03% 3.73% 4.61%
Government consumption expenditures
and gross investment 2.60% 1.70% 0.70% -2.10% 3.61% 3.89% 3.56% 3.10% 3.60% 4.20%
Federal 7.20% 6.00% 4.50% -1.90% 3.07% 3.23% 2.98% 2.46% 3.07% 4.01%
National defense 7.50% 5.80% 3.30% -2.30% 2.26% 2.02% 1.37% 0.72% 1.36% 2.22%
Nondefense 6.50% 6.50% 7.10% -1.20% 4.67% 5.57% 6.01% 5.56% 6.01% 6.95%
State and local 0.00% -0.90% -1.80% -2.20% 3.57% 4.37% 3.96% 3.56% 3.97% 4.33%
Real GDP Growth ForecastActual
2008 2009 2010 2011 2012 2013 2014 2015 2016 2017
Gross domestic product $13,161.90 $12,703.10 $13,088.00 $13,315.10 $13,721.00 $14,218.24 $14,717.12 $15,201.58 $15,718.22 $16,272.56
Personal consumption expenditures $9,211.70 $9,037.50 $9,220.90 $9,421.30 $9,734.44 $10,127.16 $10,495.61 $10,853.19 $11,254.13 $11,703.25
Durable goods $1,171.80 $1,108.30 $1,188.30 $1,285.40 $1,378.71 $1,485.51 $1,573.70 $1,661.42 $1,760.05 $1,865.60
Nondurable goods $2,019.10 $1,983.40 $2,041.30 $2,075.80 $2,138.57 $2,267.64 $2,399.94 $2,531.54 $2,679.24 $2,840.93
Services $6,017.00 $5,935.50 $5,991.80 $6,076.10 $6,217.15 $6,374.00 $6,521.97 $6,660.23 $6,814.84 $6,996.72
Gross private domestic investment $1,939.80 $1,454.20 $1,714.90 $1,797.30 $1,875.53 $1,966.47 $2,075.41 $2,171.63 $2,272.68 $2,378.80
Fixed investment $1,978.60 $1,606.30 $1,648.40 $1,761.00 $1,840.93 $1,931.87 $2,040.81 $2,137.03 $2,238.08 $2,344.20
Nonresidential $1,537.60 $1,263.20 $1,319.20 $1,435.50 $1,499.66 $1,568.27 $1,650.16 $1,719.07 $1,790.89 $1,865.74
Structures $466.40 $367.30 $309.10 $323.20 $340.42 $363.48 $383.90 $403.05 $423.16 $444.27
Equipment and software $1,059.40 $889.70 $1,019.40 $1,125.70 $1,159.24 $1,204.79 $1,266.26 $1,316.02 $1,367.73 $1,421.47
Residential $444.40 $345.60 $330.80 $326.30 $341.26 $363.60 $390.65 $417.97 $447.19 $478.47
Change in private inventories -$36.30 -$144.90 $58.80 $34.60 $34.60 $34.60 $34.60 $34.60 $34.60 $34.60
Net exports of goods and services -$494.80 -$358.80 -$421.80 -$413.60 -$482.06 -$569.40 -$643.69 -$699.61 -$788.50 -$914.60
Exports $1,649.30 $1,494.00 $1,663.20 $1,774.20 $1,873.89 $1,994.83 $2,116.54 $2,238.03 $2,375.08 $2,567.46
Goods $1,157.00 $1,018.60 $1,164.90 $1,251.70 $1,336.40 $1,431.06 $1,527.97 $1,626.38 $1,736.50 $1,893.96
Services $492.30 $474.90 $498.80 $523.10 $537.49 $563.76 $588.57 $611.65 $638.57 $673.50
Imports $2,144.00 $1,852.80 $2,085.00 $2,187.70 $2,355.95 $2,564.23 $2,760.23 $2,937.65 $3,163.58 $3,482.05
Goods $1,784.80 $1,506.00 $1,729.30 $1,828.60 $1,981.25 $2,172.88 $2,354.27 $2,519.37 $2,729.68 $3,028.17
Services $359.80 $347.20 $357.40 $361.20 $374.70 $391.35 $405.96 $418.28 $433.90 $453.89
Government consumption expenditures
and gross investment $2,497.40 $2,539.60 $2,556.80 $2,502.70 $2,593.10 $2,694.01 $2,789.79 $2,876.37 $2,979.91 $3,105.10
Federal $971.10 $1,029.50 $1,075.90 $1,055.00 $1,087.36 $1,122.46 $1,155.94 $1,184.33 $1,220.74 $1,269.75
National defense $657.70 $695.60 $718.30 $701.60 $717.47 $731.97 $742.00 $747.37 $757.55 $774.36
Nondefense $313.30 $333.80 $357.70 $353.40 $369.89 $390.48 $413.94 $436.95 $463.19 $495.40
State and local $1,528.10 $1,514.20 $1,487.00 $1,453.80 $1,505.74 $1,571.55 $1,633.86 $1,692.04 $1,759.17 $1,835.35
Actual Real GDP Forecast
Valuation Report for Real Estate LLC
March 26, 2013 Ross & Company CPA, PLLC Page 14 of 38
Real consumption expenditures will pick up momentum in 2012 as real incomes
increase with expected increases in employment. We expect this to continue through
2013 and beyond. Residential construction spending declined in 2011, but we expect it
to register substantive growth in 2012 and over the longer term. Non-residential
investment will expand in 2012, led by equipment and software investment. New
industrial and commercial building investment will expand in 2012. Outsourcing and the
use of the internet, which allows workers to collaborate at a distance, have reduced the
need to expand office space as the economy has expanded. In the long run, these
developments will be less operative, and new industrial and office space will be required
to house an expanding workforce.
Economic expansion will result in a widening trade deficit as imports continue to expand
faster than exports. Dollar weakness will provide some impetus to exports and place
upward pressure on import prices and hence inflation.
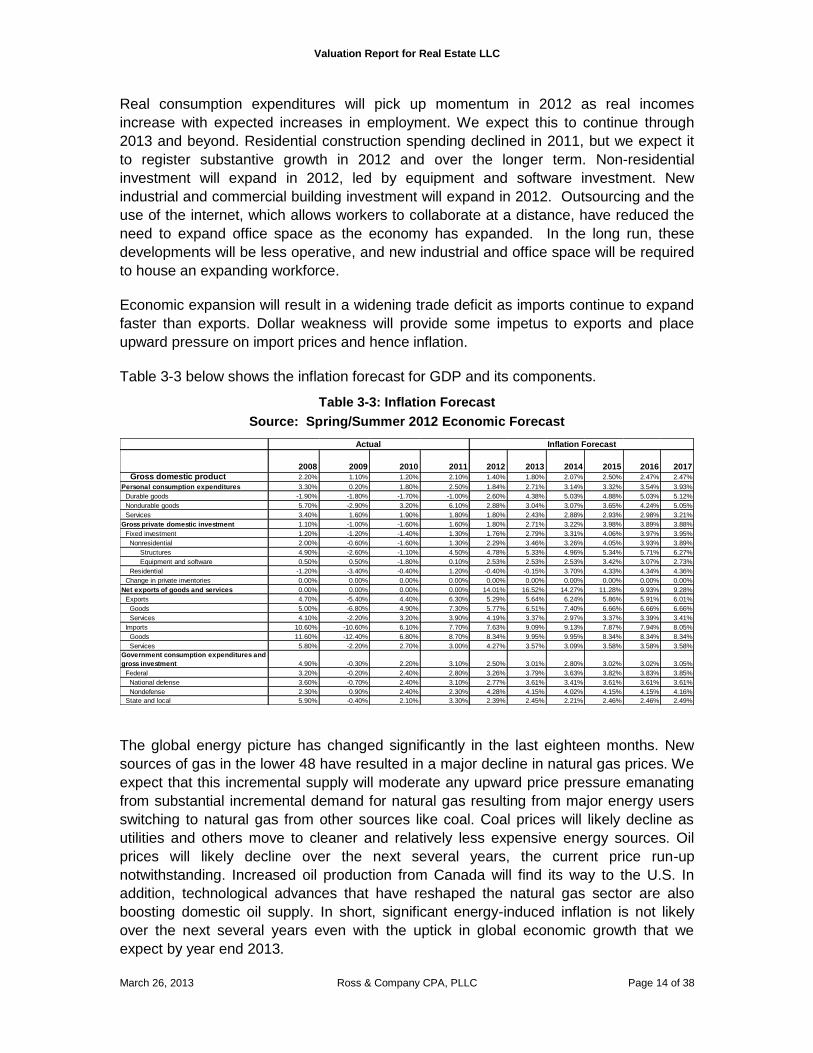
Table 3-3 below shows the inflation forecast for GDP and its components.
Table 3-3: Inflation Forecast
Source: Spring/Summer 2012 Economic Forecast
The global energy picture has changed significantly in the last eighteen months. New
sources of gas in the lower 48 have resulted in a major decline in natural gas prices. We
expect that this incremental supply will moderate any upward price pressure emanating
from substantial incremental demand for natural gas resulting from major energy users
switching to natural gas from other sources like coal. Coal prices will likely decline as
utilities and others move to cleaner and relatively less expensive energy sources. Oil
prices will likely decline over the next several years, the current price run-up
notwithstanding. Increased oil production from Canada will find its way to the U.S. In
addition, technological advances that have reshaped the natural gas sector are also
boosting domestic oil supply. In short, significant energy-induced inflation is not likely
over the next several years even with the uptick in global economic growth that we
expect by year end 2013.
2008 2009 2010 2011 2012 2013 2014 2015 2016 2017
Gross domestic product 2.20% 1.10% 1.20% 2.10% 1.40% 1.80% 2.07% 2.50% 2.47% 2.47%
Personal consumption expenditures 3.30% 0.20% 1.80% 2.50% 1.84% 2.71% 3.14% 3.32% 3.54% 3.93%
Durable goods -1.90% -1.80% -1.70% -1.00% 2.60% 4.38% 5.03% 4.88% 5.03% 5.12%
Nondurable goods 5.70% -2.90% 3.20% 6.10% 2.88% 3.04% 3.07% 3.65% 4.24% 5.05%
Services 3.40% 1.60% 1.90% 1.80% 1.80% 2.43% 2.88% 2.93% 2.98% 3.21%
Gross private domestic investment 1.10% -1.00% -1.60% 1.60% 1.80% 2.71% 3.22% 3.98% 3.89% 3.88%
Fixed investment 1.20% -1.20% -1.40% 1.30% 1.76% 2.79% 3.31% 4.06% 3.97% 3.95%
Nonresidential 2.00% -0.60% -1.60% 1.30% 2.29% 3.46% 3.26% 4.05% 3.93% 3.89%
Structures 4.90% -2.60% -1.10% 4.50% 4.78% 5.33% 4.96% 5.34% 5.71% 6.27%
Equipment and software 0.50% 0.50% -1.80% 0.10% 2.53% 2.53% 2.53% 3.42% 3.07% 2.73%
Residential -1.20% -3.40% -0.40% 1.20% -0.40% -0.15% 3.70% 4.33% 4.34% 4.36%
Change in private inventories 0.00% 0.00% 0.00% 0.00% 0.00% 0.00% 0.00% 0.00% 0.00% 0.00%
Net exports of goods and services 0.00% 0.00% 0.00% 0.00% 14.01% 16.52% 14.27% 11.28% 9.93% 9.28%
Exports 4.70% -5.40% 4.40% 6.30% 5.29% 5.64% 6.24% 5.86% 5.91% 6.01%
Goods 5.00% -6.80% 4.90% 7.30% 5.77% 6.51% 7.40% 6.66% 6.66% 6.66%
Services 4.10% -2.20% 3.20% 3.90% 4.19% 3.37% 2.97% 3.37% 3.39% 3.41%
Imports 10.60% -10.60% 6.10% 7.70% 7.63% 9.09% 9.13% 7.87% 7.94% 8.05%
Goods 11.60% -12.40% 6.80% 8.70% 8.34% 9.95% 9.95% 8.34% 8.34% 8.34%
Services 5.80% -2.20% 2.70% 3.00% 4.27% 3.57% 3.09% 3.58% 3.58% 3.58%
Government consumption expenditures and
gross investment 4.90% -0.30% 2.20% 3.10% 2.50% 3.01% 2.80% 3.02% 3.02% 3.05%
Federal 3.20% -0.20% 2.40% 2.80% 3.26% 3.79% 3.63% 3.82% 3.83% 3.85%
National defense 3.60% -0.70% 2.40% 3.10% 2.77% 3.61% 3.41% 3.61% 3.61% 3.61%
Nondefense 2.30% 0.90% 2.40% 2.30% 4.28% 4.15% 4.02% 4.15% 4.15% 4.16%
State and local 5.90% -0.40% 2.10% 3.30% 2.39% 2.45% 2.21% 2.46% 2.46% 2.49%
Actual Inflation Forecast

Valuation Report for Real Estate LLC
March 26, 2013 Ross & Company CPA, PLLC Page 15 of 38
Table 3-4 shows the projections for nominal GDP and its components.
Table 3-4: Nominal GDP Forecast in Billions of Dollars
Source: Spring/Summer 2012 Economic Forecast
THE INTEREST RATE OUTLOOK
Chart 3-5 shows the forecast for both the one-year Treasury Bill and the ten-year
Treasury Bond.
Chart 3-5: Interest Rate Forecast
Source: Spring/Summer 2012 Economic Forecast
0.00%
2.00%
4.00%
6.00%
8.00%
10.00%
Inte
res
t R
ate
Year
Treasury Bill Rate - 1 year Treasury Bond Rate - 10 years
Both short-term and long-term interest rates were at historically low levels in 2011,
reflecting the extent of the economic weakness, an easing Fed policy, and increased
2008 2009 2010 2011 2012 2013 2014 2015 2016 2017
Gross domestic product $14,291.50 $13,939.00 $14,526.50 $15,094.00 $15,771.50 $16,637.69 $17,578.56 $18,612.00 $19,720.15 $20,919.69
Personal consumption expenditures $10,035.50 $9,866.10 $10,245.50 $10,726.00 $11,286.48 $12,059.62 $12,891.09 $13,772.99 $14,787.35 $15,981.98
Durable goods $1,108.90 $1,029.60 $1,085.50 $1,162.90 $1,279.80 $1,439.39 $1,601.50 $1,773.36 $1,973.08 $2,198.41
Nondurable goods $2,272.80 $2,167.80 $2,301.50 $2,483.70 $2,632.55 $2,876.36 $3,137.78 $3,430.77 $3,784.99 $4,216.01
Services $6,653.80 $6,668.70 $6,858.50 $7,079.40 $7,374.13 $7,743.87 $8,151.82 $8,568.86 $9,029.27 $9,567.57
Gross private domestic investment $2,087.60 $1,546.80 $1,795.10 $1,916.20 $2,035.50 $2,192.06 $2,387.99 $2,598.08 $2,824.82 $3,071.40
Fixed investment $2,128.70 $1,707.60 $1,728.20 $1,870.00 $1,989.20 $2,145.76 $2,341.69 $2,551.78 $2,778.52 $3,025.10
Nonresidential $1,656.30 $1,353.00 $1,390.10 $1,532.50 $1,637.66 $1,771.78 $1,925.04 $2,086.69 $2,259.29 $2,445.33
Structures $586.30 $449.90 $374.40 $409.50 $451.93 $508.27 $563.45 $623.14 $691.59 $771.59
Equipment and software $1,070.00 $903.00 $1,015.70 $1,123.00 $1,185.73 $1,263.51 $1,361.58 $1,463.55 $1,567.70 $1,673.74
Residential $472.40 $354.70 $338.10 $337.50 $351.55 $373.98 $416.66 $465.09 $519.23 $579.77
Change in private inventories -$41.10 -$160.80 $66.90 $46.30 $46.30 $46.30 $46.30 $46.30 $46.30 $46.30
Net exports of goods and services -$709.70 -$391.50 -$516.90 -$578.70 -$768.99 -$1,058.41 -$1,367.20 -$1,653.55 -$2,048.69 -$2,596.94
Exports $1,846.80 $1,583.00 $1,839.80 $2,085.50 $2,319.14 $2,608.14 $2,939.81 $3,290.87 $3,698.87 $4,238.69
Goods $1,297.50 $1,064.70 $1,277.80 $1,473.40 $1,663.83 $1,897.66 $2,176.08 $2,470.43 $2,813.32 $3,272.84
Services $549.30 $518.40 $562.00 $612.10 $655.31 $710.48 $763.74 $820.44 $885.56 $965.85
Imports $2,556.50 $1,974.60 $2,356.70 $2,664.20 $3,088.13 $3,666.54 $4,307.01 $4,944.43 $5,747.57 $6,835.63
Goods $2,146.30 $1,587.30 $1,947.30 $2,237.90 $2,627.03 $3,167.75 $3,773.62 $4,375.20 $5,135.96 $6,172.97
Services $410.10 $387.30 $409.40 $426.30 $461.10 $498.80 $533.39 $569.23 $611.61 $662.66
Government consumption
expenditures and gross investment $2,878.10 $2,917.50 $3,002.80 $3,030.60 $3,218.50 $3,444.42 $3,666.67 $3,894.48 $4,156.68 $4,463.25
Federal $1,080.10 $1,142.70 $1,222.80 $1,232.90 $1,312.09 $1,405.84 $1,500.34 $1,595.89 $1,708.01 $1,845.00
National defense $737.80 $774.90 $819.20 $824.90 $866.90 $916.37 $960.63 $1,002.55 $1,052.90 $1,115.17
Nondefense $342.30 $367.80 $403.60 $407.90 $445.20 $489.46 $539.71 $593.34 $655.11 $729.83
State and local $1,798.00 $1,774.80 $1,780.00 $1,797.70 $1,906.41 $2,038.58 $2,166.33 $2,298.60 $2,448.66 $2,618.25
Nominal GDP ForecastActual
2007 2008 2009 2010 2011 2012 2013 2014 2015 2016
1 year Treasury
Bill:Year End 3.34% 1.20% 0.47% 0.29% 0.12% 0.62% 1.50% 2% 2.10% 2.20%
10 year Treasury
Bond: Year End 4.04% 3.80% 3.30% 3.29% 1.89% 2.74% 3.62% 4.12% 4.37% 4.62%

Valuation Report for Real Estate LLC
March 26, 2013 Ross & Company CPA, PLLC Page 16 of 38
funding to financial institutions. As the economy begins to recover, we expect rates to
rise, with long rates reflecting an increase in expected inflation in response to a relatively
easy monetary policy and a depreciating dollar.
SUMMARY
The U.S. economy will register stronger growth going forward than it did in the earlier
years of the current economic expansion. Inflation and interest rates will increase but in
the near-term these increases will likely be moderate.
The entity consists primarily of real estate, which generates income through rent in
Brooklyn, New York. Rental rates are considered to have a resistance to economic
downturns, whereas the real estate properties are generally deeply affected if sold
during a recession. Taking all of this into consideration, we do not expect the asset
values of Real Estate to decline significantly for the foreseeable future, even in the case
of a double dip recession.
Valuation Report for Real Estate LLC
March 26, 2013 Ross & Company CPA, PLLC Page 17 of 38
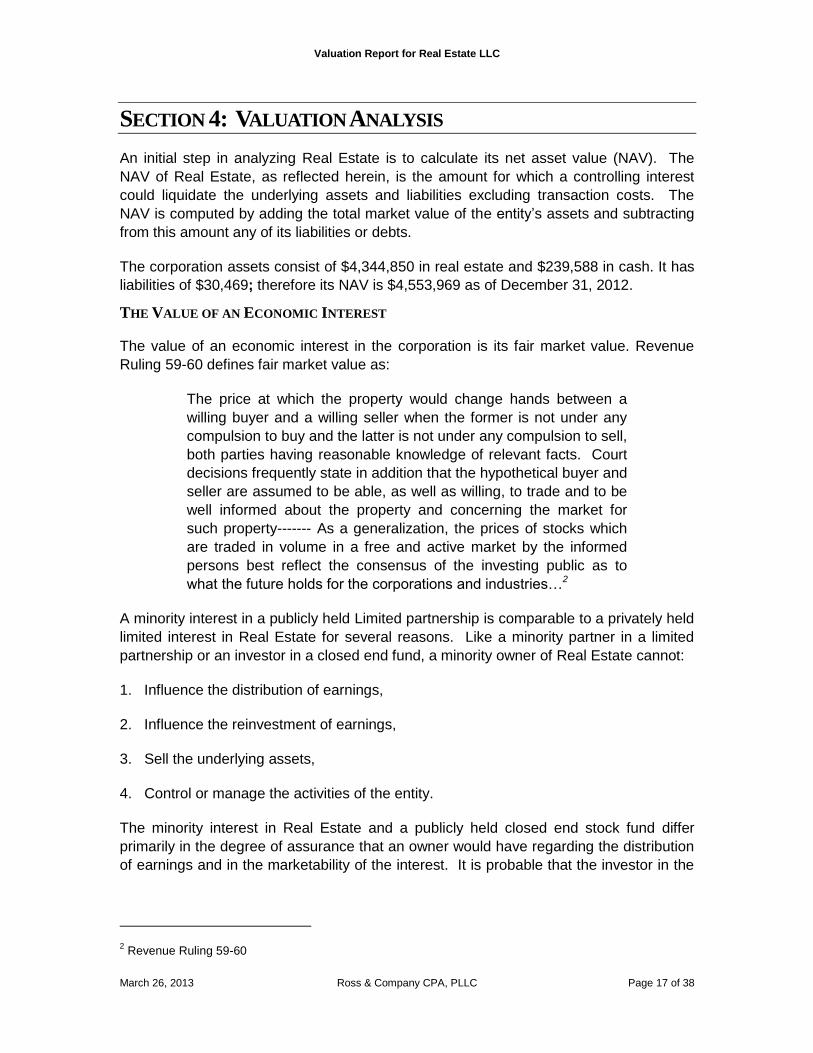
SECTION 4: VALUATION ANALYSIS
An initial step in analyzing Real Estate is to calculate its net asset value (NAV). The
NAV of Real Estate, as reflected herein, is the amount for which a controlling interest
could liquidate the underlying assets and liabilities excluding transaction costs. The
NAV is computed by adding the total market value of the entity’s assets and subtracting
from this amount any of its liabilities or debts.
The corporation assets consist of $4,344,850 in real estate and $239,588 in cash. It has
liabilities of $30,469; therefore its NAV is $4,553,969 as of December 31, 2012.
THE VALUE OF AN ECONOMIC INTEREST
The value of an economic interest in the corporation is its fair market value. Revenue
Ruling 59-60 defines fair market value as:
The price at which the property would change hands between a
willing buyer and a willing seller when the former is not under any
compulsion to buy and the latter is not under any compulsion to sell,
both parties having reasonable knowledge of relevant facts. Court
decisions frequently state in addition that the hypothetical buyer and
seller are assumed to be able, as well as willing, to trade and to be
well informed about the property and concerning the market for
such property------- As a generalization, the prices of stocks which
are traded in volume in a free and active market by the informed
persons best reflect the consensus of the investing public as to
what the future holds for the corporations and industries…2
A minority interest in a publicly held Limited partnership is comparable to a privately held
limited interest in Real Estate for several reasons. Like a minority partner in a limited
partnership or an investor in a closed end fund, a minority owner of Real Estate cannot:
1. Influence the distribution of earnings,
2. Influence the reinvestment of earnings,
3. Sell the underlying assets,
4. Control or manage the activities of the entity.
The minority interest in Real Estate and a publicly held closed end stock fund differ
primarily in the degree of assurance that an owner would have regarding the distribution
of earnings and in the marketability of the interest. It is probable that the investor in the
2 Revenue Ruling 59-60

Valuation Report for Real Estate LLC
March 26, 2013 Ross & Company CPA, PLLC Page 18 of 38
publicly held security would have greater assurance of the distribution of earnings due to
the higher level of scrutiny.
We have reviewed the portfolio composition of Real Estate and examined sources of
closed end funds to find funds with a similar portfolio mix and characteristics based on
the composition shown in Table 2-3. The following sections summarize the guideline
closed end funds that we found to be most comparable to the mix of assets in Real
Estate.
We calculate the Price-to-NAV discount for each asset class in order to determine the
Price-to-NAV for Real Estate.
REAL ESTATE PRICE-TO-NAV CALCULATION
Real Estate has several condominiums in New York, New York. Based on the
information provided on this property, we have classified the real estate as commercial
land with a total market value of $4,344,850.
An examination of publicly held limited partnerships was conducted in comparison to the
real estate holdings of Real Estate in terms of type of asset, risk and return. The
analysis included a review of over 260 publicly held real estate partnerships from the
Partnership Profiles Minority Interest Discount Database. This database provides
comprehensive financial information regarding publicly traded minority interests from
1994 to 2011. From the partnerships in the database, a search was conducted for
publicly held partnerships with the following attributes.
1. The partnerships owned and managed equity interests in commercial land;
2. The partnerships had not announced definitive plans to liquidate;
3. The partnerships generate returns of around 5.68%;
Data was obtained from Partnership Profiles, Inc. (PPI), a company that provides
financial and transaction data on publicly held limited partnerships and from the
Partnership Profiles Minority Interest Discount Database. The Partnership Profiles
recommended guideline partnerships for commercial land. Selected data from each of
the guideline partnerships is summarized in the table below.
Valuation Report for Real Estate LLC
March 26, 2013 Ross & Company CPA, PLLC Page 19 of 38
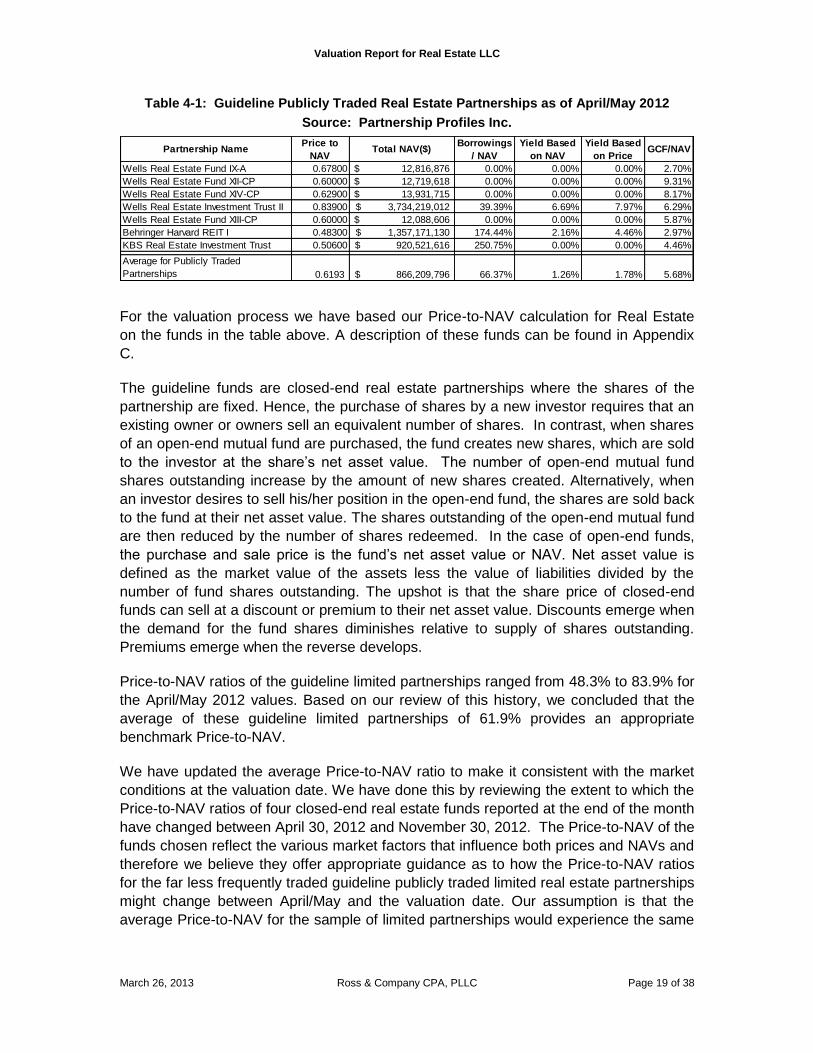
Table 4-1: Guideline Publicly Traded Real Estate Partnerships as of April/May 2012
Source: Partnership Profiles Inc.
For the valuation process we have based our Price-to-NAV calculation for Real Estate
on the funds in the table above. A description of these funds can be found in Appendix
C.
The guideline funds are closed-end real estate partnerships where the shares of the
partnership are fixed. Hence, the purchase of shares by a new investor requires that an
existing owner or owners sell an equivalent number of shares. In contrast, when shares
of an open-end mutual fund are purchased, the fund creates new shares, which are sold
to the investor at the share’s net asset value. The number of open-end mutual fund
shares outstanding increase by the amount of new shares created. Alternatively, when
an investor desires to sell his/her position in the open-end fund, the shares are sold back
to the fund at their net asset value. The shares outstanding of the open-end mutual fund
are then reduced by the number of shares redeemed. In the case of open-end funds,
the purchase and sale price is the fund’s net asset value or NAV. Net asset value is
defined as the market value of the assets less the value of liabilities divided by the
number of fund shares outstanding. The upshot is that the share price of closed-end
funds can sell at a discount or premium to their net asset value. Discounts emerge when
the demand for the fund shares diminishes relative to supply of shares outstanding.
Premiums emerge when the reverse develops.
Price-to-NAV ratios of the guideline limited partnerships ranged from 48.3% to 83.9% for
the April/May 2012 values. Based on our review of this history, we concluded that the
average of these guideline limited partnerships of 61.9% provides an appropriate
benchmark Price-to-NAV.
We have updated the average Price-to-NAV ratio to make it consistent with the market
conditions at the valuation date. We have done this by reviewing the extent to which the
Price-to-NAV ratios of four closed-end real estate funds reported at the end of the month
have changed between April 30, 2012 and November 30, 2012. The Price-to-NAV of the
funds chosen reflect the various market factors that influence both prices and NAVs and
therefore we believe they offer appropriate guidance as to how the Price-to-NAV ratios
for the far less frequently traded guideline publicly traded limited real estate partnerships
might change between April/May and the valuation date. Our assumption is that the
average Price-to-NAV for the sample of limited partnerships would experience the same
Wells Real Estate Fund IX-A 0.67800 12,816,876$ 0.00% 0.00% 0.00% 2.70%
Wells Real Estate Fund XII-CP 0.60000 12,719,618$ 0.00% 0.00% 0.00% 9.31%
Wells Real Estate Fund XIV-CP 0.62900 13,931,715$ 0.00% 0.00% 0.00% 8.17%
Wells Real Estate Investment Trust II 0.83900 3,734,219,012$ 39.39% 6.69% 7.97% 6.29%
Wells Real Estate Fund XIII-CP 0.60000 12,088,606$ 0.00% 0.00% 0.00% 5.87%
Behringer Harvard REIT I 0.48300 1,357,171,130$ 174.44% 2.16% 4.46% 2.97%
KBS Real Estate Investment Trust 0.50600 920,521,616$ 250.75% 0.00% 0.00% 4.46%
Average for Publicly Traded
Partnerships 0.6193 866,209,796$ 66.37% 1.26% 1.78% 5.68%
Partnership NamePrice to
NAVTotal NAV($)
Borrowings
/ NAV
Yield Based
on NAV
Yield Based
on PriceGCF/NAV
Valuation Report for Real Estate LLC
March 26, 2013 Ross & Company CPA, PLLC Page 20 of 38
magnitude of change as that experienced by the average Price–to-NAV of the more
frequently traded closed-end real estate funds.
We reviewed the Price-to-NAV ratios of an array of Closed-End Real Estate funds over
April 2012 to December 2012. The overall trend indicated that there was not a large
degree of dissimilarity between the April 30, 2012 and November 30, 2012 values.
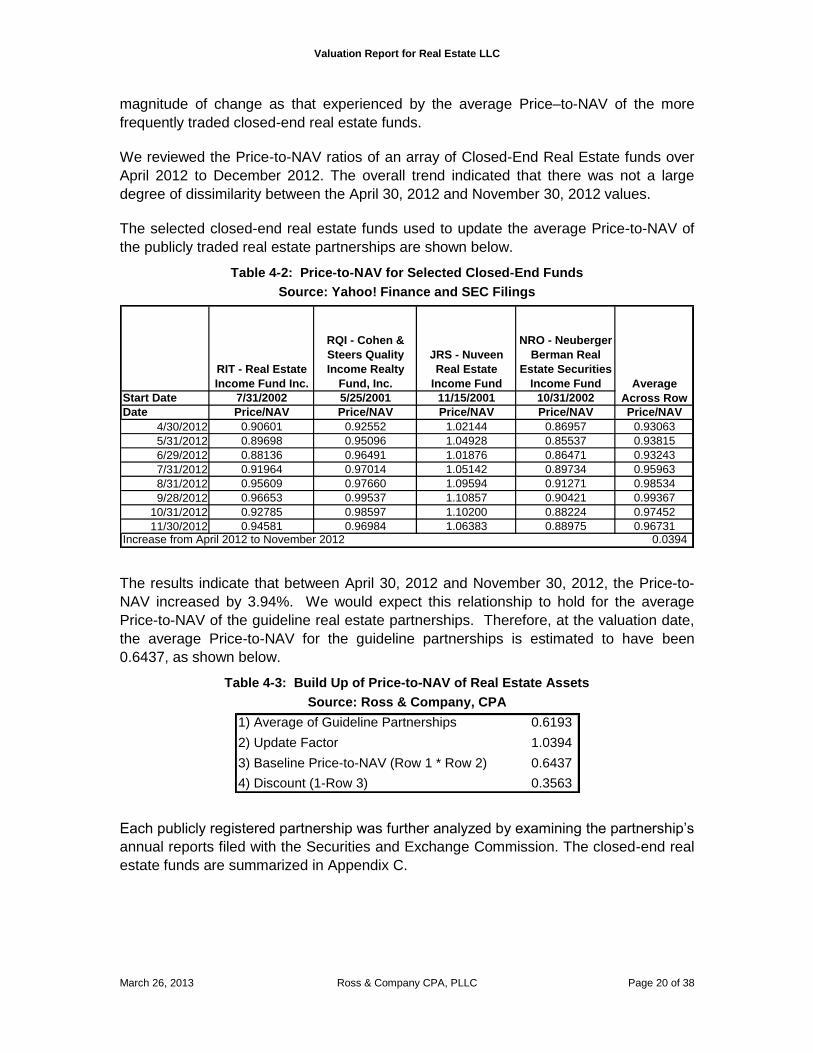
The selected closed-end real estate funds used to update the average Price-to-NAV of
the publicly traded real estate partnerships are shown below.
Table 4-2: Price-to-NAV for Selected Closed-End Funds
Source: Yahoo! Finance and SEC Filings
The results indicate that between April 30, 2012 and November 30, 2012, the Price-to-
NAV increased by 3.94%. We would expect this relationship to hold for the average
Price-to-NAV of the guideline real estate partnerships. Therefore, at the valuation date,
the average Price-to-NAV for the guideline partnerships is estimated to have been
0.6437, as shown below.
Table 4-3: Build Up of Price-to-NAV of Real Estate Assets
Source: Ross & Company, CPA
Each publicly registered partnership was further analyzed by examining the partnership’s
annual reports filed with the Securities and Exchange Commission. The closed-end real
estate funds are summarized in Appendix C.
RIT - Real Estate
Income Fund Inc.
RQI - Cohen &
Steers Quality
Income Realty
Fund, Inc.
JRS - Nuveen
Real Estate
Income Fund
NRO - Neuberger
Berman Real
Estate Securities
Income Fund
Start Date 7/31/2002 5/25/2001 11/15/2001 10/31/2002
Date Price/NAV Price/NAV Price/NAV Price/NAV Price/NAV
4/30/2012 0.90601 0.92552 1.02144 0.86957 0.93063
5/31/2012 0.89698 0.95096 1.04928 0.85537 0.93815
6/29/2012 0.88136 0.96491 1.01876 0.86471 0.93243
7/31/2012 0.91964 0.97014 1.05142 0.89734 0.95963
8/31/2012 0.95609 0.97660 1.09594 0.91271 0.98534
9/28/2012 0.96653 0.99537 1.10857 0.90421 0.99367
10/31/2012 0.92785 0.98597 1.10200 0.88224 0.97452
11/30/2012 0.94581 0.96984 1.06383 0.88975 0.96731Increase from April 2012 to November 2012 0.0394
Average
Across Row
1) Average of Guideline Partnerships 0.6193
2) Update Factor 1.0394
3) Baseline Price-to-NAV (Row 1 * Row 2) 0.6437
4) Discount (1-Row 3) 0.3563

Valuation Report for Real Estate LLC
March 26, 2013 Ross & Company CPA, PLLC Page 21 of 38
PRICE-TO-NAV CALCULATIONS3
Closed End Funds Used for Cash
As of December 31, 2012, Real Estate has a total of $209,119 in net cash (cash less
shareholders’ loan), as described in Section 2. For calculating the Price-to-NAV
discount, we found funds that invest in similar assets and calculated their average Price-
to-NAV discount.
For this analysis, we have used the following closed end funds as proxies.
1.) Federated Enhanced Treasury In (FTT) 2.) Alliance Bernstein Income Fund (ACG) 3.) Western/Claymore Infl-Lnk Opps (WIW) 4.) Western/Claymore Infl-Lnkd Sec (WIA) 5.) Western Asset Inflation Manage (IMF)
We believe that these funds represent an accurate estimate of the appropriate discount
needed when valuing the cash in Real Estate. They have been selected for the specific
holdings that best approximate the portfolio held by Real Estate.
In the following table, the average Price-to-NAV for the above funds is shown.
Table 4-4: Price-to-NAV Calculation for Cash as of 12/31/2012
Source: Ross & Company, CPA
PRICE-TO-NAV ANALYSIS
To select an appropriate Price-to-NAV ratio, we compared Real Estate’s investment
characteristics to the guideline partnerships.
3 Source: www.CEFConnect.com
Ticker Price NAVPrice to
NAVDiscount
FTT 14.30$ 15.81$ 90.45% 9.55%
ACG 8.45$ 9.42$ 89.70% 10.30%
WIW 13.13$ 14.90$ 88.12% 11.88%
WIA 13.04$ 14.71$ 88.65% 11.35%
IMF 18.63$ 20.12$ 92.59% 7.41%
Average
Price to
NAV:89.90%
Discount: 10.10%

Valuation Report for Real Estate LLC
March 26, 2013 Ross & Company CPA, PLLC Page 22 of 38
Table 4-5: Build-up of Price-to-NAV
Source: Ross & Company
Based on the above weighted average discount for minority interests, the appropriate
discount to apply to the overall limited liability minority interests is 31.69%.
The Lack of Marketability/Liquidity Discount
Before calculating the final value of a minority interest in Real Estate, we need to
develop an appropriate discount to reflect the fact that an economic interest in Real
Estate cannot be easily sold or converted into cash. This discount is referred to as the
liquidity or lack of marketability discount. A discussion of how this discount was arrived
at follows.
The liquidity discount reduces the ownership value to reflect the fact that the ownership
interest cannot be easily sold. Any potential buyer of the ownership value faces the risk
that he/she cannot sell the ownership interest in a timely way because there are a limited
number of potential buyers. This is to be contrasted to shares of stock that trade on the
New York Stock Exchange for example. These shares can be readily purchased and
sold and, except for rare cases, the price received will reflect the fair market value of
these shares. Thus, the liquidity discount reflects the additional risk that the buyer faces
because he/she may not be able to receive a price that would be obtained if ownership
interest in Real Estate were sold in a highly liquid market.
Although much has been written on the liquidity discount and several organizations have
routinely attempted to measure it, the values traditionally reported are far too high. The
reason is that what is reported as a marketability or liquidity discount is really a private
company discount. This private company discount reflects a number of factors that are
not related to lack of liquidity. The differences between private firm valuations and those
of public peers can occur because of differing cash flow growth prospects, timing of cash
flows and differing ratios of debt to equity. The result is that reported discounts for
Market Value Price to
NAV
Asset Class Adjustment (1 - Price to NAV
Discount) Real Estate Assets 50% interest in ABC properties $3,751,500 100% interest in Real Estate properties $593,350 Less: Debt and Other Liabilites $0 Net Real Estate Value $4,344,850 64.37% 35.63%
Cash $239,588 Less: Security Deposits Payable $30,469 Net Cash $209,119 89.90% 10.10%
Net Asset Value $4,553,969 68.31% 31.69%

Valuation Report for Real Estate LLC
March 26, 2013 Ross & Company CPA, PLLC Page 23 of 38
marketability are too high and private company valuations that use them are too low.
The table below offers evidence of the variation in private company discounts.
Table 4-6: Representative Studies That Attempt to Measure the Liquidity Discount
Source: Ross & Company
Author(s)
Peer
Review Discount Reported Dispersion Type of Study
William Silber Yes 35% 14% for large creditworthy companies; 50% for small firms with negative earnings
Restricted stock study
M. Hertzel and Richard Smith
Yes Not Reported .2 % - 43.7 % Private Equity Study
John Emory Yes 47% Not Reported Pre-IPO Study
John Koeplin et.al. Yes 20.39% Depending on the multiple used, discount varied from 0% based on sales revenue to 28.26% using the ratio of Enterprise Value to EBIT
Identified all acquisitions of private firms from 1984 to 1998
Willamette Associates
No 40.1% Wide dispersion from a premium to a maximum discount of 99%
Pre-IPO Study
Two of the two major studies that valuation experts often reference when developing a
marketability discount were reviewed in a 2002 article in the Business Valuation Review
by me. The author concludes the following:
□ Recent research seems to suggest that the size of the marketability
discount is in the neighborhood of 13.5% and more recent work has
suggested it is as low as 7.23%. The regression models of Silber, and
Hertzel and Smith have provided both the intellectual and empirical basis
for these conclusions. These models were initially developed to study the
determinants of the marketability discount. It has been suggested that they
should now be used as a basis for forecasting the marketability discount.
This paper demonstrates that these models should not be used for this
purpose because the forecast errors are likely to be large. Moreover,
based on the structure of these models and their prediction errors, it is not
possible to state with any certainty that a 13.5% marketability discount is
statistically different than a discount of say 25%. 4
Our analysis indicates that the range within which the “true” marketability discount lies is
quite wide, although the range is a function of a number of critical factors including firm
size, and the level of interest rates at the valuation date. While the focus of Feldman’s
article is on the research of Silber and Hertzel and Smith, the analysis is equally
applicable to the studies conducted by Emory and Willamette Associates.
The Willamette results are the best known and as can be seen are generally consistent
with those reported by other researchers. The problem with Willamette’s results is that
4 Stanley J. Feldman, A Note on Using Regression Models to Predict the Marketability
Discount, Business Valuation Review, September, 2002, p.145.

Valuation Report for Real Estate LLC
March 26, 2013 Ross & Company CPA, PLLC Page 24 of 38
their data is proprietary and Willamette has not disclosed this information for peer review
and analysis by academic researchers. This is an important qualification. This creates
the potential that the empirical work presented may simply be fraught with errors. The
peer review process, while it does not completely remove this possibility, nevertheless,
minimizes the potential for drawing incorrect conclusions due to errors related to
measurement, research design, and statistical method. It is particularly important to
utilize peer-reviewed research when one is valuing a private asset since many of the
issues that arise have been addressed by finance scholars and for which there is a well-
developed academic literature.
Based on Ross & Company’s review of this research, we believe that a starting point for
developing an appropriate marketability discount is 20 to 25%. This conclusion is based
on two factors. First, the research controls for capital structure differences. Second,
selection of the private company’s public company peer was dictated by whether they
were in the same four- digit SIC industry. In addition, the 20% starting point appears to
be consistent with other academic research.
In a study by Sanger and McConnell5 that measured the increase in share return
occurring when a stock is listed on an exchange. The hypothesis is that improved
liquidity emerges by exchange listing since the shares are now available to a larger
group of investors. This results in permanent increase in the share price, which reflects
the incremental return to increased marketability. Alternatively, one would also expect
the stock price to fall if shares were de-listed. Their research first focuses on firms that
were traded on the OTC, prior to the existence of the NASDAQ. The researchers wanted
to estimate the size of the average incremental return that occurs when an OTC stock
was listed on an exchange during the pre-NASDAQ period. Their results indicate that
during the pre-NASDAQ period, the incremental return due to increased liquidity was
25.68%. This translates into a discount of approximately 20%6, interestingly about what
Koeplin reports using a completely different research methodology, different sample, and
covering a different time frame. Moreover, Koeplin’s research measured marketability
discount for controlled transactions, which presumably would be subject to greater
marketability discount due to large size than a minority interest, which is what is being
measured in the Sanger and McConnell study.
Edelman and Baker7 extend the work of Sanger and McConnell by examining the market
behavior of common stocks transferring from the NASDAQ stock market to the New
York Stock Exchange. With some caveats, their results suggest that low volume (low
liquidity) NASDAQ stocks seem to increase in price when they switch to the New York
5 Gary C. Sanger and John J. McConnell, Stock Exchange Listings, Firm Value, and Security Market
Efficiency: The Impact of NASDAQ, The Journal of Financial and Quantitative Analysis, Volume 21,
Issue 1 (March, 1986), pp. 1-25. 6 Assume that the share price before switch was $100. After the switch the price is $125.68. If the switch
were reversed, the price would decline from a $125.68 to $100 or a discount of approximately 20
%(25.68/125.68 = 20.4%). 7 Richard B. Edelman and H. Kent Baker, The Impact of Company Pre-Listing Attributes on the Market
Reaction to NYSE Listings, The Financial Review, Vol. 28 No. 3, August, 1993, pp. 431-448.
Valuation Report for Real Estate LLC
March 26, 2013 Ross & Company CPA, PLLC Page 25 of 38
Stock Exchange, while high volume (high liquidity) NASDAQ stocks that switch do not. In
fact, the results indicate these stocks actually decline in price subsequent to the switch.
This suggests that the incremental return of 25.86% reported by Sanger and McConnell
might in fact be a good deal higher for relatively low volume OTC stocks. Although not
statistically significant, Edelman and Baker report that low volume NASDAQ stocks that
move to the New York Stock Exchange generally earn average incremental returns of
6.3%. While recognizing that this incremental return may result from more than just
marketability, it does, nevertheless, suggest that low liquidity stocks that switch to a
larger and better known exchange are likely to register permanent price gains. Based on
these results, we conclude the following about the size of marketability discounts.
□ Research seems to suggest that a base marketability discount should not
exceed 20%.
□ Increments above this 20% base should reflect unique characteristics of
the interests being valued. For example, one would expect that firms
whose shares were restricted in terms of the number and types of owners
would be subject to an additional discount. S corporations, in contrast to
their C counterparts, are characterized by these limitations, and therefore
one would expect shares of S corporations to carry a greater marketability
discount than shares of equivalent C corporations. Limited Partnerships
also have limitations that could carry a greater marketability discount.
□ Based on the Edelman study, one can think of S shares being analogous
to low volume C shares that move from a less to a more liquid exchange.
S shares have relatively lower trade volume than like C shares because
restrictions limit the market for them and therefore they are less liquid than
their C counterparts. The incremental 6.27% Edelman reports that
emerges when low volume NASDAQ stocks switch to the New York Stock
Exchange translates into a discount of about 6%. Edelman points out that
a percentage of this incremental return is unrelated to improvements in
marketability but related to signaling- investor’s expectations that the firm
has better prospects than initially thought prior to the exchange move. This
means that the pure liquidity effect, which we are attempting to measure,
is lower than 6.27%. Edelman states, but does not show, that signaling is
the more dominant attribute. We conclude that the incremental return to
liquidity is about 3.14%, or about half of the reported 6.27%. This
translates to an incremental discount of 3%. Because S shares are less
marketable than low volume C shares used in the Edelman study, we
conclude that the incremental discount for these is an additional 2% for a
total discount of 5%.
Discounts for lack of marketability in excess of the additional 5% already noted are
based on incremental restrictions on the sale of shares that need to be valued. The S
corporation form has a number of restrictions, including the number of shareholders and
the types of shareholders. We have applied a 5% discount to the minority interest
because of the S corporation restrictions on transfers of minority interests in addition to

Valuation Report for Real Estate LLC
March 26, 2013 Ross & Company CPA, PLLC Page 26 of 38
the 20% marketability discount from the Koeplin study. Thus, the marketability discount
for this minority interest is 25%.
THE VALUE OF THE MINORITY INTEREST
The value of the minority interest in Real Estate is calculated in the table below.
Table 4-7: Valuation of the Minority interest as of December 31, 2012
Source: Ross & Company
Since the limited partnership data used to convert the net asset value to the price of an
economic interest was based on Price-to-NAV of minority interests, no further discount
for lack of control is needed.
Value of a 1 Percent Minority Interest in Real Estate LLC Source/Formula As of 12/31/2012 1) Net Asset Value of Real Estate LLC Table 2-3 Net Asset Value 4,553,969 $
2) Value of a 1% Minority Interest Before Discounts Row 1 * 1% 45,540 $
3) Calculation of Discount Due to Lack of Control Table 4-5 Price to NAV Discount 31.69% 4) Reduction in Value due to Lack of Control Discount Row 2 * Row 3 14,432 $
5) Adjusted Net Asset Value (non-controlling, marketable basis) Row 2 - Row 4 31,180 $
6) Estimated Discount for Lack of Marketability and Transfer Restrictions Section 4 25.00% 7) Reduction in Value due to Lack of Marketability and Transfer Restrictions Discount Row 5 * Row 6 7,777 $
8) Fair Market Value of a 1% Minority Interest (on a non-controlling, non-marketable basis) Row 5 - Row 7 23,403 $

Valuation Report for Real Estate LLC
March 26, 2013 Ross & Company CPA, PLLC Page 27 of 38
APPENDIX A: PROFESSIONAL QUALIFICATIONS
GLEN A. ROSS, CPA CVA
Mr. Ross graduated from Long Island University-CW Post Campus in 1992 with a Bachelor of Science Degree. He received his CPA designation-New York State licensure in 1998 and received his Certified Valuation Analyst (CVA) designation in 2003. Mr. Ross is a member of the New York State Society of Certified Public Accountants, the National Conference of Certified Public Accounting Practitioners and the National Association of Certified Valuation Analysts. Mr. Ross has worked for the CPA firm of Ross & Ross, CPA since 1992 and became a Partner of said firm in 1998. In 2005, the firm changed names to Ross & Company CPA, PLLC. He has been active in fundraising for L.I. Cares, an organization dedicated to fighting hunger on Long Island, and has fed hundreds of families over the past few years. In 1999, Mr. Ross founded an online interactive advertising company. He acted as President and CEO of the company until it was sold in 2001. Also since 2001, Mr. Ross has been a member of the Executive Advisory Board of AccountStreet. This company provides specialized services to the accounting industry and CPAs. In 2003 and 2004 Mr. Ross lectured on business valuations. His course, Understanding & Using Business Valuations, is approved for both CPE and CLE credit. Mr. Ross has specialized knowledge and experience in the following industries and areas:
Valuations of various entities and professional licenses including litigation support services.
Forensic accounting in the determination of fraud and true economic value.
Vast experience in taxation, tax planning and management advisory services for small, closely held businesses, new start-ups and going concern entities.
Financial statement presentation and support.
Computer consulting and integrated systems analysis. Mr. Ross has worked on many major projects over the years including, but not limited to:
Conducted and/or assisted in over 100 valuation engagements consisting of: Matrimonial disputes of closely held businesses, valuations of professional licenses, valuations of closely held businesses for estate taxes, gifting, buy/sell agreements and ESOPs.
Mr. Ross was a Beta tester for “ValueSource Pro 2003” from John Wiley & Sons. This program is the leading valuation and financial analysis software in the country.
Mr. Ross has prepared and/or analyzed financial statement projections and related analysis for start-up organizations and/or going concern entities.
Since 1991, Mr. Ross has performed and/or assisted in over 100 certified audits for closely held businesses.

Valuation Report for Real Estate LLC
March 26, 2013 Ross & Company CPA, PLLC Page 28 of 38
APPENDIX B: REAL ESTATE INFORMATION
Table B-1: Real Estate Balance Sheet
Source: Real Estate & ABC Federal Tax Returns and Ross & Company
Table B-2: Real Estate Rental Real Estate Income and Expense
Source: Real Estate & ABC 2011 Federal Tax Return and Ross & Company
Concepts Line Assets 2011
1 Cash $864,023
9a Buildings and other depreciable assets $661,140
9b Less accumulated depreciation $401,296
9b Net Buildings and other depreciable assets $259,844
11 Land (net of any amortization) $119,657
14 Total Assets $1,243,524 Liabilities and Shareholder's Equity
20 Other liabilities $46,238
21 Partners’ capital $1,197,286
22 Total liabilities and capital $1,243,524
End of Tax Year
2011 Gross Rents $457,907
Expenses: Insurance $3,550 Other expenses $150,217 Taxes $117,108 Depreciation $23,059
Total Expenses $293,934
Net Rental Real Estate Income $163,973

Valuation Report for Real Estate LLC
March 26, 2013 Ross & Company CPA, PLLC Page 29 of 38
APPENDIX C: CLOSED END FUND DESCRIPTIONS
Table C-1: Closed End Fund Descriptions
Source: Bloomberg
Name (Ticker) Description
Cohen & Steers Qty Inc Realty (RQI)
Cohen & Steers Quality Income Realty Fund, Inc. is a non-diversified, closed-end management investment company incorporated in the USA. The Fund's objective is high current income. The Fund invests at least 90% of its total assets in common stocks, preferred stocks and other equity securities issued by real estate companies, such as 'real estate investment trusts.'
Nuveen Real Estate Income (JRS)
Nuveen Real Estate Income Fund is a non-diversified, closed-end management investment company incorporated in the USA. The Fund's objective is high current income with capital appreciation as a secondary objective. The Fund invests 90% of its assets in income producing common stocks, preferred stocks, convertible preferred stocks and debt securities issued by real estate companies.
LMP Real Estate Income (RIT)
LMP Real Estate Income Fund Inc. is a non-diversified, closed-end management investment company incorporated in the USA. The Fund's objective is high current income. The Fund invests at least 90% of its total assets in income-producing common shares, preferred shares, convertible preferred shares and debt securities of Real Estate Companies.
Neuberger Berman Real Est Sec (NRO)
Neuberger Berman Real Estate Securities Income Fund Inc is a closed-end management investment company incorporated in the USA. The Fund's investment objective is high current income, as well as capital appreciation. The Fund invests 90% of its total assets in income-producing common equity securities, preferred securities, securities convertible into equity securities and REITs.
FEDERATED ENHANCED TREASURY (FTT)
Federated Enhanced Treasury Income Fund is a closed-end fund incorporated in the USA. The Fund's objective is to provide current income with total return as a secondary objective. The Fund invests in a portfolio of U.S. Treasury securities and U.S. Government Agency securities.

Valuation Report for Real Estate LLC
March 26, 2013 Ross & Company CPA, PLLC Page 30 of 38
ALLIANCEBERNSTEIN INC FUND (ACG)
ACM Income Fund, Inc. is a diversified, closed-end management investment company incorporated in the USA. The Fund's objective is high current income consistent with the preservation of capital. The Fund invests principally in US government obligations. The Fund may also invest a portion of its assets in other fixed income securities, including those issued by foreign governments.
WA/CLAY US INFL-LKD OPP&INC (WIW)
Western Asset/Claymore Inflation-Linked Opportunities & Income Fund is a diversified, closed-end management investment company incorporated in the USA. The Fund's objective is current income and capital appreciation. The Fund invests at least 80% of its total managed assets in inflation-linked securities.
WA/CLAY US INFL-LKD SEC&INC (WIA)
Western Asset/Claymore Inflation-Linked Securities & Income Fund is a diversified, closed-end management investment company incorporated in the USA. The Fund's primary investment objective is to provide current income. The Fund will invest at least 80% of its total assets in inflation-linked securities.
WESTERN ASSET INFLATION MANA (IMF)
Western Asset Inflation Management Fund Inc. is a newly organized, non-diversified closed-end management investment company incorporated in the USA. The Fund's primary investment objective is total return. Under normal market conditions, the Fund will invest 80% of its Managed Assets in inflation-protected securities issued by US and non-US governments.
Table C-2: Real Estate Partnership Descriptions
Source: PartnershipProfiles.com
Wells Real Estate Fund
IX-A
Wells Real Estate Fund IX, L.P. (the "Partnership") is a
Georgia public limited partnership with Leo F. Wells, III
and Wells Partners, L.P. ("Wells Partners"), a Georgia
nonpublic limited partnership, serving as its general
partners (collectively, the "General Partners"). Wells
Capital, Inc. ("Wells Capital") serves as the corporate
general partner of Wells Partners. Wells Capital is a
wholly owned subsidiary of Wells Real Estate Funds, Inc
("WREF"). Leo F. Wells, III is the president and sole
director of Wells Capital and the sole director and sole
owner of WREF. The Partnership was formed on
August 15, 1994, for the purpose of acquiring,
Valuation Report for Real Estate LLC
March 26, 2013 Ross & Company CPA, PLLC Page 31 of 38
developing, constructing, owning, operating, improving,
leasing, and managing income-producing commercial
properties for investment purposes. Upon subscription,
limited partners elected to have their units treated as
Class A Units or Class B Units. Limited partners have the
right to change their prior elections to have some or all of
their units treated as Class A or Class B Units one time
during each quarterly accounting period. Limited partners
may vote to, among other things: (a) amend the
partnership agreement, subject to certain limitations; (b)
change the business purpose or investment objectives of
the Partnership; (c) add or remove a general partner; (d)
elect a new general partner; (e) dissolve the Partnership;
(f) authorize a merger or a consolidation of the
Partnership; and (g) approve a sale involving all or
substantially all of the Partnership's assets, subject to
certain limitations. A majority vote on any of the above-
described matters will bind the Partnership without the
concurrence of the General Partners. Each limited
partnership unit has equal voting rights regardless of
class. On January 5, 1996, the Partnership commenced a
public offering of up to $35,000,000 of Class A or Class B
limited partnership units ($10.00 per unit) pursuant to a
Registration Statement filed on Form S-11 under the
Securities Act. The offering was terminated on December
30, 1996, at which time the Partnership had sold
approximately 2,935,931 Class A Units and 564,069
Class B Units, representing total limited partner capital
contributions of $35,000,000.
Wells Real Estate Fund
XII-CP
Wells Real Estate Fund XII, L.P. (the "Partnership," "we,"
"our" and "us") is a Georgia public limited partnership
having Leo F. Wells, III and Wells Partners, L.P. ("Wells
Partners"), a Georgia nonpublic limited partnership,
serving as its general partners (collectively, the "General
Partners"). Wells Capital, Inc. ("Wells Capital") serves as
the corporate general partner of Wells Partners. Wells
Capital is a wholly owned subsidiary of Wells Real Estate
Funds, Inc. ("WREF"). Leo F. Wells, III is the president
and sole director of Wells Capital and the sole director
and sole owner of WREF. The Partnership was formed on
September 15, 1998, for the purpose of acquiring,
developing, constructing, owning, operating, improving,
leasing and managing income-producing commercial
properties for investment purposes. Upon subscription,
limited partners elected to have their units treated as

Valuation Report for Real Estate LLC
March 26, 2013 Ross & Company CPA, PLLC Page 32 of 38
Cash Preferred Units or Tax Preferred Units. Thereafter,
limited partners have the right to change their prior
elections to have some or all of their units treated as
Cash Preferred Units or Tax Preferred Units one time
during each quarterly accounting period ("conversion
elections"). Limited partners may vote to, among other
things, (a) amend the partnership agreement, subject to
certain limitations; (b) change our business purpose or
investment objectives; (c) add or remove a general
partner; (d) elect a new general partner; (e) dissolve the
Partnership; (f) authorize a merger or a consolidation of
the Partnership; and (g) approve a sale involving all or
substantially all of our assets, subject to certain
limitations. A majority vote on any of the matters
described above will bind the Partnership without the
concurrence of the General Partners. Each limited
partnership unit has equal voting rights regardless of
class. On September 15, 1998, the Partnership was
organized under the laws of the state of Georgia. On
March 22, 1999, we commenced an offering of up to
$70,000,000 of Cash Preferred or Tax Preferred limited
partnership units ($10.00 per unit) pursuant to a
Registration Statement filed on Form S-11 under the
Securities Act. The offering was terminated on March 21,
2001, at which time we had sold approximately 2,688,861
Cash Preferred Units and 872,258 Tax Preferred Units for
total limited partner capital contributions of $35,611,192.
Wells Real Estate Fund
XIV-CP
Wells Real Estate Fund XIV, L.P. (the "Partnership," "we,"
"our" or "us") is a Georgia public limited partnership with
Leo F. Wells, III and Wells Capital, Inc. ("Wells Capital"),
a Georgia corporation, serving as its general partners
(collectively, the "General Partners"). Wells Capital is a
wholly owned subsidiary of Wells Real Estate Funds, Inc.
("WREF"). Leo F. Wells, III is the president and sole
director of Wells Capital and the sole director and sole
owner of WREF. The Partnership was formed on
October 25, 2002, for the purpose of acquiring,
developing, owning, operating, improving, leasing, and
managing income-producing commercial properties for
investment purposes. Upon subscription, limited partners
elected to have their units treated as Cash Preferred
Units or Tax Preferred Units. Thereafter, limited partners
have the right to change their prior elections to have
some or all of their units treated as Cash Preferred Units
or Tax Preferred Units one time during each quarterly

Valuation Report for Real Estate LLC
March 26, 2013 Ross & Company CPA, PLLC Page 33 of 38
accounting period ("conversion elections"). Limited
partners may vote to, among other things: (a) amend the
partnership agreement, subject to certain limitations; (b)
change our business purpose or investment objectives;
(c) add or remove a general partner; (d) elect a new
general partner; (e) dissolve the Partnership; (f) authorize
a merger or a consolidation of the Partnership; and
(g) approve a sale involving all or substantially all of our
assets, subject to certain limitations. A majority vote on
any of the described matters will bind the Partnership,
without the concurrence of the General Partners. Each
limited partnership unit has equal voting rights, regardless
of the class of the unit. On May 14, 2003, we commenced
an offering of up to $45,000,000 of Cash Preferred or Tax
Preferred limited partnership units ($10.00 per unit)
pursuant to a Registration Statement filed on Form S-11
under the Securities Act. The offering was terminated on
April 30, 2005, at which time we had sold approximately
2,531,031 Cash Preferred Units and 943,093 Tax
Preferred Units representing total limited partner capital
contributions of $34,741,238.
Wells Real Estate
Investment Trust II
Wells Real Estate Investment Trust II, Inc. ("Wells REIT
II") is a Maryland corporation that has elected to be taxed
as a real estate investment trust ("REIT") for federal
income tax purposes. Wells REIT II engages in the
acquisition and ownership of commercial real estate
properties, including properties that are under
construction, are newly constructed, or have operating
histories. Wells REIT II was incorporated on July 3, 2003,
and commenced operations on January 22, 2004. Wells
REIT II conducts business primarily through Wells
Operating Partnership II, L.P. ("Wells OP II"), a Delaware
limited partnership. Wells REIT II is the sole general
partner of Wells OP II, and Wells OP II LP, LLC, a wholly
owned subsidiary of Wells REIT II, is the sole limited
partner of Wells OP II. Therefore, Wells REIT II owns
100% of the equity interests in, and possesses full legal
control and authority over, the operations of Wells OP II.
Wells OP II acquires, develops, owns, leases, and
operates real properties directly, through wholly owned
subsidiaries, or through joint ventures. References to
Wells REIT II, "we," "us," or "our" herein shall include
Wells REIT II and all subsidiaries of Wells REIT II, direct
and indirect, and consolidated joint ventures. We typically
invest in high-quality, income-generating office properties

Valuation Report for Real Estate LLC
March 26, 2013 Ross & Company CPA, PLLC Page 34 of 38
leased to creditworthy companies and governmental
entities. As of December 31, 2011, we owned interests in
71 office properties and one hotel, which include 93
operational buildings, comprising approximately 22.6
million square feet of commercial space located in 23
states; the District of Columbia; and Moscow, Russia. Of
these office properties, 68 are wholly owned and three
are owned through consolidated joint ventures. As of
December 31, 2011, the office properties were
approximately 93.9% leased.
Wells Real Estate Fund
XIII-CP
Wells Real Estate Fund XIII, L.P. (the "Partnership," "we,"
"our" and "us") is a Georgia public limited partnership with
Leo F. Wells, III and Wells Capital, Inc. ("Wells Capital"),
a Georgia corporation, serving as its general partners
(collectively, the "General Partners"). Wells Capital is a
wholly owned subsidiary of Wells Real Estate Funds, Inc.
("WREF"). Leo F. Wells, III is the president and sole
director of Wells Capital and the sole director and sole
owner of WREF. The Partnership was formed on
September 15, 1998, for the purpose of acquiring,
developing, owning, operating, improving, leasing, and
managing income-producing commercial properties for
investment purposes. Upon subscription for units, limited
partners elected to have their units treated as Cash
Preferred Units or Tax Preferred Units. Thereafter, limited
partners have the right to change their prior elections to
have some or all of their units treated as Cash Preferred
Units or Tax Preferred Units one time during each
quarterly accounting period ("conversion elections").
Limited partners may vote to, among other things: (a)
amend the partnership agreement, subject to certain
limitations; (b) change our business purpose or
investment objectives of the Partnership; (c) add or
remove a general partner; (d) elect a new general
partner; (e) dissolve the Partnership; (f) authorize a
merger or a consolidation of the Partnership; and
(g) approve a sale involving all or substantially all of our
assets, subject to certain limitations. A majority vote on
any of the described matters will bind the Partnership
without the concurrence of the General Partners. Each
limited partnership unit has equal voting rights, regardless
of which class of unit is selected. On March 29, 2001, we
commenced an offering of up to $45,000,000 of Cash
Preferred or Tax Preferred limited partnership units
($10.00 per unit) pursuant to a Registration Statement

Valuation Report for Real Estate LLC
March 26, 2013 Ross & Company CPA, PLLC Page 35 of 38
filed on Form S-11 under the Securities Act of 1933. The
offering was terminated on March 28, 2003, at which time
we had sold approximately 3,023,371 Cash Preferred
Units and 748,678 Tax Preferred Units, representing total
limited partner capital contributions of $37,720,487.
Behringer Harvard REIT
I
Behringer Harvard Opportunity REIT I, Inc. (which may be
referred to as the "Company," "we," "us," or "our") was
incorporated in November 2004 as a Maryland
corporation and has elected to be taxed, and currently
qualifies, as a real estate investment trust ("REIT") for
federal income tax purposes. We operate commercial real
estate or real estate-related assets located in and outside
the United States on an opportunistic basis. In particular,
we have focused on acquiring properties with significant
possibilities for short-term capital appreciation, such as
those requiring development, redevelopment, or
repositioning, or those located in markets and submarkets
with higher volatility, lower barriers to entry, and high
growth potential. We completed our first property
acquisition in March 2006, and, as of December 31, 2010,
we were invested in 21 assets including 11 wholly owned
properties and four consolidated properties through
investments in joint ventures. In addition, we are the
mezzanine lender for one multifamily property. We also
have non-rties that are accounted for using the equity
method. Our investment properties are located in Arizona,
California, Colorado, Minnesota, Missouri, Nevada,
Texas, the Commonwealth of The Bahamas, London,
England, the Czech Republic, Poland, Hungary, and
Slovakia. During the year ended December 31, 2010,
pursuant to a deed-in-lieu of foreclosure, we transferred
ownership of Ferncroft Corporate Center, located in
Middleton, Massachusetts, to the lender associated with
this property.

Valuation Report for Real Estate LLC
March 26, 2013 Ross & Company CPA, PLLC Page 36 of 38
KBS Real Estate
Investment Trust
KBS Real Estate Investment Trust, Inc. (the “Company”)
is a Maryland corporation that was formed on
June 13, 2005 to invest in a diverse portfolio of real estate
properties and real estate-related investments. The
Company elected to be taxed as a real estate investment
trust (“REIT”) beginning with the taxable year ended
December 31, 2006 and it intends to operate in such a
manner. As used herein, the terms “we,” “our” and “us”
refer to the Company and as required by context, KBS
Limited Partnership, a Delaware limited partnership,
which we refer to as our “Operating Partnership,” and to
their subsidiaries. We own substantially all of our assets
and conduct our operations through our Operating
Partnership, of which we are the sole general partner.
Subject to certain restrictions and limitations, our
business is managed by KBS Capital Advisors LLC (“KBS
Capital Advisors”), our external advisor, pursuant to an
advisory agreement. Our advisor owns 20,000 shares of
our common stock. We have no paid employees.
Valuation Report for Real Estate LLC
March 26, 2013 Ross & Company CPA, PLLC Page 37 of 38
APPENDIX D: CERTIFICATION AND CONDITIONS
APPRAISAL CERTIFICATION
We hereby certify the following statements regarding this business valuation:
□ We have not personally inspected the assets, properties, or business interests encompassed by this appraisal.
□ We have no present or prospective future interest in the assets, properties, or business interests that are the subject of this business valuation.
□ We have no personal interest or bias with respect to the subject matter of this report or the parties involved.
□ Our compensation for making the appraisal is in no way contingent upon the value reported or upon any predetermined value.
□ To the best of our knowledge and belief, the statements of facts contained in this report, upon which the analyses, conclusions, and opinions expressed herein are based, are true and correct
□ Our analyses, opinions, and conclusions were developed, and this report has been prepared, in conformity with the Uniform Standards of Professional Appraisal Practice, as promulgated by The Appraisal Foundation, except where noted.
□ Subject to certain limitations the reported analyses, opinions, and conclusions were developed, and this report has been prepared, in conformity with the requirements of the Code of Professional Ethics and the Standards of Professional Appraisal Practice of The Appraisal Institute, of the American Society of Appraisers, and of the other professional organizations, unless otherwise stated.
□ We have not performed a historical analysis of the business’s financial statements. We assume that the financial and related information supplied by the firm’s representative reflects the normal operation of the business. To the extent this is not an accurate representation, the analysis and conclusions drawn are not valid and shall not be represented in any context that implicitly or explicitly suggests that Ross & Company and its representatives believe the business valuation to be accurate.

Valuation Report for Real Estate LLC
March 26, 2013 Ross & Company CPA, PLLC Page 38 of 38
STATEMENT OF CONTINGENT AND LIMITING CONDITIONS
This appraisal is made subject to these general contingent and limiting conditions:
□ We assume no responsibility for the legal description or matters including legal or title
considerations. Title to the subject assets, properties, or business interests is assumed to be good and marketable unless otherwise stated.
□ The subject assets, properties, or business interests are appraised free and clear of any or all liens or encumbrances unless otherwise stated.
□ We assume responsible ownership and competent management with respect to the subject assets, properties, or business interests
□ The information furnished by others is believed to be reliable. However, we issue no warranty or other form of assurance regarding its accuracy.
□ We assume no hidden or unapparent conditions regarding its accuracy.
□ We assume that there is full compliance with all applicable federal, state, and local regulations and laws unless the lack of compliance is stated, defined, and considered in the appraisal report.
□ We assume that all required licenses, certificates of occupancy, consents, or legislative or administrative authority from any local, state, or national government, or private entity or organization have been or can be obtained or reviewed for any use on which the opinion contained in this report is based.
□ Unless otherwise stated in this report, we did not observe, and we have no knowledge of, the existence of hazardous materials with regard to the subject assets, properties, or business interests. However, we are not qualified to detect such substances. We assume no responsibility for such conditions or for any expertise required to discover them.
□ Possession of this report does not carry with it the right of publication. It may not be used for any purpose by any person other than the client whom it is addressed without our written consent and, in any event, only with proper written qualifications and only its entirety.
□ We, by reason of this opinion, are not required to furnish a complete valuation report, or to give testimony, or to be in attendance in court with reference to the assets, properties, or business interests in question unless arrangements have been previously made.
□ Neither all nor any part of the contents of this report shall be disseminated to the public through advertising, public relations, news, sales, or other media without our prior written consent and approval.
□ The analyses, opinions, and conclusions presented in this report apply to this engagement only and may not be used out of context presented herein. This report is valid only for the effective date(s) specified herein and only for the purpose(s) specified herein.