Embed Size (px)
Citation preview

ANNUAL REPORT 2016/17
VALUE INVESTING
CEYLON GUARDIAN INVESTMENT TRUST PLC

www.carsoncumberbatch.com
ContentsKey Highlights 2
Chairperson’s Statement 3
Management Discussion and Analysis 6
Risk Management 24
Profiles of the Directors 31
Management Team 34
Sustainability Report 36
Annual Report of the Board of Directors on the affairs of the Company 40
Audit Committee Report 53
Related Party Transactions Review Committee Report 55
Financial Calendar 58
Independent Auditors’ Report 59
Statement of Profit or Loss and Other Comprehensive Income 60
Statement of Financial Position 61
Statement of Changes In Equity 62
Statement of Cash Flows 64
Notes to the Financial Statements 65
Five Year Summary 118
US$ Financials 120
Information to Shareholders and Investors 126
Notice of Meeting 128
Form of Proxy 131

Ceylon Guardian Investment Trust PLC has grown to become a leading name in investment and wealth creation, serving a diversity of corporate and individual clients with opportunities for intelligent, high quality investments that promise growing value and consistent returns in the medium to long term.
The year under review in this report has been a complex one, yet your company has succeeded in expanding our existing portfolio,working through an uncertain business environment to deliver good results yet again. We are pleased to report a strong balance sheet in this review with a 9.10% growth in our actively managed portfolios for the year in a market that remained flat, as we steadily add to the value we create with the thousands of investors, business partners and other stakeholders whose loyalty and confidence lies at the core of our success.
Value Investing
Ceylon Guardian Investment Trust PLC is the holding company of the investment business of the Carson Cumberbatch Group. As an investment house it is engaged in managing portfolios of multiple asset classes for varied groups of investors, thus providing valued investment solutions to suit their risk appetite. The Guardian Group holds an investment portfolio worth approximately Rs. 18.7 billion as at the end of March 2017. This portfolio comprises equity stakes in some of Sri Lanka’s most successfully run blue chip companies that have been built up for future value creation; as well as an actively traded portfolio to capitalize on short term market movements.

Ceylon Guardian Investment Trust PLC Annual Report 2016/17 2 3
Growth of 101% for the year arising from increased revenue
Earnings per share
Rs. 11.59
Consist of strategic and discretionary investments
Value of total group portfolio with cash
Rs.18.39Bn
Appreciation of 33% for the year
Dividend per share
Rs. 4.00
Key HighlightsIn Rupees Thousands
For the year ended / As at 31st March 2017 2016 Change %
Revenue 1,742,298 1,176,326 48 Profit from operations 1,274,540 637,645 100 Share of profit of equity accounted investee net of tax 2,747 4,809 (43)Profit before taxation 1,277,460 642,073 99 Profit for the year 1,256,334 611,200 106 Profit attributable to equity holders of the parent company 1,028,750 512,879 101 Other comprehensive expense for the year (1,857,885) (8,136,749) (77)Total comprehensive expense for the year (601,551) (7,525,549) (92)Total comprehensive expense attributable to equity holders of the parent (469,811) (6,179,746) (92)
Net cash generated from / (used in) operating activities 698,375 (402,412) (274)Total equity attributable to equity holders of the parent 15,405,749 16,137,296 (5)Total equity 18,620,605 19,551,988 (5)Total assets 18,802,188 19,783,461 (5)
Return on ordinary shareholders funds (%) 6.68 3.18 110 Earnings per share (Rs) 11.59 5.78 101 Dividend per share (Rs) * 4.00 3.00 33 Net assets per ordinary / deferred share (Rs) 173.53 181.77 (5)
Guardian actively managed Portfolio** 13,078,794 12,274,728 7
Guardian fund value ** 18,396,828 19,428,117 (5)
Stock market dataAll Share Price Index (points) 6,061.94 6,071.88 (0)S&P SL 20 Index (points) 3,438.88 3,204.44 7 Market capitalisation 7,476,396 9,932,570 (25)Share price (Rs.) Year end 90.10 119.70 (25) High 175.00 200.00 (13) Low 89.00 118.50 (25)
* Based on proposed / interim dividends** Based on fair value of portfolio after adjusting for cash and cash equivalents.
Our Performance Financial InformationManagement Discussion and Analysis
Supplementary InformationGovernance and Risk Management
It is with pleasure that I welcome you to the 65th Annual General Meeting of the Ceylon Guardian Investment Trust PLC and present to you the Annual Report of the company for the financial year ended 31 March 2017.
You would be pleased that the Ceylon Guardian Group has performed well reporting a 106% growth in post-tax profit of Rs. 1,256.3 Mn for the year ended 31st March 2017 compared to Rs. 611.2 Mn the previous year. This was largely on account of realization of capital gains. The group has performed exceptionally well in the turbulent environment with the discretionary portfolio outperforming the ASPI significantly over a 3 year period by a 4.37% CAGR. Guardian’s investment philosophy and disciplined investment process continues to add value to its stakeholders. The discretionary portfolio provided a 9.10% return for the financial year in a flat market environment.
Economy
The year ended March 2017 was a challenging year. The economy which recorded a GDP growth of 4.4% for the year 2016 witnessed a notable drop in growth during the first quarter of 2017. The Extended Fund Facility of the IMF which required the government to undertake a series of reforms, saw the introduction of several measures aimed at augmenting revenue and fiscal consolidation. Aiming at correcting a few imbalances in the economy, tightened monetary policy adopted during 2016 was further tightened during the first quarter of 2017. A renewed effort, aimed at achieving sustainable economic development including reforms, structural changes and improving international relationships was put in place. However the high debt burden and adverse weather conditions created a negative impact on the Government's development efforts. With a view to addressing existing structural deficiencies in the economy paving the way for sustainable development it is imperative that the Government implements a well structured and co-ordinated coherent set of policies creating
You would be pleased that the Ceylon Guardian Group has performed well reporting a 106% growth in post-tax profit of Rs. 1,256.3 Mn for the year ended 31st March 2017 compared to Rs. 611.2 Mn the previous year.
Chairperson's Message
a conducive environment for this purpose, through an efficient implementation mechanism.
Business Environment
Sri Lankan capital markets which have experienced limited development in the past are now undergoing a number of structural changes to pave a more diverse pathway. Some of the changes are in the form of a much needed Securities Exchange Commission Act which lays a foundation for new product development such as Real Estate Investment Trusts (REITs), derivatives and also strengthen the much needed regulatory aspects of the market. The Guardian Group remains poised to capitalize on such market developments and thereby strengthened its Private Equity business and unit trusts through its joint venture with Acuity Partners. We retain our presence in these business segments due to the future potential we see as capital markets become broad based. Guardian Capital Partners PLC (GCP), the Private Equity investment arm of the Guardian Group, made investments of Rs.366.7 Mn in equities consisting of a private equity portfolio of 7 companies. The Private Equity business will provide Guardian the opportunity to benefit from the growth and potential in unlisted SME space. The unit trust business will help Guardian to benefit from increased retail participation in capital markets.
Uncertainty on taxation policy clouded the investment industry and had negative implications especially on the unit trust business. Unclear tax policies led to investors holding back investments in capital markets with concerns on implementations of capital gains taxes, changes to corporate taxes and treatment of withholding and notional taxes. The uncertainty also led to the group protecting its investment returns by realizing large capital gains given the prospect of potential future tax implications. Though it was not the best of times to sell out, lack of confidence in the direction of capital market taxes forced us to realize gains at a sub-optimal point of time to protect shareholder returns.

Ceylon Guardian Investment Trust PLC Annual Report 2016/17 4 5
The overall performance and trends of Colombo Stock Exchange (CSE) are important indicators of the general business environment to prospective foreign investors interested in bringing capital to the country. Therefore, clear and coherent policy decisions , especially those affecting the operating environment of the CSE directly and indirectly, have to be taken after careful consideration of the implications on various sub sectors of the economy as well as focusing on attracting much wanted capital into the country. The assets under management of the unit trust business grew to a new high in December 2016 of Rs. 6.0 billion displaying the confidence investors have placed in Guardian Acuity Asset Management, our JV company. However, the assets under management took a sharp decline to Rs. 4 billion after budget announcements indicated that the tax exemption status will be withdrawn for unit trusts. We are still awaiting clarity on tax treatment after this announcement was made and the resulting uncertainty has resulted in investors shying away from unit trusts.
Performance of your company against this background has been commendable.
I thank the staff for their commitment, enthusiasm and striving hard to bring in good results operating in a volatile environment, our intermediaries and service providers for their support, and the regulators in taking the industry forward. I thank our clients and investors who continue to place their trust in Guardian; and our shareholders who continue to believe in our ability to deliver. I convey my appreciation to my board members and the members of the Audit Committee, Remuneration Committee, Nomination Committee and Related Party Transactions Review Committee for their diligence. We will continue to build our business for long term opportunities whist managing the volatilities of the short term with care
(Sgd.)M. A. R. C. Cooray (Mrs.)Chairperson
Colombo21st June 2017
Chairperson's Message

Investing with Ceylon Guardian
Unit Trust
No. of Investors
Customised Portfolio Management
Asset Management Strengths
• Money Market Fund• Money Market Gilt Fund• Equity Fund
customised portfolio management solutions on both fixed income and equity asset classes
5 Year CAGRAUM Rs. Bn
7%
Group discretionary portfolio
Performance
Equity focused, bottom up stock selection process with high valued stakes in good companies.
Rs.13Bn
Over 500
An Investment house managing multiple asset classes
2017
4.0
2016
5.8
2015
3.1
Our Performance Management Discussion and Analysis
Financial Information Supplementary InformationGovernance and Risk Management
AUM Rs. Bn
2017
3.9
2016
3.6
2015
3.5
Private Equity
No. of Projects
Partnering with small and medium scale enterprise for growth
Sectors
EducationTravelPower & EnergyIT
Corporate social responsibilityYNF-Development of young entrepreneurs
Rs. 18.8 Mnof loans disbursed
22
[
No. of Beneficiaries
Guardian
7No. of Portfolios
Over 15
Strong team with diverse skillsOffering valued investment solutions.Structured investment process with risk monitoring.Investment infrastructure and systems.Compliance with regulatory benchmarks.CFA silver award – Best unit trust fund category 2016.

Ceylon Guardian Investment Trust PLC Annual Report 2016/17 6 7
Management Discussion and Analysis
The Ceylon Guardian portfolio has outperformed the ASPI significantly for the financial year, whereby the discretionary portfolio performance has been 9.10% compared to the flat ASPI of - 0.16%.
Discretionary portfolioActively managed component of the group portfolio
13Bn
Ceylon Guardian Portfolio

Ceylon Guardian holds a portfolio of Rs. 18.4 billion as at 31st March 2017 consisting of a strategic holding of Rs. 5.3 billion and a discretionary holding of Rs. 13.1 billion. The discretionary component is actively managed using a bottom up stock selection process where the fund management team select investments utilizing fundamental research and the widespread experience of the team. The discretionary component performed exceptionally well for the
financial year ending 31st March 2017 with the portfolio providing a return of 9.10% outperforming the All Share Price Index by 9.26%. The portfolio has outperformed the ASPI significantly over a 3 year period, whereby the discretionary portfolio performance has been 5.44% compared to the flat ASPI of CAGR 0.52%. The total portfolio declined from Rs. 19.4 billion in 31st March 2016 to Rs. 18.4 billion largely on account of the strategic holding value reducing.
Guardian group portfolio performance
As a t 31-Mar-2017 (Dividend
adjusted)
Dividend adjusted
performanceAs at 31st March 31/03/2017 31/03/2016 Change %
Discretionary portfolio (Rs. ‘000) * 13,078,794 12,274,728 6.55% 13,392,054 9.10%Total Portfolio (Rs.‘000)* 18,396,828 19,428,117 -5.31% 18,710,088 -3.70%
ASPI (Points) 6,061.94 6,071.88 -0.16% -0.16%
S&P SL20 (Points) 3,438.88 3,204.44 7.32% 7.32%
*After adding back the total cash outflow from the distribution of dividend by the Group, which was Rs. 313.26 Mn during the period.
Our Performance Management Discussion and Analysis
Financial Information Supplementary InformationGovernance and Risk Management
90
110
130
Guardian
CAGR : 0.52 %
CAGR : 5.44 %
CAGR : 1.59 %
Mar
-12
Jun-
12
Sep-
12
Dec
-12
Mar
-13
Jun-
13
Sep-
13
Dec
-13
Mar
-14
Jun-
14
Sep-
14
Dec
-14
Mar
-15
Jun-
15
Sep-
15
Dec
-15
Mar
-16
Jun-
16
Sep-
16
Dec
-16
Mar
-17
ASPI S&P SL20
Three year track record - Guardian discretionary portfolio %
The discretionary component is actively managed using a bottom up stock selection process where the fund management team select investments utilizing fundamental research and the widespread experience of the team.

Ceylon Guardian Investment Trust PLC Annual Report 2016/17 8 9
On a long horizon, supporting Guardian’s aim of owning high quality businesses within its portfolio, our discretionary performance has been 7.00% for the last five years, outperforming the market by approximately 5%.
Management Discussion and Analysis
60
90
120
150
CAGR : 0.52 %
CAGR : - 6.88 %
CAGR : 1.59 %
Mar
-12
Jun-
12
Sep-
12
Dec
-12
Mar
-13
Jun-
13
Sep-
13
Dec
-13
Mar
-14
Jun-
14
Sep-
14
Dec
-14
Mar
-15
Jun-
15
Sep-
15
Dec
-15
Mar
-16
Jun-
16
Sep-
16
Dec
-16
Mar
-17
Guardian ASPI S&P SL20
Three year track record - Guardian total portfolio%
90
120
150
CAGR : 2.26 %
CAGR : 7.00 %
CAGR : 2.87 %
Mar
-12
Jun-
12
Sep-
12
Dec
-12
Mar
-13
Jun-
13
Sep-
13
Dec
-13
Mar
-14
Jun-
14
Sep-
14
Dec
-14
Mar
-15
Jun-
15
Sep-
15
Dec
-15
Mar
-16
Jun-
16
Sep-
16
Dec
-16
Mar
-17
Guardian ASPI S&P SL20
Five year track record - Guardian discretionary portfolio %

60
90
120
150
CAGR : - 6.48 %
CAGR : 2.87 %
CAGR : 2.26 %
Mar
-12
Jun-
12
Sep-
12
Dec
-12
Mar
-13
Jun-
13
Sep-
13
Dec
-13
Mar
-14
Jun-
14
Sep-
14
Dec
-14
Mar
-15
Jun-
15
Sep-
15
Dec
-15
Mar
-16
Jun-
16
Sep-
16
Dec
-16
Mar
-17
Guardian ASPI S&P SL20
Five year track record - Guardian total portfolio%
The local equity market provided a dampened return of -0.16% for the year with economic concerns such as fiscal consolidation, higher interest rates and excessive external debt repayment at the forefront. Higher interest rates in particular hampered domestic participation resulting in lacklustre turnover levels and subdued price levels. Encouraging signs for the economy began to emerge despite the poor performance of the market by way of the country securing the IMF Extended Fund Facility, Fitch sovereign rating outlook improving to stable and renewed foreign interest in the Colombo Stock Exchange in the latter months. On the global front, stocks rallied in a year of volatility and political upheaval. It was a year of surprises with Donald Trump’s victory and the UK referendum leading to Brexit. Improving US economic growth and central bank stimulus led to improved returns from developed markets. Emerging markets saw strong inflows leading to improved performances largely due to rising commodity prices and political reform efforts.
We invested Rs. 540 million in a cement manufacturing company which supplies to 35% of Sri Lankan demand. We are very excited with the prospects of Tokyo Cement which stands to gain from the ongoing construction boom in both the retail and large scale categories. The Sri Lankan economy which is entering the next
phase of its development drive will be spearheaded by numerous public and private large scale construction projects. With increasing demand for cement consumption the company has invested in increasing its manufacturing capacity to 2.8mn MT from prior 1.8 mn MT. A combination of softer input commodity prices and revenue growth led to a phenomenal increase of 72% in its bottom line. Since we acquired the position in Tokyo Cement this financial year, the stock has been a top contributor to Guardian providing a return of 64%. We are watchful of the fact that the cement prices are regulated prices and that its largest competitor Holcim recently sold out to Siam City Cement Public Company Limited Thailand.
Encouraging signs for the economy began to emerge despite the poor performance of the market by way of the country securing the IMF Extended Fund Facility, Fitch sovereign rating outlook improving to stable and renewed foreign interest in the CSE in the latter months.
Our Performance Management Discussion and Analysis
Financial Information Supplementary InformationGovernance and Risk Management
Since we acquired the position in Tokyo Cement this financial year, the stock has been a top contributor to Guardian providing a return of 64%.

Ceylon Guardian Investment Trust PLC Annual Report 2016/17 10 11
Top Five holdings
Company Market value of the
holding('000)
Holding as a % of
discretionary portfolio
Ownership stake
Hatton National Bank PLC 1,520,478 11.63% 1.74%
Sampath Bank PLC 1,048,829 8.02% 2.17%
Cargills (Ceylon) PLC 1,002,312 7.66% 2.38%
Commercial Bank of
Ceylon PLC 901,392 6.89% 0.82%
Dialog Axiata PLC 779,410 5.96% 0.85%
Total 5,252,421 40.16%
We invested a further Rs. 178 million in Cargills taking our investment in the company to Rs. 982 million as at end of the FY2017. The company which is one of the leading food and beverage companies in Sri Lanka has over 315 supermarket outlets spread across the country making it the largest privately owned supermarket chain. The company has started showing strong profit growth since the removal of deemed VAT in 2016 where they were obligated to pay VAT on 75% of the revenue regardless of VAT liability products. We are the 5th largest shareholder in Cargills with a 2.3% stake and look forward to the company’s rapid growth supported by increased consumption patterns in the medium term with improving GDP per capita.
We maintain our largest exposure of Rs. 1.5 billion to HNB which is one of the largest private banks in the country and have monitored the large strides it has made in improving profitability through cost management whilst maintaining high quality lending. The banks strong presence in SME lending differentiates it from its peers. However, the banking space in Sri Lanka is very competitive and we see mid-sized banks increasing their presence. We have invested Rs. 1.08 billion in one such institution being Sampath Bank which grew rapidly after investing in a heavy branch expansion. Sampath Bank too has grown its loan book and is focused on cost reductions whilst maintaining asset quality. However, it has one of the lowest capital adequacy ratios in the sector and with BASEL III requirements expected to be adopted in 2019, capital calls are expected across the sector of which HNB and Commercial Bank have already made announcements.
Management Discussion and Analysis
0 5 10 15 20 25 30 35 40
Market Exposure Guardian Group Exposure
Other
Beverage,Food & Tobacco
Manufacturing
Telecommunication
Diversified
Banks, Finance & Insurance
Sector Exposure%
Exposure to Commercial Bank of Ceylon PLC
6.89%
Exposure to Cargills (Ceylon) PLC
74%7.66%
Exposure to Sampath Bank PLC
Exposure to Hatton National Bank PLC
Rs.1.52 Bn Rs.1.05 Bn Rs.1Bn Rs.0.9 Bn
74%11.63% 8.02%
We are the 5th largest shareholder in Cargills with a 2.3% stake and look forward to the company’s rapid growth supported by increased consumption patterns in the medium term with improving GDP per capita.

Our holdings in the insurance sector reflect potential growth of the sector due to under-penetration of insurance and profitability in the life segment of the business. The general insurance holdings are more selective as a result of intense competition and unique business models such as Peoples Insurance that caters to the brand loyalty of its parent company. The cyclical nature of the leasing sector poses opportunity for increasing positions due to under-pricing of some businesses such as Peoples Leasing and Finance PLC and Central Finance Company PLC which show long
Another significant underperformer was Aitken Spence Hotel Holdings with recently opened associate properties in Sri Lanka performing poorly as well as the Indian property also falling below expectations. Despite tourist arrivals in Sri Lanka growing, the attraction to 4 and 5 star properties remains sluggish. The Maldivian sector which had been a key contributor in the past was also performing poorly with occupancies declining as competition intensifies. We expect a medium term recovery with demand for local star class properties eventually returning and other South Asian investments also recovering over time.
Guardian’s approach to value driven long term investing has resulted in significant capital gains made over a period of time. New tax legislation to be introduced brought about an uncertainty on introduction of taxes on Guardian's unrealized gains. In order to protect shareholder returns we realized profit on investments that had made significant gains over the years. As a result we divested significant positions in John Keells Holdings, Commercial Bank, Sampath Bank and Tokyo Cement to secure gains to shareholders under the present tax regime.
This divestment was prompted by an anticipated tax on share trading as a business. It is of significant concern that tax issues have caused us to sell out at an unsuitable time. Nevertheless, as a cautionary measure, we decided to realise the higher accumulated gains.
Financial Review and Shareholder Returns
Ceylon Guardian Group reported a profit after tax of Rs. 1,256.3 Mn for the year ended 31st March 2017 compared to Rs. 611.2 Mn the previous year. The increase of group profit by 105.6 % is due to substantial realized gains recorded when compared with last year. The realisation of capital gains on disposal of stocks in the group portfolio is the key contributor towards the group profit. During the period under review, it was Rs. 983.7 Mn recorded as “net gain from disposal of available for sale financial assets” whereas, it was Rs. 621.4 Mn in previous financial year.
Exposure to Banks, Finance & Insurance
Exposure to Diversified Sector
74% 12%37%
term potential. We continue to maintain our exposure to Dialog Axiata PLC which is a subsidiary of the Malaysian Axiata Group. Aside from being a leading mobile telecom provider in Sri Lanka, Dialog is set to experience further growth through an anticipated surge in data usage by consumers.
A significant detractor for Guardian this year was Hayleys Fabrics which experienced a 66% decline in net profit for the nine months ending Dec-16. The fabric manufacturer which is one of the largest knitting mills in the country was unable to obtain higher margin orders with uncertainty surrounding end –markets. The company came out of its financial troubles in 2010 and successfully turned the business around. The next phase of growth for the company is to shift its buyers to higher value added outputs which has proved challenging. We expect the company to pursue more lucrative segments which will add to bottom line growth in the future.
Rs. 4.8 Bn Rs.1.5 Bn
Our Performance Management Discussion and Analysis
Financial Information Supplementary InformationGovernance and Risk Management
As an emerging economy we see growth opportunities flowing through to the financial sector of the country, which explains our 37% exposure to this sector. However, we are cautious of its cyclical nature and the potential stress that comes about with non-performing assets when the cycle is on a downward trend.

Ceylon Guardian Investment Trust PLC Annual Report 2016/17 12 13
Management Discussion and Analysis
The net fair value losses on instruments held as “fair value through profit or loss financial assets” amounts to Rs. 51.2 Mn for the current year compared to the net fair value loss of Rs.211.6 Mn for the previous year, due to the fall in market prices of shares. The impairment loss on account of fall in fair value of instruments held as “available for sale financial assets” which is either significant or prolonged, amounts to Rs. 198.8 Mn (2016 : Rs. 95.2 Mn) for the period under review, on account of Aitken Spence PLC and Aitken Spence Hotel Holdings PLC.
Net change in fair value of available for sale financial assets, which is the main component of other comprehensive Income, amounts to negative Rs. 1.18 Bn compared to negative of Rs. 7.59 Bn recorded in the previous year. A significant contributor to the negative fair value change is the Strategic Investment which experienced a share price drop of 26% (2016 : 48%) and is the single long term non-discretionary holding by the Group.
The Company proposes a dividend of Rs. 4/- per share as final, which is to be approved by the Shareholders at the Annual General Meeting. The Company has been maintaining a consistent dividend to match shareholder expectations, and this year sees an increase of 33%.
0
50
100
150
200
250
300
2013 2014 2015 2016 2017NAV per share at Market Value Price per share
NAV per share (Market value) vs Share price(Rs.)
0
5
10
15
20
25
2013 2014 2015 2016 2017EPS DPS
EPS vs Dividends(Rs.)
Market price and NAV per share
As at 31st March 2017 2016 Change %
ASPI 6,061.94 6,071.88 (0.16)
NAV per share (Rs.) 173.53 181.77 (4.53)
Market price per share (Rs.) 90.10 119.70 (24.72)
Discount of NAV to market price per share 48.08% 34.15%
The net asset value per share (NAV) amounted to Rs. 173.53 as at the reporting date, after depreciation of 5% from the NAV reported beginning of the financial year, which was Rs. 181.77. NAV is based
on fair value of the Group’s total portfolio.
The Company’s share has been trading at a discount in the CSE over the past years. As of 31st March 2017, the market price of the Company was at Rs. 90.10 recording a drop of 24.72% for the year, and still trades at a discount of 48.08% to the NAV. Shareholder wealth depreciation during the year was 21.39% taking into account both share price movement and dividend for the year.

Assets Invested
Capital Deployed
Invested accross 7 companies
Rs. 87 Mn into two new investments, Rs. 7.5 Mn into existing investment
Rs. 367 Mn
Rs. 94.5 Mn
%
During the year Rs. 87 Mn was deployed into two new ventures, Rs. 45 Mn into Findmyfare (Pvt) Ltd and Rs. 42 Mn into Swiss Institute for Service Industry Development (Pvt) Ltd.
50%
Private Equity Business
Our Performance Management Discussion and Analysis
Financial Information Supplementary InformationGovernance and Risk Management

Ceylon Guardian Investment Trust PLC Annual Report 2016/17 14 15
The portfolio value of Guardian Capital Partners PLC (GCP), the Private Equity investment arm of the Guardian Group, stood at Rs. 366.7 Mn in equities consisting of 7 companies. We made two new investments during the year, Rs. 45 Mn was invested into Findmyfare (Pvt) Ltd and Rs. 42 Mn into Swiss Institute for Service Industry Development (Pvt) Ltd. Rs. 7.5 Mn was invested into LVL Energy Fund Limited via a rights issue. LVL remains our largest holding followed by Hsenid Business Solutions (Pvt) Ltd.
Private Equity Portfolio Composition
Company Rs. Mn Composition
LVL Energy Fund Limited 103.1 28%
Hsenid Business Solutions (Pvt) Ltd 70.0 19%
Access Engineering PLC 55.1 15%
Findmyfare (Pvt) Ltd 45.0 12%
Swiss Institute for Service Industry Development (Pvt) Ltd
42.1 11%
Expolanka Holdings PLC 41.1 11%
Kashmi Singapore PTE Ltd 10.3 3%
366.7 100%
Management Discussion and Analysis
Largest Investment Deployed During the Year% Rs. Mn
74% 94.528
LVL Energy Fund Limited
LVL Energy Fund is an energy focused investment vehicle and a subsidiary of Lanka Ventures PLC. The company invests in renewable and non-renewable energy projects in partnership with industry leaders in the power generation and engineering, procurement & construction (EPC) contracting segments. At present the company has invested in a total capacity of 136.6Mw, of which 104.4Mw is accounted for by thermal plants located in Bangladesh. The balance capacity is located in Sri Lanka of which 15.6Mw is in wind and the balance is in hydro power plants
Hsenid Business Solutions (Pvt) Ltd
HSenid develops and markets human resource management software, delivering solutions via on-premise and software as a service (SaaS) platforms. The company also offers HR outsourcing services. Whilst being the market leader in Sri Lanka, the company also derives over 25% of its revenue from overseas markets, mainly from the African region, India and Malaysia. The company is in the process of investing and building these overseas markets to further penetrate and improve market share, a key driver of its future growth.
Findmyfare (Pvt) Ltd
Findmyfare is Sri Lanka’s first and largest online travel agent. The company has built up a strong presence in the sale of air tickets, and is looking to further penetrate into the air tickets market whilst also building other allied verticals in the travel market. The key areas the company is looking to move into are areas such as hotel bookings, tour packages, corporate travel and the sub agent business. Guardian Capital Partners has a board seat in the company and is actively involved in the activities of the company at a strategic and where required at operational level as well.
Swiss Institute for Service Industry Development (Pvt) Ltd
Swiss Institute is a startup venture focused on providing vocational training to the hospitality and banking sector. The institute has entered into partnerships with the Swiss Hotel Management Academy of Lucern and the Swiss Banking Consulting and Training Academy, which will provide certification and curriculum. The company is looking to capitalize on the growth in the tourism sector in Sri Lanka and resultant shortage for suitably trained staff.
Kashmi Singapore Pte Ltd
A company based in Singapore, Kashmi has developed a Peer to Peer mobile payment solution with embedded social media functionality, which enables cash transfers between individuals and vendors through a mobile app. The company was founded by a group of young Sri Lankan entrepreneurs, operating out of Singapore and Sri Lanka. The company initially launched the product in Singapore and then it hopes to expand into other ASEAN countries like Malaysia and Indonesia. The promoters were funded by ‘Turn 8’, which is an incubator based in Dubai, and ‘Startupbootcamp Fintech Singapore’ a financial innovation focused accelerator in Singapore, during the product development stage.

Our Performance Management Discussion and Analysis
Financial Information Supplementary InformationGovernance and Risk Management
Access Engineering PLC
Invested at the pre-IPO stage, Access Engineering PLC (AEL) is engaged in construction and real estate businesses. AEL is one of the leading C1 contractors in the country. Given the infrastructure development thrust in Sri Lanka, exposure to AEL would enable us to benefit from the growth trends in this sector.
Expolanka Holdings PLC
Invested at the pre-IPO stage, Expolanka is one of the leading freight forwarders in the South Asian region, specialized in the garments/apparel vertical. The exposure to the regional apparel industry through valuable international partnerships, though sensitive to global economic forces, provides exposure to a competitive and scalable business model.
Consolidated performance of the portfolio companies
The portfolio companies generated consolidated revenues of Rs. 64.3 Bn for the 9 months ending December 2016, an increase of 15.3%. Consolidated net profit decreased by 3.9%, to Rs. 2.9 Bn.
Private Equity Portfolio Company Performance
Annual 9 months
For the period ended 2015M 2016M Dec-15 Dec-16
Revenue (Rs. Mn) 69,813 74,405 55,742 64,298
Net profit (Rs. Mn) 3,614 3,887 3,003 2,886
Revenue growth 6.6% 15.3%
Profit growth 7.6% -3.9%
Except for LVL Energy fund, all companies in the portfolio contributed to the consolidated topline growth. Expolanka and Access Engineering were the largest contributors to the growth, whilst relative to last year Hsenid posted the strongest growth in top line for the 9 months, recording a 32% growth. The decline in profits for the 9 months was driven by the decline in profits of Expolanka which in turn was due to one off losses recorded by the company, adjusted for this consolidated profits of the portfolio comes in flat. All the other companies improved their bottom lines during the 9 months. Access Engineering the largest contributor to the consolidated bottom line however only recorded a marginal growth in profit. Hsenid returned to profitability during the 9 months, whilst LVL Energy also posted a strong growth in bottom line. The results of Swiss Institute and Kashmi have not
been included in the above figures due to the startup nature of operations.
Progress on Joint Venture with Small Enterprise Assistance Funds
Upon Guardian Capital Partners PLC entering into the JV with Small Enterprise Assistance Funds (SEAF) in April 2016, focus was shifted to the first initiative under the venture, the fund raising and launch of a Sri Lanka focused private equity fund. Marketing activities commenced in October/November 2016 with the finalization of required marketing and other documentation. Several international and local institutional investors have shown interest in the fund.
As the enterprises in our economy grows we believe the opportunity to share in financing the next stage of growth of SME businesses will become available to institutional investors, as the promoters of such businesses gain the maturity and discipline to accommodate external investors.

Ceylon Guardian Investment Trust PLC Annual Report 2016/17 16 17
Management Discussion and Analysis
Leveraging off Ceylon Guardian’s core competencies of portfolio management, our customised client portfolios have achieved strong performances for all client with returns well above the respective benchmarks.
Rs.7.91Bn
External funds under Management
Capital Markets Business

Discretionary Portfolio Management SolutionsCeylon Guardian provides customised portfolio management solutions on both fixed income and equity asset classes. Leveraging off Ceylon Guardian’s core competencies of portfolio management, customised client portfolios have achieved strong performances for all client with returns above the respective benchmarks. The AUM (assets under management) from the discretionary client portfolio business grew to Rs.3.9 billion as at 31st March 2017. The fee income generated from this business segment is a growing component for Ceylon Guardian, which adds to synergies in building industry networks and clients.
Our Performance Management Discussion and Analysis
Financial Information Supplementary InformationGovernance and Risk Management
holders and potential investors. GAAM offers three unit trusts strategies which include Money Market Fund that invests in short term debt, Money Market Gilt Fund which invest in short term government securities and an Equity Growth Fund which focuses on fundamentally strong stocks.
The assets under management of the unit trust business reached a new high in December 2016 of Rs. 6 billion as a result of confidence investors have placed in GAAM’s customer experience and performance. However, the assets under management took a
Unit TrustsGuardian Acuity Asset Management (GAAM) our joint venture company set up with Acuity Partners with the objective of marketing unit trusts to the general public has completed its 5th successful year. Acuity Partners which brings its marketing and distribution expertise is the investment banking arm of HNB and DFCC Bank.
The year has been very challenging for promoting unit trusts with weak economic conditions not being conducive for capital markets in general. Higher interest rates and balance of payment concerns continues to deter investors from investing in equity markets while announcements made on unit trust taxation also unnerved unit
The assets under management of the unit trust business reached a new high in December 2016 of Rs. 6 billion as a result of confidence investors have placed in GAAM’s customer experience and performance. However, the assets under management took a sharp decline to Rs. 4 billion after budget announcements that the tax exemption status will be withdrawn for unit trusts.
sharp decline to Rs. 4 billion after budget announcements that the tax exemption status will be withdrawn for unit trusts. However, no further announcements have been made on this matter since but the industry is in limbo as investors are fearful of participating due to lack of clarity. Taxation policy should be expressed clearly and precisely by the authorities so that investors can make decisions on their investments with the necessary information at hand. However,
0
1000
2000
3000
4000
5000
Gilt FundMM FundEquity Fund
2015/16
Assets Under Management (Rs. Mn)
2016/17
Provident Fund Pension Fund Corporate
Individual Bank Trust
35.25
19.7423.42
1.53
16.37
3.69
Discretionary Portfolios Break UP%

Ceylon Guardian Investment Trust PLC Annual Report 2016/17 18 19
nearly 6 months have passed since the initial announcement but there remains confusion on what will be implemented. Unit trusts are an important tool in developing the economy and channelling funds towards efficient investments thereby strengthening capital markets. Indecisive policy making can only weaken overall capital markets and we recommend taxation policies that will encourage individual investors to use unit trusts to access capital markets.
All three unit trust funds outperformed their respective benchmarks providing investors superior actively managed returns. The Guardian Acuity Equity fund provided investors 10.1% CAGR return since inception while the money market and money market gilt funds which are more short term oriented provided annual returns of 11.0% and 9.5% for the 12 months ending 31st March 2017.
We yet firmly believe that unit trusts have a key role to play in enabling individual investors to access capital markets and hence tax benefits should be made available to this segment of investors until awareness and savings levels improve.
The strength of our banking partners provides a competitive edge in terms of branding and distribution. The acceptance of unit trusts within the banking network is yet to gain traction but as markets develop we are confident unit trust funds will also fall within the bank customer networks. GAAM voluntarily claims adherence to the Asset Managers Code of Conduct, CFA Institute USA. Last year
Management Discussion and Analysis
Returns from our range of Unit Trusts
Period
FY 2016/17 Since inception 31st March 2017 (Cumulated)
Since inception 31st March 2017 (CAGR)
Fund Return Benchmark Return
Fund Return Benchmark Return
Fund Return Benchmark Return
Equity Fund 6.65% -0.16% 63.29% 10.69% 10.11% 2.01%
Money Market Fund 11.00% 8.87% 62.33% 50.54% 12.24% 9.92%
Money Market Gilt Fund 9.45% 8.87% 16.53% 15.70% 8.18% 7.77%
our JV company was awarded silver under the best unit trust funds category at the capital markets award 2016 organized the CFA Sri Lanka society. Unit holders also enjoy state of the art services such as online account visibility, market updates and other communications.
We yet firmly believe that unit trusts have a key role to play in enabling individual investors to access capital markets and hence tax benefits should be made available to this segment of investors until awareness and savings levels improve.

Management Competency Development
The Ceylon Guardian Group continues to be a leading portfolio management and capital markets group within Sri Lanka due to its strong asset management capability and supporting systems and frameworks. The core capabilities in asset management are built up and used to service a diverse clientele ranging from institutional clients within customized mandates to individual retail investors who can choose from across our simple to understand unit trust products offered through our JV company. Our fund management and research team comprise the backbone of our decision making process and they invest time and effort in studying economic and key industry sensitivities of business segments. A well configured succession plan ensures that key functional areas are staffed continuously by high quality senior and second level management. This process assures us of a continuous flow of experienced talent through the organisation, and progression opportunity for high performers for whom career paths are provided along with organisational growth.
Our new portfolio administration system sourced from Credence Analytics India, will enable real time reporting on all key areas of our business including monitoring portfolio holdings, risk exposures, compliance limits and client information. It is presently being tested and will be on line shortly. Our compliance and risk management frameworks are being continually enhanced to take account of new and emerging challenges posed by market changes. Particularly in private equity, we see the need for stronger monitoring as our staff take on board responsibilities.
Our focus on business development and marketing was strengthened with the addition of new staff and continued search for avenues to build the external funds under management in both our institutional and unit trust portfolios. This entailed supporting our marketing team with technical input from the fund management side. The importance of scaling up the funds under management has become critical in view of the slow growth in our core equity portfolio.
Our Performance Management Discussion and Analysis
Financial Information Supplementary InformationGovernance and Risk Management
The core capabilities in asset management are built up and used to service a diverse clientele ranging from institutional clients within customized mandates to individual retail investors who can choose from across our simple to understand unit trust products offered through our JV company.
Ceylon Guardian Investment Trust PLC Annual Report 2016/17 20 21
Management Discussion and Analysis
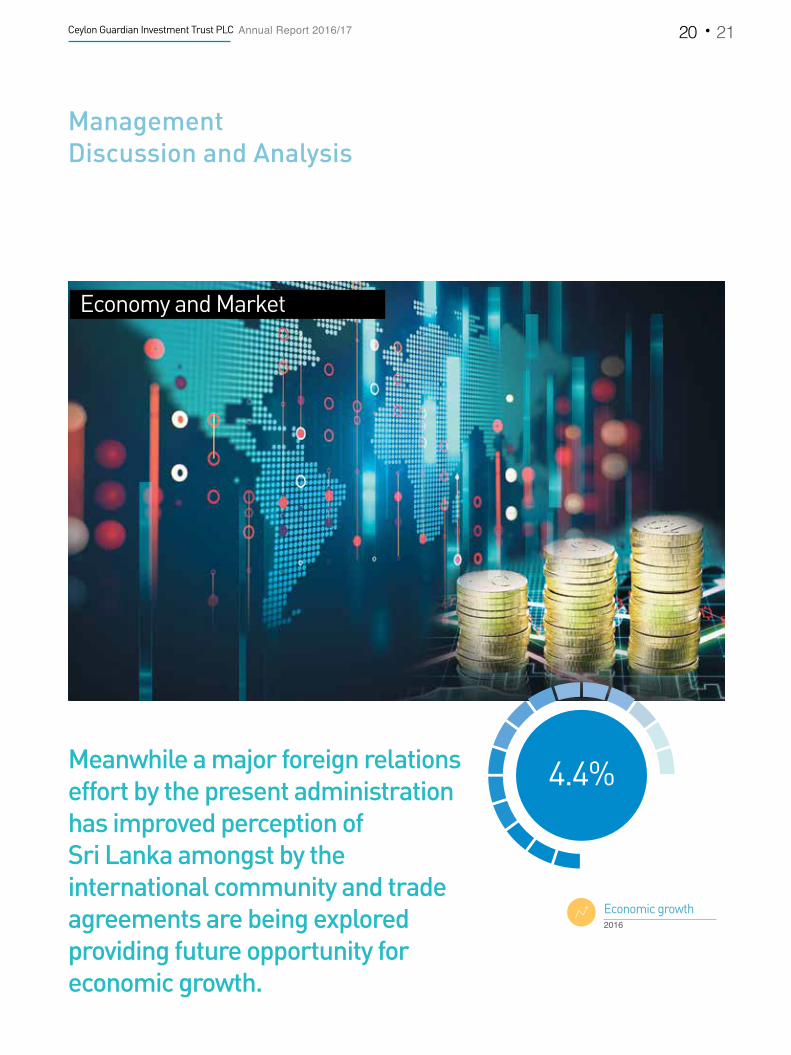
4.4%
Economic growth2016
Meanwhile a major foreign relations effort by the present administration has improved perception of Sri Lanka amongst by the international community and trade agreements are being explored providing future opportunity for economic growth.
Economy and Market

EconomyThe year 2016 saw the economy grow by 4.4% compared to 4.8% in the previous year which remained relatively low on account of higher interest rates and a general slowdown along with construction activity. The economy going forward is expected to gradually accelerate led by service sector and construction activity. Large scale infrastructure projects and private sector constructions are expected to drive the manufacturing sectors contribution to the overall economy. Although within the service sector consumption is slowing as a result of higher interest rates and inflation, financial services should continue to expand ensuring growth in the service sector. Meanwhile a major foreign relations effort by the present administration has improved perception of Sri Lanka amongst the international community and trade agreements are being explored providing future opportunity for economic growth.
Our Performance Management Discussion and Analysis
Financial Information Supplementary InformationGovernance and Risk Management
An overheating economy saw Central Bank increasing policy rates in July 2016 and Mar 2017 in an attempt to stem credit growth and curtail the trade deficit. As a result, interest rates remain elevated with the 1 year Treasury bill auction at 10.98% and 5 year Treasury bond trading at 12.55% as at 31st March 2017. We expect interest rates to trend down towards the second half of CY 2017 with lower external repayments falling in this time period and fiscal consolidation measures to take place increasing confidence in the economy. However, risks still persist on the inflation side with
increasing commodity prices and weather patterns. Also, external risks can impact the rupee and domestic interest rates such as investor reactions to Fed rate hikes and geo-political tensions.
Sri Lanka’s economy continues to grapple with a high debt burden, at 79% of GDP, which dampens growth prospects and creates pressure on the Balance of Payments. The country must take steps to attract the much elusive foreign direct investment which is required to get out of this debt trap. To attract capital, structural reforms are required of which part has been addressed through the IMF programme which is currently underway. The IMF programme also addresses the key area of fiscal consolidation through the implementation of a new Inland Revenue Act and promoting a more equitable, efficient and predictable tax structure. The IMF program also addresses public financial management reform, state enterprise reform, flexible exchange rate, inflation targeting
and reforms in trade and investment. Once these reforms are successfully implemented, we expect the Sri Lankan economy to be on a much better footing.
-10
-5
0
5
10
15
20
25
Foods and Beverage Wholesale and Retail Construction Tourism Financial Services GDP
2Q 2
015
3Q 2
015
4Q 2
015
1Q 2
016
2Q 2
016
3Q 2
016
4Q 2
016
1Q 2
017
GDP and Sector Growth Rates %

Ceylon Guardian Investment Trust PLC Annual Report 2016/17 22 23
Equity Market ReviewEconomic concerns loomed over the Colombo Stock Exchange like a dark cloud as the country continued to grapple with its excessive debt burden resulting in higher interest rates and slower economic activity. The financial year ending March 2017 saw the All Share Price Index give a dismal -0.16% return. It was natural for domestic retail and institutional investors to take a back seat and allocate their funds to more attractive fixed income investments. However, opportunities were available for experienced bottom up stock pickers such as Guardian whose discretionary portfolio provided a return of 9.10%.
The staff level agreement announced in April 2016 for USD 1.5 bn, with the IMF brought about a level of confidence that steps are being taken to get the economy back on track with the guidance of the IMF. This brought about a sense of optimism at the start of the financial year with the ASPI providing a return of 7.3% for the month of April 2016. However, net foreign selling along with the dawning in domestic investors’ minds that fiscal consolidation, a pillar of the IMF program, will result in increases in effective taxation saw them adopting a ‘wait and see’ approach. ASPI returns from May to Dec 2016 saw the market decline by 4.4%.
Management Discussion and Analysis
0
5
10
15
20
25
Frontier
Sri L
anka
Paki
stan
Viet
nam
Arge
ntin
a
Rus
sia
Bra
zil
Shan
ghai
Jaka
rta
Thai
land
Chile
Mal
aysi
a
Mex
ico
Phili
pine
se
Bom
bay
Hon
g K
ong
Ger
man
y
Sing
apor
e
Lond
on
Aust
ralia
New
Yor
k
Toky
o
Emerging Developed
Peer Market PE (Forward PE)Ratio
Geopolitical uncertainty and a wave of nationalism sweeping across the globe, saw unforeseen changes taking place such as Brexit and the rise to presidency of Donald Trump. Brexit continues to apply pressure to the idealism of an integrated Europe and negotiations will be ongoing to determine the fate of Britain and its trading partners. However, a wave of optimism across markets emanating from Trump’s policies and US economic recovery has seen global investors utilizing a more ‘risk-on’ approach. The past few months have seen equities across developed economies showing strong returns and a renewed interest in emerging and frontier markets. Foreign inflows for the 6 months preceding March 2017 has been a total of Rs. 10.5 billion and have dominated market participation with interest centred around liquid blue chip stocks.
The past few months have seen equities across developed economies showing strong returns and a renewed interest in emerging and frontier markets.
Source: Bloomberg

Our Performance Management Discussion and Analysis
Financial Information Supplementary InformationGovernance and Risk Management
Sectors that performed well for the financial year included Manufacturing (+10.5%), Healthcare (+9.48%) and beverage food and tobacco (+6.14%). Manufacturing did well on account of softer commodity prices for part of the year and volume growth for construction related companies. Consumption related stocks in the beverage food and tobacco also did well with major slowdown from higher interest rates yet to take full effect. Sectors that didn’t perform included Hotels (-3.98%) which continue to struggle as tourists demand for lower and unrated accommodation demand grows. Banks Finance and Insurance sector return (-1.65%) is largely account of poor market participation in these liquid stocks and capital raising requirements coming up. However, underlying fundamentals in banking stocks continues to improve and leasing companies continue to be challenged with higher interest rates and economic conditions.
Market capitalization as at 31st March 2017 was Rs. 2.66 trillion compares with Rs. 2.58 trillion a year ago. This can increase in the near term with the CSE’s move to include non-voting shares in the overall market capitalization. The All Share Price Index remains attractive at current levels with a 1 year and 2 year forward PER of 11.8X and 11.2x based on our coverage which accounts for 72% of the market capitalization. Earnings growth is expected to be 10.1% and 8.4% as the economy continues to slow-down with higher interest rates and balance of payment concerns. Based on our universe of stocks which we track, earnings growth over the last five years has outpaced market price growth. Relative to peer regional markets, the CSE looks attractive and shows strong return potential over the medium term. Efforts to list even small stakes of key state-owned enterprises will give a boost to market size, liquidity and trading opportunities.
1 Year Forward PER 1 Year Forecast EarningsTimes %
74% 10.111.8

Ceylon Guardian Investment Trust PLC Annual Report 2016/17 24 25
Risk Management
Overview of Risk Management
Risk Management is the process of identification and assessment of risks arising due to factors which are internal and external to the entity, and implementation of identified, mitigating actions to address such risks. Management of risk helps to avoid or minimise unanticipated losses being incurred. It is not a one time or periodic assessment, rather it is a continuous process, which is also an integral part of normal business operations and the management of the entity.
Risk Management Structure at Ceylon Guardian
The Risk Management structure established at Ceylon Guardian Group is applicable across the parent company and all other entities of the Group. The Company’s Board of Directors has overall responsibility for the establishment and oversight of the Group’s risk management framework. The Board of Directors has delegated this function to the Management of Guardian Fund Management Limited (GFM) which is a fully owned subsidiary of the parent company, the Fund Managers and Carsons Management Services (Private) Limited (CMSL), the Managers; who are responsible for developing and monitoring the Ceylon Guardian
The Management team
• Risk identification, analysis and risk assessment.
• Formulation of risk management policies, strategies and tools.
• Implementation, control of risk mitigating actions.
The Board of Directors
• Overall responsibility for risk management.
• Review group risk profile.
The Investment committee
• Provides advice and insights to the fund management team.
Audit committee
• Oversight over the financial reporting function of the Group and the system of internal controls.
• Monitor the audit function, compliance and risk management process.
Risk and Compliance team
• Evaluation of management’s risk assessment / strategies.
• Monitor deviations from preset standards.
• Provide recommendations for improvements
Compliance audit / periodic reviews
Direct and monitor
Report for evaluation
Business units and Processes

Management Discussion and Analysis
Our Performance Governance and Risk Management
Financial Information Supplementary Information
Group’s risk management policies and reports regularly to the Board of Directors on its activities. The Ceylon Guardian Group’s risk management policies are established to identify and analyse the risks faced by the Group, to set appropriate risk limits and controls, and to monitor risks and adherence to limits. Risk management policies, and systems are reviewed regularly to reflect changes in market conditions and the Group’s activities.
The Audit Committee of the Company has oversight over the financial reporting function of the Company, the system of internal controls as well as the audit, compliance and risk management processes. Group Internal Audit conducts periodic compliance audits / review and reports to the Audit Committee. Further, an Investment Committee provides advice and insights to the fund management team to further sharpen and refine their decision making process. This organisation structure determines the objectives and policies of our risk management framework and
promotes a culture of risk awareness and balanced risk-taking within the Company.
Risk categories
Ceylon Guardian Group operates the portfolio and asset management sector of the Carson’s Group. The group business operations include management of the Ceylon Guardian group portfolio which consist of listed equity, private equity and fixed income securities, management of unit trusts with equity / debt instruments and providing of portfolio management services to external customers. The Group faces various types of risk, some of which are applicable across all the assets classes under management while some are applicable to specific business operations or an asset category. The key risks are monitored and managed as a continuous process.
Risk Category Impact and mitigating strategies
Macro environmental risks: Overall macro-economic conditions and political factors affect the risk profile of the Company. The variations of macro-economic variables like Gross Domestic Product (GDP), interest rate, inflation, exchange rates and changes in the political environment and government policies affect the achievement of Company business and financial objectives.
Country risks
The risk associated with operations which are subject to various exchange control regulations, currency fluctuations, transaction costs & taxes and other actions that may be imposed by the government or policy making bodies of the particular foreign country or Sri Lanka.
• This is a new risk area for which we are looking to build a framework as the Group intends to exploit new markets in the future, when regulations permit.
• The Sri Lanka Fund, a subsidiary company which is domiciled in Cayman Island, is subject laws and regulations imposed by regulatory authorities there. Changes in Cayman Island regulatory environment, in the context of The Sri Lanka Fund is continuously monitored with the assistance of the Fund’s, Lawyers who have the necessary expertise
Currency risks
The risk associated with any fluctuations of foreign exchanges rates against Sri Lanka Rupee.
• The Sri Lanka Fund, of which the reporting currency is US dollars, is exposed to risk of currency impact on translation

Ceylon Guardian Investment Trust PLC Annual Report 2016/17 26 27
Risk Management
Risk Category Impact and mitigating strategies
Market risk - domestic
The exposure to adverse movements in both equity / fixed income securities market, which can result in value loss as well as variations in the anticipated returns from those securities. This is mainly caused by systematic risk factors such as interest rates, currency parity, inflation and availability of credit which affect both capital and money markets, and the value of securities.
• Market risks are inherent in every security and are thus collectively considered at the portfolio level to take into account the asset allocation decisions of the portfolio. The risks affecting a particular class of security are mitigated by switching to asset classes that are assessed to be less risky in a particular scenario. The sectoral and security exposure is continuously monitored.
• A sound research base to determine changing economic fundamentals of the country, determine the impact on equity vs fixed income investments and the prompt shifting of funds between asset classes. The sensitivity of stock valuations to changes in economic indicators are continuously monitored.
• The returns of money market funds the Company has invested in, is sensitive to changes in the financial sector. Hence the behaviour of interest rate determinants are monitored, and anticipated interest rate trends are considered in pursuing investment strategy.
Market risk - international and external
The risk that the domestic market will have an indirect impact from other markets, international trade and capital inflows / outflows, changing economic indicators and policies in the global context. The entry and exit of foreign investors from the local market is also determined by the macro economic trends prevailing in foreign markets and relative valuations of our market vis-a-vis developed and other comparative Asian markets.
• Commodity risk is somewhat high for the domestic economy, since Sri Lanka is an import dependent for vital commodities. We continuously monitor global developments in capital markets which is vital to assess and mitigate this risk.
• Building of expertise in foreign markets will take place going forward, as we would look to invest overseas gradually. In mitigating the risk we would tie up or collaborate with foreign entities that have expertise in such markets in order to gain knowledge.

Management Discussion and Analysis
Our Performance Governance and Risk Management
Financial Information Supplementary Information
Risk Category Impact and mitigating strategies
Portfolio Risks: The risk arising due to investment strategy, factors inherent to investment instruments and composition of the portfolio which affect the return of the portfolio.
General securities risk
Inherent investment risks associated with the particular investment instrument or issuing entity of the security. The price or value of any security may fluctuate, resulting in possible loss not only of returns and profits, but even all or part of the principal sums.
• General securities risk is applicable, regardless of whether the instrument is equity listed / unlisted or fixed income, but the magnitude of risk will vary with the type of the instrument.
• Portfolio management and investment selection process which is a bottom up approach, is designed to optimise the risk/return trade off. Risk mitigating methodology is based on the internal research process, and prospective investments are selected from fundamental analysis and contact with corporate management of the issuing company through company visits. A continuous process of monitoring the performance of investee companies is adopted, after the investment is made.
• In the case of private equity since there are no regulatory disclosure requirements we require the investee company to disclose financial information on a regular basis.
Concentration risk
This is the risk that the portfolio is over exposed to a particular sector / sectors or a security / securities resulting in the risk and return of the portfolio being over dependent on the performances / risk profiles of those sectors or securities.
• Monitoring sector exposure and single company / group exposure of the portfolio as a diversification and a mitigation strategy.
• Loss limits are set to monitor stocks performing below their cost of acquisition to determine whether temporary capital erosion is a concern.
• Monitoring by the compliance team takes place as a routine process.

Ceylon Guardian Investment Trust PLC Annual Report 2016/17 28 29
Risk Management
Risk Category Impact and mitigating strategies
Liquidity risk
Liquidity is the tradability of the securities in the market or the ability to realise cash with minimum loss of capital. The risk is that if the investment instruments of the portfolio are less liquid, execution of fund management decisions are affected.
• Lower liquidity of securities could affect the fund manager’s ability to transact, which in turn, could affect the fund’s overall performance. This might be due to poor market sentiment of a security, or low levels of publicly traded quantities. On acquisition of shares, we consider on the factors like size of free float, tradability of the stock, market turnover, major shareholders etc.
• In case of private equity investment which are unlisted, there is no official market price available for valuing the investment. However, we monitor secondary market trades to track prices. This is not an accurate guide as the volume of trades is a key factor in determining fair price. As we take fairly significant positions in private equity investee companies divestment of our stakes is more difficult, bringing a further element of illiquidity to our investments
• We agree with the investee company on possible exit mechanisms.
Regulatory and compliance risk: Company is operating in an industry under the supervision and monitoring of several regulatory authorities, especially Securities and Exchange Commission of Sri Lanka (SEC) and provisions of other regulatory requirements like the Companies Act, Listing Rules of The Colombo Stock Exchange, Central Bank of Sri Lanka are applicable in this industry.
The conduct of operations of the Group should be in compliance with the legal and regulatory provisions and financial requirements applicable under these regulatory benchmarks. Non-compliance or violation of these requirement will cause risk of cancellation / suspension of some licences issued by SEC, facing being taken by respective regulatory authorities etc.
• The management together with the Carsons group legal division pro-actively identify and set up appropriate systems and processes for legal and regulatory compliance in respect of the Company’s operations.
• Periodic training programs for staff to improve the awareness of changes in applicable laws and regulations.
• Reviews on a quarterly basis reviews conducted by the compliance team and the management certification of compliance with relevant laws and regulations on a periodic basis.
• Internal audit monitors compliance with all regulatory provision.

Management Discussion and Analysis
Our Performance Governance and Risk Management
Financial Information Supplementary Information
Risk Category Impact and mitigating strategies
Operational Risks : This is the risk of losses being incurred resulting from disruptions, disturbance of business operations caused by events due to inadequate or failed internal processes, people and systems within the organisation. The management of operational risk is a continuous process which includes identification, assessment of risk and implementation of measures to address such risk, which specifically covers following key areas which are significant in the context of investment and asset management operations.
Systems and process risks
The Company’s business operations are structured in a way that, those are performed as interconnected / interdependent processes. The divisions of the company, either separately or collectively are responsible for the functions of these process which utilise human / physical resources and information systems
• The management of systems and process risk consist of identifying risks and formulating plans promoting best practices, implementing internal controls / systems and monitoring compliance with these internal guidelines.
• The processes are continuously monitored to identify the areas of weakness and to implement improvements.
• Correct application of recommended practices where back up procedures are followed on a routine basis to ensure data and Information security. Our accounting systems and portfolio management systems are regularly backed up to prevent loss of data.
• Business continuity plan which describes how to resume business after a disruption occurs in business process, location and the system. A Disaster Recovery Plan is available at the Carson’s Group level which deals with recovering Information Technology infrastructure, facilitating of critical operations to be active in an alternate location etc. after a disastrous interruption.
• Systems support and the maintenance agreements with for the portfolio management software is made available through an annual maintenance agreement with the software vendor which ensures on line support for system issues and queries.
• The internal audit function of the Carsons Group ensures the safeguarding of Company assets, recommends process improvements in areas where process control failures are noted and compliance with regulatory requirements etc.

Ceylon Guardian Investment Trust PLC Annual Report 2016/17 30 31
Risk Category Impact and mitigating strategies
Reputation risk
This is a critical risk in that as a financial entity any loss / theft or misappropriation of cash / financial assets can cause permanent and long term loss of business
• A sound system of internal controls and quarterly internal audits are carried out by the internal audit department.
• A Code of Ethics signed by all staff and constant education and awareness of the code.
• Regular staff communication.
Staff risks
A fund management operational unit requires qualified professionals with experience in the fund management industry. Knowledge of the operating mechanism of the market as well as its norms and ethics is of importance.
• Having diversity in the team, developing a strong second level, providing training and development opportunities, are standard practices of the industry with which we benchmark ourselves. A performance related incentive scheme for the staff is in place and is being reviewed regularly. The networking ability of key staff to source clients and deals is important in running a successful fund management operation by being shown important deals by market intermediaries.
• The staff of GFM are all professionally qualified with a track record of experience in the industry. A strong research team has been developed to complement the fund management operation and raise the standard of the investment decision making process. Staff training and development is identified as an important area of concern, while retention is managed through a comprehensive reward structure and incentive scheme, opportunities for career progression and a culture of being HR oriented. Collectively these steps help us to work towards having an effective succession plan in place.
Risk Management

Profiles of the Directors
ROSE COORAY
(Appointed as Chairperson with effect from 01.09.2016)
Rose Cooray is the Chairperson of Ceylon Investment PLC, Ceylon Guardian Investment PLC, HNB Assurance PLC, HNBGI LTD. and Sithma Development (PVT) LTD. She is a Director of Hatton National Bank PLC and HNB Grameen Finance Limited and Guardian Capital Partners PLC. She functions as the Chairperson of the Board Integrated Risk Committees of Hatton National Bank and HNB Grameen Finance and is a Member of several other Board sub-committees of companies where she holds the position of Director. She is a retired Deputy Governor of the Central Bank of Sri Lanka where she served for 35 years and counts over 40 years of experience in working in the financial sector.
On release from the Central Bank, she had served the Ministry of Finance in the capacity of Director General Fiscal Policy and Economic Affairs Department for nearly 6 years, represented the Government on the Boards of DFCC Bank, Sri Lanka Institute of Information Technology, Sri Lanka Telecom, Ceylon Electricity Board, De La Rue Currency and Security Print (Pvt) Ltd, Export Development Board, National Housing Development Authority and represented the Monetary Board on West Coast Power (Pvt) Ltd.
She has functioned as the Vice Chairperson of the Institute of Bankers of Sri Lanka for 5 years and has served on a number of Committees at national level covering a variety of subjects representing the Ministry of Finance and the Central Bank. She has also presented papers/been the resource person representing the Central Bank and the Ministry of Finance at various international meetings/seminars.
Mrs. Cooray has been involved extensively in policy making and implementing projects and programmes, especially in the area of regional development and microfinance. She has wide experience in negotiating loans with multilateral and other donors, as well as bilateral trade agreements on behalf of the Government. Her articles/papers have been published in professional journals.
CHANDIMA GUNAWARDENA
Chandima Gunawardena serves as a Non-Independent, Non-Executive Director of most of the Carsons Group Companies in Sri Lanka and overseas. He is also a Director of Bukit Darah PLC. Since assuming Non- Executive status in the Group, he serves as an advisor to the Group's Strategic Planning and Management forums in Sri Lanka and serves on Board Committees, including the Audit Committees of the Group in Sri Lanka and overseas covering all operating sectors of the Group.
Mr. Gunawardena has over four decades of experience in varied fields of business and commercial activities and has held senior positions in Corporate, Mercantile and State Institutions. He was appointed to the Carsons Group Directorate in 1990.
He has served in the Management Committee of The Ceylon Chamber of Commerce for over 10 years and was a Founder Council member of the Sri Lanka Institute of Directors (SLID) and continued to serve in the council for over 10 years. He is a Fellow of the Chartered Institute of Management Accountants, UK.
MANILAL FERNANDO
Manilal Fernando is a Director of Ceylon Investment PLC , Ceylon Guardian Investment Trust PLC and is currently the Chairman of Shipping Cargo Logistics (Pvt) Ltd., Hyundai Lanka (Pvt) Ltd. and Dynamic AV Technologies (Pvt) Ltd. He is also a Director of Eco Corp Asia Private Limited and a Trustee of Joseph Fraser Memorial Hospital.
He has been the Past President of the Football Federation of Sri Lanka from 1979 to 1999, as well as the Vice President of the National Olympic Committee of Sri Lanka from 1990 to 2014.
He is an Attorney-at-Law & Notary Public.
Management Discussion and Analysis
Our Performance Governance and Risk Management
Financial Information Supplementary Information

Ceylon Guardian Investment Trust PLC Annual Report 2016/17 32 33
Profiles of the Directors
KRISHNA SELVANATHAN
Krishna Selvanathan is a Director of Carsons Management Services (Private) Limited, Lion Brewery (Ceylon) PLC, Pegasus Hotels of Ceylon PLC and the Investment Sector Companies of the Carsons Group.
He holds a BA Degree in Accounting & Finance and Business Administration from the University of Kent, U.K.
TIMOTHY CHEE MING CHIA
Mr. Timothy C. M. Chia is Chairman of Hup Soon Global Corporation Private Limited and Gracefield Holdings Limited.
He was the President of PAMA Group Inc. (previously known as Prudential Asset Management Asia Limited, the Asian investment and asset management arm of The Prudential Insurance Company of America). He retired from PAMA Group of Companies on 31 December 2004. In 2007, he founded Hup Soon Global Corporation and became its founding Chairman.
Prior to joining PAMA, as one of the original principals in 1986, Mr. Chia was Vice President - Investment of American International Assurance Company Limited (AIA), a major subsidiary of the American International Group, Inc., New York (AIG).
Mr. Chia is currently a Director of Banyan Tree Holdings Ltd, Fraser and Neave Limited, Singapore Power Ltd, The Straits Trading Company Limited, Ceylon Investment PLC, Vertex Venture Holdings Ltd and Malaysia Smelting Corporation Berhad.
He was made Chairman of UBS AG – Asia in October 2009and retired in September 2011. He stepped down as Senior Advisor to JM Financial Singapore Pte Ltd and EQT Funds Management Limited in 2015. He was the Chairman - Asia of Coutts & Co Ltd, the wealth management arm of the Royal Bank of Scotland Group, from January 2012 to March 2016.
He was a board member of Singapore Power Ltd joining the board in September 1998 until his retirement in July 2004. He served as Chairman of one of Singapore Power’s major subsidiaries, Power Gas Ltd from 1998 to 2002.
Amongst his past appointments, Mr. Chia was a Director of SP PowerAsset Ltd, Power Gas Ltd, SPI (Australia) Assets Pty Ltd, Singapore Post Ltd, FJ Benjamin Holdings Ltd, Frasers Centrepoint Ltd, Macquarie Pacific Star Prime REIT Management Ltd, The Hour Glass Ltd, KorAm Bank Co. (Korea), Meritz Securities Co., Ltd (Korea) and Magnecomp Precision Technology Public Co., Ltd (Thailand).
Since January 2004, Mr. Chia was named a Trustee a of the Singapore Management University. He is currently a member of its Audit Committee and Chairman of itsCommittee for Institutional Advancement.
In 2010, The Singapore Venture Capital and Private Equity Association inducted Mr. Chia into the “SVCA Hall of Fame” as its inaugural member by naming him “Pioneer Venture Capitalist & Private Equity Investor since 1986”.
In October 2015, Mr. Chia was appointed as Advisory Council Member of the ASEAN Business Club (“ABC”) and the co-chair of ABC Singapore.
In January 2016, Mr. Chia was appointed as a Member of the Advisory Board of the Asian Civilisation Museum.
He is currently a Fellow of the Singapore Institute of Directors and a member of the World Presidents’ Organisation.
In 1996, Mr. Chia was elected a Director of the Singapore Dance Theatre until he stepped down in March 2004 and in September 2004, was conferred the Arts Supporter Award by the National Arts Council.
Mr. Chia graduated with a cum laude in Management from Fairleigh Dickinson University in the United States.

WILLIAM KNIGHT
William Knight is the Chairman of Myanmar Investments International Ltd, specialist investors in Myanmar, listed on AIM. He is also Chairman of the JP Morgan Chinese Investment Trust PLC, a London listed investment trust specialising in greater China, as well as holding the Chairmanship of MCS Apparel (HK) Limited, Henry Cotton’s (Greater China) Limited and Marina Yachting (Hong Kong) Ltd, three joint venture companies owning branded consumer goods being marketed in China.
His current board positions include Smith Tan Phoenix Asia Fund and GNET Group PLC. In recent years he has served as a board member of specialist funds investing in India, Korea,
Mauritius, Portugal, Russia, Thailand and Vietnam, as well as for an AIM listed private equity fund of funds for India and China.
He originally specialised in financing major capital projects at Lazard Brothers and spent 18 years in various senior positions in the Lloyds Bank group based in London, Hong Kong and Lisbon. He is a co- founder of Emerisque Brands, an East/ West management buy-in company and he is the Chairman of the Advisory Board of Homestrings LLP, an investment platform for the world’s Diaspora.
RUVINI FERNANDO
(Appointed with effect from 15th August 2016)
Ruvini Fernando is a Director and CEO of Guardian Fund Management Limited, investment managers of the Ceylon Guardian Investment Trust PLC Group and a Director of Guardian Acuity Asset Management Limited, the Group's licensed Joint Venture for unit trust management. She was appointed to the Ceylon Guardian Group listed company boards as an Executive Director in 2016. She is a Director of The Sri Lanka Fund, a country fund dedicated to Sri Lankan equities.
The Ceylon Guardian Group presently has business interests in listed and private equity as well as managing mutual funds and institutional client portfolios, a collective portfolio of assets under management of over Rs.35bn, in diverse asset classes. She counts approximately 25 years’ experience in management accounting, finance, strategic planning and investment management, of which 10 years have been with the Ceylon Guardian Group and 23 years
with Carson Cumberbatch Group. She was a former visiting faculty member of the MBA programme of the Postgraduate Institute of Management (PIM). She is a Fellow of the Chartered Association of Certified Accountants (ACCA), UK and the Chartered Institute of Management Accountants (CIMA), UK and holds a Masters in Business Administration from the PIM, University of Sri Jayewardenepura. She currently serves as member of the National Agenda Committee on Finance and Capital of the Ceylon Chamber of Commerce.
ISRAEL PAULRAJ
(Resigned from the Board with effect from 15th August 2016)
Israel Paulraj is the Chairman of Guardian Capital Partners PLC and Rubber Investment Trust Limited. He serves as a Director of several subsidiary companies within the Carsons Group.
He served as Past Chairman of the Federation of Exporters Associations of Sri Lanka and The Coconut Products Traders Association. He was a member of the Executive Committee of the Ceylon Chamber of Commerce, National Chamber of Commerce of Sri Lanka and Shippers Council. He served on the Board of Arbitrators of the Ceylon Chamber of Commerce. He has served as Hony. General Secretary of the Central Council of Social Services, Hony. Treasurer of The Christian Conference in Asia, President of the Church of Ceylon Youth Movement and Hony. Treasurer of the National Christian Council of Sri Lanka. He has also served as Chairman of the Incorporated Trustees of the Church of Ceylon.
He also served on the Presidential Task Force on Non Traditional Export and Import Competitive Agriculture set up by President R.Premadasa. He served as Chairman of the Ecumenical Loan Fund of Sri Lanka and on its International Board in Geneva. He was a member of the Commercial Law Reform Commission and has served on the Parliamentary Consultative Committee on Internal and International Trade.
He holds a Bachelor of Law Degree and an Executive Diploma in Business Administration.
Management Discussion and Analysis
Our Performance Governance and Risk Management
Financial Information Supplementary Information

Ceylon Guardian Investment Trust PLC Annual Report 2016/17 34 35
Ruvini Fernando
Tharinda Jayawardena
Sumith Perera
Director / Head of Research, Guardian Fund Management Ltd. Has over 10 years of experience in investment research. Before joining the Carsons group, he worked as a research analyst at JB Securities (Pvt) Ltd. Is a CFA charter holder and an associate member of the Chartered Institute of Management Accountants. Also holds a BSc Degree from the University of Sri Jayewardenepura specialising in Finance.
Head of Portfolio Management, Guardian Fund Management Ltd. Has over 12 years’ experience in the field of Asset Management working as a Fund Manager for CAAM Saudi Fransi LLC (Kingdom of Saudi Arabia), Investment Analyst for Eagle NDB Fund Management (Sri Lanka) and as a Financial Analyst for John Keells Stockbrokers. He holds a BSc (Hons) in Economics and Business Finance from Brunel University, UK and is an Associate Member of the Chartered Institute of Management Accountants.
Management Team
(CFA,ACMA,B.Sc Finance (Hons))
(B.Sc (Hons), ACMA)
(MBA. FCCA, FCMA)
Director / CEO of Guardian Fund Management Limited. She is also a Director of Ceylon Guardian Investment Trust PLC. Refer page 33 for her detailed profile.

Asanka Jayasekera
Lakmal Wickramaarachchi
Accountant, Guardian Fund Management Limited. Commenced career at KPMG, Chartered Accountants, prior to joining the Carsons Group. Counts over 10 years of experience in auditing and accounting. Associate Member of the Institute of Chartered Accountants of Sri Lanka. Holds a B.Sc. Finance (Special) Degree from the University of Sri Jayewardenepura, Sri Lanka.
Fund Manager, Guardian Fund Management Limited/ Guardian Acuity Asset Management Ltd and ManagerResearch, Guardian Fund Management Limited. Has over 9 years’ experience in asset management and investment research and worked as a research analyst at JB Securities (Pvt) Ltd before joining Ceylon Guardian group. He holds a B.Sc. Finance (Hons) degree from the University of Sri Jayewardenepura, Sri Lanka and is an associate member of the Chartered Institute of Management Accountants ,UK. He is a visiting lecturer at department of finance, University of Sri Jayewardenepura.
(B.Sc. Finance (Special),ACA)
(B.Sc.Finance (Hons), ACMA)
Management Discussion and Analysis
Our Performance Governance and Risk Management
Financial Information Supplementary Information
Sashika Wickramaratne
Crishani Perera
Priyan De Mel
Indramali Samarasinghe
Deemantha Kaushika
Shewantha Peiris
Thisaru Kavinda
Omesha Piyumi
Prabhath Dissanayake
Harindi Hettigamage
Kasun Gunawardhana
Avin Fernando
Ruwani Rajapakse
Fund Management Team Portfolio Operations Team Finance Team Research Team

Ceylon Guardian Investment Trust PLC Annual Report 2016/17 36 37
Entrepreneurs are selected to the programme by a multi-functional team, based on the extent to which they contribute to the economy. This may be for instance through utilization of local raw materials, providing direct and indirect employment opportunities, and earning or saving of foreign exchange.
Selected beneficiaries are provided with financial assistance to expand their businesses based on a projected 3-year business plan. In addition they are provided management intervention by the dedicated YNF team, so that they would be successful in achieving that business plan. Such intervention is carried out for each individual entrepreneur, by conducting regular field visits and interacting with their major stakeholders, such as employees, key buyers, suppliers and indirect workers.
In the year under review, we continued operating within our focal districts of Hambantota, Matara, Ratnapura and Colombo, and also selected eight new beneficiaries to the programme.
Sustainability Report
The Youth To Nation Foundation As a socially responsible corporate we, Ceylon Guardian, go the extra mile to add lasting value to the communities of our business presence – and we believe that fostering the sustainable growth of Small and Medium Enterprises (SMEs) in Sri Lanka, is one of the most effective ways to achieve this.
In the year under review, we continued our efforts under the Youth to Nation Foundation (YNF), focusing our energies to uplift selected SMEs that create significant positive social impact. Currently in its fourth year, YNF was founded in 2013 with the vision to build a nation of self-reliant, motivated youth who will add value to, rather than be dependent on society.
Young Entrepreneurs Development Programme
The Young Entrepreneurs Development Programme (YEDP) was launched with a view to enhance the technical and business management skills of young entrepreneurs towards their success, which would promote sustainable socioeconomic development in Sri Lanka.
Our Philosophy : As a socially responsible corporate we, Ceylon Guardian, go the extra mile to add lasting value to the communities of our business presence.
Our Growing Funding Portfolio
No. of Beneficiaries Total value of funds disbursed (Rs.)
Year New Exiting Cumulative New Loans Cumulative Value
2013 3 - 3 1,900,000 1,900,000
2014 5 - 8 4,055,790 5,955,790
2015 7 - 15 7,118,000 13,073,790
2016 8 1 22 5,807,870 18,881,660

Key Performance Indicators
Each entrepreneur is continuously assessed based on pre-determined Key Performance Indicators (KPIs), which enables the YNF team to identify the priority areas on which intervention is necessary for each. These KPIs reflect a holistic approach to growth, taking into consideration the 3 Ps of People, Planet and Profits, and are categorized into Primary, Secondary and Growth Factors.
PRIMARY FACTORS SECONDARY FACTORS
GROWTH FACTORS
Sales volumes/ Revenue Customer satisfaction
Market development
Production volumes/ Production efficiency/ Capacity utilization
Product quality/ Design
New product development
Cash/ Working capital management
Accounting/ Record-keeping
Technical improvement
Labour management Work conditions/ Health & safety
Environmental impact
Management Discussion and Analysis
Our Performance Governance and Risk Management
Financial Information Supplementary Information
YEDP Beneficiaries
Garments Food processing Coir
Construction chemicals
Soft toys Bag manufacture
Footwear
36
22
14
5
9
5
9
By Industry%
Direct employment
Community livelihoods
Job creation
Workshops
[
[
[
[
Project Impact To-Date
Secured employment and improved work conditions for approximately 300 direct employees, majority of whom are rural women
Improved livelihoods for approximately 150 indirect beneficiaries including outsourced workers, raw material suppliers, distributors and sales agents
Approximately 70 jobs created following YNF intervention
12 competency development workshops for 425 entrepreneurs in Matara, Hambantota, Ratnapura and Monaragala districts
Competency Development Workshops
We continue to conduct competency development workshops within our project focal districts, catering to a wider range of SME entrepreneurs to improve their business acumen. Such workshops are conducted based on the Training Need Assessment of the target audience, and we engage the services of both internal staff as well as external experts in their respective fields.
While continuing to collaborate with the respective regional Chambers of Commerce towards this purpose, in the year under review we also partnered with the Small Enterprises Development Division (SEDD) under the Ministry of National Policies and Economic Affairs, to extend our support to their members.
Female Male
68
32
By gender%

Ceylon Guardian Investment Trust PLC Annual Report 2016/17 38 39
In the year under review, two workshops were conducted in Matara for approximately 115 entrepreneurs, covering areas such as financial management, marketing, taxation and investment appraisal.
Our Impact – A Few Success Stories
Keerthi Siriwardhana
Keerthi is a manufacturer of construction chemicals from Walasmulla in the Hambantota District. His main product is “putty”, which is used as a high quality, low-cost and less labour-intensive alternative to wall plastering. The primary raw material used in the manufacture of putty is locally sourced calcite. He provides employment to rural youth in the area.
In 2014, YNF provided him a soft loan to invest in technically advanced machinery. This enabled him to increase volumes and efficiency, manufacture new products and be more competitive in the market. The new production process is also more environment-friendly.
Over the past two years, YNF has supported him towards marketing and promotion, better financial management and accounting techniques, and improving worker health & safety. Keerthi’s business has grown in terms of higher production capacity, increased employment from 14 to 27 workers, greater revenue and profitability, new markets and new products such as wall filler, tile grout, tile mortar and emulsion paint.
Manjula Janaki
A manufacturer of gingelly rolls from Suriyakanda in the Ratnapura District, Manjula provides employment to rural women, as well as supporting the livelihoods of local gingelly farmers and kithul treacle tappers.
YNF provided a soft loan to her in 2015, to construct a new production facility and invest in technically advanced machinery, enabling her to expand production capacity and productive efficiency. In addition, YNF has supported her towards better financial management, stock management, workplace hygiene, employee motivation and productivity and formalization of employment.
Over the past year, Manjula has increased volumes, revenue and profitability, increased her workforce from 15 to 35, improved their working conditions and captured new markets.
Sustainability Report
A trade promotion conducted in Embilipitiya for masons and building contractors in the locality, organized by YNF
Manjula won the Silver Award for Woman’s Entrepreneur of the Year 2015 (Small Category), organized by the Women’s Chamber of Industry & Commerce
Subadra Sanjeewani
Subadra is a designer and manufacturer of ladies footwear from Akuressa in the Matara District. She offers unique, quality footwear at affordable prices to her customers. Her business provides employment to local youth, most of whom are women, as well as a commercial opportunity for the traditional craft of shoe-making in the area. Subadra also manufactures a range of eco-friendly footwear, utilizing natural and recyclable raw materials.
In 2015, YNF provided her a soft loan to upgrade her production facility, enabling her to expand capacity, increase volumes and

capture new markets. YNF further supported her in areas such as branding, improving employee motivation and productivity, safety at work and formalization of employment.
Over the past year, she has increased revenue and profitability, invested in technically advanced machinery and introduced several new designs to the market. Her workforce has expanded
Eco-friendly jute shoes
Partnering career guidance for University of Sri Jayawardenapura
Subadra and her husband display their products at a trade fair
Management Discussion and Analysis
Our Performance Governance and Risk Management
Financial Information Supplementary Information
Enhancing Employability Of University StudentsWe continued our commitment towards enhancing soft skills and employability of students of national universities in Sri Lanka. In the year under review, we co-sponsored the “J’Pura Employability Skills Award Ceremony 2016”, and the “Touch the Peak – Annual Career Fair & Skills Development Workshop 2016/2017”, organized by the Career Guidance Unit of the University of Sri Jayawardenapura, held on 4th October 2016 and 2nd January 2017, respectively.
from 3 to 6, and working conditions have significantly improved at the upgraded production facility. Subadra won “Best Woman Entrepreneur of the Year 2017 – Matara District” at the International Women’s Day felicitation ceremony organized by the Ministry of Women & Child Affairs.
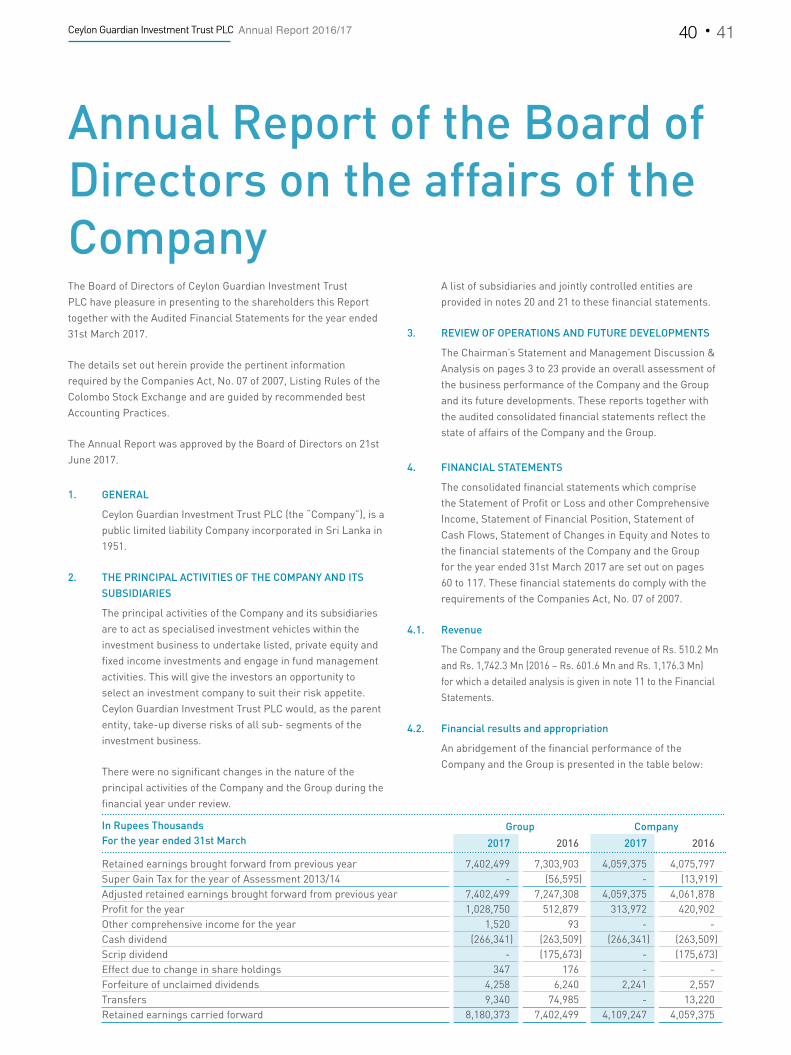
Ceylon Guardian Investment Trust PLC Annual Report 2016/17 40 41
Annual Report of the Board of Directors on the affairs of the CompanyThe Board of Directors of Ceylon Guardian Investment Trust PLC have pleasure in presenting to the shareholders this Report together with the Audited Financial Statements for the year ended 31st March 2017.
The details set out herein provide the pertinent information required by the Companies Act, No. 07 of 2007, Listing Rules of the Colombo Stock Exchange and are guided by recommended best Accounting Practices.
The Annual Report was approved by the Board of Directors on 21st June 2017.
1. GENERAL
Ceylon Guardian Investment Trust PLC (the “Company”), is a public limited liability Company incorporated in Sri Lanka in 1951.
2. THE PRINCIPAL ACTIVITIES OF THE COMPANY AND ITS SUBSIDIARIES
The principal activities of the Company and its subsidiaries are to act as specialised investment vehicles within the investment business to undertake listed, private equity and fixed income investments and engage in fund management activities. This will give the investors an opportunity to select an investment company to suit their risk appetite. Ceylon Guardian Investment Trust PLC would, as the parent entity, take-up diverse risks of all sub- segments of the investment business.
There were no significant changes in the nature of the principal activities of the Company and the Group during the financial year under review.
A list of subsidiaries and jointly controlled entities are provided in notes 20 and 21 to these financial statements.
3. REVIEW OF OPERATIONS AND FUTURE DEVELOPMENTS
The Chairman’s Statement and Management Discussion & Analysis on pages 3 to 23 provide an overall assessment of the business performance of the Company and the Group and its future developments. These reports together with the audited consolidated financial statements reflect the state of affairs of the Company and the Group.
4. FINANCIAL STATEMENTS
The consolidated financial statements which comprise the Statement of Profit or Loss and other Comprehensive Income, Statement of Financial Position, Statement of Cash Flows, Statement of Changes in Equity and Notes to the financial statements of the Company and the Group for the year ended 31st March 2017 are set out on pages 60 to 117. These financial statements do comply with the requirements of the Companies Act, No. 07 of 2007.
4.1. Revenue
The Company and the Group generated revenue of Rs. 510.2 Mn and Rs. 1,742.3 Mn (2016 – Rs. 601.6 Mn and Rs. 1,176.3 Mn) for which a detailed analysis is given in note 11 to the Financial Statements.
4.2. Financial results and appropriation
An abridgement of the financial performance of the Company and the Group is presented in the table below:
In Rupees Thousands Group CompanyFor the year ended 31st March 2017 2016 2017 2016
Retained earnings brought forward from previous year 7,402,499 7,303,903 4,059,375 4,075,797Super Gain Tax for the year of Assessment 2013/14 - (56,595) - (13,919)Adjusted retained earnings brought forward from previous year 7,402,499 7,247,308 4,059,375 4,061,878Profit for the year 1,028,750 512,879 313,972 420,902Other comprehensive income for the year 1,520 93 - -Cash dividend (266,341) (263,509) (266,341) (263,509)Scrip dividend - (175,673) - (175,673)Effect due to change in share holdings 347 176 - -Forfeiture of unclaimed dividends 4,258 6,240 2,241 2,557Transfers 9,340 74,985 - 13,220Retained earnings carried forward 8,180,373 7,402,499 4,109,247 4,059,375

4.3. Significant accounting policies
The significant accounting policies adopted in the preparation of these financial statements are given on pages 65 to 78.
4.4. Investment in Financial Instruments
Investments in financial instruments of the Group and the Company represents investments in available for sale financial assets and investments in fair value through profit or loss financial assets, categorised in to,
Fair value hierarchy Level 1 - quoted securities, unit trusts
Fair value hierarchy Level 3 – unquoted and private equity securities (unlisted equity investments).
The information on the fair values of the investments classified as “available for sale financial assets” and investments classified as fair value through profit or loss financial assets are given in notes 22 and 24 respectively.
Further, the note 32.5 provides an analysis of these financial instruments which are carried at fair value, by the levels in the fair value hierarchy.
4.5. Reserve
As at 31st March 2017, the total reserves stood at Rs. 5,492.5 mn and Rs. 14,277 mn (2016 - Rs. 5,079.8 mn and Rs. 15,008.6 mn ) for the Company and the Group respectively.
The movements of the above reserves are set out in the Statement of Changes in Equity.
5. STATEMENT OF DIRECTORS’ RESPONSIBILITIES
The responsibilities of the Directors, in relation to the Financial Statements are detailed in the following paragraphs, whilst the responsibilities of the Auditors are set out in the Independent Auditors’ Report.
According to the Companies Act, No. 07 of 2007 and the Sri Lanka Accounting and Auditing Standards Act, No. 15 of 1995, the Directors are required to prepare financial statements for each financial year, giving a true and fair
view of the state of affairs of the Company and the Group as at the end of the financial year and of the performance for the said period.
The financial statements comprise of inter alia:
• a Statement of Financial Position, which presents a true and fair view of the state of affairs of the Company and the Group as at the end of the financial year,
• a Statement of Profit or Loss and Other Comprehensive Income of the Company, which presents a true and fair view of the Profit and Loss and Other Comprehensive Income of the Company and the Group for the financial year.
In preparing these financial statements, the Directors are required to ensure that:
• appropriate accounting policies have been selected and applied consistently, while material departures, if any, have been disclosed and explained;
• all applicable Accounting Standards have been complied with;
• reasonable and prudent judgments and estimates have been made; and
• provides the information required by and otherwise comply with the Companies Act No. 07 of 2007 and the Listing Rules of the Colombo Stock Exchange.
The Directors are responsible for ensuring that the Company and the Group maintains sufficient accounting records to disclose with reasonable accuracy, the financial position of the Company and the Group in order to ensure that its Financial Statements have been prepared and presented in accordance with Sri Lanka Accounting and Auditing Standards Act No. 15 of 1995 and meet with the requirements of the Companies Act No. 07 of 2007.
They are also responsible for taking reasonable measures to safeguard the assets of the Company and the Group and in this regard to give proper consideration to the establishment and effective operation of appropriate systems of internal control with a view to prevent, detect and rectify fraud and other irregularities.
Management Discussion and Analysis
Our Performance Governance and Risk Management
Financial Information Supplementary Information

Ceylon Guardian Investment Trust PLC Annual Report 2016/17 42 43
These financial statements have been prepared on a going concern basis since the Directors are of the view that the Company has adequate resources to continue in operation in the foreseeable future from the date of approving these financial statements.
The Directors are also of the view that they have discharged their responsibilities as set out in this statement.
6. OUTSTANDING LITIGATION
There is no litigation currently pending against the Company.
7. INTERESTS REGISTER
The Company maintains an Interests Register conforming to the provisions of the Companies Act no. 07 of 2007.
All Directors have made declarations as provided for in Section 192 (2) of the Companies Act aforesaid.
The relevant details as required by the Companies Act No. 07 of 2007 have been entered in the Interests Register during the year under review.
The Interests Register is available for inspection as required under the Companies Act.
7.1. Remuneration of Directors
Directors’ Remuneration for the financial year ended 31st March 2017 is given in note 12 to the financial statements.
7.2. Directors’ Interest in Contracts and Shares
Directors’ interests in contracts of the Company have been declared at Meetings of the Directors. The Directors have had no direct or indirect interest in any other contracts or proposed contracts in relation to the business of the Company except for the following;
Name of the Company Common directors Nature of the transactions Value of the transactions
Carson Cumberbatch PLC D. C. R. GunawardenaK. Selvanathan
Dividend paid 184,575
Ceylon Investment PLC D. C. R. GunawardenaMrs. M. A. R. C. CoorayV. M. FernandoK. SelvanathanT. C. M. Chia
Mrs. W. Y. R. Fernando
Dividends received 112,019
Guardian Fund Management Limited (GFM)
K. SelvanathanMrs. W. Y. R. Fernando
Portfolio management fees paidBusiness development fees paid
13,732 21,500
Rubber Investment Trust Limited
D. C. R. Gunawardena Dividends received 103,377
Carsons Management Services (Private) Limited
K. Selvanathan Support service fees paidComputer fees paidSecretarial fees paid
13,183 420403
Hatton National Bank PLC Mrs. M. A. R. C. Cooray Interest income receivedBalances held in demand depositsBank charges paid
5,979 626
5
Annual Report of the Board of Directors on the affairs of the Company
The Directors had the following interests in the ordinary shares of the Company as shown in the table below.
Directors No. of shares as at
31st March
2017
31st March
2016
Mrs. M. A. R. C. Cooray (Chairperson) *
- -
Mr. D. C. R. Gunawardena 257 257
Mr. V. M. Fernando - -
Mr. K. Selvanathan - -
Mr. C .W. Knight - -
Mr. T. C. M. Chia - -
Mrs. W. Y. R. Fernando ** - -
Mr. I. Paulraj *** 257 257
*Pursuant to the resignation of Mr. I. Paulraj as Chairman / Non - Executive Director, Mrs. M. A. R. C. Cooray was appointed as the Chairperson of the Board with effect from 1st September 2016
**Appointed to the Board with effect from 15th August 2016.
***Resigned with effect from 15th August 2016.
8. DIRECTORS
The names of the Directors who served during the year are given under Corporate Information provided in the inner back cover of the Annual Report.
8.1. Changes in Directorate
Mr. I. Paulraj resigned from the Board as Chairman/ Non-Executive Director with effect from 15th August 2016. Pursuant to his resignation, Mrs. M. A. R. C. Cooray was appointed as the Chairperson of the Board with effect from 1st September 2016.
Mrs. W. Y. R. Fernando was appointed as an Executive Director to the Board with effect from 15th August 2016.
8.2. Directors to Retire by Rotation
In terms of Articles 89, 90 and 91 of the Articles of Association of the Company, Mr. K. Selvanathan and Mr. V. M. Fernando retires by rotation and being eligible offer themselves for re-election.
8.3. Retirement at the First Annual General Meeting following the appointment as a Director
In terms of Articles 88 and 95 of the Articles of Association of the Company Mrs. W. Y. R. Fernando retires from the Board and being eligible offers herself for re-election.
8.4. Appointment of Director who is over 70 years of age
Upon the recommendation of the Nomination Committee of the Company and the Board, it is recommended that Mr. C.W. Knight who is over 70 years of age, be re-appointed as Director of the Company for a further period of one year from the conclusion of the Annual General Meeting and the age limit stipulated in Section 210 of the Companies Act No.07 of 2007 shall not be applicable to them.
9. AUDITORS
Company’s Auditors during the year under review were Messrs. KPMG, Chartered Accountants.
A sum of Rs. 438,000/- and Rs. 3,090,000/-was paid to them by the Company and the Group respectively as audit fees for the year ended 31st March 2017 (2016 - Rs. 438,000/- and Rs. 2,977,000/-). In addition to the above, the auditors were paid Rs. 70,000/- and Rs. 350,000/- (2016 - Rs. 70,000/- and Rs. 510,000/-) as audit related fees for the Company and the Group respectively during the year. Also the auditors were paid Rs. 400,000/- (2016 - 2,310,000) as professional fees for non-audit services during the year.
The retiring auditors have expressed their willingness to continue in office. A resolution to re-appoint them as auditors of the Company and authorising the Directors to fix their remuneration will be proposed at the forthcoming Annual General Meeting.
Management Discussion and Analysis
Our Performance Governance and Risk Management
Financial Information Supplementary Information

Ceylon Guardian Investment Trust PLC Annual Report 2016/17 44 45
The Audit Committee reviewed the appointment of the Auditors, its effectiveness and its relationship with the Company and its subsidiaries, including the level of audit and non-audit fees paid to the Auditors.
9.1. Auditors’ relationship or any interest with the Company
The Directors are satisfied that, based on written representations made by the Independent Auditors to the Board, the Auditors do not have any interest with the Company and its subsidiaries that would impair their independence.
9.2. Independent Auditors’ Report
The Independent Auditors’ Report on the financial statements is given on page 59 of the Annual Report.
10. SIGNIFICANT EVENTS DURING THE YEAR
10.1. Company
There were no significant events during the year.
10.2. Subsidiaries
There were no significant events during the year.
11. COMPLIANCE WITH RULES OF THE COLOMBO STOCK EXCHANGE
The Board has ensured that the Company has complied with the Rules pertaining to Corporate Governance and Related Party Transactions as per the Listing Rules of the Colombo Stock Exchange (CSE).
11.1. Regulatory Benchmarks
The Company’s activities are regulated and are governed by the;
• Companies Act No.07 of 2007
• Listing Rules of the Colombo Stock Exchange (CSE)
• Rules of the Securities and Exchange Commission of Sri Lanka (SEC)
• Central Bank of Sri Lanka (CBSL)
Ceylon Guardian Investment Trust PLC and its subsidiary Ceylon Investment PLC are registered as an Underwriter with the Securities and Exchange Commission of
Sri Lanka (SEC), whilst Guardian Fund Management Limited, subsidiary of the Company, is registered with SEC as an Investment Manager.
The above registrations are renewed on an annual basis and each company has to fulfill the criteria stipulated by the SEC for such renewal. These include amongst many other provisions, the maintenance of a minimum capital, employment of qualified staff, place clear systems and procedures for handling investor/client portfolios and regular reporting and filings with the regulator.
Ceylon Guardian Investment Trust PLC owns 50% of the issued capital of Guardian Acuity Asset Management Limited (GAAM) as a Joint Venture. GAAM is registered as an Investment Manager and is a License holder for three Unit Trusts with the SEC.
The category of Investment Manager and License holders of unit trusts are also required to have in place a comprehensive KYC procedures to satisfy anti money laundering regulations when accepting third party funds to manage.
11.2. Board of Directors
The following Directors held office during the period under review and their brief profiles are given on pages 31 to 33 of the Annual Report.
Directors Executive / Non-Executive / Independent
Mrs. M.A.R.C. Cooray (Chairperson)*
Non-Executive / Independent
Mr. D. C.R. Gunawardena Non-Executive
Mr. V.M. Fernando ** Non-Executive / Independent
Mr. K. Selvanathan Executive
Mr. C.W. Knight Non-Executive / Independent
Mr. T. C. M. Chia *** Non-Executive / Independent
Mrs. W. Y. R. Fernando Executive
Mr. I. Paulraj Non-Executive
Annual Report of the Board of Directors on the affairs of the Company

Mr. I. Paulraj Chairman/ Non-Executive Director resigned from the Board with effect from 15th August 2016. Mrs. W. Y. R. Fernando was appointed to the Board with effect from 15th August 2016. Mrs. M. A. R. C. Cooray was appointed as the Chairperson of the Board with effect from 1st September 2016.
Each of the Non-Executive Directors of the Company have submitted a signed declaration on Independence/ Non-Independence as per Rule 7.10.2.(b) of the Listings Rules of the Colombo Stock Exchange (CSE). The said declarations were tabled at a Board Meeting held on 21st June 2017 in order to enable the Board of Directors to determine the Independence/Non-Independence of each of the Non-Executive Directors, in terms of Rule 7.10.3.(a) of the Listing Rule of the CSE.
* The Board has determined that Mrs. M.A.R.C. Cooray is an Independent Director in spite of being a Director of Ceylon Investment PLC, in which a majority of the other Directors of the Board are also Directors, since she is not directly involved in the management of the Company.
** The Board has also determined that Mr. V.M. Fernando is an Independent Director in spite of being on the Board for more than 9 years and being a Director of Ceylon Investment PLC, in which a majority of the other Directors of the Board are also Directors, since he is not directly involved in the management of the Company.
*** The Board has also determined that Mr. T.C.M. Chia is an Independent Director in spite of being a Director of Ceylon Investment PLC, in which a majority of the other Directors of the Board are also Directors, since he is not directly involved in the management of the company.
11.3. Directors’ Meetings Attendance
During the financial year the Board of Directors had Four Board Meetings and the attendance of the Directors were as follows;
Directors Meetings Attended (Out of 4)
Mrs. M.A.R.C. Cooray (Chairperson) 4/4
Mr. D. C.R. Gunawardena 4/4
Mr. V.M. Fernando 3/4
Mr. K. Selvanathan 4/4
Mr. C.W. Knight 3/4
Mr. T. C. M. Chia 3/4
Mrs. W. Y. R. Fernando* 2/2
Mr. I. Paulraj** 2/2
*Appointed with effect from 15th August 2016.
** Resigned with effect from 15th August 2016.
11.4. Board Evaluation
The ‘Board Evaluation Form’ of the Company focusses on the following areas;
• Core Board Responsibilities
• Board Meetings
• Committee Meetings (any/ all sub-committees)
• Relationship with Management
• Individual self-assessment
• Stakeholder and Shareholder communication/ relationship
• Suggestions/ comments
The comments made by the Directors in the Board Evaluation Form are collated by the Nomination Committee of the Company and the results and proposed actions are reported to the Board of Directors. The suggestions and recommendations made by the Directors are being reviewed and implemented by the Company.
Management Discussion and Analysis
Our Performance Governance and Risk Management
Financial Information Supplementary Information
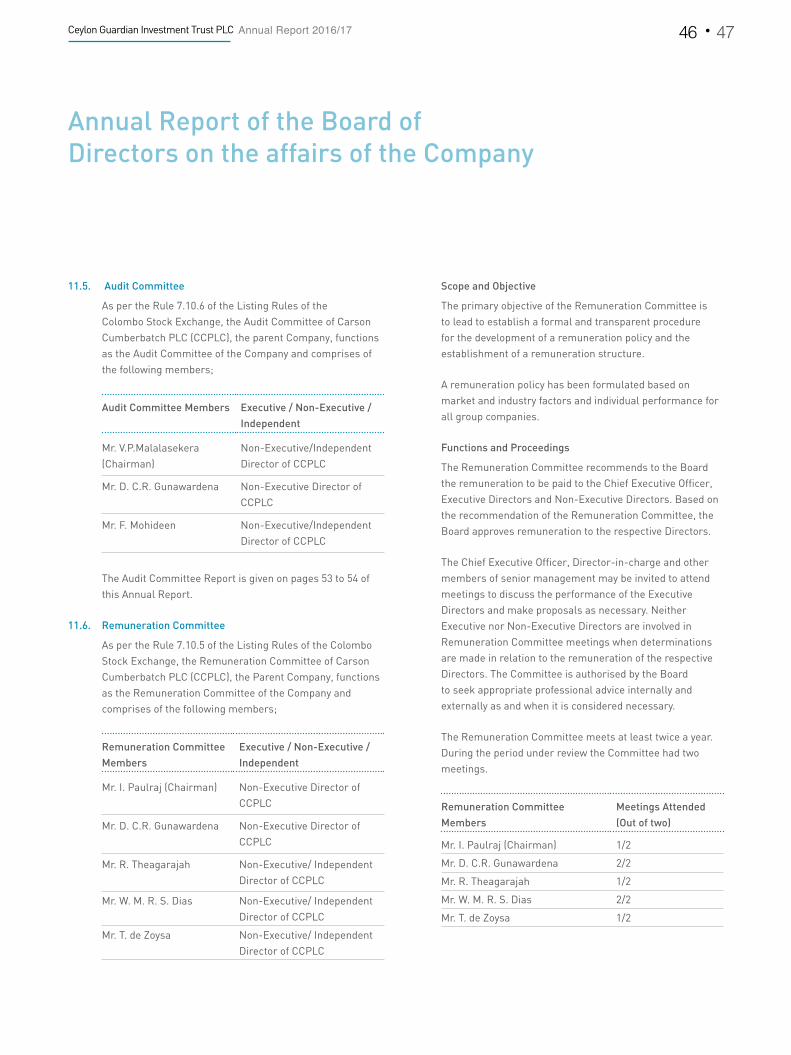
Ceylon Guardian Investment Trust PLC Annual Report 2016/17 46 47
11.5. Audit Committee
As per the Rule 7.10.6 of the Listing Rules of the Colombo Stock Exchange, the Audit Committee of Carson Cumberbatch PLC (CCPLC), the parent Company, functions as the Audit Committee of the Company and comprises of the following members;
Audit Committee Members Executive / Non-Executive / Independent
Mr. V.P.Malalasekera (Chairman)
Non-Executive/Independent Director of CCPLC
Mr. D. C.R. Gunawardena Non-Executive Director of CCPLC
Mr. F. Mohideen Non-Executive/Independent Director of CCPLC
The Audit Committee Report is given on pages 53 to 54 of this Annual Report.
11.6. Remuneration Committee
As per the Rule 7.10.5 of the Listing Rules of the Colombo Stock Exchange, the Remuneration Committee of Carson Cumberbatch PLC (CCPLC), the Parent Company, functions as the Remuneration Committee of the Company and comprises of the following members;
Remuneration Committee Members
Executive / Non-Executive / Independent
Mr. I. Paulraj (Chairman) Non-Executive Director of CCPLC
Mr. D. C.R. Gunawardena Non-Executive Director of CCPLC
Mr. R. Theagarajah Non-Executive/ Independent Director of CCPLC
Mr. W. M. R. S. Dias Non-Executive/ Independent Director of CCPLC
Mr. T. de Zoysa Non-Executive/ Independent Director of CCPLC
Scope and Objective
The primary objective of the Remuneration Committee is to lead to establish a formal and transparent procedure for the development of a remuneration policy and the establishment of a remuneration structure.
A remuneration policy has been formulated based on market and industry factors and individual performance for all group companies.
Functions and Proceedings
The Remuneration Committee recommends to the Board the remuneration to be paid to the Chief Executive Officer, Executive Directors and Non-Executive Directors. Based on the recommendation of the Remuneration Committee, the Board approves remuneration to the respective Directors.
The Chief Executive Officer, Director-in-charge and other members of senior management may be invited to attend meetings to discuss the performance of the Executive Directors and make proposals as necessary. Neither Executive nor Non-Executive Directors are involved in Remuneration Committee meetings when determinations are made in relation to the remuneration of the respective Directors. The Committee is authorised by the Board to seek appropriate professional advice internally and externally as and when it is considered necessary.
The Remuneration Committee meets at least twice a year. During the period under review the Committee had two meetings.
Remuneration Committee Members
Meetings Attended (Out of two)
Mr. I. Paulraj (Chairman) 1/2
Mr. D. C.R. Gunawardena 2/2
Mr. R. Theagarajah 1/2
Mr. W. M. R. S. Dias 2/2
Mr. T. de Zoysa 1/2
Annual Report of the Board of Directors on the affairs of the Company

Reporting and Responsibilities
The Committee Chairman reports to the Board on its proceedings on all matters within its duties and responsibilities. The Committee makes recommendations to the Board as deemed appropriate on any area within its limit where action or improvements are needed.
Aggregated remuneration paid to the Non-Executive Directors of the Company are disclosed under note 12 on page 79 of the Annual Report. Executive Directors are not compensated for their role on the Board.
11.7. Nomination Committee
The Nomination Committee of the Company comprises of the following members.
Nomination Committee Members
Executive/ Non-Executive / Independent
Mr. I. Paulraj * Non-Executive Director
Mrs. M. A.R. C. Cooray (Chairperson) **
Non-Executive/ Independent Director
Mr. D. C. R. Gunawardena Non-Executive Director
Mr. V. M. Fernando *** Non-Executive/ Independent Director
* Pursuant to his resignation from the Board, Mr. I Paulraj resigned from the Nomination Committee with effect from 15th August 2016.
** Mrs. M. A. R. C. Cooray was appointed as Chairperson to the Nomination Committee with effect from 1st September 2016.
*** Mr. V. M. Fernando was appointed to the Nomination Committee with effect from 1st September 2016.
Scope and Objective
The primary objective of the Nomination Committee is to lead the process for Board appointments of new Directors within group Companies and the nominations of members to represent the Company in group Companies/investee Companies.
Functions and Proceedings
The Nomination Committee recommends new appointments to the Board. Based on the recommendation of the Nomination Committee, the Board approves the new appointments of Executive and Non-Executive Directors to the Board.
Any Director of the Board and the Chief Executive Officer/ Director-in-Charge and other members of senior management may be invited to attend Meetings of the Nomination Committee. The Committee may also invite appointed external consultants to aid the Committee in the discharge of its duties.
The Committee is authorised by the Board to seek appropriate professional advice internally and externally as and when considered necessary.
The Nomination Committee meets at least twice a year.
During the period under review, the Committee had two meetings.
Nomination Committee Members
Attended Meetings (Out of two)
Mr. I. Paulraj* 1/2
Mrs. M.A.R.C. Cooray (Chairperson)**
2/2
Mr. D.C.R. Gunawardena 2/2
Mr. V. M. Fernando *** 1/2
Management Discussion and Analysis
Our Performance Governance and Risk Management
Financial Information Supplementary Information

Ceylon Guardian Investment Trust PLC Annual Report 2016/17 48 49
* Pursuant to his resignation from the Board, Mr. I Paulraj resigned from the Nomination Committee with effect from 15th August 2016.
** Mrs. M. A. R. C. Cooray was appointed as Chairperson to the Nomination Committee with effect from 1st September 2016.
*** Mr. V. M. Fernando was appointed to the Nomination Committee with effect from 1st September 2016.
11.8. Related Party Transactions Review Committee
As per the Rule 9.2.3 of the Listing Rules of the Colombo Stock Exchange, the Related Party Transactions Review Committee of Carson Cumberbatch PLC (CCPLC), the parent Company, functions as the Related Party Transactions Review Committee (RPTRC) of the Company.
Related Party Transactions Review Committee Members
Executive/ Non-Executive / Independent
Mr. V. P. Malalasekera (Chairman)
Non-Executive/ Independent Director of CCPLC
Mr. F. Mohideen Non-Executive/ Independent Director of CCPLC
Mr. D. C. R. Gunawardena Non-Executive Director of CCPLC
Mr. H. Selvanathan Executive Director of CCPLC
Mr. M. Selvanathan Executive Director of CCPLC
Mr. S. K. Shah Executive Director of CCPLC
The Related Party Transactions Review Committee Report is given on pages 55 and 56 of this Annual Report.
Declaration
The Directors have made self-declarations for the purpose of identifying parties related to them. The said declarations were noted at Related Party Transactions Review Committee Meetings.
The Company is in compliance with Rule 9 of the Listing Rules of the Colombo Stock Exchange pertaining to Related Party Transactions during the financial year.
11.8.1. Related Party Transactions Exceeding 10% of the Equity or 5% of the Total Assets of the Company
The Directors declare in terms of the requirements of the Listing Rules of the Colombo Stock Exchange that the transactions carried out by the Company with its Related Parties during the year ended 31st March 2017, did not exceed 10% of Equity or 5% of the Total Assets of the Company as at 31st March 2017.
The details of the Related Party Transactions are given in Note 31 to the Financial Statements.
1. Non-Recurrent Related Party Transactions
There were no Non-Recurrent Related Party Transactions entered into by the Company, where the aggregate value of the Non-Recurrent Related Party Transactions exceeds 10% of the Shareholders’ equity or 5% of the total assets, whichever is lower, of the Company as at 31st March 2017.
2. Recurrent Related Party Transactions
There were no Recurrent Related Party Transactions where the aggregate value of the Recurrent Related Party Transactions exceeds 10% of the Gross Revenue/ Income of the Company, as per the Audited Financial Statements.
12. INTERNAL CONTROL AND RISK MANAGEMENT
The ultimate responsibility to establish, monitor and review a company-wide internal control system rests with the Board of Directors. The intensity, depth and the tolerance limits for each components of the internal control system would be based on the weight of the elements of risk imposed on the sustenance of the business by the respective area of operation. Whilst a strong internal control
Annual Report of the Board of Directors on the affairs of the Company
system would mitigate the crystallisation of risk elements to a greater extent, employment of external support structures would also be necessary based on the risk assessments made thereon.
Effective maintenance of internal controls and risk identification and mitigation is handed down to the respective members of senior management within the guidelines of benchmark policies, procedures and authority limits clearly laid down.
Group internal Audit, whose scope of scrutiny is entirely driven by grading of the risk involved, will be monitoring and providing feedback to the Management and the Audit Committee. Regular submission of compliance and internal solvency certificates vouched by the Heads of the respective divisions as a mandatory agenda item keeps the Directors abreast of the position of the Company’s resource base and governance requirements.
This allows the Board to have total control of the fulfilment of governance requirements by providing opportunity to take timely preventive action in case of potential deterioration of status quo. A comprehensive description of the risk management strategies of the Company are given on pages 24 to 30 in the Annual Report.
13. HUMAN RESOURCES
The management of the Group’s investments is undertaken by Guardian Fund Management Limited (GFM) and management support services are provided by Carsons Management Services (Private) Limited (CMSL).
GFM continued to invest in human capital development and implement effective human resource practices and policies to develop and build an efficient and effective workforce aligned around new business priorities of the Group and to ensure that its employees are developing the skills and
knowledge required for the future success of the Group, centered around the core competencies required by an investment house.
The number of persons employed by GFM as at 31st March 2017 was 20 (31st March 2016 –20).
14. EQUITABLE TREATMENT TO SHAREHOLDERS
The Company endeavours at all times to ensure equitable treatment to all shareholders.
15. DIVIDENDS
15.1. PROPOSED DIVIDEND FOR THE FINANCIAL YEAR ENDED 31ST MARCH 2017
Subject to the approval of the Shareholders at the Annual General Meeting, the Board of Directors have recommended a First & Final dividend of Rs. 4/- per Ordinary share and Deferred share for the year ended 31st March 2017.
The dividend payable has not been accounted for until it is approved at the forthcoming Annual General Meeting.
The details of the dividends paid during the year are set out in note 17 to the Financial Statements.
15.2. DIVIDENDS PAID DURING THE FINANCIAL YEAR
A Final Dividend of Rs.3/- per Ordinary Share and Deferred Share for the Financial Year ended 31st March 2016 was paid on 04th August 2016.
16. SOLVENCY TEST
Taking into account the said distribution referred to under item 15.1 above, the Directors were satisfied that the Company would meet the Solvency Test requirement under Section 56 (2) of the Companies Act No.07 of 2007 immediately after the said distribution. The Company’s Auditors, Messrs. KPMG, Chartered Accountants have issued a Certificate of Solvency conforming the same.
Management Discussion and Analysis
Our Performance Governance and Risk Management
Financial Information Supplementary Information

Ceylon Guardian Investment Trust PLC Annual Report 2016/17 50 51
17. STATED CAPITAL
Stated Capital of the Company amounted to Rs.1,128.7 Mn which consists of 82,978,868 Ordinary Shares and 5,801,487 Fully paid Deferred Shares. The movement in Stated Capital of the Company is given in Note 26 to the Financial Statements.
There was no change in the Stated Capital of the Company during the year.
18. INVESTMENTS
Investments represent, investment in subsidiaries, investment in jointly controlled entity, available for sale financial assets held for capital appreciation and investments in fair value through profit or loss financial assets held for trading.
Investment in subsidiaries are detailed in note 20.
Investment in equity accounted investee is given in note 21.
Investments in Available for sale financial assets which comprise those investments held for a longer tenure, usually over 3 years are disclosed in note 22.
The investments in of fair value through profit or loss financial assets which comprise those investments held for short term gains are disclosed in note 24.
19. CAPITAL EXPENDITURE
The details of capital additions of the Group are as follows.
In Rupees Thousands Group
2017 2016
Property plant & equipment 421 3,394
Intangible assets - -
20. STATUTORY PAYMENTS
The Directors to the best of their knowledge and belief were satisfied that all statutory dues have been paid up to date or have been provided for in the financial statements.
21. GOING CONCERN
The Board of Directors is satisfied that the Company has adequate resources to continue its operations in the foreseeable future. Accordingly, the financial statements are prepared based on the going concern concept.
22. EVENTS AFTER THE REPORTING DATE
Subsequent to the reporting date, no circumstances have arisen, which would require adjustments to or disclosures in the financial statements, other than those disclosed in note 34 to the Financial Statements if any.
23. CONTINGENT LIABILITIES AND COMMITMENTS
The contingent liabilities and commitments as at 31st March 2017 are given in note 35 to the Financial Statements if any.
24. EXPENSES ON CORPORATE SOCIAL RESPONSIBILITY ACTIVITIES
The Group and the Company incurred Rs. 5 Mn (2016 – Rs. 5.5 Mn) and Rs. 2.5 Mn (2016 - Rs. 2.75 Mn) respectively as CSR related expenses by contributing to “Youth to Nation Foundation”, a Company limited by guarantee of which the main objective is to enhance the entrepreneurial, technical and business management skills of young entrepreneurs that would promote the socio economic development of Sri Lanka in a sustainable manner. The members of the said Company are Ceylon Guardian Investment Trust PLC and Ceylon Investment PLC.
Annual Report of the Board of Directors on the affairs of the Company

Management Discussion and Analysis
Our Performance Governance and Risk Management
Financial Information Supplementary Information
25. SHARE INFORMATION
The details relating to earnings, net assets, market value per share and information on share trading are given on pages 118 to 119 and 126 to 127 of the Annual Report.
26. TWENTY MAJOR SHAREHOLDERS WITH COMPARATIVES
The parent company, Carson Cumberbatch PLC holds 67.15% of the total ordinary shares in issue of the Company.
Name of shareholder 2017 2016
As at 31st March No. of
shares% No. of
shares%
1. Carson Cumberbatch Plc A/C No.2 55,723,635 67.15 55,723,635 67.15
2. Thurston Investments Limited 3,099,814 3.74 3,139,814 3.78
3. Employees Provident Fund 2,969,515 3.58 2,969,515 3.58
4. GF Capital Global Limited 1,617,666 1.95 1,599,983 1.93
5. Mellon Bank N.A.-Commonwealth Of Massachusetts 1,374,657 1.66 1,374,657 1.66
6. Miss G.I.A. De Silva 877,611 1.06 877,611 1.06
7. Mr. G.J.W. De Silva 877,232 1.06 877,232 1.06
8. Mrs. M.L. De Silva 866,837 1.04 866,837 1.04
9. Miss M.P. Radhakrishnan 686,026 0.83 1,010 0.00
10. Miss A. Radhakrishnan 686,026 0.83 1,010 0.00
11. Mr. R. Maheswaran 685,016 0.83 - 0.00
12. Mr. K.C. Vignarajah 623,408 0.75 621,958 0.75
13. Mr. H.A. Van Starrex 585,491 0.71 587,991 0.71
14. Employees Trust Fund Board 490,998 0.59 490,998 0.59
15. The Ceylon Desiccated Coconut And Oil Company Pvt 386,550 0.47 386,550 0.47
16. Waldock Mackenzie Ltd/Mr. M.A.N. Yoosufali 373,700 0.45 354,100 0.43
17. Mrs. S.E. Lokhandwalla 358,502 0.43 358,502 0.43
18. Miss G.N.A. De Silva 353,250 0.43 353,250 0.43
19. Mr. O.D. Liyanage 266,443 0.32 266,443 0.32
20. Timex Garments (Pvt) Ltd 252,689 0.30 252,689 0.30

Ceylon Guardian Investment Trust PLC Annual Report 2016/17 52 53
27. ANNUAL REPORT
The information provided herein is in pursuance of the requirements of the Companies Act No.07 of 2007 and the Listing Rules of the Colombo Stock Exchange.
The Board of Directors have approved the Financial Statements of the Company together with the Reviews which form part of the Annual Report on 21st June 2017.
The appropriate number of copies of the Annual Report will be submitted to the Colombo Stock Exchange, the Sri Lanka Accounting and Auditing Standards Monitoring Board and the Registrar General of Companies, within applicable time frames.
28. ANNUAL GENERAL MEETING
The 65th Annual General Meeting of the Company will be held on Wednesday the 26th day of July 2017 at 3.30 p.m. at the Auditorium, The Institute of Chartered Accountants of Sri Lanka, Ground Floor, 30A, Malalasekera Mawatha, Colombo 07, Sri Lanka. The Notice of the Annual General Meeting, setting out the business which will be transacted thereat is on page 128 of the Annual Report.
Signed on behalf of the Board,
(Sgd.) (Sgd.)M.A.R.C. Cooray (Mrs) D.C.R.GunawardenaChairperson Director
(Sgd.)K. D. De Silva (Mrs.)Director
Carsons Management Services (Private) LimitedSecretariesColombo
21st June 2017
Annual Report of the Board of Directors on the affairs of the Company

Audit Committee Report
The Audit Committee of Carson Cumberbatch PLC (CCPLC)-the Parent Company functions as the Audit Committee of the Company.
The Audit Committee consists of the following Members :
Audit Committee Members Executive/Non-Executive/Independent
Mr.Vijaya Malalasekera (Chairman)
Non-Executive, Independent (CCPLC)
Mr.Chandima Gunawardena Non-Executive (CCPLC)
Mr.Faiz Mohideen Non-Executive, Independent (CCPLC)
Mr.Vijaya Malalasekera is a Non-Executive, Independent Director of CCPLC and a former Director of Ceylon Tobacco Company PLC.
Mr.Chandima Gunawardena is a Non-Executive Director of CCPLC and in most of its Group Companies. He is a Fellow of the Chartered Institute of Management Accountants, U.K.
Mr.Faiz Mohideen, a Non-Executive, Independent Director of CCPLC was a former Deputy Secretary to the Treasury and a former Director of Bank of Ceylon and Securities and Exchange Commission of Sri Lanka.
The purpose of the Audit Committee of CCPLC is as follows :
To assist the Board of Directors in fulfilling its oversight responsibilities for the financial reporting process, the system of internal control over financial reporting, the audit process and the Company’s process for monitoring compliance with laws and regulations, Company policies and procedures and the code of conduct.
To ensure that the internal audit activity is well managed, so that it adds value to the organization by being objective in providing relevant assurance, contributing to the effectiveness and efficiency of governance, risk management and control processes.
The audit aspects of Ceylon Guardian Investment Trust PLC are conducted within the Agenda of CCPLC-Audit Committee.
CCPLC-Audit Committee held five (05) Meetings during the financial year to discuss matters relating to the Company and the attendance of the Members of the Audit Committee was as follows:
Meetings attended (out of 05)
Mr.Vijaya Malalasekera (Chairman) 05
Mr.Chandima Gunawardena 04
Mr.Faiz Mohideen 05
Director-Guardian Fund Management Limited-Investment Managers, Financial Controller-Carsons Management Services (Private) Limited-Managers, internal auditors and senior management staff members of the Investment Sector also attended the Audit Committee Meetings by invitation.
The Committee met the External Auditors, Messrs. KPMG, twice during the year to discuss the audit scope and to deliberate the draft Financial Report and Accounts. The Audit Committee also discussed the draft Financial Report and Accounts, with the External Auditors, without the management being present to foster an unbiased, independent dialogue.
The Audit Committee approved the audit plan for the financial year 2016/2017 and the Group Internal Audit (GIA) carried out 05 audits on the Investment Sector companies based on the plan.
The findings and contents of the Group Internal Audit reports have been discussed with the relevant management staff and subsequently the audit reports were circulated to the Audit Committee and to the senior management.
The objectives of the GIA work was to have an independent review of the system of internal controls as established by the management, its adequacy and integrity vis-à-vis objectives served and to determine the extent of adherence to the controls by staff responsible for the function and to take corrective/preventive action where necessary.
The IT consultancy division of Messrs.KPMG, has during the year completed a comprehensive external IT security and process audit covering the IT environment of Carsons Management Services (Private) Limited (Managers to the Company), which covers the
Management Discussion and Analysis
Our Performance Governance and Risk Management
Financial Information Supplementary Information

Ceylon Guardian Investment Trust PLC Annual Report 2016/17 54 55
centralized IT services provided to the Investment Sector, as well. This exercise facilitated Carsons Management Services (Private) Limited to obtain IAO/IEC 27001:2013 certification in November 2016.
The interim financial statements of Ceylon Guardian Investment Trust PLC have been reviewed by the Audit Committee Members at Audit Committee Meetings, prior to release of same to the Regulatory Authorities and to the shareholders.
The draft financial statements of Ceylon Guardian Investment Trust PLC for the year ended 31st March 2017 were reviewed at a Meeting of the Audit Committee, together with the External Auditors, Messrs. KPMG, prior to release of same to the Regulatory Authorities and to the shareholders. The Audit Committee was provided with confirmations and declarations as required, by the Managers, Carsons Management Services (Private) Limited that the said financial statements were prepared in accordance with the Sri Lanka Accounting Standards and the information required by the Companies Act No. 7 of 2007 therein and presented a true and fair view of the Company’s state of affairs as at that date and the Company’s activities during the year under review.
The Audit Committee has determined that Messrs.KPMG, Chartered Accountants, Auditors were independent on the basis that they did not carry out any management related functions of the Company.
The Audit Committee has concurred to recommend to the Board of Directors the re-appointment of Messrs. KPMG, Chartered Accountants, as Auditors for the financial year ending 31st March 2018, subject to the approval of the shareholders of Ceylon Guardian Investment Trust PLC at the Annual General Meeting.
(Sgd.)V.P. MalalasekeraChairman – Audit CommitteeCarson Cumberbatch PLC
Colombo21st June 2017
Audit Committee Report
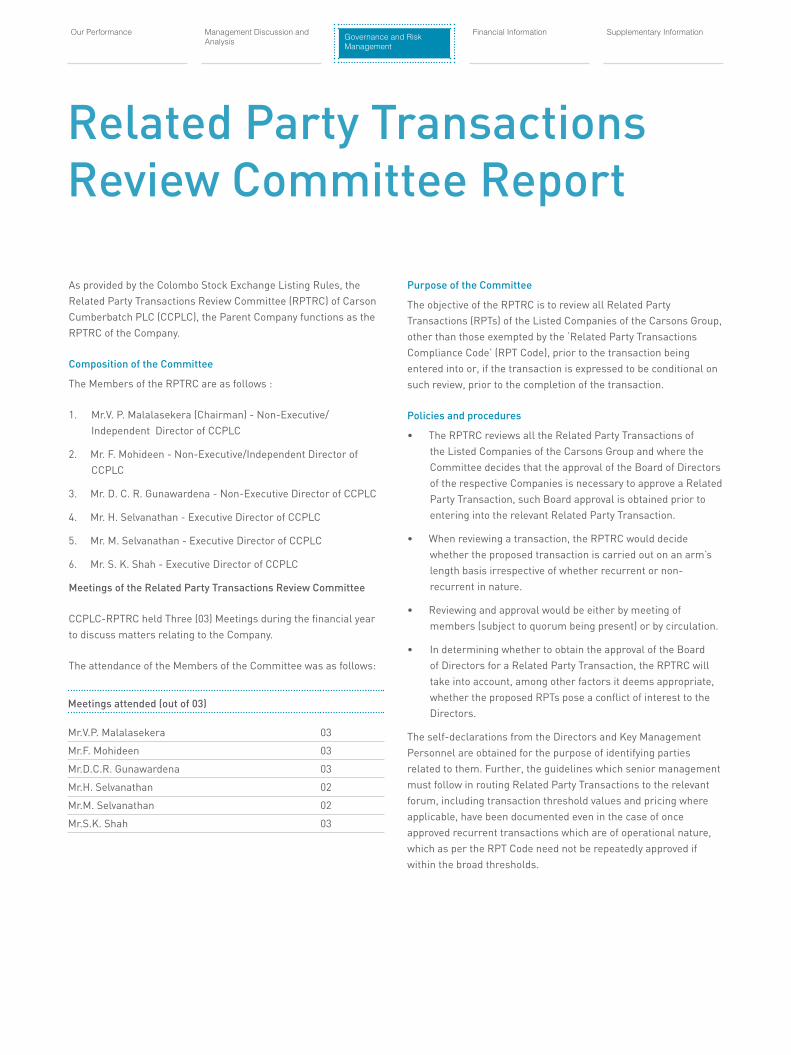
Related Party Transactions Review Committee Report
As provided by the Colombo Stock Exchange Listing Rules, the Related Party Transactions Review Committee (RPTRC) of Carson Cumberbatch PLC (CCPLC), the Parent Company functions as the RPTRC of the Company.
Composition of the Committee
The Members of the RPTRC are as follows :
1. Mr.V. P. Malalasekera (Chairman) - Non-Executive/Independent Director of CCPLC
2. Mr. F. Mohideen - Non-Executive/Independent Director of CCPLC
3. Mr. D. C. R. Gunawardena - Non-Executive Director of CCPLC
4. Mr. H. Selvanathan - Executive Director of CCPLC
5. Mr. M. Selvanathan - Executive Director of CCPLC
6. Mr. S. K. Shah - Executive Director of CCPLC
Meetings of the Related Party Transactions Review Committee
CCPLC-RPTRC held Three (03) Meetings during the financial year to discuss matters relating to the Company.
The attendance of the Members of the Committee was as follows:
Meetings attended (out of 03)
Mr.V.P. Malalasekera 03
Mr.F. Mohideen 03
Mr.D.C.R. Gunawardena 03
Mr.H. Selvanathan 02
Mr.M. Selvanathan 02
Mr.S.K. Shah 03
Purpose of the Committee
The objective of the RPTRC is to review all Related Party Transactions (RPTs) of the Listed Companies of the Carsons Group, other than those exempted by the ‘Related Party Transactions Compliance Code’ (RPT Code), prior to the transaction being entered into or, if the transaction is expressed to be conditional on such review, prior to the completion of the transaction.
Policies and procedures
• The RPTRC reviews all the Related Party Transactions of the Listed Companies of the Carsons Group and where the Committee decides that the approval of the Board of Directors of the respective Companies is necessary to approve a Related Party Transaction, such Board approval is obtained prior to entering into the relevant Related Party Transaction.
• When reviewing a transaction, the RPTRC would decide whether the proposed transaction is carried out on an arm’s length basis irrespective of whether recurrent or non-recurrent in nature.
• Reviewing and approval would be either by meeting of members (subject to quorum being present) or by circulation.
• In determining whether to obtain the approval of the Board of Directors for a Related Party Transaction, the RPTRC will take into account, among other factors it deems appropriate, whether the proposed RPTs pose a conflict of interest to the Directors.
The self-declarations from the Directors and Key Management Personnel are obtained for the purpose of identifying parties related to them. Further, the guidelines which senior management must follow in routing Related Party Transactions to the relevant forum, including transaction threshold values and pricing where applicable, have been documented even in the case of once approved recurrent transactions which are of operational nature, which as per the RPT Code need not be repeatedly approved if within the broad thresholds.
Management Discussion and Analysis
Our Performance Governance and Risk Management
Financial Information Supplementary Information

Ceylon Guardian Investment Trust PLC Annual Report 2016/17 56 57
The RPTRC in discharging its function has introduced processes and periodic reporting by the relevant entities with a view to ensuring that:
• there is compliance with the Code;
• shareholder interests are protected; and
• fairness and transparency are maintained.
The Committee has a criteria for designating Carsons Group Key Management Personnel (KMP) and the KMPs so designated are required to provide quarterly disclosures.
The Related Party Transactions of the Company for the period 1st April 2016 to 31st March 2017 have been reviewed by the Members of the RPTRC and the comments and observations of the Committee have been communicated to the Board of Directors of the Company.
(Sgd.)V.P. MalalasekeraChairman – Related Party Transactions Review Committee Carson Cumberbatch PLC Colombo21st June 2017
Related Party Transactions Review Committee Report
Financial Statements

Ceylon Guardian Investment Trust PLC Annual Report 2016/17 58 59
Financial Calendar
Financial year end: 31st March 2017
65th Annual General Meeting to be held on 26th July 2017
ANNOUNCEMENT OF RESULTS
Interim Financial Statements published in terms of the Listing Rules of the Colombo Stock Exchange
1st Quarter ended 30th June 2016 : 12th August 2016
2nd Quarter ended 30th September 2016 : 15th November 2016
3rd Quarter ended 31st December 2016 : 14th February 2017
4th Quarter ended 31st March 2017 : 31st May 2017
Independent Auditors’ Report
Management Discussion and Analysis
Our Performance Financial InformationGovernance and Risk Management
Supplementary Information
TO THE SHAREHOLDERS OF CEYLON GUARDIAN INVESTMENT TRUST PLC
Report on the Financial Statements
We have audited the accompanying financial statements of Ceylon Guardian Investment Trust PLC, (“the Company”) and the consolidated financial statements of the Company and its subsidiaries (“the Group”), which comprise the statement of financial position as at March 31, 2017, and the statements of profit or loss and other comprehensive income, changes in equity and, cash flows for the year then ended, and a summary of significant accounting policies and other explanatory information set out on pages 60 to 117.
Board’s Responsibility for the Financial Statements
The Board of Directors (“Board”) is responsible for the preparation of these financial statements that give a true and fair view in accordance with Sri Lanka Accounting Standards, and for such internal control as Board determines is necessary to enable the preparation of financial statements that are free from material misstatement, whether due to fraud or error.
Auditors’ Responsibility
Our responsibility is to express an opinion on these financial statements based on our audit. We conducted our audit in accordance with Sri Lanka Auditing Standards. Those standards require that we comply with ethical requirements and plan and perform the audit to obtain reasonable assurance about whether the financial statements are free from material misstatement.
An audit involves performing procedures to obtain audit evidence about the amounts and disclosures in the financial statements. The procedures selected depend on the auditors’ judgment, including the assessment of the risks of material misstatement of the financial statements, whether due to fraud or error. In making those risk assessments, the auditor considers internal control relevant to the entity’s preparation of the financial statements that give a true and fair view in order to design audit procedures that are appropriate in the circumstances, but not for the purpose of expressing an opinion on the effectiveness of the entity’s internal control. An audit also
includes evaluating the appropriateness of accounting policies used and the reasonableness of accounting estimates made by Board, as well as evaluating the overall presentation of the financial statements.
We believe that the audit evidence we have obtained is sufficient and appropriate to provide a basis for our audit opinion.
Opinion
In our opinion, the consolidated financial statements give a true and fair view of the financial position of the Group as at March 31, 2017, and of its financial performance and cash flows for the year then ended in accordance with Sri Lanka Accounting Standards.
Report on Other Legal and Regulatory Requirements
As required by section 163 (2) of the Companies Act No. 07 of 2007, we state the following:
a) The basis of opinion and scope and limitations of the audit are as stated above.
b) In our opinion:
- we have obtained all the information and explanations that were required for the audit and, as far as appears from our examination, proper accounting records have been kept by the Company,
- the financial statements of the Company give a true and fair view of its financial position as at 31 March 2017, and of its financial performance and cash flows for the year then ended in accordance with Sri Lanka Accounting Standards.
- the financial statements of the Company, and the Group comply with the requirements of sections 151 and 153 of the Companies Act No 07 of 2007.
CHARTERED ACCOUNTANTS
Colombo
21st June 2017

Ceylon Guardian Investment Trust PLC Annual Report 2016/17 60 61
In Rupees Thousands
Statement of Profit or Loss and Other Comprehensive Income
Group Company
For the year ended 31st March Note 2017 2016 2017 2016
Revenue 11 1,742,298 1,176,326 510,249 601,591
Impairment loss on available for sale financial assets (198,826) (95,232) (103,611) (45,667)
Net change in fair value of fair value through profit or loss financial assets (51,206) (211,643) 1,870 (19,614)Profit on investment activities 1,492,266 869,451 408,508 536,310 Other operating income - 198 - 99 Administrative and other operating expenses (217,726) (232,004) (90,802) (109,200)Profit from operations 12 1,274,540 637,645 317,706 427,209 Net finance income / (expense) 13 173 (381) (56) (93)Profit from operations after net finance income / (expense) 1,274,713 637,264 317,650 427,116 Share of profit of equity accounted investee, net of tax 14 2,747 4,809 - - Profit before taxation 1,277,460 642,073 317,650 427,116 Income tax expense 15 (21,126) (30,873) (3,678) (6,214)Profit for the year 1,256,334 611,200 313,972 420,902
Other comprehensive incomeItems that will never be reclassified to profit or lossActuarial gain on employee benefit obligation 29 1,520 93 - -
Items that are or may be reclassified to profit or lossNet change in fair value of available for sale financial assets (1,180,280) (7,592,354) 356,164 (306,415)
Transfer of realised (gains) / loss on disposal of available for sale financial assets (696,487) (580,138) 6,722 (205,251)
Share of other comprehensive income of equity accounted investee net of tax 14 2,505 955 - -
Net exchange differences on translation of foreign operations 14,857 34,695 - - Other comprehensive income / (expense) for the year (1,857,885) (8,136,749) 362,886 (511,666)Total comprehensive income / (expense) for the year (601,551) (7,525,549) 676,858 (90,764)
Profit attributable to:Equity holders of the parent 1,028,750 512,879 - - Non controlling interest 227,584 98,321 - -
1,256,334 611,200 - -
Total comprehensive expense attributable to:Equity holders of the parent (469,811) (6,179,746) - - Non controlling interest (131,740) (1,345,803) - -
(601,551) (7,525,549) - -
Earnings per share (Rs.) 16 11.59 5.78 3.54 4.74
The notes to the financial statements from pages 65 to 117 form an integral part of these financial statements. Figures in brackets indicate deductions.
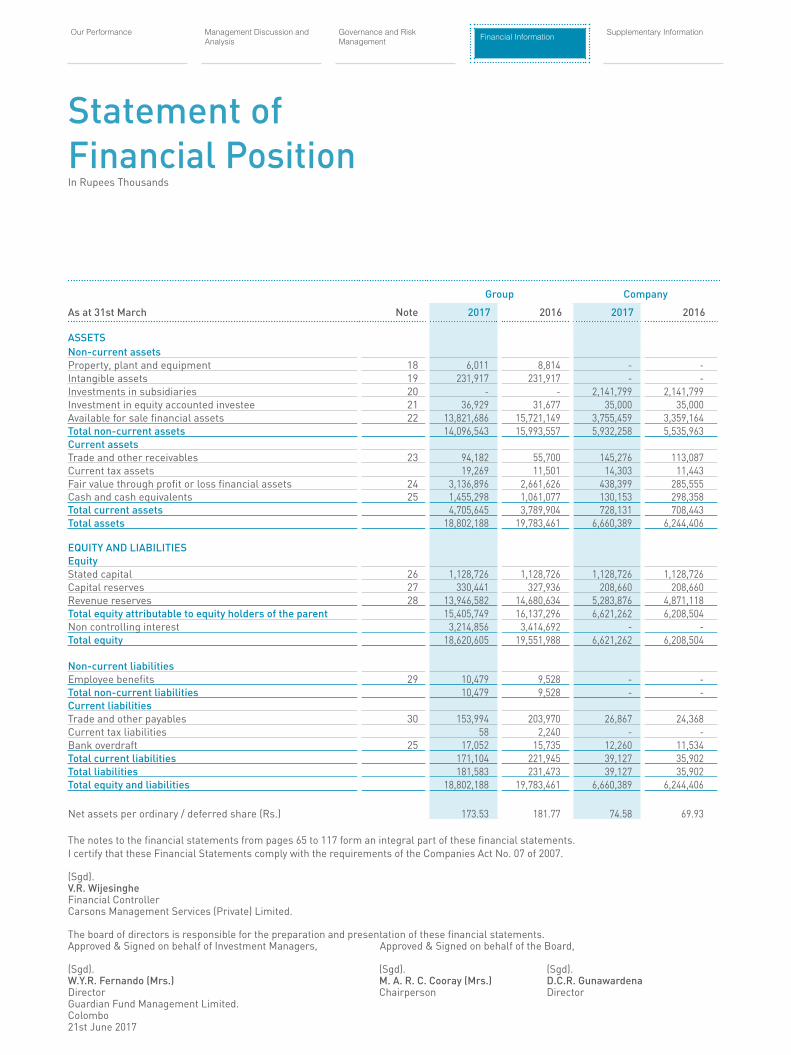
In Rupees Thousands
Statement of Financial Position
Group Company
As at 31st March Note 2017 2016 2017 2016
ASSETSNon-current assetsProperty, plant and equipment 18 6,011 8,814 - - Intangible assets 19 231,917 231,917 - - Investments in subsidiaries 20 - - 2,141,799 2,141,799 Investment in equity accounted investee 21 36,929 31,677 35,000 35,000 Available for sale financial assets 22 13,821,686 15,721,149 3,755,459 3,359,164 Total non-current assets 14,096,543 15,993,557 5,932,258 5,535,963 Current assetsTrade and other receivables 23 94,182 55,700 145,276 113,087 Current tax assets 19,269 11,501 14,303 11,443 Fair value through profit or loss financial assets 24 3,136,896 2,661,626 438,399 285,555 Cash and cash equivalents 25 1,455,298 1,061,077 130,153 298,358 Total current assets 4,705,645 3,789,904 728,131 708,443 Total assets 18,802,188 19,783,461 6,660,389 6,244,406
EQUITY AND LIABILITIESEquityStated capital 26 1,128,726 1,128,726 1,128,726 1,128,726 Capital reserves 27 330,441 327,936 208,660 208,660 Revenue reserves 28 13,946,582 14,680,634 5,283,876 4,871,118 Total equity attributable to equity holders of the parent 15,405,749 16,137,296 6,621,262 6,208,504 Non controlling interest 3,214,856 3,414,692 - - Total equity 18,620,605 19,551,988 6,621,262 6,208,504
Non-current liabilitiesEmployee benefits 29 10,479 9,528 - - Total non-current liabilities 10,479 9,528 - - Current liabilitiesTrade and other payables 30 153,994 203,970 26,867 24,368 Current tax liabilities 58 2,240 - - Bank overdraft 25 17,052 15,735 12,260 11,534 Total current liabilities 171,104 221,945 39,127 35,902 Total liabilities 181,583 231,473 39,127 35,902 Total equity and liabilities 18,802,188 19,783,461 6,660,389 6,244,406
Net assets per ordinary / deferred share (Rs.) 173.53 181.77 74.58 69.93
The notes to the financial statements from pages 65 to 117 form an integral part of these financial statements.I certify that these Financial Statements comply with the requirements of the Companies Act No. 07 of 2007. (Sgd). V.R. Wijesinghe Financial Controller Carsons Management Services (Private) Limited. The board of directors is responsible for the preparation and presentation of these financial statements. Approved & Signed on behalf of Investment Managers, Approved & Signed on behalf of the Board, (Sgd). (Sgd). (Sgd). W.Y.R. Fernando (Mrs.) M. A. R. C. Cooray (Mrs.) D.C.R. Gunawardena Director Chairperson Director Guardian Fund Management Limited. Colombo 21st June 2017
Management Discussion and Analysis
Our Performance Financial InformationGovernance and Risk Management
Supplementary Information

Ceylon Guardian Investment Trust PLC Annual Report 2016/17 62 63
Statement of Changes In EquityIn Rupees Thousands
Stat
ed
capit
al
Capit
al re
serv
es
Reve
nue r
eser
ves
Attri
buta
ble
to eq
uity
hold
ers o
f pa
rent
Non
co
ntro
lling
in
tere
st
Tota
l eq
uity
Inve
stmen
tre
serv
e O
ther
capit
alre
serv
e
Join
tly c
ontro
lled
entit
y'sca
pital
re
serv
e
Cur
renc
y tra
nsla
tion
rese
rve
Fair
valu
e th
roug
h pr
ofit
orlo
ss
finan
cial
asse
ts
rese
rve
Gen
eral
re
serv
e A
vaila
ble
for s
ale
finan
cial
asse
ts
rese
rve
Ret
ained
ea
rnin
gs
Grou
pBa
lanc
e as
at 1s
t Apr
il 20
15
953,
167
7,80
531
6,74
12,
435
35,5
7785
,028
32,6
6813
,893
,520
7,30
3,90
322
,630
,844
4,82
7,63
727
,458
,481
Supe
r Gai
n Ta
x for
the
year
of A
sses
smen
t 2
013/
14*
--
--
--
--
(56,
595)
(56,
595)
(14,
945)
(71,
540)
Adju
sted
bal
ance
as at
1st A
pril
2015
953,
167
7,80
531
6,74
12,
435
35,5
7785
,028
32,6
6813
,893
,520
7,24
7,30
822
,574
,249
4,81
2,69
227
,386
,941
Prof
it fo
r the
year
-
--
--
--
-51
2,87
951
2,87
998
,321
611,
200
Othe
r com
preh
ensiv
e in
com
e / (
expe
nse)
f
or th
e ye
ar-
--
955
24,2
62-
-(6
,717
,935
)93
(6,6
92,6
25)
(1,4
44,1
24)
(8,1
36,7
49)
Tota
l com
preh
ensiv
e in
com
e / (
expe
nse)
f
or th
e ye
ar-
--
955
24,2
62-
-(6
,717
,935
)51
2,97
2(6
,179
,746
)(1
,345
,803
)(7
,525
,549
)Ca
sh d
ivide
nd-
--
--
--
-(2
63,5
09)
(263
,509
)(5
7,31
9)(3
20,8
28)
Scrip
divi
dend
175,
559
--
--
--
-(1
75,6
73)
(114
)(3
,127
)(3
,241
)Ef
fect
due
to ch
ange
in sh
are
hold
ings
--
--
--
--
176
176
6,56
16,
737
Forfe
iture
of u
ncla
imed
divi
dend
s-
--
--
--
-6,
240
6,24
01,
688
7,92
8Tr
ansf
ers (
note
28.2
)-
--
--
(74,
985)
--
74,9
85-
--
Bala
nce
as at
31st
Mar
ch 20
161,
128,
726
7,80
531
6,74
13,
390
59,8
3910
,043
32,6
687,
175,
585
7,40
2,49
916
,137
,296
3,41
4,69
219
,551
,988
Bala
nce
as at
1st A
pril
2016
1,12
8,72
67,
805
316,
741
3,39
059
,839
10,0
4332
,668
7,17
5,58
57,
402,
499
16,1
37,2
963,
414,
692
19,5
51,9
88Pr
ofit
for t
he ye
ar-
--
--
--
-1,
028,
750
1,02
8,75
022
7,58
41,
256,
334
Othe
r com
preh
ensiv
e in
com
e / (
expe
nse)
f
or th
e ye
ar-
--
2,50
510
,582
--
(1,5
13,1
68)
1,52
0(1
,498
,561
)(3
59,3
24)
(1,8
57,8
85)
Tota
l com
preh
ensiv
e in
com
e / (
expe
nse)
f
or th
e ye
ar-
--
2,50
510
,582
--
(1,5
13,1
68)
1,03
0,27
0(4
69,8
11)
(131
,740
)(6
01,5
51)
Cash
divi
dend
--
--
--
--
(266
,341
)(2
66,3
41)
(62,
045)
(328
,386
)Ef
fect
due
to ch
ange
in sh
are
hold
ings
--
--
--
--
347
347
(7,1
67)
(6,8
20)
Forfe
iture
of u
ncla
imed
divi
dend
s-
--
--
--
-4,
258
4,25
81,
116
5,37
4Tr
ansf
ers (
note
28.2
)-
--
--
(9,3
40)
--
9,34
0-
--
Bala
nce
as at
31st
Mar
ch 20
171,
128,
726
7,80
531
6,74
15,
895
70,4
2170
332
,668
5,66
2,41
78,
180,
373
15,4
05,7
493,
214,
856
18,6
20,6
05
The
note
s fr
om p
ages
65
to 1
17 fo
rm a
n in
tegr
al p
art o
f the
se fi
nanc
ial s
tate
men
ts.
Figu
res
in b
rack
ets
indi
cate
ded
uctio
ns.
*As
per
the
prov
isio
ns o
f Par
t III
of th
e Fi
nanc
e A
ct, N
o. 1
0 of
201
5, a
ltho
ugh
the
Com
pani
es in
the
Gro
up d
id n
ot b
ecom
e lia
ble
to p
ay S
uper
Gai
n Ta
x as
sta
nd-a
lone
en
titie
s, R
s. 7
1.54
Mn
was
pai
d as
Sup
er G
ain
Tax
on th
e ba
sis
that
the
Gro
up is
par
t of t
he B
ukit
Dar
ah P
LC g
roup
, of w
hich
the
cons
olid
ated
pro
fit b
efor
e ta
x ex
ceed
ed
the
thre
shol
d st
ipul
ated
in th
e af
ores
aid
Act
. Acc
ordi
ng to
the
Act
, the
Sup
er G
ain
Tax
shal
l be
deem
ed to
be
an e
xpen
ditu
re in
the
finan
cial
sta
tem
ents
rel
atin
g to
the
year
of a
sses
smen
t whi
ch c
omm
ence
d on
1 A
pril
2014
. The
Act
sup
erse
des
the
requ
irem
ents
of t
he S
ri L
anka
Acc
ount
ing
Stan
dard
s an
d he
nce
the
expe
nse
of S
uper
G
ain
Tax
is a
ccou
nted
in a
ccor
danc
e w
ith th
e re
quir
emen
ts o
f the
sai
d A
ct a
s re
com
men
ded
by th
e St
atem
ent o
f Alt
erna
tive
Trea
tmen
t (So
AT) o
n A
ccou
ntin
g fo
r Su
per
Gai
n Ta
x is
sued
by
the
Inst
itute
of C
hart
ered
Acc
ount
ants
of S
ri L
anka
, dat
ed 2
4 N
ovem
ber
2015
.

Management Discussion and Analysis
Our Performance Financial InformationGovernance and Risk Management
Supplementary Information
Sta
ted c
apita
l C
apita
l res
erve
s Re
venu
e Res
erve
s To
tal e
quity
Inve
stm
ent
rese
rve
Oth
er ca
pital
rese
rve
Fair
valu
eth
roug
h pro
fit or
lo
ss fi
nanc
ialas
sets
rese
rve
Ava
ilabl
e for
sale
finan
cial
asse
tsre
serv
e
Gen
eral
rese
rve
Ret
ained
earn
ings
Com
pany
Bal
ance
as
at 1
st A
pril
2015
953
,167
7
,805
2
00,8
55
13,
220
1,3
08,4
48
14,
961
4,0
75,7
97
6,5
74,2
53
Supe
r G
ain
Tax
for
the
year
of A
sses
smen
t 20
13/1
4*
-
-
-
-
-
-
(13,
919)
(13,
919)
Adj
uste
d ba
lanc
e as
at 1
st A
pril
2015
953
,167
7
,805
2
00,8
55
13,
220
1,3
08,4
48
14,
961
4,0
61,8
78
6,5
60,3
34
Pro
fit fo
r th
e ye
ar -
-
-
-
-
-
4
20,9
02
420
,902
O
ther
com
preh
ensi
ve e
xpen
se fo
r th
e ye
ar
fo
r th
e ye
ar -
-
-
-
(5
11,6
66)
-
-
(511
,666
)To
tal c
ompr
ehen
sive
inco
me
/ (ex
pens
e) fo
r
th
e ye
ar -
-
-
-
(5
11,6
66)
-
420
,902
(9
0,76
4)C
ash
divi
dend
-
-
-
-
-
-
(263
,509
) (2
63,5
09)
Scri
p di
vide
nd 1
75,5
59
-
-
-
-
-
(175
,673
) (1
14)
Forf
eitu
re o
f unc
laim
ed d
ivid
ends
-
-
-
-
-
-
2,5
57
2,5
57
Tran
sfer
s (n
ote
28.2
) -
-
-
(1
3,22
0) -
-
1
3,22
0 -
B
alan
ce a
s at
31s
t Mar
ch 2
016
1,1
28,7
26
7,8
05
200
,855
-
7
96,7
82
14,
961
4,0
59,3
75
6,2
08,5
04
Bal
ance
as
at 1
st A
pril
2016
1,1
28,7
26
7,8
05
200
,855
-
7
96,7
82
14,
961
4,0
59,3
75
6,2
08,5
04
Pro
fit fo
r th
e ye
ar
-
-
-
-
-
-
313
,972
3
13,9
72
Oth
er c
ompr
ehen
sive
inco
me
for
the
year
-
-
-
-
362
,886
-
-
3
62,8
86
Tota
l com
preh
ensi
ve in
com
e fo
r th
e ye
ar -
-
-
-
3
62,8
86
-
313
,972
6
76,8
58
Cas
h di
vide
nd -
-
-
-
-
-
(2
66,3
41)
(266
,341
)Fo
rfei
ture
of u
ncla
imed
div
iden
ds -
-
-
-
-
-
2
,241
2
,241
B
alan
ce a
s at
31s
t Mar
ch 2
017
1,1
28,7
26
7,8
05
200
,855
-
1
,159
,668
1
4,96
1 4
,109
,247
6
,621
,262
* A
s pe
r th
e pr
ovis
ions
of P
art I
II of
the
Fina
nce
Act
, No.
10
of 2
015,
alt
houg
h th
e C
ompa
ny d
id n
ot b
ecom
e lia
ble
to p
ay S
uper
Gai
n Ta
x as
sta
nd-a
lone
ent
ity, R
s. 1
3.92
M
n w
as p
aid
as S
uper
Gai
n Ta
x on
the
basi
s th
at th
e C
ompa
ny is
par
t of t
he B
ukit
Dar
ah P
LC g
roup
, of w
hich
the
cons
olid
ated
pro
fit b
efor
e ta
x ex
ceed
ed th
e th
resh
old
stip
ulat
ed in
the
afor
esai
d A
ct. A
ccor
ding
to th
e A
ct, t
he S
uper
Gai
n Ta
x sh
all b
e de
emed
to b
e an
exp
endi
ture
in th
e fin
anci
al s
tate
men
ts r
elat
ing
to th
e ye
ar o
f as
sess
men
t whi
ch c
omm
ence
d on
1 A
pril
2014
. The
Act
sup
erse
des
the
requ
irem
ents
of t
he S
ri L
anka
Acc
ount
ing
Stan
dard
s an
d he
nce
the
expe
nse
of S
uper
Gai
n Ta
x is
acc
ount
ed in
acc
orda
nce
with
the
requ
irem
ents
of t
he s
aid
Act
as
reco
mm
ende
d by
the
Stat
emen
t of A
lter
nativ
e Tr
eatm
ent (
SoAT
) on
Acc
ount
ing
for
Supe
r G
ain
Tax
issu
ed b
y th
e In
stitu
te o
f Cha
rter
ed A
ccou
ntan
ts o
f Sri
Lan
ka, d
ated
24
Nov
embe
r 20
15.
The
note
s fr
om p
ages
65
to 1
17 fo
rm a
n in
tegr
al p
art o
f the
se fi
nanc
ial s
tate
men
ts.
Figu
res
in b
rack
ets
indi
cate
ded
uctio
ns.

Ceylon Guardian Investment Trust PLC Annual Report 2016/17 64 65
Statement of Cash FlowsIn Rupees Thousands
Group Company
For the year ended 31st March Note 2017 2016 2017 2016
Cash flows from operating activitiesProfit before taxation 1,277,460 642,073 317,650 427,116 Adjustments for:Share of profit of equity accounted investee net of tax (2,747) (4,809) - - Depreciation on property, plant and equipment 18 3,224 3,097 - - Scrip dividend from subsidiary - - - (57,987)Provision for employee benefit 29 2,471 2,637 - - Net finance (income) / expense 13 (173) 381 56 93 Impairment loss on available for sale financial assets 198,826 95,232 103,611 45,667 Net charge in fair value of fair value through profit or loss financial assets 51,206 211,643 (1,870) 19,614 Operating profit before working capital changes 1,530,267 950,254 419,447 434,503 (Increase) / decrease in trade and other receivables (38,482) 6,920 (32,189) 62,372 Net increase in investments (702,606) (1,279,188) (287,994) (27,552)Increase / (decrease) in trade and other payables (59,728) 26,496 357 (12,983)Cash generated from / (used in) operations 729,451 (295,518) 99,621 456,340 Employee benefit paid - (3,050) - - Super gain tax paid - (71,540) - (13,919)Current tax paid (31,076) (32,304) (6,538) (5,408)Net cash generated from / (used in) operating activities 698,375 (402,412) 93,083 437,013
Cash flows from investing activities
Acquisition of property, plant and equipment 18 (421) (3,394) - - Finance income 641 628 - - Net cash used in investing activities 220 (2,766) - -
Cash flows from financing activitiesDividend paid (261,958) (258,884) (261,958) (258,884)Dividend paid to non controlling interest (51,302) (86,816) - - (Redemptions of ) / Subscriptions for units (6,820) 6,737 - - Finance expense paid (468) (1,009) (56) (93)Net cash used in financing activities (320,548) (339,972) (262,014) (258,977)
Net increase / (decrease) in cash and cash equivalents 378,047 (745,150) (168,931) 178,036 Cash and cash equivalents at the beginning of the year 1,045,342 1,755,797 286,824 108,788 Net exchange differences on translation of foreign operations 14,857 34,695 - -
Cash and cash equivalents at the end of the year 25 1,438,246 1,045,342 117,893 286,824
The notes from pages 65 to 117 form an integral part of these financial statements.
Figures in brackets indicate deductions.

Notes to the Financial Statements
1. REPORTING ENTITY
(a) Domicile and Legal Form
Ceylon Guardian Investment Trust PLC is a limited liability Company which is incorporated in Sri Lanka. The shares of the Company have a primary listing on the Colombo Stock Exchange.
The registered office and principal place of business of the Company is located at No 61 Janadhipathi Mawatha, Colombo1.
The consolidated financial statements of the Company as at and for the year ended 31 March 2017 comprise the financial information of Company and its subsidiaries (together referred to as the ‘Group’ and individually as ‘Group entities’) and the Group’s interest in jointly controlled entity.
The Group has two listed subsidiaries, listed on the Colombo Stock Exchange, out of the five subsidiaries set out in the note 20 to the financial statements. The jointly controlled entity is set out in note 21 to the financial statements.
(b) Principal Activities and Nature of Operations
The principal activities of the Company and its subsidiaries are to act as specialised investment vehicles to undertake listed, private equity and fixed income investments and to engage in fund management activities.
There were no significant changes in the nature of the principal activities of the Company and the Group during the financial year under review.
The investment activities of the Group are managed by Guardian Fund Management Limited (the investment manager) and Carsons Management Services (Private) Limited function as Managers and Secretaries of the Group.
(c) Parent Entity and Ultimate Parent Entity
In the opinion of the Director’s Carson Cumberbatch PLC is the Parent Company of Ceylon Guardian Investment
Trust PLC and Bukit Darah PLC is the Ultimate Parent and Controlling entity of Ceylon Guardian Investment Trust PLC
(d) Number of Employees
The Group had 20 (2016 – 20) employees at the end of the financial year. The Company had no employees as at the reporting date (2015 - Nil).
2. BASIS OF PREPARATION
(a) Statement of compliance
The financial statements of the Company and the Group comprise the statement of financial position, statement of profit or loss and other comprehensive income, statement of changes in equity and cash flows together with the notes to the financial statements.
The consolidated financial statements have been prepared in accordance with Sri Lanka Accounting Standards (LKAS / SLFRS) laid down by the Institute of Chartered Accountants of Sri Lanka and the requirements of Companies Act, No. 7 of 2007.
The consolidated financial statements were authorised for issue by the Board of Directors on 21st June 2017.
(b) Basis of measurement
The consolidated financial statements have been prepared on the historical cost basis and applied consistently with no adjustments being made for inflationary factors affecting the financial statements, except for the following material items in the statement of financial position;
• Non-derivative financial instruments classified fair value through profit or loss are measured at fair value;
• Available-for-sale financial assets are measured at fair value;
• Defined benefit obligations are measured at its present value, based on an actuarial valuation.
These financial statements have been prepared on the basis that the Company and the Group would continue as a going concern for the foreseeable future.
Management Discussion and Analysis
Our Performance Financial InformationGovernance and Risk Management
Supplementary Information

Ceylon Guardian Investment Trust PLC Annual Report 2016/17 66 67
Notes to the Financial Statements
(c) Functional and Presentation Currency
Items included in the financial statements of each of the Group’s entities are measured using the currency of the primary economic environment in which the entities operate (‘the functional currency’). The consolidated financial statements are presented in Sri Lankan Rupees, which is the Company’s functional and presentation currency.
(d) Use of estimates and judgments
The preparation of the consolidated financial statements in conformity with LKAS/SLFRS requires management to make judgments, estimates and assumptions that affect the application of accounting policies and the reported amounts of assets, liabilities, income and expenses. Actual results may differ from these estimates.
Estimates and underlying assumptions are reviewed on an ongoing basis. Revisions to accounting estimates are recognised in the period in which the estimates are revised and in any future periods affected.
Information about assumptions and estimation uncertainties that have a significant risk of resulting in a material adjustment within the next financial year are included in the following notes:
Assumptions and estimation uncertainties:
i. Assessment of Impairment - Key assumptions used in discounted cash flow projections.
The Group assesses at each reporting date whether there is objective evidence that an asset or portfolio of assets is impaired. The recoverable amount of an asset or Cash Generating unit (CGU) is the greater of its value in use and its fair value less costs to sell. In assessing value in use, the estimated future cash flows are discounted to present value using appropriate discount rates that reflects the current market assessments of the time value of money and risks specific to the asset. The carrying value of goodwill is reviewed at each reporting date and is written down to the extent that it is no longer supported by probable future benefits. Goodwill is allocated to CGU for the purpose of impairment testing.
i. Deferred taxation - utilization of tax losses
Deferred tax assets are recognized for all unused tax losses to the extent that it is probable that taxable profit will be available against which the losses can be utilized. Management judgment is required to determine the amount of deferred tax assets that can be recognized, based upon the level of future taxable profits together with future tax planning strategies.
ii. Defined benefit plans
The assessment of the liability of defined benefit obligations involves a significant element of assumptions; including discount rates, future salary increases, mortality rates and future pension increases and due to the long-term nature of these plans, such estimates are subject to uncertainty.
iii. Current taxation
Current tax liabilities arise to the group in various jurisdictions. These liabilities are provided for in the financial statements applying the relevant tax statutes and regulations which the management believes reflect the actual liability. There can be instances where the stand taken by the group on transactions is contested by revenue authorities. Any additional costs on account of these issues are accounted for as a tax expense at the point the liability is confirmed on any group entity.
iv. Measurement of Fair values - Fair value of financial instruments
Where the fair values of financial instruments recorded on the Statement of Financial Position cannot be derived from active markets, they are determined using valuation techniques including the discounted cash flow model. The inputs to these models are derived from observable market data where possible, but where this is not feasible, a degree of judgment is required in establishing fair values. The judgments include considerations of liquidity and model inputs regarding the future financial performance of the investee, its risk profile, and economic assumptions regarding the industry and geographical jurisdiction in which the investee operates. Changes in assumptions about these factors could affect the reported fair value of financial instruments.

(e) Materiality and aggregation
Each material class of similar items is presented in aggregate in the Financial Statements. Items of dissimilar nature or function are presented separately unless they are immaterial.
(f) Comparative figures
Where necessary, comparative figures have been rearranged to conform with the current year’s presentation.
3. SIGNIFICANT ACCOUNTING POLICIES
The Accounting Policies set out below have been applied consistently to all periods presented in the Financial Statements of the Group and the Company unless otherwise indicated.
(a) Basis of consolidation
The consolidated financial statements comprise the financial statements of the Group and its subsidiaries as at 31 March 2017. The Group controls an investee when it is exposed, or has rights, to variable returns from its involvement with the investee and has the ability to affect those returns through its power over the investee. Thus, the Group controls an investee if and only if the investor has all the following:
• Power over the investee
• Exposure, or rights, to variable returns from its involvement with the investee
• The ability to use its power over the investee to affect the amount of the investor’s returns
Generally, there is a presumption that a majority of voting rights result in control. To support this presumption and when the Group has less than a majority of the voting or similar rights of an investee, the Group considers all relevant facts and circumstances in assessing whether it has power over an investee, including:
• Contractual arrangement with the other vote holders of the investee
• Rights arising from other contracts and arrangements
• The Group’s voting rights and potential voting rights
The Group re-assesses whether or not it controls an investee if facts and circumstances indicate that there are changes to one or more of the three elements of control. Consolidation of a subsidiary begins when the Group obtains control over the subsidiary and ceases when the Group loses control of the subsidiary. Assets, liabilities, income and expenses of a subsidiary acquired or disposed of during the year are included in the consolidated financial statements from the date the Group gains control until the date the Group ceases to control the subsidiary.
(i) Business combinations
Business combinations are accounted for using the acquisition method as at the acquisition date – i.e. when control is transferred to the Group.
The Group measures goodwill at the acquisition date as:
• the fair value of the consideration transferred; plus
• the recognised amount of any non-controlling interests in the acquire; plus
• if the business combination is achieved in stages, the fair value of the pre-existing equity interest in the acquire; less
• The net recognised amount (generally fair value) of the identifiable assets acquired and liabilities assumed.
When the excess is negative, a bargain purchase gain is recognised immediately in profit or loss.
The consideration transferred does not include amounts related to the settlement of pre-existing relationships. Such amounts are generally recognised in profit or loss.
Transactions costs, other than those associated with the issue of debt or equity securities, that the Group incurs in connection with a business combination are expensed as incurred. Any contingent consideration payable is measured at fair value at the acquisition date. If the contingent consideration is classified as equity, then it is not re-measured and settlement is accounted for within
Management Discussion and Analysis
Our Performance Financial InformationGovernance and Risk Management
Supplementary Information

Ceylon Guardian Investment Trust PLC Annual Report 2016/17 68 69
Notes to the Financial Statements
equity. Otherwise, subsequent changes in the fair value of the contingent consideration are recognised in profit or loss.
(ii) Non-controlling interests
For each business combination, the Group elects to measure any non-controlling interests in the acquiree either:
• at fair value; or
• at their proportionate share of the acquiree’s identifiable net assets, which are generally at fair value.
Changes in the Group’s interest in a subsidiary that do not result in a loss of control are accounted for as transactions with owners in their capacity as owners. Adjustments to no controlling interests are based on a proportionate amount of the net assets of the subsidiary.
No adjustments are made to goodwill and no gain or loss is recognised in profit or loss.
(iii) Subsidiaries
Subsidiaries are entities controlled by the group. The financial statements of subsidiaries are included in the consolidated financial statements from the date that control commences until the date that control ceases.
Adjustments required to the accounting policies of subsidiaries have been changed where ever necessary to align them with the policies adopted by the group.
In the Company’s financial statements, investments in subsidiaries are carried at cost less impairment if any, in net recoverable value.
The consolidated financial statements are prepared to a common financial year end of 31st March.
(iv) Loss of control
On the loss of control, the Group derecognises the assets and liabilities of the subsidiary, any non-controlling interests and the other components of equity related to the subsidiary. Any surplus or deficit arising on the loss of
control is recognised in profit or loss. If the Group retains any interest in the previous subsidiary, then such interest is measured at fair value at the date that control is lost.
Subsequently that retained interest is accounted for as an equity-accounted investee or as an available-for-sale financial asset depending on the level of influence retained.
(v) Investments in associates and jointly controlled entities (equity-accounted investees)
Jointly controlled entities are those entities over whose activities the Group has joint control, established by contractual agreement and requiring unanimous consent for strategic financial and operating decisions.
Investments in jointly controlled entities are accounted for under the equity method and are recognised initially at cost. The cost of the investment includes transaction costs.
The consolidated financial statements include the Group’s share of the profit or loss and other comprehensive income of equity-accounted investees, after adjustments to align the accounting policies with those of the Group, from the date that significant influence or joint control commences until the date that significant influence or joint control ceases.
When the Group’s share of losses exceeds its interest in an equity-accounted investee, the carrying amount of the investment, including any long-term interests that form part thereof, is reduced to zero, and the recognition of further losses is discontinued except to the extent that the Group has an obligation or has made payments on behalf of the investee.
(vi) Transactions eliminated on consolidation
Intra-group balances and transactions, and any unrealized income and expenses arising from intra-group transactions, are eliminated in preparing the consolidated financial statements. Unrealised gains arising from transactions with equity accounted investees are eliminated against the investment to the extent of the Group’s interest in the investee.
Unrealised losses are eliminated in the same way as unrealised gains, but only to the extent that there is no evidence of impairment.
(vii) Financial year end
All companies in the Group have a common financial year which ends on 31st March, except the following.
Company Nature of relationship
Financial year end
Guardian Acuity Asset Management Limited
Jointly controlled entity
31st December
(b) Foreign currency
(i) Foreign currency transactions
Transactions in foreign currencies are translated to the respective functional currencies of Group entities at exchange rates as at the dates of the transactions. Monetary assets and liabilities denominated in foreign currencies at the reporting date are retranslated to the functional currency at the exchange rate as at that date.
The foreign currency gain or loss on monetary items is the difference between amortised cost in the functional currency at the beginning of the year, adjusted for effective interest and payments during the year, and the amortised cost in foreign currency translated at the exchange rate at the end of the year.
Non-monetary assets and liabilities that are measured at fair value in foreign currency are retranslated to the functional currency at the exchange rate at the date that the fair value was determined. Non-monetary items that are measured based on historical cost in a foreign currency are translated using the exchange rate at the date of the transaction.
Foreign currency differences arising on retranslation are generally recognised in profit or loss. However, foreign
currency differences arising from the retranslation of the following items are recognised in other comprehensive income:
• available-for-sale equity investments (except on impairment in which case foreign currency differences that have been recognised in other comprehensive income are reclassified to profit or loss);
(ii) Foreign operations
The assets and liabilities of foreign operations, including goodwill and fair value adjustments arising on acquisition, are translated to Sri Lanka Rupees at exchange rates at the reporting date. The income and expenses of foreign operations are translated to Sri Lanka Rupees at exchange rates at the dates of the transactions.
Foreign currency differences are recognised in other comprehensive income, and presented in the foreign currency translation reserve (translation reserve) in equity. However, if the foreign operation not a fully owned subsidiary, then the relevant is proportion of the translation difference is allocated to non-controlling interests. When a foreign operation is disposed of such that control, significant influence or joint control is lost, the cumulative amount in the translation reserve related to that foreign operation is reclassified to profit or loss as part of the gain or loss on disposal. When the Group disposes of only part of its interest in a subsidiary that includes a foreign operation while retaining control, the relevant proportion of the cumulative amount is re-attributed to non-controlling interests. When the Group disposes of only part of its investment in an associate or joint venture that includes a foreign operation while retaining significant influence or joint control, the relevant proportion of the cumulative amount is reclassified to profit or loss.
When the settlement of a monetary item receivable from or payable to a foreign operation is neither planned nor likely in the foreseeable future, foreign currency gains and losses arising from such item are considered to form part of the net investment in the foreign operation and are recognised in other comprehensive income, and presented in the translation reserve in equity.
Management Discussion and Analysis
Our Performance Financial InformationGovernance and Risk Management
Supplementary Information

Ceylon Guardian Investment Trust PLC Annual Report 2016/17 70 71
(c) Financial instruments
(i) Non-derivative financial assets
The Group initially recognises loans and receivables on the date that they are originated. All other financial assets (including assets designated as at fair value through profit or loss) are recognised initially on the trade date, which is the date that the Group becomes a party to the contractual provisions of the instrument.
The Group derecognises a financial asset when the contractual rights to the cash flows from the asset expire, or it transfers the rights to receive the contractual cash flows in a transaction in which substantially all the risks and rewards of ownership of the financial asset are transferred. Any interest in such transferred financial assets that is created or retained by the Group is recognised as a separate asset or liability.
Financial assets and liabilities are offset and the net amount presented in the statement of financial position when, and only when, the Group has a legal right to offset the amounts and intends either to settle them on a net basis or to realize the asset and settle the liability simultaneously.
The Group classifies non-derivative financial assets into the following categories; financial assets at fair value through profit or loss, loans and receivables and available-for-sale financial assets.
Financial assets at fair value through profit or loss
A financial asset is classified as fair value through profit or loss (FVTPL) or is designated as such on initial recognition if the Group manages such investments and makes purchase and sale decisions based on their fair value in accordance with the Group’s documented investment or risk management strategy. Attributable transaction costs are recognised in profit or loss as incurred. Financial assets at fair value through profit or loss are measured at fair value and changes therein are recognised in profit or loss.
Financial assets classified as FVTPL comprise short-term sovereign debt securities actively managed by the Group’s treasury department to address short-term liquidity needs.
Financial assets designated as fair values through profit or loss comprise equity securities that otherwise would have been classified as available-for-sale.
Loans and receivables
Loans and receivables are financial assets with fixed or determinable payments that are not quoted in an active market. Such assets are recognised initially at fair value plus any directly attributable transaction costs. Subsequent to initial recognition, loans and receivables are measured at amortised cost using the effective interest method, less any impairment losses.
Loans and receivables comprise cash and cash equivalents, and trade and other receivables.
Specific instruments
Cash and cash equivalents
Cash and cash equivalents comprise cash balances, securities purchased under resale agreements and call deposits with maturities of three months or less from the acquisition date that are subject to an insignificant risk of changes in their fair value, and are used by the Group in the management of its short-term commitments.
Available-for-sale financial assets
Available-for-sale financial assets are non-derivative financial assets that are designated as available-for-sale or are not classified in any of the above categories of financial assets. Available-for-sale financial assets are recognised initially at fair value plus any directly attributable transaction costs.
Subsequent to initial recognition, they are measured at fair value and changes therein, other than impairment losses are recognised in other comprehensive income and presented in the available for sale financial assets reserve
Notes to the Financial Statements

in equity. When an investment is derecognised, the gain or loss accumulated in equity is reclassified to profit or loss.
Available-for-sale financial assets comprise equity securities and debt securities.
(ii) Non-derivative financial liabilities
The Group initially recognises debt securities issued and subordinated liabilities on the date that they are originated. All other financial liabilities are recognised initially on the trade date, which is the date that the Group becomes a party to the contractual provisions of the instrument.
The Group derecognises a financial liability when its contractual obligations are discharged, cancelled or expire.
The Group classifies non-derivative financial liabilities into the other financial liabilities category. Such financial liabilities are recognised initially at fair value less any directly attributable transaction costs. Subsequent to initial recognition, these financial liabilities are measured at amortised cost using the effective interest method.
Other financial liabilities comprise loans and borrowings bank overdrafts, and trade and other payables.
Bank overdrafts that are repayable on demand and form an integral part of the Group’s cash management are included as a component of cash and cash equivalents for the statement of cash flows.
(iii) Stated capital
Ordinary shares
Ordinary shares are classified as equity. Costs attributable to the issue of ordinary shares are recognised as a deduction against equity.
(d) Property, plant and equipment
(i) Recognition and measurement
All items of property, plant equipment are initially recorded at cost.
Subsequent to the initial recognition property, plant & equipment are carried at cost less accumulated depreciation thereon and accumulated impairment losses.
Cost includes expenditure that is directly attributable to the acquisition of the asset. The cost of self-constructed assets includes the following:
• the cost of materials and direct labour;
• any other costs directly attributable to bringing the assets to a working condition for their intended use;
• when the Group has an obligation to remove the asset or restore the site, an estimate of the costs of dismantling and removing the items and restoring the site on which they are located; and
• capitalised borrowing costs.
Purchased software that is integral to the functionality of the related equipment is capitalised as part of that equipment.
When parts of an item of property, plant and equipment have different useful lives, they are accounted for as separate items (major components) of property, plant and equipment.
(ii) Subsequent costs
Subsequent expenditure is capitalised only when it is probable that the future economic benefits associated with the expenditure will flow to the Group. Ongoing repairs and maintenance are expensed as incurred.
(iii) Depreciation
Items of property, plant and equipment are depreciated from the date they are available for use or, in respect of self-constructed assets, from the date that the asset is completed and ready for use.
Depreciation is calculated to write off the cost of items of property, plant and equipment less their estimated residual values using the straight-line basis over their estimated useful lives. Depreciation is generally recognised in profit or loss, unless the amount is included in the carrying amount of another asset.
Management Discussion and Analysis
Our Performance Financial InformationGovernance and Risk Management
Supplementary Information

Ceylon Guardian Investment Trust PLC Annual Report 2016/17 72 73
The estimated useful lives for the current and comparative years of significant items of property, plant and equipment are as follows;
Class of asset No of years
Motor vehicles 4-5
Motor vehicles 4-5
Furniture and Fittings 5-10
Computer equipment 3-5
Office equipment 5-10
Depreciation methods, useful lives and residual values are reviewed at each reporting date and adjusted if appropriate.
(iv) Disposal
The gains or losses arising on disposal or retirement of an item of property, plant and equipment are determined by comparing the proceeds from disposal with the carrying amount of the property, plant and equipment are recognized net within Other Income in the Statement of Profit or Loss.
(e) Intangible assets and goodwill
(i) Recognition and measurement
Goodwill
Goodwill that arises on the acquisition of subsidiaries is presented with intangible assets. For the measurement of goodwill at initial recognition, see (note 3).
Subsequent measurement
Goodwill is measured at cost less accumulated impairment losses. In respect of equity accounted investees, the carrying amount of goodwill is included in the carrying amount of the investment, and any impairment loss is allocated to the carrying amount of the equity accounted investee as a whole.
Software
All computer software costs incurred, licensed for use by the Group, which are not integrally related to associated hardware, which can be clearly identified, reliably measured and it’s probable that they will lead to future economic benefits, are included in the Statement of Financial Position under the category intangible assets and carried at cost less accumulated amortization and any accumulated impairment losses. These costs are amortised to the Statement of Income using the straight line method over 3 to 10 years.
(ii) Subsequent expenditure
Subsequent expenditure is capitalised only when it increases the future economic benefits embodied in the specific asset to which it relates. All other expenditure, including expenditure on internally generated goodwill and brands, is recognised in profit or loss as incurred.
(iii) Impairment
Intangible assets with indefinite useful lives or not yet available for use are tested for impairment annually or more frequently if events and circumstances indicate that the carrying value may be impaired either individually or at the cash-generating unit level. Such intangible assets are not amortised. The useful life of an intangible asset with an indefinite useful life is reviewed annually to determine whether the useful life assessment continues to be supportable.
(f) Impairment
(i) Non derivative financial assets
A financial asset not classified as at fair value through profit or loss, including an interest in an equity-accounted investee, is assessed at each reporting date to determine whether there is objective evidence that it is impaired. A financial asset is impaired if there is objective evidence of impairment as a result of one or more events that occurred after the initial recognition of the asset, and that loss event(s) had an impact on the estimated future cash flows of that asset that can be estimated reliably.
Objective evidence that financial assets are impaired includes default or delinquency by a debtor, restructuring of an amount due to the Group on terms that the
Notes to the Financial Statements
Group would not consider otherwise, indications that a debtor or issuer will enter bankruptcy, adverse changes in the payment status of borrowers or issuers, economic conditions that correlate with defaults or the disappearance of an active market for a security. In addition, for an investment in an equity security, a significant or prolonged decline in its fair value below its cost is objective evidence of impairment. The Group considers a decline of 20 percent to be significant and a period of 9 months to be prolonged.
Financial assets measured at amortised cost
The Group considers evidence of impairment for financial assets measured at amortised cost (loans and receivables and held-to-maturity financial assets) at both a specific asset and collective level. All individually significant assets are assessed for specific impairment. Those found not to be specifically impaired are then collectively assessed for any impairment that has been incurred but not yet identified. Assets that are not individually significant are collectively assessed for impairment by grouping together assets with similar risk characteristics.
In assessing collective impairment, the Group uses historical trends of the probability of default, the timing of recoveries and the amount of loss incurred, adjusted for management’s judgement as to whether current economic and credit conditions are such that the actual losses are likely to be greater or lesser than suggested by historical trends.
An impairment loss in respect of a financial asset measured at amortised cost is calculated as the difference between its carrying amount and the present value of the estimated future cash flows discounted at the asset’s original effective interest rate. Losses are recognised in profit or loss and reflected in an allowance account against loans and receivables or held-to-maturity investment securities. When an event occurring after the impairment was recognised causes the amount of impairment loss to decrease, the decrease in impairment loss is reversed through profit or loss.
Available-for-sale financial assets
Impairment losses on available-for-sale financial assets are recognised by reclassifying the losses accumulated in the fair value reserve in equity to profit or loss. The cumulative loss that is reclassified from equity to profit or loss is the difference between the acquisition cost, net of any principal repayment and amortisation, and the current fair value, less any impairment loss recognised previously in profit or loss. Changes in cumulative impairment losses attributable to application of the effective interest method are reflected as a component of interest income.
If, in a subsequent period, the fair value of an impaired available-for-sale debt security increases and the increase can be related objectively to an event occurring after the impairment loss was recognised, then the impairment loss is reversed, with the amount of the reversal recognised in profit or loss. However, any subsequent recovery in the fair value of an impaired available-for-sale equity security is recognised in other comprehensive income.
An impairment loss in respect of an equity-accounted investee is measured by comparing the recoverable amount of the investment with its carrying amount.
An impairment loss is recognised in profit or loss. An impairment loss is reversed if there has been a favourable change in the estimates used to determine the recoverable amount.
(ii) Non-financial assets
The carrying amounts of the Group’s non-financial assets, other than deferred tax assets, are reviewed at each reporting date to determine whether there is any indication of impairment. If any such indication exists, then the asset’s recoverable amount is estimated. Goodwill and indefinite-lived intangible assets are tested annually for impairment. An impairment loss is recognised if the carrying amount of an asset or cash generating unit (CGU) exceeds its recoverable amount.
Management Discussion and Analysis
Our Performance Financial InformationGovernance and Risk Management
Supplementary Information

Ceylon Guardian Investment Trust PLC Annual Report 2016/17 74 75
The recoverable amount of an asset or CGU is the greater of its value in use and its fair value less costs to sell. In assessing value in use, the estimated future cash flows are discounted to their present value using a pre-tax discount rate that reflects current market assessments of the time value of money and the risks specific to the asset or CGU. For impairment testing, assets are grouped together into the smallest group of assets that generates cash inflows from continuing use that are largely independent of the cash inflows of other assets or CGUs. Subject to an operating segment ceiling test, CGUs to which goodwill has been allocated are aggregated so that the level at which impairment testing is performed reflects the lowest level at which goodwill is monitored for internal reporting purposes. Goodwill acquired in a business combination is allocated to groups of CGUs that are expected to benefit from the synergies of the combination.
Impairment losses are recognised in profit or loss. Impairment losses recognised in respect of CGUs are allocated first to reduce the carrying amount of any goodwill allocated to the CGU (group of CGUs), and then to reduce the carrying amounts of the other assets in the CGU (group of CGUs) on a pro rata basis.
An impairment loss in respect of goodwill is not reversed. For other assets, an impairment loss is reversed only to the extent that the asset’s carrying amount does not exceed the carrying amount that would have been determined, net of depreciation or amortisation, if no impairment loss had been recognised.
(g) Employee benefits
(i) Short-term employee benefits
Short-term employee benefit obligations are measured on an undiscounted basis and are expensed as the related service is provided. A liability is recognised for the amount expected to be paid under short-term cash bonus or profit-sharing plans if the Group has a present legal or constructive obligation to pay this amount as a result of past service provided by the employee, and the obligation can be estimated reliably.
(ii) Defined contribution plans
A defined contribution plan is a post-employment benefit plan under which an entity pays fixed contributions into a separate entity and has no legal or constructive obligation to pay further amounts. Obligations for contributions to defined contribution plans are recognised as an employee benefit expense in profit or loss in the periods during which related services are rendered by employees.
(iii) Defined benefit plans
A defined benefit plan is a post-employment benefit plan other than a defined contribution plan.
The liability recognised in the Financial Statements in respect of defined benefit plans is the present value of the defined benefit obligation as at the reporting date. The defined benefit obligation is calculated by a qualified actuary as at the reporting date using the Projected Unit Credit (PUC) method as recommended by LKAS 19 - ‘Employee Benefits’. Such actuarial valuations will be carried out once in every year. The liability is not externally funded. All Actuarial gains or losses are recognised immediately in other comprehensive income.
Under the Payment of Gratuity Act No. 12 of 1983, the liability to an employee arises only on completion of 5 years of continued service.
(h) Provisions
A provision is recognised if, as a result of a past event, the Group has a present legal or constructive obligation that can be estimated reliably, and it is probable that an outflow of economic benefits will be required to settle the obligation. Provisions are determined by discounting the expected future cash flows at a pre-tax rate that reflects current market assessments of the time value of money and the risks specific to the liability. The unwinding of the discount is recognised as finance cost.
(i) Contingent liabilities and contingent assets
A contingent liability is a possible obligation that arises from past events whose existence will be confirmed by the occurrence or non-occurrence of one or more uncertain future events beyond the control of the Group or a present
Notes to the Financial Statements
obligation that is not recognized because it is not probable that an outflow of resources will be required to settle the obligation.
A contingent liability also arises in extremely rare cases where there is a liability that cannot be recognized because it cannot be measured reliably. The Group does not recognize a contingent liability but discloses its existence in the financial statements.
A contingent asset is a possible asset that arises from past events whose existence will be confirmed by the occurrence or non-occurrence of one or more uncertain future events beyond the control of the Group. The group does not recognize contingent assets but discloses its existence where inflows of economic benefits are probable, but not virtually certain. In the acquisition of subsidiaries by the Group under business combinations, contingent liabilities assumed are measured initially at their fair value at the acquisition date, irrespective of the extent of any minority interest.
(i) Revenue
Revenue is recognized to the extent that it is probable that the economic benefits will flow to the Group, and the revenue and associated costs incurred or to be incurred can be reliably measured. Revenue is measured at the fair value of the consideration received or receivable, net of trade discounts and sales taxes, and after eliminating sales within the Group.
The following specific criteria are used for the purpose of recognition of revenue;
(i) Dividend Income
Dividend income is recognised in profit or loss on the date that the Group’s right to receive payment is established, which in the case of quoted securities is normally the ex-dividend date.
(ii) Gain on disposal of financial assets (categorized as available for sale / fair value through profit or loss)
Profits or losses on disposal of investments are accounted for in the Statement of Income on the basis of realized net profit.
(iii) Management fee income
Management fee income is recognised on accrual basis.
(iv) Interest income
Interest income comprises the amounts earned on funds invested (including available-for-sale financial assets), and is recognised as it accrues in profit or loss, using the effective interest method.
(v) Other income
Net gains and losses of a revenue nature resulting from the disposal of property, plant & equipment have been accounted for in the Profit of Loss.
(j) Expenditure Recognition
(i) Operating Expenses
All expenses incurred in day-to-day operations of the business and in maintaining the property, plant & equipment in a state of efficiency has been charged to revenue in arriving at the profit or loss for the year. Provision has also been made for impaired receivables. All known liabilities and depreciation on property, plant & equipment.
(ii) Finance income and finance costs
Finance costs comprise interest expense on borrowings, unwinding of the discount on provisions and deferred consideration.
Borrowing costs that are not directly attributable to the acquisition, construction or production of a qualifying asset are recognised in profit or loss using the effective interest method.
Foreign currency gains and losses on financial assets and financial liabilities are reported on a net basis as either finance income or finance cost depending on whether foreign currency movements are in a net gain or net loss position.
Management Discussion and Analysis
Our Performance Financial InformationGovernance and Risk Management
Supplementary Information

Ceylon Guardian Investment Trust PLC Annual Report 2016/17 76 77
(iii) Fee and commission expenses
Fee and commission expenses are recognized in profit or loss when the related services are performed.
(k) Income tax expense
Income Tax expense comprises current and deferred tax. Current tax and deferred tax is recognised in profit or loss except to the extent that it relates to a business combination, or items recognised directly in equity or in other comprehensive income.
(i) Current taxation
Current tax is the expected tax payable or receivable on the taxable income or loss for the year, using tax rates enacted or substantively enacted at the reporting date, and any adjustment to tax payable in respect of previous years.
(ii) Deferred taxation
Deferred tax is recognised in respect of temporary differences between the carrying amounts of assets and liabilities for financial reporting purposes and the amounts used for taxation purposes.
Deferred tax is not recognised for:
• temporary differences on the initial recognition of assets or liabilities in a transaction that is not a business combination and that affects neither accounting nor taxable profit or loss;
• temporary differences related to investments in subsidiaries, associates and jointly controlled entities to the extent that the Group is able to control the timing of the reversal of the temporary differences and it is probable that they will not reverse in the foreseeable future; and
• taxable temporary differences arising on the initial recognition of goodwill.
The measurement of deferred tax reflects the tax consequences that would follow the manner in which the Group expects, at the end of the reporting period, to recover or settle the carrying amount of its assets and liabilities.
Deferred tax is measured at the tax rates that are expected to be applied to temporary differences when they reverse, using tax rates enacted or substantively enacted at the reporting date.
Deferred tax assets and liabilities are offset if there is a legally enforceable right to offset current tax liabilities and assets, and they relate to taxes levied by the same tax authority on the same taxable entity, or on different tax entities, but they intend to settle current tax liabilities and assets on a net basis or their tax assets and liabilities will be realised simultaneously.
A deferred tax asset is recognised for unused tax losses, tax credits and deductible temporary differences to the extent that it is probable that future taxable profits will be available against which they can be utilised. Deferred tax assets are reviewed at each reporting date and are reduced to the extent that it is no longer probable that the related tax benefit will be realised, based on the level of future taxable profit forecasts and tax planning strategies.
(iii) Tax exposures
In determining the amount of current and deferred tax, the Group takes into account the impact of uncertain tax positions and whether additional taxes and interest may be due. This assessment relies on estimates and assumptions and may involve a series of judgements about future events. New information may become available that causes the Company to change its judgement regarding the adequacy of existing tax liabilities; such changes to tax liabilities will impact tax expense in the period that such a determination is made.
(iv) Economic Service Charge (ESC)
As per the provisions of Economic Service Charge Act No. 13 of 2006 and amendments thereto, is payable on “Liable Turnover” and is deductible from the income tax payments. Any unclaimed ESC can be carried forward and settled against the income tax payable in the four subsequent years.
Notes to the Financial Statements

4. EARNINGS PER SHARE
The Group presents basic earnings per share (EPS) data for its ordinary shares. Basic EPS is calculated by dividing the profit or loss attributable to ordinary shareholders of the Company by the weighted average number of ordinary shares outstanding during the period.
5. RELATED PARTY TRANSACTIONS
Disclosure has been made in respect of the transactions in which one party has the ability to control or exercise significant influence over the financial and operating policies decisions of the other, irrespective of whether a price is charged.
6. EVENTS AFTER THE REPORTING PERIOD
All material and important events which occur after the reporting date have been considered and disclosed in Notes to the financial statements.
7. DIVIDENDS ON ORDINARY SHARES
Dividends on ordinary shares are recognized as a liability and deducted from equity when they are approved by the Company’s shareholders. Interim dividends are deducted from equity when they are declared and are no longer at the discretion of the Company.
8. PRESENTATION
Assets and liabilities are grouped by nature and listed in an order that reflects their relative liquidity and maturity pattern.
(i) Offsetting Income and Expenses
Income and expenses are not offset unless required or permitted by accounting standards.
(ii) Offsetting Assets and Liabilities
Assets and liabilities are offset and the net amount reported in the statement of financial position only where there is;
• a current enforceable legal right to offset the asset and the liability; and
• an intention to settle the liability simultaneously
9. DETERMINATION OF FAIR VALUES
A number of the Group’s accounting policies and disclosures require the determination of fair value, for both financial and non-financial assets and liabilities. Fair values have been determined for measurement and/or disclosure purposes based on the following methods. Where applicable, further information about the assumptions made in determining fair values is disclosed in the notes specific to that asset or liability.
When measuring the fair value of an asset or a liability, the Group uses market observable data as far as possible. Fair values are categorized into different levels in a fair value hierarchy based on the inputs used in the valuation techniques as follows;
• Level 1- In put that are quoted market prices (unadjusted) in active markets for identifiable assets and liabilities
• Level 2- Inputs other than quoted prices included in Level 1 that are observable from the asset or liability either directly ( as prices ) or indirectly ( derived prices)
• Level 3 – Inputs from the asset or liability that are not based on observable market data (unobservable inputs) This category includes all financial instruments for which the valuation techniques include inputs not based on observable data and unobservable inputs have significant effect on the instrument’s valuation
If the inputs used to measure the fair value of an asset or a liability might be categorized in different levels of the fair value hierarchy, then the fair value measurement is categorized in its entirety in the same level of the fair value hierarchy as the lowest level input that is significant to the entire measurement.
(a) Equity and debt securities
The fair values of investments in equity and debt securities are determined with reference to their quoted closing bid price at the measurement date, or if unquoted, determined using a valuation technique. Valuation techniques employed include market multiples and
Management Discussion and Analysis
Our Performance Financial InformationGovernance and Risk Management
Supplementary Information

Ceylon Guardian Investment Trust PLC Annual Report 2016/17 78 79
discounted cash flow analysis using expected future cash flows and a market-related discount rate.
(b) Trade and other receivables
The fair values of trade and other receivables, excluding construction work in progress, are estimated at the present value of future cash flows, discounted at the market rate of interest at the measurement date. Short-term receivables with no stated interest rate are measured at the original invoice amount if the effect of discounting is immaterial. Fair value is determined at initial recognition and, for disclosure purposes, at each annual reporting date.
(c) Other non-derivative financial liabilities
Other non-derivative financial liabilities are measured at fair value, at initial recognition and for disclosure purposes, at each annual reporting date.
Statement of cash flows
The Statement of cash flows has been prepared using the Indirect Method of preparing cash flows in accordance with the Sri Lanka Accounting Standard (LKAS) 7, “Statement of cash flows”.
Cash and cash equivalents as referred to in the statement of cash flows are comprised of those items as explained in Note 25.
For cash flow purposes, cash and cash equivalents are presented net of bank overdrafts.
Directors’ responsibility
The Board of Directors is responsible for the preparation and presentation of the Financial Statements. This is more fully described under the relevant clause in the Directors’ Report.
10. NEW ACCOUNTING STANDARDS
Standards issued but not effective as at the reporting date
A number of new standards and amendments to standards which have been issued but not yet effective as at the reporting date have not been applied in preparing these Financial Statements. Accordingly, these Accounting
Standards have not been applied in preparing these financial statements.
SLFRS 9 Financial Instruments
SLFRS 9, issued in 2014, replaces the existing guidance in LKAS 39 Financial Instruments: Recognition and Measurement. SLFRS 9 includes revised guidance on the classification and measurement of financial instruments. It also carries forward the guidance on recognition and de recognition of financial instruments from LKAS 39.
Effective date of IFRS 9 is 01st April 2018.
The Group is assessing the potential impact on its financial statements resulting from the application of SLFRS 9.
SLFRS 15 Revenue from Contracts with Customers
SLFRS 15 establishes a comprehensive framework for determining whether, how much and when revenue is recognised. It replaces existing revenue recognition guidance, including LKAS 18 Revenue, and LKAS 11 Construction Contracts.
SLFRS 15 is effective for annual reporting periods beginning on or after 01st January 2018.
The above new standard (SLFRS 15) is not expected to have a significant impact of the Group’s financial statements.
SLFRS 16 Leases
SLFRS 16 eliminates the current dual accounting model for lessees which distinguishes between On-Balance Sheet finance leases and Off Balance Sheet operating leases. Instead, there will be a single On- Balance Sheet accounting model that is similar to current finance lease accounting.
SLFRS 16 is effective for reporting periods beginning on or after 01 January 2019.
The above new standard (SLFRS 16) is not expected to have a significant impact of the Group's financial statements.
Notes to the Financial Statements

Management Discussion and Analysis
Our Performance Financial InformationGovernance and Risk Management
Supplementary Information
Group Company
For the year ended 31st March 2017 2016 2017 2016
11. REVENUE
Net gain from disposal of fair value through profit or loss financial assets 174,061 82,332 20,479 4,290
Net gain from disposal of available for sale financial assets (note 11.1) 983,722 621,412 69,641 221,191
Dividend income 846,248 695,279 404,065 349,280
Interest income on financial assets carried at amortised cost (note 11.2) 43,815 101,293 16,064 26,830
Management fees 91,724 103,405 - -
2,139,570 1,603,721 510,249 601,591
Intra-group transactions (397,272) (427,395) - -
1,742,298 1,176,326 510,249 601,591
11.1 Net gain from disposal of available for sale financial assets
Proceeds from disposal of available for sale financial assets 2,729,761 1,571,177 595,929 699,168
Carrying value of available for sale financial assets disposed (2,442,526) (1,529,903) (519,566) (683,228)Transfer of realised gains on disposal of available for sale financial assets 696,487 580,138 (6,722) 205,251
983,722 621,412 69,641 221,191
11.2 Interest income on financial assets carried at amortised cost
Cash at bank 1,202 1,249 451 362
Securities purchased under resale agreements 32,472 66,156 9,634 17,236
Placements with banking institutions 10,141 33,888 5,979 9,232
43,815 101,293 16,064 26,830
12. PROFIT FROM OPERATIONSProfit from operations is stated after charging all expenses include the following:
Auditors’ remuneration & expenses
- Audit and audit related fees 3,440 3,487 508 508
- Non audit services 400 2,310 - -
Directors' fees 21,048 22,508 14,016 14,478
Support service fees* 34,732 33,202 13,183 11,515
Depreciation 3,224 3,097 - -
Professional services (note 12.a) 1,898 1,466 743 714
Personnel cost (note 12.b) 72,407 79,553 - -
Expenses on CSR activities 5,000 5,500 2,500 2,750
*Support service fees refers to the fees paid to Carsons Management Services (Private) Limited, a related company, which acts as the Managers and Secretaries of the Group.
In Rupees Thousands

Ceylon Guardian Investment Trust PLC Annual Report 2016/17 80 81
Group Company
For the year ended 31st March 2017 2016 2017 2016
12.a Professional services
Legal services 726 101 - 40
Valuation services 9 26 - -
Other professional services 1,163 1,339 743 674
1,898 1,466 743 714
12.b Personnel cost
Salaries, wages and other related expenses 63,737 70,930 - -
Defined benefit plan cost (note 29) 2,471 2,637 - -
Defined contribution plan cost 6,199 5,986 - -
72,407 79,553 - -
The above include
Directors’ emoluments 22,633 22,354 - -
22,633 22,354 - -
13. NET FINANCE INCOME / (EXPENSE)
Finance income
Interest income 584 539 - -
Exchange gain 57 89 - -
641 628 - -
Finance expenseInterest on overdraft 133 147 56 93
Exchange losses 335 862 - -
468 1,009 56 93
Net finance income / (expense) 173 (381) (56) (93)
Notes to the Financial StatementsIn Rupees Thousands

Management Discussion and Analysis
Our Performance Financial InformationGovernance and Risk Management
Supplementary Information
14. SHARE OF PROFIT OF EQUITY ACCOUNTED INVESTEE NET OF TAX
Investor's share of profit net of tax
Investor's share of other comprehensive income
net of tax
For the year ended 31st March 2017 2016 2017 2016
Guardian Acuity Asset Management Limited 2,747 4,809 2,505 955 2,747 4,809 2,505 955
Group Company
For the year ended 31st March 2017 2016 2017 2016
15. INCOME TAX EXPENSE15.1 Income tax expense
Provision for the year (note 15.2) 11,538 24,240 3,790 6,308 Over provision for previous year (1,207) (314) (112) (94)Dividend tax on intercompany dividends 10,795 6,947 - - Income tax expense for the year 21,126 30,873 3,678 6,214
15.2 Reconciliation between accounting profit and taxable profit Accounting profit before taxation 1,277,460 642,073 317,650 427,116
Adjustments :Exempt profits on sale of quoted public shares / Unit trusts (1,157,783) (703,744) (90,120) (225,481)Dividend income (846,248) (695,279) (404,065) (349,280)Allowable claims (2,539) (5,769) - (99)Impairment loss on available for sale financial assets 198,826 95,232 103,611 45,667 Net change in fair value of fair value through profit or loss financial assets 51,206 211,643 (1,870) 19,614 Expenses attributable to exempt profits 160,095 183,136 74,673 90,223 Disallowable expenses 28,527 30,477 13,655 14,770 Transactions adjusted on consolidation 335,588 334,893 - - Share of profit of equity accounted investees net of tax (2,747) (4,809) - - Utilisation of tax losses (note 15.3) (1,178) (1,280) - - Adjusted profit for taxation 41,207 86,573 13,534 22,530 Current tax liability for the year Current tax expense of the Company (note 15.4 (a) 3,790 6,308 3,790 6,308 Current tax expense of subsidiaries (note 15.4 (a) 7,748 17,932 - -
11,538 24,240 3,790 6,308
Income tax expense for the Group is based on the taxable profit of individual companies within the Group. At present, the tax laws in Sri Lanka do not provide for Group taxation.

Ceylon Guardian Investment Trust PLC Annual Report 2016/17 82 83
15.3 Movement in tax losses
Group Company
For the year ended 31st March 2017 2016 2017 2016
Tax losses brought forward 14,022 14,319 - -
Adjustment on finalisation of income tax liability 893 983 - -
Utilisation of tax losses during the year (1,178) (1,280) - -
Tax losses carried forward 13,737 14,022 - -
15.4 Summary of provision applicable under relevant tax legislation
(a) In accordance with the provisions of the Inland Revenue Act No. 10 of 2006 and amendments thereto, the Company and all other companies of the Group are liable to income tax at the standard rate of 28% (2016 - 28%) subject to exemptions disclosed in note 15.4 (b).
(b) In terms of section 13 (t) & Section 13 (tt) of the Inland Revenue Act, No.10 of 2006 and amendments thereto, profits derived on sale of shares on which Share Transaction Levy (STL) has been paid and profit derived on the redemption of Units of unit trust are exempt from income tax.
(c ) Economic Service Charge (ESC) paid by the Company and it’s subsidiaries are available as income tax credit over a period of four subsequent years. In instances where recoverability is not possible due to tax status, sums paid are written-off against profit / loss.
15.5 Unrecognised deferred tax assets Deferred tax assets have not been recognised for following items;
Group Company
As at 31st March 2017 2016 2017 2016
Property plant and equipment (1,580) (1,359) - -Employee benefits 10,479 9,527 - -Tax losses carried forward 13,737 14,022 - -Total deductible temporary differences 22,636 22,190 - -Unrecognised deferred tax assets 6,338 6,213 - -
The Group has not recognised the above deferred tax asset as at the reporting date due to the uncertainty regarding the availability of future taxable profits of the respective subsidiary company against which the benefit can be utilised.
16. EARNINGS PER SHARE
The following reflect the earnings and share data used for the computation of earnings per ordinary / deferred share:
Group Company
For the year ended 31st March 2017 2016 2017 2016
Amount used as the numerator
Profit for the year attributable to the shareholders of the parent 1,028,750 512,879 313,972 420,902
Amount used as denominator (in thousands)
Weighted average number of ordinary shares outstanding during the year *
No. of shares as at beginning of the year 88,780 87,836 88,780 87,836
Adjustment on issue of ordinary shares as scrip dividends - 944 - 944
Weighted average number of ordinary shares outstanding during the year 88,780 88,780 88,780 88,780
Earnings per share (Rs.) 11.59 5.78 3.54 4.74
* Each deferred share is considered to be made up of equivalent number of ordinary shares in calculating the weighted average number of shares outstanding during the year for the purpose of earnings per share calculation.
Notes to the Financial StatementsIn Rupees Thousands

Management Discussion and Analysis
Our Performance Financial InformationGovernance and Risk Management
Supplementary Information
Company
For the year ended 31st March 2017 2016
17. DIVIDEND PER SHARE17.1 Dividend paid during the year
Scrip dividend - ordinary / deferred shares - 175,673
Cash dividend - ordinary / deferred shares 266,341 263,509
Total dividend - ordinary / deferred shares 266,341 439,182
17.2 Dividend proposed during the year
First and final dividend - cash
-On ordinary shares 331,915 248,937
-On deferred shares 23,206 17,404
Total proposed dividend 355,121 266,341
Dividend per share (Rs.) 4.00 3.00
The proposed first and final dividend is subject to approval by the shareholders at the forthcoming Annual General Meeting and according to Sri Lanka Accounting Standard (LKAS 10) - “Events after the reporting period “, the liability has not been provided for in these financial statements.
18. PROPERTY, PLANT AND EQUIPMENT - GROUP
Office equipment
Computer equipment
Furniture and fittings
Motor vehicle
Total2017
Total2016
Cost
Balance as at the beginning of the year 186 5,664 5,008 9,445 20,303 16,909
Additions 72 263 86 - 421 3,394
Balance as at the end of the year 258 5,927 5,094 9,445 20,724 20,303
Accumulated depreciation
Balance as at the beginning of the year 147 3,704 2,444 5,194 11,489 8,392
Charge for the year 36 979 320 1,889 3,224 3,097
Balance as at the end of the year 183 4,683 2,764 7,083 14,713 11,489
Carrying value as at end of the year 75 1,244 2,330 2,362 6,011 8,814
18.1 Details of fully depreciated assets in property, plant and equipment are as follows;
Company
As at 31st March 2017 2016
Office equipment 53 53 Furniture and fittings 1,889 1,889
Computer equipment 3,012 2,756
4,954 4,698

Ceylon Guardian Investment Trust PLC Annual Report 2016/17 84 85
Notes to the Financial StatementsIn Rupees Thousands
18.2 The Group does not have any leased assets as at the reporting date.
18.3 No borrowing costs were capitalized during the year (2016 - Nil).
18.4 Fixed assets were not pledged as security as at the reporting date.
19. INTANGIBLE ASSETS - GROUP
Goodwill on consolidation
Computer Software
Total2017
Total2016
CostBalance as at the beginning of the year 231,917 15,350 247,267 247,267
Balance as at the end of the year 231,917 15,350 247,267 247,267
AmortisationBalance as at the beginning of the year - 15,350 15,350 15,350
Charge for the year - - - -
Balance as at the end of the year - 15,350 15,350 15,350
Net book value as at the end of the year 231,917 - 231,917 231,917
As at 31st March 2017 2016
19.1 Details of fully amortised intangible assets are as follows;
Computer software 15,350 15,350
15,350 15,350
19.2 Impairment assessment on goodwill
Goodwill arising on business combinations - Guardian Capital Partners PLC
Taking in to consideration the prevailing published market prices, net asset value of the company and the forecasted growth of its current investment portfolio, the Board of Directors is confident that no adjustment is required on impairment of Goodwill on acquisition of Guardian Capital Partners PLC.

Management Discussion and Analysis
Our Performance Financial InformationGovernance and Risk Management
Supplementary Information
20. INVESTMENT IN SUBSIDIARIES - COMPANY
As at 31st March 2017 2016
No. of shares
Cost Fair value No. of shares
Cost Fair value
20.1 Quoted investments
Ceylon Investment PLC 64,010,916 1,297,221 2,560,437 64,010,916 1,297,221 3,373,375
Guardian Capital Partners PLC 21,692,800 658,661 596,552 21,692,800 658,661 609,568
1,955,882 3,156,989 1,955,882 3,982,943
20.2 Unquoted investments
Rubber Investment Trust Limited 3,955,609 316 4,376,221 3,955,609 316 5,221,404
Guardian Fund Management Limited 2,848,678 73,321 73,321 2,848,678 73,321 73,321
The Sri Lanka Fund 1,265,823 112,280 157,455 1,265,823 112,280 147,543
185,917 4,606,997 185,917 5,442,268
Total investment in subsidiaries 2,141,799 7,763,986 2,141,799 9,425,211
The fair value of quoted investments are based on the volume weighted average prices as at 31st March, published by the Colombo Stock Exchange, whilst fair value of Rubber Investment Trust Limited is based on the net assets value arrived after fair valuation of its investment portfolio as at the reporting date. The fair value of The Sri Lanka Fund is based on unit price published by the Investment Managers, Guardian Fund Management Limited as at the reporting date.

Ceylon Guardian Investment Trust PLC Annual Report 2016/17 86 87
Notes to the Financial StatementsIn Rupees Thousands
20.3 Non-controlling interests
The following subsidiaries have material Non Controlling Interest (NCI).
Nature of the business Ownership interest held by NCI %
As at 31st March 2017 2016
Ceylon Investment PLC Investment holding 35.64 35.64 Rubber Investment Trust Limited Investment holding 17.81 17.81
Given below are the summarised financial information of these subsidiaries.
Ceylon Investment PLC Rubber Investment Trust Limited
For the year ended / as at 31st March 2017 2016 2017 2016
Revenue 297,938 322,032 1,077,417 437,049 Profit for the year 652,814 287,215 1,021,916 326,179 Total other comprehensive expense for the year (1,032,420) (4,090,419) (2,493,542) (7,148,265)Total comprehensive expense for the year (379,606) (3,803,204) (1,471,626) (6,822,086)
Current assets 1,111,403 1,141,606 2,178,996 1,151,203 Non current assets 7,644,474 8,149,102 6,580,811 9,351,020 Total assets 8,755,877 9,290,708 8,759,807 10,502,223 Current liabilities (202,737) (187,055) (14,241) (67,643)Net assets 8,553,140 9,103,653 8,745,566 10,434,580
Net cash used in operating activities (179,000) (52,634) 1,168,184 (335,898)Net cash generated from investing activities 103,191 79,195 - - Net cash used in financing activities (146,383) (242,840) (217,388) (160,076)Net decrease in cash and cash equivalents (222,192) (216,279) 950,796 (495,974)
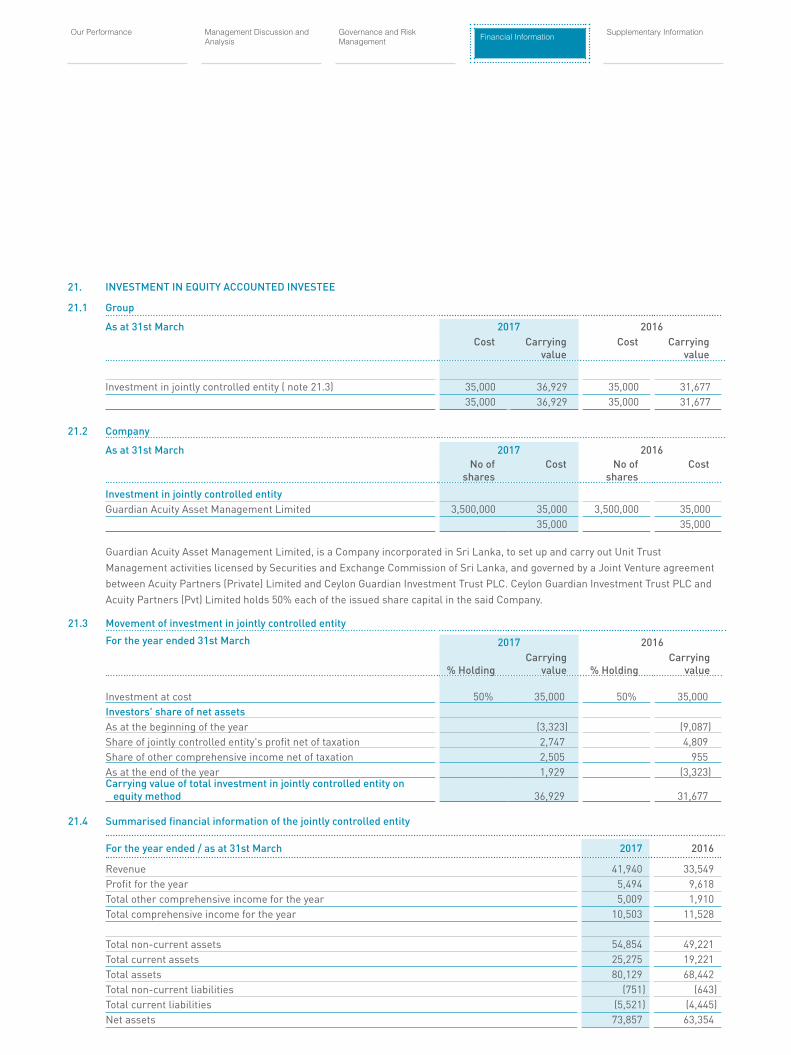
Management Discussion and Analysis
Our Performance Financial InformationGovernance and Risk Management
Supplementary Information
21. INVESTMENT IN EQUITY ACCOUNTED INVESTEE
21.1 Group
As at 31st March 2017 2016Cost Carrying
valueCost Carrying
value
Investment in jointly controlled entity ( note 21.3) 35,000 36,929 35,000 31,677 35,000 36,929 35,000 31,677
21.2 Company
As at 31st March 2017 2016No of
sharesCost No of
sharesCost
Investment in jointly controlled entityGuardian Acuity Asset Management Limited 3,500,000 35,000 3,500,000 35,000
35,000 35,000
Guardian Acuity Asset Management Limited, is a Company incorporated in Sri Lanka, to set up and carry out Unit Trust Management activities licensed by Securities and Exchange Commission of Sri Lanka, and governed by a Joint Venture agreement between Acuity Partners (Private) Limited and Ceylon Guardian Investment Trust PLC. Ceylon Guardian Investment Trust PLC and Acuity Partners (Pvt) Limited holds 50% each of the issued share capital in the said Company.
21.3 Movement of investment in jointly controlled entity
For the year ended 31st March 2017 2016
% HoldingCarrying
value % HoldingCarrying
value
Investment at cost 50% 35,000 50% 35,000 Investors' share of net assets
As at the beginning of the year (3,323) (9,087)Share of jointly controlled entity's profit net of taxation 2,747 4,809 Share of other comprehensive income net of taxation 2,505 955 As at the end of the year 1,929 (3,323)Carrying value of total investment in jointly controlled entity on equity method 36,929 31,677
21.4 Summarised financial information of the jointly controlled entity
For the year ended / as at 31st March 2017 2016
Revenue 41,940 33,549 Profit for the year 5,494 9,618 Total other comprehensive income for the year 5,009 1,910 Total comprehensive income for the year 10,503 11,528
Total non-current assets 54,854 49,221 Total current assets 25,275 19,221 Total assets 80,129 68,442 Total non-current liabilities (751) (643)Total current liabilities (5,521) (4,445)Net assets 73,857 63,354

Ceylon Guardian Investment Trust PLC Annual Report 2016/17 88 89
Notes to the Financial StatementsIn Rupees Thousands
22. AVAILABLE FOR SALE FINANCIAL ASSETS22.1 Summary - Group
As at 31st March 2017 2016Note Cost Fair value Cost Fair value
Investment in equity securities Quoted 22.3(a) 7,122,811 13,479,928 7,001,690 15,448,327 Unquoted 22.3(b) 15,734 30,423 15,734 27,186 Private equity 22.3(c) 219,879 270,508 125,261 125,261 Total investment in equity securities 7,358,424 13,780,859 7,142,685 15,600,774 Investments in debenturesUnquoted 22.3(d) 5 5 5 5 Total investment in debentures 5 5 5 5 Investments in unit trustsUnquoted 22.3(e) 25,000 40,822 90,461 120,370 Total investment in units trusts 25,000 40,822 90,461 120,370 Total investment in available for sale financial assets 7,383,429 13,821,686 7,233,151 15,721,149
22.2 Movement in Available for sale financial assets - Group
For the year ended 31st March 2017 Fair value as at 1st
April 2016
Additions Disposals Fair value adjustment
Fair valueas at 31st
March 2017
Investment in equity securities 15,600,774 1,922,169 (2,360,431) (1,381,653) 13,780,859 Investment in debentures 5 - - - 5 Investment in unit trusts 120,370 - (82,095) 2,547 40,822
15,721,149 1,922,169 (2,442,526) (1,379,106) 13,821,686
For the year ended 31st March 2016 Fair value as at 1st
April 2015
Additions Disposals Fair value adjustment
Fair valueas at 31st
March 2016
Investment in equity securities 22,780,984 2,038,183 (1,529,903) (7,688,490) 15,600,774 Investment in debentures 5 - - - 5 Investment in unit trusts 117,268 2,198 - 904 120,370
22,898,257 2,040,381 (1,529,903) (7,687,586) 15,721,149
The fair value adjustment represents the net unrealised gains / (losses) on fair value adjustment of investment portfolios including any adjustment on impairment losses.
Due to significant / prolonged decline in fair value of identified equity securities in available for sale financial assets below their cost, an impairment loss amounting to Rs. 198.8 Mn has been recognised in profit or loss for the year (2016 - 95.2 Mn) as required by LKAS – 39 “Financial Instruments; recognition and measurement”. LKAS – 39 also requires to recognise fair value gains and losses arising from assets classified as available for sale, other than impairment losses, in other comprehensive income. Accordingly, net losses of Rs. 1,180.3 Mn and Rs. 7,592.4 Mn have been recognised in financial years 2017 and 2016 respectively.

Management Discussion and Analysis
Our Performance Financial InformationGovernance and Risk Management
Supplementary Information
22.3 Available for sale financial assets - Group
(a) Investment in equity securities - quoted
As at 31st March 2017 2016
No. ofshares
Cost Fairvalue
No. ofshares
Cost Fairvalue
Banks, Finance & Insurance
Central Finance Company PLC 4,423,243 431,231 381,284 2,140,279 431,231 449,459
Commercial Bank of Ceylon PLC 6,385,229 612,375 832,634 6,648,695 627,512 834,411
Ceylinco Insurance PLC - Non voting 241,266 163,028 197,838 241,266 163,028 188,670
Hatton National Bank PLC - Non voting 2,589,577 459,147 479,072 2,389,425 422,803 408,592
Hatton National Bank PLC 3,483,073 706,468 784,736 3,286,216 664,549 654,943
HNB Assurance PLC 2,000,000 106,360 116,200 2,000,000 106,360 108,000
People's Leasing and Finance PLC 12,693,874 228,259 198,024 6,873,974 122,335 109,984
People's Insurance PLC 6,219,800 93,297 113,822 6,219,800 93,297 105,115
Sampath Bank PLC 3,973,878 916,657 1,029,234 3,729,716 860,128 842,916
Seylan Bank PLC - - - 703,790 63,582 60,526
Seylan Bank PLC - Non voting 423,314 27,541 23,155 355,035 23,273 22,367
3,744,363 4,155,999 3,578,098 3,784,983
Beverage, Food & Tobacco
Cargills (Ceylon) PLC 5,232,500 305,121 982,140 4,267,300 126,648 640,095
Distilleries Company of Sri Lanka PLC - - - 3,558,749 841,976 733,814
305,121 982,140 968,624 1,373,909
Construction & Engineering
Access Engineering PLC 6,475,619 210,200 154,120 6,475,619 210,199 134,693
210,200 154,120 210,199 134,693
Diversified
Aitken Spence PLC 3,348,000 336,851 188,158 3,348,000 336,851 246,078
Expolanka Holdings PLC 6,845,150 41,483 41,071 6,845,150 41,483 47,916
Hemas Holdings PLC - - - 1,138,685 89,590 91,778
John Keells Holdings PLC 183,693 8,466 25,331 7,244,217 316,883 1,072,144
Melstacorp PLC 11,574,996 686,108 685,240 - - -
Softlogic Holdings PLC 13,021,300 191,598 154,953 5,144,707 79,405 68,425
1,264,506 1,094,753 864,212 1,526,341
Footwear & Textiles
Hayleys Fabric PLC 22,149,122 260,382 301,228 22,149,122 260,382 398,684
260,382 301,228 260,382 398,684

Ceylon Guardian Investment Trust PLC Annual Report 2016/17 90 91
Notes to the Financial StatementsIn Rupees Thousands
As at 31st March 2017 2016
No. ofshares
Cost Fair value
No. ofshares
Cost Fairvalue
Health Care
Ceylon Hospitals PLC (Durdans) - - - 831,749 65,167 74,857
- - 65,167 74,857
Hotels & Travel
Aitken Spence Hotel Holdings PLC 4,826,890 310,812 169,907 4,826,890 310,812 255,825
Serendib Hotels PLC - - - 1,110,814 39,314 30,547
310,812 169,907 350,126 286,372
Manufacturing
Tokyo Cement Company (Lanka) PLC 9,402,600 378,408 573,559 552,166 20,496 20,430 Tokyo Cement Company (Lanka) PLC - Non voting 550,400 18,590 29,171 - - -
396,998 602,730 20,496 20,430
Motors
Diesel and Motor Engineering PLC - - - 140,429 70,187 77,194
- - 70,187 77,194
Oil Palm
Bukit Darah PLC 20,438,250 1,928 5,318,033 20,438,250 1,928 7,153,388
Bukit Darah PLC - Preference Shares - 8% participative cumulative 31,875 1 1 31,875 1 1
1,929 5,318,034 1,929 7,153,389
Telecommunication
Dialog Axiata PLC 62,036,931 628,500 701,017 60,536,931 612,270 617,475
628,500 701,017 612,270 617,475
Total investment in equity securities - quoted 7,122,811 13,479,928 7,001,690 15,448,327
The fair value of the Group’s listed investment portfolio is based on the volume weighted average price as at 31st March, published by the Colombo Stock Exchange.
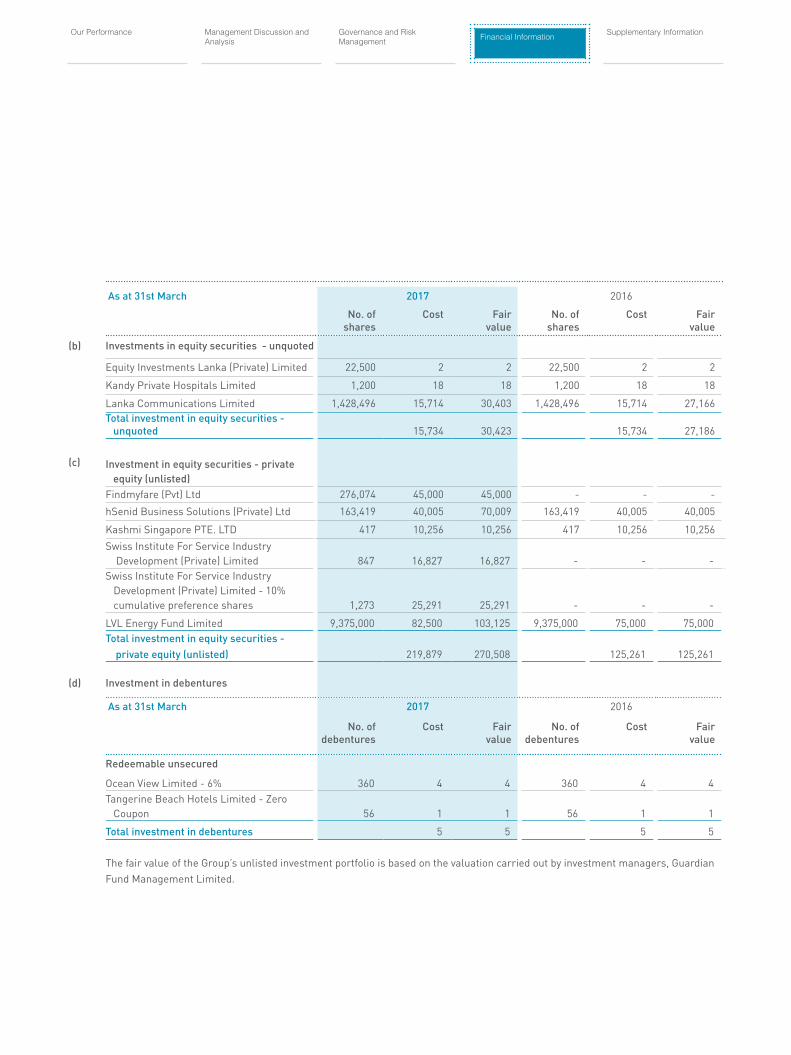
Management Discussion and Analysis
Our Performance Financial InformationGovernance and Risk Management
Supplementary Information
As at 31st March 2017 2016
No. ofshares
Cost Fair value
No. ofshares
Cost Fairvalue
(b) Investments in equity securities - unquoted
Equity Investments Lanka (Private) Limited 22,500 2 2 22,500 2 2
Kandy Private Hospitals Limited 1,200 18 18 1,200 18 18
Lanka Communications Limited 1,428,496 15,714 30,403 1,428,496 15,714 27,166 Total investment in equity securities - unquoted 15,734 30,423 15,734 27,186
(c) Investment in equity securities - private equity (unlisted)Findmyfare (Pvt) Ltd 276,074 45,000 45,000 - - -
hSenid Business Solutions (Private) Ltd 163,419 40,005 70,009 163,419 40,005 40,005
Kashmi Singapore PTE. LTD 417 10,256 10,256 417 10,256 10,256
Swiss Institute For Service Industry Development (Private) Limited 847 16,827 16,827 - - - Swiss Institute For Service Industry Development (Private) Limited - 10% cumulative preference shares 1,273 25,291 25,291 - - -
LVL Energy Fund Limited 9,375,000 82,500 103,125 9,375,000 75,000 75,000 Total investment in equity securities - private equity (unlisted) 219,879 270,508 125,261 125,261
(d) Investment in debentures
As at 31st March 2017 2016
No. of debentures
Cost Fairvalue
No. of debentures
Cost Fair value
Redeemable unsecured
Ocean View Limited - 6% 360 4 4 360 4 4 Tangerine Beach Hotels Limited - Zero Coupon 56 1 1 56 1 1
Total investment in debentures 5 5 5 5
The fair value of the Group’s unlisted investment portfolio is based on the valuation carried out by investment managers, Guardian Fund Management Limited.

Ceylon Guardian Investment Trust PLC Annual Report 2016/17 92 93
Notes to the Financial StatementsIn Rupees Thousands
As at 31st March 2017 2016
No. of units
Cost Fairvalue
No. of units
Cost Fairvalue
(e) Investments in unit trusts - unquoted
Guardian Acuity Equity Fund 2,500,000 25,000 40,822 2,500,000 25,000 38,275
Guardian Acuity Money Market Fund - - - 6,464,196 65,461 82,095
Total investment in unit trusts - unquoted 25,000 40,822 90,461 120,370
Fair value of investment in unit trust is based on the redemption unit price published by the Unit Trust Managers, Guardian Acuity Asset Management Limited, as at 31st March.
22.4 Summary - Company
As at 31st March Note 2017 2016Cost Fair
valueCost Fair
valueInvestment in equity securities
Quoted 22.6(a) 2,840,101 3,704,634 2,692,136 3,282,580
Unquoted 22.6(b) 15,724 30,413 15,724 27,176
Total investment in equity securities 2,855,825 3,735,047 2,707,860 3,309,756
Investment in debentures
Unquoted 22.6(c) 1 1 1 1
Total investment in debentures 1 1 1 1
Investment in unit trusts
Unquoted 22.6(d) 12,500 20,411 36,636 49,407
Total investment in units trusts 12,500 20,411 36,636 49,407
Total investments in available for sale financial assets 2,868,326 3,755,459 2,744,497 3,359,164

Management Discussion and Analysis
Our Performance Financial InformationGovernance and Risk Management
Supplementary Information
22.5 Movement in Available for sale financial assets- Company
For the year ended 31st March 2017 Fair value as at 1st
April 2016
Additions Disposals Fair value adjustment
Fair valueas at 31st
March 2017
Investment in equity securities 3,309,756 663,308 (489,297) 251,280 3,735,047 Investment in debentures 1 - - - 1 Investment in unit trusts 49,407 - (30,269) 1,273 20,411
3,359,164 663,308 (519,566) 252,553 3,755,459
For the year ended 31st March 2016 Fair value
as at 1st April 2015
Additions Disposals Fair value adjustment
Fair valueas at 31st
March 2016
Investment in equity securities 3,940,842 404,219 (683,228) (352,077) 3,309,756 Investment in debentures 1 - - - 1 Investment in unit trusts 48,601 811 - (5) 49,407
3,989,444 405,030 (683,228) (352,082) 3,359,164
22.6 Available for sale financial assets - Company
(a) Investment in equity securities - quoted
As at 31st March 2017 2016
No. ofshares
Cost Fairvalue
No. ofshares
Cost Fair value
Banks, Finance & Insurance
Central Finance Company PLC 2,013,107 195,433 173,530 974,084 195,433 204,558
Ceylinco Insurance PLC - Non voting 115,256 77,727 94,510 115,256 77,727 90,130
Commercial Bank of Ceylon PLC 2,764,781 224,574 360,527 2,987,374 238,418 374,915
Hatton National Bank PLC - Non voting 762,682 133,537 141,096 590,857 102,859 101,037
Hatton National Bank PLC 1,458,231 288,982 328,539 1,438,614 284,450 286,716
HNB Assurance PLC 2,000,000 106,360 116,200 2,000,000 106,360 108,000
People's Leasing and Finance PLC 3,981,305 74,024 62,108 1,823,438 33,529 29,175
People's Insurance PLC 1,765,200 26,478 32,303 1,765,200 26,478 29,832
Sampath Bank PLC 1,631,720 375,363 422,615 1,694,165 388,439 382,881
1,502,478 1,731,428 1,453,693 1,607,244
Beverage, Food & Tobacco
Cargills (Ceylon) PLC 4,632,250 193,653 869,474 4,267,300 126,648 640,094
Distilleries Company of Ceylon PLC - - - 1,324,661 310,843 273,145
193,653 869,474 437,491 913,239
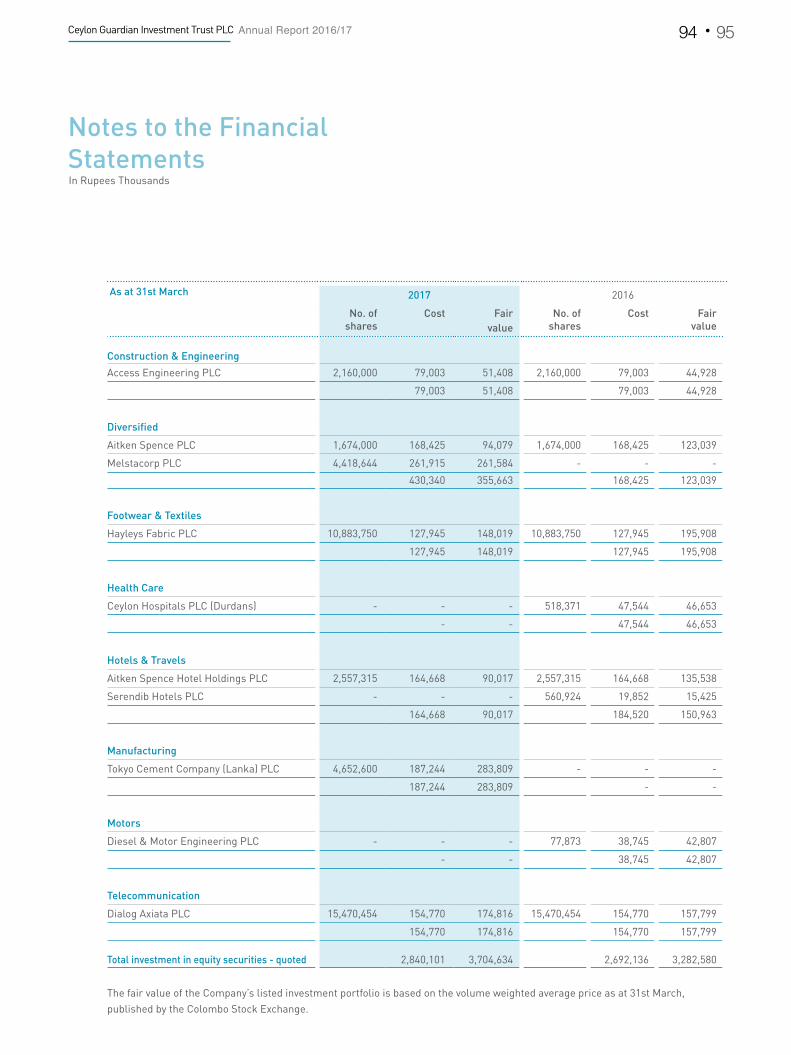
Ceylon Guardian Investment Trust PLC Annual Report 2016/17 94 95
Notes to the Financial StatementsIn Rupees Thousands
As at 31st March 2017 2016
No. ofshares
Cost Fairvalue
No. ofshares
Cost Fair value
Construction & Engineering
Access Engineering PLC 2,160,000 79,003 51,408 2,160,000 79,003 44,928
79,003 51,408 79,003 44,928
Diversified
Aitken Spence PLC 1,674,000 168,425 94,079 1,674,000 168,425 123,039
Melstacorp PLC 4,418,644 261,915 261,584 - - -
430,340 355,663 168,425 123,039
Footwear & Textiles
Hayleys Fabric PLC 10,883,750 127,945 148,019 10,883,750 127,945 195,908
127,945 148,019 127,945 195,908
Health Care
Ceylon Hospitals PLC (Durdans) - - - 518,371 47,544 46,653
- - 47,544 46,653
Hotels & Travels
Aitken Spence Hotel Holdings PLC 2,557,315 164,668 90,017 2,557,315 164,668 135,538
Serendib Hotels PLC - - - 560,924 19,852 15,425
164,668 90,017 184,520 150,963
Manufacturing
Tokyo Cement Company (Lanka) PLC 4,652,600 187,244 283,809 - - -
187,244 283,809 - -
Motors
Diesel & Motor Engineering PLC - - - 77,873 38,745 42,807
- - 38,745 42,807
Telecommunication
Dialog Axiata PLC 15,470,454 154,770 174,816 15,470,454 154,770 157,799
154,770 174,816 154,770 157,799
Total investment in equity securities - quoted 2,840,101 3,704,634 2,692,136 3,282,580
The fair value of the Company’s listed investment portfolio is based on the volume weighted average price as at 31st March, published by the Colombo Stock Exchange.
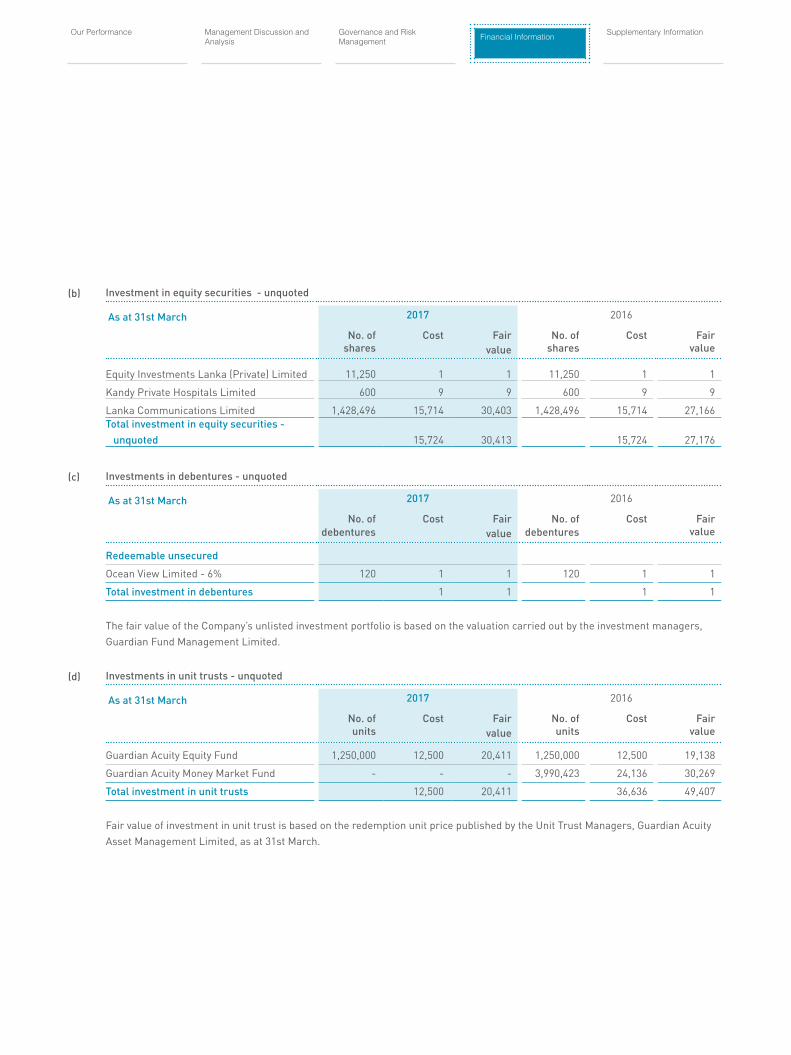
Management Discussion and Analysis
Our Performance Financial InformationGovernance and Risk Management
Supplementary Information
(b) Investment in equity securities - unquoted
As at 31st March 2017 2016
No. ofshares
Cost Fairvalue
No. ofshares
Cost Fair value
Equity Investments Lanka (Private) Limited 11,250 1 1 11,250 1 1
Kandy Private Hospitals Limited 600 9 9 600 9 9
Lanka Communications Limited 1,428,496 15,714 30,403 1,428,496 15,714 27,166 Total investment in equity securities - unquoted 15,724 30,413 15,724 27,176
(c) Investments in debentures - unquoted
As at 31st March 2017 2016
No. ofdebentures
Cost Fairvalue
No. ofdebentures
Cost Fair value
Redeemable unsecured
Ocean View Limited - 6% 120 1 1 120 1 1
Total investment in debentures 1 1 1 1
The fair value of the Company’s unlisted investment portfolio is based on the valuation carried out by the investment managers, Guardian Fund Management Limited.
(d) Investments in unit trusts - unquoted
As at 31st March 2017 2016
No. ofunits
Cost Fairvalue
No. ofunits
Cost Fair value
Guardian Acuity Equity Fund 1,250,000 12,500 20,411 1,250,000 12,500 19,138
Guardian Acuity Money Market Fund - - - 3,990,423 24,136 30,269
Total investment in unit trusts 12,500 20,411 36,636 49,407
Fair value of investment in unit trust is based on the redemption unit price published by the Unit Trust Managers, Guardian Acuity Asset Management Limited, as at 31st March.

Ceylon Guardian Investment Trust PLC Annual Report 2016/17 96 97
Notes to the Financial StatementsIn Rupees Thousands
23. TRADE AND OTHER RECEIVABLES
Group Company
As at 31st March 2017 2016 2017 2016
Financial
Trade receivables 23,961 4,793 12,657 -
Dividend receivable (note 23.1) 47,373 29,411 132,386 112,619
Other receivables 1,571 19,570 - -
72,905 53,774 145,043 112,619
Non financial
Advances and prepaid expenses 21,277 1,926 233 468
21,277 1,926 233 468
94,182 55,700 145,276 113,087
23.1 Due from related entities
Dividend receivable by the Company includes dividend receivable from the subsidiary company "Ceylon Investment PLC" amounting to Rs. 112 Mn (2016 - Rs. 96 Mn).
24. FAIR VALUE THROUGH PROFIT OR LOSS FINANCIAL ASSETS
24.1 Summary
Note Group Note Company
As at 31st March 2017 2016 2017 2016
Investment in equity securities 24.3 (a) 1,721,907 1,720,003 24.5.a 212,072 234,877
Quoted 1,721,907 1,720,003 212,072 234,877
Total Investment in equity securities
Investment in unit trusts
Unquoted 24.3 (b) 1,414,989 941,623 24.5.b 226,327 50,678
Total investment in unit trusts 1,414,989 941,623 226,327 50,678 Total Investment in fair value through profit or loss financial assets 3,136,896 2,661,626 438,399 285,555

Management Discussion and Analysis
Our Performance Financial InformationGovernance and Risk Management
Supplementary Information
24.2 Movement in fair value through profit or loss financial assets - Group
For the year ended 31st March 2017 Fair value as at 1st
April 2016
Additions Disposals Effect of currency
translation
Change infair value
Fair valueas at 31st
March 2017
Investments in equity securities - quoted 1,720,003 712,552 (668,938) 12,640 (54,350) 1,721,907 Investment in unit trusts - unquoted 941,623 1,989,608 (1,520,164) 778 3,144 1,414,989
2,661,626 2,702,160 (2,189,102) 13,418 (51,206) 3,136,896
For the year ended 31st March 2016 Fair value as at 1st
April 2015
Additions Disposals Effect of currency
translation
Change infair value
Fair valueas at 31st
March 2016
Investments in equity securities - quoted 1,653,948 851,677 (566,970) 30,694 (249,346) 1,720,003 Investment in unit trusts - unquoted 1,030,749 480,662 (607,520) 29 37,703 941,623
2,684,697 1,332,339 (1,174,490) 30,723 (211,643) 2,661,626
24.3 Fair value through profit or loss financial assets - Group
(a) Investment in equity securities - quoted
As at 31st March 2017 2016
No. ofshares
Fair value
No. ofshares
Fair value
Bank, Finance & InsuranceCentral Finance Company PLC 125,240 12,520 60,600 15,332 Ceylinco Insurance PLC 28,000 20,433 28,000 22,400 Commercial Bank of Ceylon PLC 510,299 68,758 430,084 56,622 DFCC Bank PLC 297,315 33,894 297,315 40,732 Hatton National Bank PLC 629,593 141,803 777,800 156,499 Hatton National Bank PLC - Non voting 620,903 114,867 611,276 104,528 Janashakthi Insurance Company PLC 1,350,000 20,385 1,500,000 24,000 National Development Bank PLC 409,189 58,300 - - People's Insurance PLC 57,462 1,091 - - People's Leasing & Finance PLC 866,890 14,686 1,081,000 23,782 Sampath Bank PLC 75,275 19,595 68,422 16,968 Seylan Bank PLC 843,461 73,530 1,139,671 98,462 Seylan Bank PLC - Non voting 591,755 32,369 591,755 37,281 Singer Finance (Lanka) PLC 500,000 8,550 500,000 9,050 Sinhaputhra Finance PLC - - 100,000 1,670 Softlogic Capital PLC - - 600,000 3,600 Union Bank of Colombo PLC 3,156,620 44,824 4,545,420 75,454
665,605 686,380
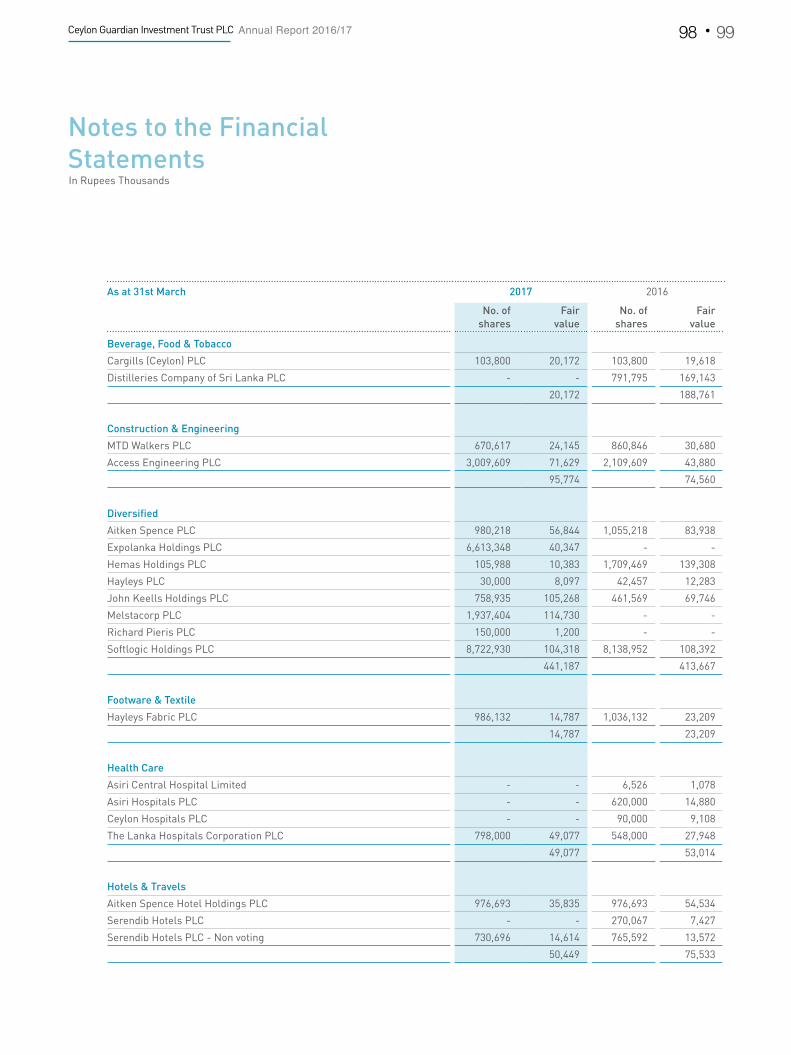
Ceylon Guardian Investment Trust PLC Annual Report 2016/17 98 99
Notes to the Financial StatementsIn Rupees Thousands
As at 31st March 2017 2016
No. ofshares
Fair value
No. ofshares
Fair value
Beverage, Food & Tobacco
Cargills (Ceylon) PLC 103,800 20,172 103,800 19,618
Distilleries Company of Sri Lanka PLC - - 791,795 169,143
20,172 188,761
Construction & Engineering
MTD Walkers PLC 670,617 24,145 860,846 30,680
Access Engineering PLC 3,009,609 71,629 2,109,609 43,880
95,774 74,560
Diversified
Aitken Spence PLC 980,218 56,844 1,055,218 83,938
Expolanka Holdings PLC 6,613,348 40,347 - -
Hemas Holdings PLC 105,988 10,383 1,709,469 139,308
Hayleys PLC 30,000 8,097 42,457 12,283
John Keells Holdings PLC 758,935 105,268 461,569 69,746
Melstacorp PLC 1,937,404 114,730 - -
Richard Pieris PLC 150,000 1,200 - -
Softlogic Holdings PLC 8,722,930 104,318 8,138,952 108,392
441,187 413,667
Footware & Textile
Hayleys Fabric PLC 986,132 14,787 1,036,132 23,209
14,787 23,209
Health Care
Asiri Central Hospital Limited - - 6,526 1,078
Asiri Hospitals PLC - - 620,000 14,880
Ceylon Hospitals PLC - - 90,000 9,108
The Lanka Hospitals Corporation PLC 798,000 49,077 548,000 27,948
49,077 53,014
Hotels & Travels
Aitken Spence Hotel Holdings PLC 976,693 35,835 976,693 54,534
Serendib Hotels PLC - - 270,067 7,427
Serendib Hotels PLC - Non voting 730,696 14,614 765,592 13,572
50,449 75,533

Management Discussion and Analysis
Our Performance Financial InformationGovernance and Risk Management
Supplementary Information
As at 31st March 2017 2016
No. ofshares
Fair value
No. ofshares
Fair value
Land & Property
Overseas Realty (Ceylon) PLC 700,000 14,140 2,490,859 58,286
14,140 58,286
Manufacturing
ACL Cables PLC 725,842 39,558 - -
Alumex PLC 2,660,000 51,017 - -
Chevron Lanka Lubricants PLC 354,746 60,307 75,381 22,991
Kelan Tyres PLC 516,748 28,421 516,748 33,072
Swisstek (Celyon) PLC 240,000 15,744 - -
Tokyo Cement Company (Lanka) PLC 631,407 38,049 - -
Tokyo Cement Company (Lanka) PLC - Non voting 715,000 37,895 - -
270,991 56,063
Power & Energy
Lanka IOC PLC 620,800 18,003 - -
Laughfs GAS PLC 100,000 3,329 100,000 4,150
Vallibel Power Erathna PLC - - 1,034,117 8,273
21,332 12,423
Telecommunications
Dialog Axiata PLC 7,055,128 78,393 6,850,000 71,095
78,393 71,095
Trading
Singer Sri Lanka PLC - - 50,846 7,012
- 7,012
Total investment in equity securities - quoted 1,721,907 1,720,003
(b) Investments in unit trusts - unquoted
As at 31st March 2017 2016
No. ofunits
Fair value
No. ofunits
Fair value
Guardian Acuity Fixed Income Fund 50,868,532 716,164 41,931,277 532,518
Guardian Acuity Money Market Gilt Fund 5,996,715 698,825 3,842,442 409,105
Total investment in unit trusts - unquoted 1,414,989 941,623

Ceylon Guardian Investment Trust PLC Annual Report 2016/17 100 101
Notes to the Financial StatementsIn Rupees Thousands
24.4 Movement in fair value through profit or loss financial assets - Company
For the year ended 31st March 2017 Fair value as at 1st
April 2016
Additions Disposals Fair value adjustment
Fair valueas at 31st
March 2017
Investment in equity securities - quoted 234,877 56,438 (80,832) 1,589 212,072 Investment in unit trusts - unquoted 50,678 325,000 (149,632) 281 226,327
285,555 381,438 (230,464) 1,870 438,399
For the year ended 31st March 2016 Fair value as at 1st
April 2015
Additions Disposals Fair value adjustment
Fair valueas at 31st
March 2016
Investment in equity securities - quoted 204,670 97,102 (46,603) (20,292) 234,877 Investment in unit trusts - unquoted - 50,000 - 678 50,678
204,670 147,102 (46,603) (19,614) 285,555
The fair value adjustment represents unrealised fair valuation gains / (losses) on fair value through profit or loss financial assets.
24.5 Fair value through profit or loss financial assets - Company
(a) Investment in equity securities - quoted
As at 31st March 2017 2016
No. ofshares
Fair value
No. ofshares
Fair value
Banks Finance & InsuranceHatton National Bank PLC - Non voting 284,055 52,551 279,651 47,820
Seylan Bank PLC 319,671 27,811 319,671 27,492
Union Bank of Colombo PLC 772,500 10,970 772,500 12,824
91,332 88,136
Beverage Food & Tobacco
Distilleries Company of Sri Lanka PLC - - 132,500 27,322
- 27,322
Diversified
Hemas Holdings PLC - - 326,495 26,315
John Keells Holdings PLC 148,780 20,517 313,933 46,462
Melstacorp PLC 530,000 31,376 - -
Softlogic Holdings PLC 1,745,500 20,771 1,745,500 23,215
72,664 95,992
Health Care
The Lanka Hospital Corporation PLC 350,000 21,525 100,000 5,100
21,525 5,100
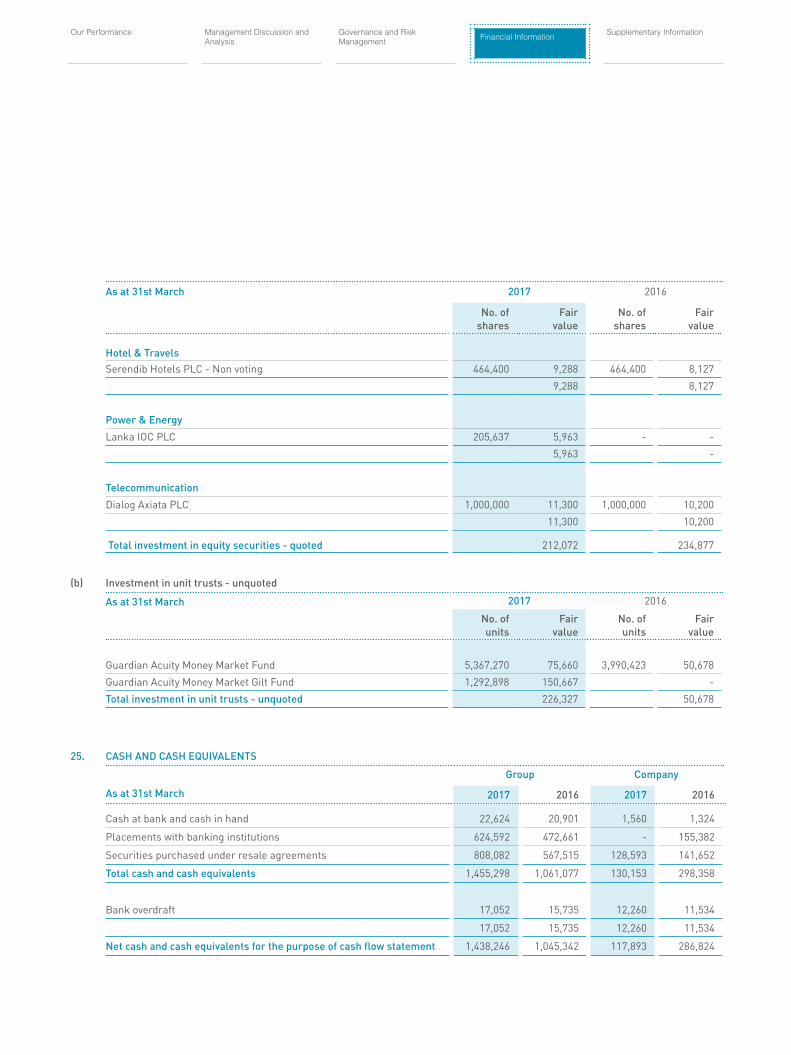
Management Discussion and Analysis
Our Performance Financial InformationGovernance and Risk Management
Supplementary Information
As at 31st March 2017 2016
No. ofshares
Fair value
No. ofshares
Fair value
Hotel & TravelsSerendib Hotels PLC - Non voting 464,400 9,288 464,400 8,127
9,288 8,127
Power & Energy
Lanka IOC PLC 205,637 5,963 - -
5,963 -
Telecommunication
Dialog Axiata PLC 1,000,000 11,300 1,000,000 10,200
11,300 10,200
Total investment in equity securities - quoted 212,072 234,877
(b) Investment in unit trusts - unquoted
As at 31st March 2017 2016
No. ofunits
Fair value
No. ofunits
Fair value
Guardian Acuity Money Market Fund 5,367,270 75,660 3,990,423 50,678
Guardian Acuity Money Market Gilt Fund 1,292,898 150,667 -
Total investment in unit trusts - unquoted 226,327 50,678
25. CASH AND CASH EQUIVALENTS
Group Company
As at 31st March 2017 2016 2017 2016
Cash at bank and cash in hand 22,624 20,901 1,560 1,324
Placements with banking institutions 624,592 472,661 - 155,382
Securities purchased under resale agreements 808,082 567,515 128,593 141,652
Total cash and cash equivalents 1,455,298 1,061,077 130,153 298,358
Bank overdraft 17,052 15,735 12,260 11,534
17,052 15,735 12,260 11,534
Net cash and cash equivalents for the purpose of cash flow statement 1,438,246 1,045,342 117,893 286,824
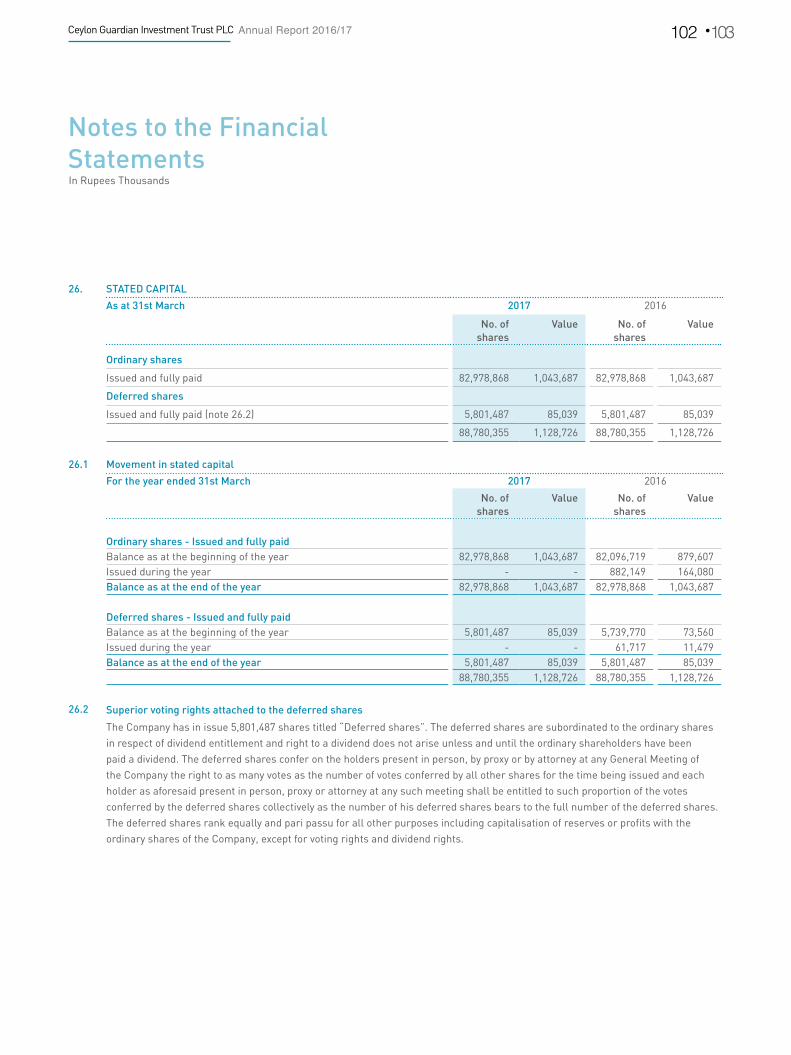
Ceylon Guardian Investment Trust PLC Annual Report 2016/17 102 103
Notes to the Financial StatementsIn Rupees Thousands
26. STATED CAPITAL
As at 31st March 2017 2016
No. ofshares
Value No. ofshares
Value
Ordinary shares
Issued and fully paid 82,978,868 1,043,687 82,978,868 1,043,687
Deferred shares
Issued and fully paid (note 26.2) 5,801,487 85,039 5,801,487 85,039
88,780,355 1,128,726 88,780,355 1,128,726
26.1 Movement in stated capital
For the year ended 31st March 2017 2016
No. ofshares
Value No. ofshares
Value
Ordinary shares - Issued and fully paidBalance as at the beginning of the year 82,978,868 1,043,687 82,096,719 879,607 Issued during the year - - 882,149 164,080 Balance as at the end of the year 82,978,868 1,043,687 82,978,868 1,043,687
Deferred shares - Issued and fully paidBalance as at the beginning of the year 5,801,487 85,039 5,739,770 73,560 Issued during the year - - 61,717 11,479 Balance as at the end of the year 5,801,487 85,039 5,801,487 85,039
88,780,355 1,128,726 88,780,355 1,128,726
26.2 Superior voting rights attached to the deferred shares
The Company has in issue 5,801,487 shares titled “Deferred shares”. The deferred shares are subordinated to the ordinary shares in respect of dividend entitlement and right to a dividend does not arise unless and until the ordinary shareholders have been paid a dividend. The deferred shares confer on the holders present in person, by proxy or by attorney at any General Meeting of the Company the right to as many votes as the number of votes conferred by all other shares for the time being issued and each holder as aforesaid present in person, proxy or attorney at any such meeting shall be entitled to such proportion of the votes conferred by the deferred shares collectively as the number of his deferred shares bears to the full number of the deferred shares. The deferred shares rank equally and pari passu for all other purposes including capitalisation of reserves or profits with the ordinary shares of the Company, except for voting rights and dividend rights.

Management Discussion and Analysis
Our Performance Financial InformationGovernance and Risk Management
Supplementary Information
27. CAPITAL RESERVESGroup Company
As at 31st March 2017 2016 2017 2016
Investment reserve (note 27.1) 7,805 7,805 7,805 7,805
Other capital reserve (note 27.1) 316,741 316,741 200,855 200,855
Jointly controlled entity's capital reserve (note 27.2) 5,895 3,390 - -
330,441 327,936 208,660 208,660
27.1 Investment reserve and other capital reserveThese amounts have been reserved for future development of the Company.
27.2 Jointly controlled entity's capital reserveJointly controlled entity's capital reserve recognises the investor’s share of the other comprehensive income / (expense) of the jointly controlled entity after the date of acquisition.
28. REVENUE RESERVESGroup Company
As at 31st March 2017 2016 2017 2016
Currency translation reserve (note 28.1) 70,421 59,839 - -
Fair value through profit or loss financial assets reserve (note 28.2) 703 10,043 - -
Available for sale financial assets reserve (note 28.3) 5,662,417 7,175,585 1,159,668 796,782
General reserve (note 28.4) 32,668 32,668 14,961 14,961
Retained earnings 8,180,373 7,402,499 4,109,247 4,059,375
13,946,582 14,680,634 5,283,876 4,871,118
28.1 Currency translation reserve
Foreign currency translation reserve represents exchange differences arising from the translation of the financial statements of foreign operations whose functional currencies are different from that of the Group's presentation currency.
28.2 Fair value through profit or loss financial assets reserve
Net unrealised gains arising from fair value adjustment of fair value through profit or loss financial assets will be transferred from retained earnings to “Fair value through profit or loss financial assets reserve” as at the reporting date and any realised gains and / or losses arising from fair value adjustment of such assets will be transferred from “Fair value through profit or loss financial assets reserve” to retained earnings to the extent that transfer does not exceed the balance held in the said reserve as at that date.
During the year, Rs. 9.3 Mn was transferred from “Fair value through profit or loss financial assets reserve” to retained earnings of the Group (2016 - Rs. 74.9 Mn) and no transfer was made from the said reserve to retains earnings of the Company (2016 - Rs. 13.2 Mn) as shown in the Statement of Changes in Equity.
28.3 Available for sale financial assets reserve
Available for sale financial assets reserve consists of net unrealised gains arising from fair valuation of available for sale financial assets, excluding the impact arising from impairment of such assets.
28.4 General reserve
This represents the amounts set aside by the Directors to meet any contingencies.

Ceylon Guardian Investment Trust PLC Annual Report 2016/17 104 105
Notes to the Financial StatementsIn Rupees Thousands
29. EMPLOYEE BENEFITS - GROUP
As at 31st March 2017 2016
Balance as at the beginning of the year 9,528 10,034
Payments made during the year - (3,050)
Provision for the year 951 2,544
Balance as at the end of the year 10,479 9,528
For the year ended 31st March 2017 2016
29.1 The amounts recognised in Profit or Loss are as follows;
Interest cost 1,000 1,004
Current service cost 1,471 1,633
Charged for the year 2,471 2,637
29.2 The amounts recognised in other comprehensive income are as follows;
Actuarial gains (1,520) (93)
Recognised for the year (1,520) (93)
Provision for the year 951 2,544
The gratuity liability as at 31st March 2017 amounting to Rs. 10,479,117/- (2016 - Rs.9,527,542/-) for Group is made based on an actuarial valuation carried out by Mr. M. Poopalanathan (AIA) of Messrs. Actuarial & Management Consultants (Pvt) Ltd. As recommended by Sri Lanka Accounting Standards (LKAS - 19) - "Employee Benefits", the "Projected Unit Credit (PUC)" method has been used in this valuation. The principal assumptions made are given below :Rate of discount 11.50% p.a. ( 2016 - 10.50%) Rate of pay increase 11% p.a. ( 2016 - 12%) Retirement age 55 years Mortality A 67/70 mortality table, issued by the Institute of Actuaries, London was used. Withdrawal rate 5% for age up to 50 and Zero thereafter. The company is a going concern. The above liability is not externally funded.

Management Discussion and Analysis
Our Performance Financial InformationGovernance and Risk Management
Supplementary Information
29.3 Sensitivity analysisA change of 1% in discount rate & future salary growth rates at the end of the reporting period would have increased / (decreased) equity and profit or loss by the amounts shown below. This analysis assumes that all other variables, remain constant.
For the year ended 31st March 2017 1% Increase 1% Decrease
Discount rate 3 (3)
Future salary increase (976) 867
For the year ended 31st March 2016 1% Increase 1% Decrease
Discount rate 898 (1,044)
Future salary increase (1,042) 913
30. TRADE AND OTHER PAYABLESGroup Company
As at 31st March 2017 2016 2017 2016
Financial
Trade payables 1,240 72,787 45 -
Dividend payables 62,020 54,195 - -
Other payables 68,269 54,064 24,218 22,118
131,529 181,046 24,263 22,118
Non financial
Accruals and provisions 22,465 22,924 2,604 2,250
22,465 22,924 2,604 2,250
153,994 203,970 26,867 24,368

Ceylon Guardian Investment Trust PLC Annual Report 2016/17 106 107
Notes to the Financial StatementsIn Rupees Thousands
31. RELATED PARTY TRANSACTIONS The Company carried out transactions in the ordinary course of its business with parties who are defined as related parties in Sri Lanka Accounting Standard LKAS 24 - “Related Party Disclosures ”, the details of which are reported below.
31.1 Parent and ultimate controlling party In the opinion of the Directors, Carson Cumberbatch PLC is the parent Company and Bukit Darah PLC is the ultimate controlling entity of Ceylon Guardian Investment Trust PLC.
31.2 Group entities
Ownership interest %As at 31st March 2017 2016
SubsidiariesCeylon Investment PLC 64 64Rubber Investment Trust Limited 82 82Guardian Capital Partners PLC 84 84Guardian Fund Management Limited 100 100The Sri Lanka Fund 70 70
Jointly controlled entityGuardian Acuity Asset Management Limited 50 50
31.3 Transactions with Key Management Personnel (KMP)According to Sri Lanka Accounting Standard (LKAS 24) - “Related Party Disclosures”, Key Management Personnel (KMP) are those having authority and responsibility for planning and controlling the activities of the entity directly or indirectly. Accordingly, the Directors of the Company and the Directors of the parent Company, Carson Cumberbatch PLC, have been classified as Key Management Personnel of the Company. Mrs. W. Y. R. Fernando was appointed to the Board on 15th August 2016. Accordingly, she has been classified as KMP from the date of her appointment to the Board. Compensation paid to the Key Management Personnel of the Company and the Group comprise the following;
Group CompanyFor the year ended 31st March 2017 2016 2017 2016
Short-term employee benefits 42,875 44,051 14,016 14,478 Post-employment benefits 738 730 - - Termination benefits paid - 3,050 - - Other long-term benefits - - - - Non cash benefits 68 81 - -
43,681 47,912 14,016 14,478
No transactions have taken place during the year between the Company and its subsidiaries and it's KMP other than those disclosed below.
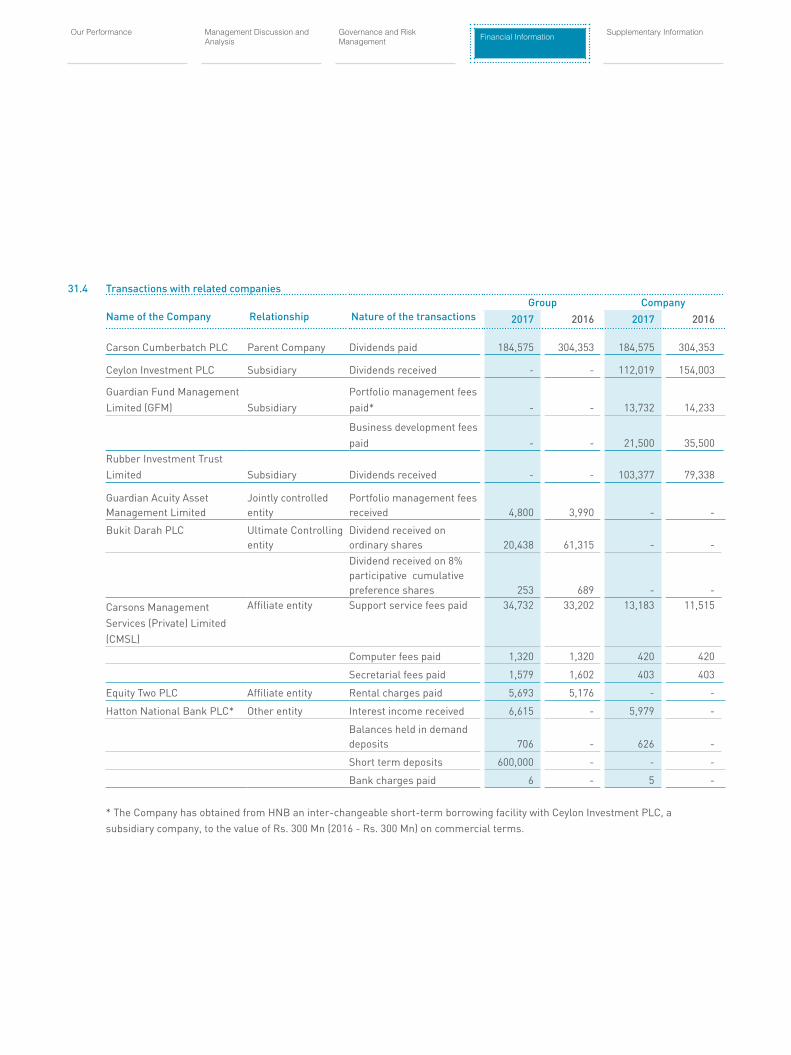
Management Discussion and Analysis
Our Performance Financial InformationGovernance and Risk Management
Supplementary Information
31.4 Transactions with related companiesGroup Company
Name of the Company Relationship Nature of the transactions 2017 2016 2017 2016
Carson Cumberbatch PLC Parent Company Dividends paid 184,575 304,353 184,575 304,353
Ceylon Investment PLC Subsidiary Dividends received - - 112,019 154,003
Guardian Fund Management Limited (GFM) Subsidiary
Portfolio management fees paid* - - 13,732 14,233
Business development fees paid - - 21,500 35,500
Rubber Investment Trust Limited Subsidiary Dividends received - - 103,377 79,338
Guardian Acuity Asset Management Limited
Jointly controlled entity
Portfolio management fees received 4,800 3,990 - -
Bukit Darah PLC Ultimate Controlling entity
Dividend received on ordinary shares 20,438 61,315 - - Dividend received on 8% participative cumulative preference shares 253 689 - -
Carsons Management Services (Private) Limited (CMSL)
Affiliate entity Support service fees paid
34,732 33,202 13,183 11,515
Computer fees paid 1,320 1,320 420 420
Secretarial fees paid 1,579 1,602 403 403
Equity Two PLC Affiliate entity Rental charges paid 5,693 5,176 - -
Hatton National Bank PLC* Other entity Interest income received 6,615 - 5,979 -
Balances held in demand deposits 706 - 626 -
Short term deposits 600,000 - - -
Bank charges paid 6 - 5 -
* The Company has obtained from HNB an inter-changeable short-term borrowing facility with Ceylon Investment PLC, a subsidiary company, to the value of Rs. 300 Mn (2016 - Rs. 300 Mn) on commercial terms.

Ceylon Guardian Investment Trust PLC Annual Report 2016/17 108 109
Notes to the Financial StatementsIn Rupees Thousands
32. FINANCIAL INSTRUMENTS Financial risk management - Overview The Group has exposure to the following risks arising from financial instruments: - Credit risk - Liquidity risk - Market risk.
This note presents information about the Group’s exposure to each of the above risks, the Group's objectives, policies and processes for measuring and managing such risks, and the Company’s management of capital. Pages 24 to 30 also carry a review of risks faced by the Group and the approach of managing such risks.
Risk management framework The Company’s Board of Directors has the overall responsibility for the establishment and oversight of the Company’s risk
management framework. The Board of Directors has delegated this function to the Management of Guardian Fund Management Limited, the Investment' Managers and Carsons Management Services (Private) Limited, the Managers; who are responsible for developing and monitoring the Group’s risk management policies and reports regularly to the Board of Directors on its activities.
The Group’s risk management policies are established to identify and analyse the risks faced by the Group, to set appropriate risk limits and controls, and to monitor risks and adherence to such limits. Risk management policies and systems are reviewed regularly to reflect changes in market conditions and the Group’s activities.
The Group’s investment portfolio comprises of investments in listed / unlisted equity securities and fixed income securities. The
group’s Investment Manager has been given discretionary authority to manage the assets, in line with the Group’s investment policies and objectives.
Further, an Investment Committee provides advice and insights to the fund management team to further sharpen and refine their decision making process. This comprehensive management structure determines the objectives and policies of the Group’s risk management framework and promotes a culture of risk awareness and balanced risk-taking within the Group.
32.1 Credit risk Credit risk is the risk of financial loss to the Group, if a customer or a counter-party to a financial instrument or an obliged party
to a receivable fails to meet their contractual obligations, and arises primarily on the Group’s investments in fixed income earning securities, placements with banking institutions, receivables from market intermediaries and other counter-parties, the Group has dealings with.

Management Discussion and Analysis
Our Performance Financial InformationGovernance and Risk Management
Supplementary Information
Carrying amountAs at 31st March Note 2017 2016
Available for sale financial assets - Investment in debentures 22.3(d) 5 5
Available for sale financial assets - Investment in unit trusts 22.3(e) 40,822 120,370
Fair value through profit or loss financial assets - Investment in unit trusts 24.3(b) 1,414,989 941,623
Trade and other receivables* 23 72,905 53,774
Cash and cash equivalents - Cash at bank and cash in hand 25 22,624 20,901
Cash and cash equivalents - Placements with banking institutions 25 624,592 472,661
Cash and cash equivalents - Securities purchased under resale agreements 25 808,082 567,515
2,984,019 2,176,849
*Advances and prepaid expense which are non financial assets are excluded
Investment in corporate debt securities
These represents investment in debentures, which yields interest income on a continuing basis. However the Group's exposure to credit risk, arising from these investments is insignificant, considering the net investment value.
Investment in unit trustsThe Group has invested in following unit trusts;
Name of the fund Fund category Fund’s investment instruments
Guardian Acuity Money Market Fund Money market fund Fixed income securities within the maturity period less than 365 days
Guardian Acuity Equity Fund Equity fund Listed equity securitiesGuardian Acuity Money Market Gilt Fund Money market fund Government securities within the
maturity period less than 365 days
Guardian Acuity Asset Management Limited, a joint venture company of Ceylon Guardian Investment Trust PLC and Acuity Partners Limited is the Investment Manager of the unit trust funds that the Group has invested in. The Group continuously monitors the performance, asset allocation, credit quality and maturity profiles of these funds in order to assess and mitigate the credit risk.
Trade and other receivables A significant portion of the trade and other receivable comprise of proceeds receivable on disposal of quoted securities, dividend receivables and portfolio management fee receivables from clients external to the Group.
Settlement procedures surrounding the equity markets are highly structured and regulated. “T+3” settlement cycle is in place with the involvement of a custodian bank, which is being duly monitored by the regulator, hence provides an assurance on the realisation of the balances. Further, a due evaluation process, including a continuous assessment mechanism is in place when selecting the market intermediaries that the Group transacts with, which involves prior approval from the Board of Directors.
Dividend receivable is accounted for when the right to receive the dividend is established. The balances are settled within a maximum period of 4-6 weeks and no risk of default, based on past experience in the industry.
32.1.1 Credit risk exposure and managing the risk The carrying amount of financial assets represents the maximum credit exposure. The maximum exposure to credit risk at the end
of the reporting period was as follows.
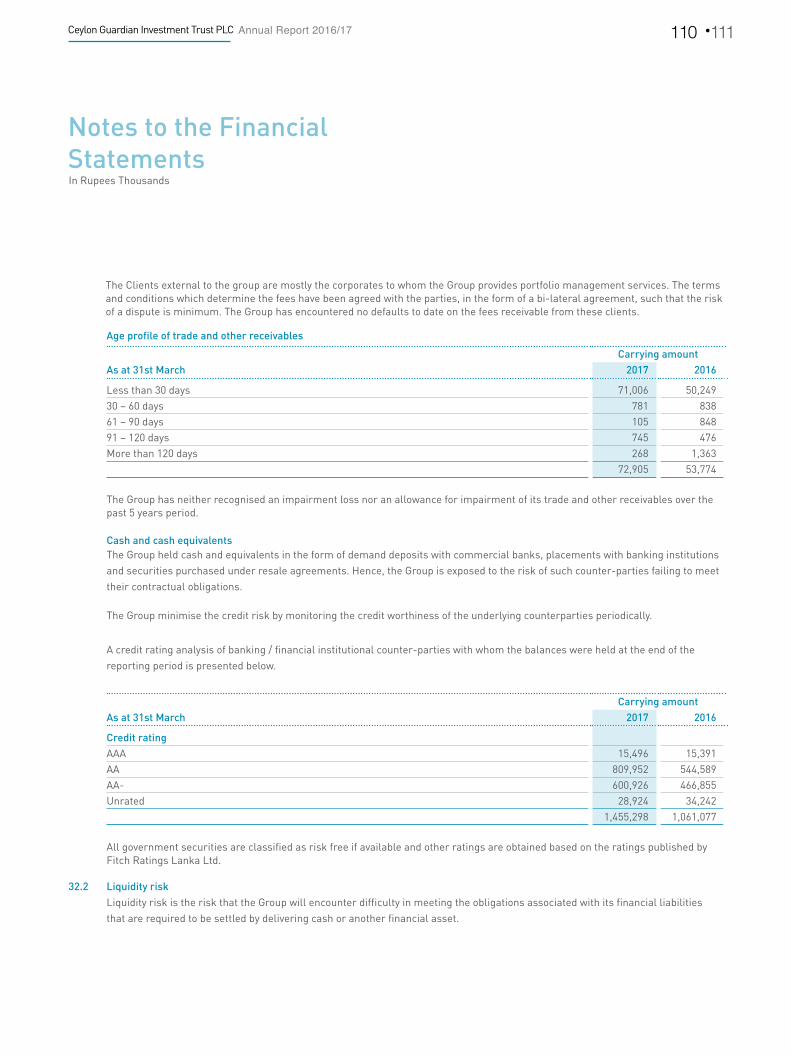
Ceylon Guardian Investment Trust PLC Annual Report 2016/17 110 111
Notes to the Financial StatementsIn Rupees Thousands
Age profile of trade and other receivables
Carrying amountAs at 31st March 2017 2016
Less than 30 days 71,006 50,249 30 – 60 days 781 838 61 – 90 days 105 848 91 – 120 days 745 476 More than 120 days 268 1,363
72,905 53,774
The Group has neither recognised an impairment loss nor an allowance for impairment of its trade and other receivables over the past 5 years period.
Cash and cash equivalentsThe Group held cash and equivalents in the form of demand deposits with commercial banks, placements with banking institutions and securities purchased under resale agreements. Hence, the Group is exposed to the risk of such counter-parties failing to meet their contractual obligations.
The Group minimise the credit risk by monitoring the credit worthiness of the underlying counterparties periodically.
A credit rating analysis of banking / financial institutional counter-parties with whom the balances were held at the end of the reporting period is presented below.
Carrying amountAs at 31st March 2017 2016
Credit ratingAAA 15,496 15,391 AA 809,952 544,589 AA- 600,926 466,855 Unrated 28,924 34,242
1,455,298 1,061,077
All government securities are classified as risk free if available and other ratings are obtained based on the ratings published by Fitch Ratings Lanka Ltd.
32.2 Liquidity riskLiquidity risk is the risk that the Group will encounter difficulty in meeting the obligations associated with its financial liabilities that are required to be settled by delivering cash or another financial asset.
The Clients external to the group are mostly the corporates to whom the Group provides portfolio management services. The terms and conditions which determine the fees have been agreed with the parties, in the form of a bi-lateral agreement, such that the risk of a dispute is minimum. The Group has encountered no defaults to date on the fees receivable from these clients.

Management Discussion and Analysis
Our Performance Financial InformationGovernance and Risk Management
Supplementary Information
32.2.1 Exposure to credit riskThe following are the contractual maturities of financial liabilities at the end of the reporting period.
Contractual cash flows
As at 31st March 2017Carrying amount
Total up to 3months
3-12 months More thana year
Non derivative financial liabilitiesTrade and other payables * 131,529 131,529 131,529 - - Bank overdraft 17,052 17,052 17,052 - -
148,581 148,581 148,581 - -
Contractual cash flows
As at 31st March 2016Carrying amount
Total up to 3months
3-12 months More thana year
Non derivative financial liabilitiesTrade and other payables * 181,046 181,046 181,046 - - Bank overdraft 15,735 15,735 15,735 - -
196,781 196,781 196,781 - -
* Provisions and accrued expenses which are non financial liabilities are excluded.
The ratio of liquid assets with a very short expected liquidation period to total net assets is set out below.
As at 31st March 2017 2016
Cash and cash equivalent 1,455,298 1,061,077 Fair value through profit or loss financial assets - Investment in unit trusts 1,414,989 941,623 Total liquid assets 2,870,287 2,002,700
Liquid assets as a % of the total net assets 15% 10%
32.2.2 Management of liquidity riskThe Group’s approach to managing liquidity is to ensure, as far as possible, that it will always have sufficient liquidity to meet its liabilities when due, under both normal and stressed conditions, without incurring unacceptable losses or risking the Group’s reputation.
The Group maintains a portion of its assets in highly liquid form; demand deposits with commercial banks, placements with banking institutions, securities purchased under resale agreements and short term investment in money market funds, in order to capitalise the market opportunities and to meet its contractual obligations during the normal course of its operations.
A significant portion of the Group’s investment portfolio comprises of listed equity investments which provides the Group with exposure to adequate liquidity, given the ability to convert in to cash and cash equivalents within a very short period of time if required.
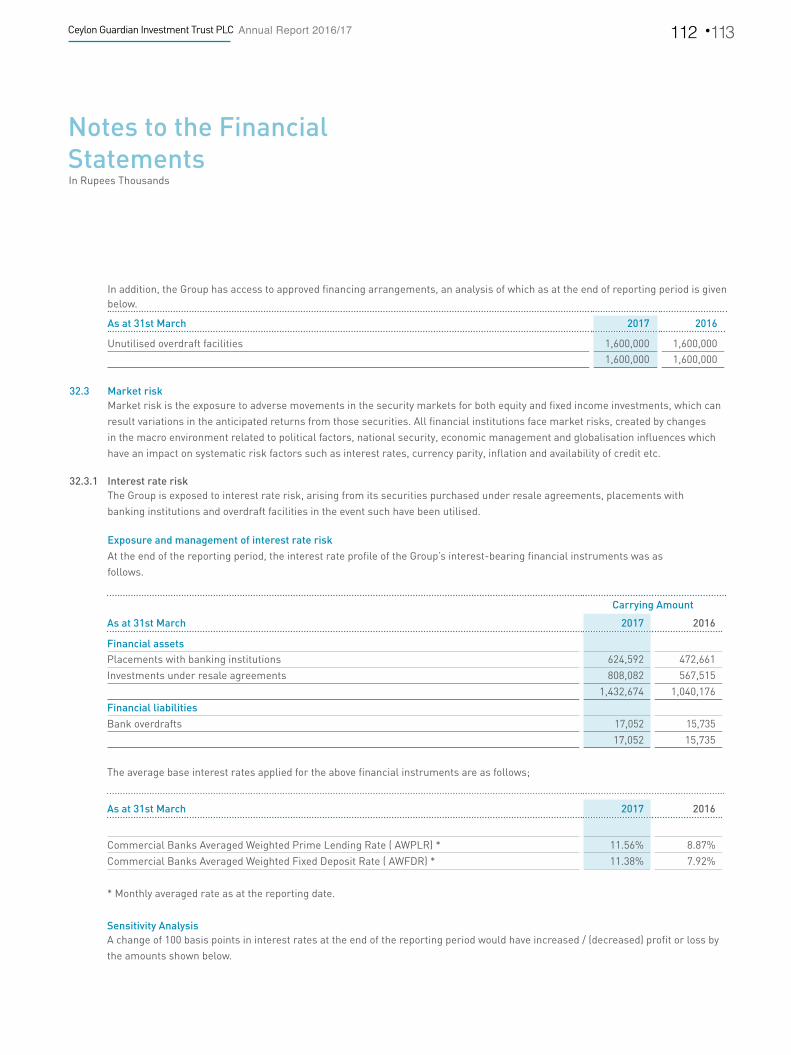
Ceylon Guardian Investment Trust PLC Annual Report 2016/17 112 113
Notes to the Financial StatementsIn Rupees Thousands
In addition, the Group has access to approved financing arrangements, an analysis of which as at the end of reporting period is given below.
As at 31st March 2017 2016
Unutilised overdraft facilities 1,600,000 1,600,000 1,600,000 1,600,000
32.3 Market riskMarket risk is the exposure to adverse movements in the security markets for both equity and fixed income investments, which can result variations in the anticipated returns from those securities. All financial institutions face market risks, created by changes in the macro environment related to political factors, national security, economic management and globalisation influences which have an impact on systematic risk factors such as interest rates, currency parity, inflation and availability of credit etc.
32.3.1 Interest rate riskThe Group is exposed to interest rate risk, arising from its securities purchased under resale agreements, placements with banking institutions and overdraft facilities in the event such have been utilised.
Exposure and management of interest rate riskAt the end of the reporting period, the interest rate profile of the Group’s interest-bearing financial instruments was as follows.
Carrying Amount
As at 31st March 2017 2016
Financial assetsPlacements with banking institutions 624,592 472,661
Investments under resale agreements 808,082 567,515
1,432,674 1,040,176
Financial liabilities
Bank overdrafts 17,052 15,735
17,052 15,735
The average base interest rates applied for the above financial instruments are as follows;
As at 31st March 2017 2016
Commercial Banks Averaged Weighted Prime Lending Rate ( AWPLR) * 11.56% 8.87%
Commercial Banks Averaged Weighted Fixed Deposit Rate ( AWFDR) * 11.38% 7.92%
* Monthly averaged rate as at the reporting date.
Sensitivity AnalysisA change of 100 basis points in interest rates at the end of the reporting period would have increased / (decreased) profit or loss by the amounts shown below.

Management Discussion and Analysis
Our Performance Financial InformationGovernance and Risk Management
Supplementary Information
Movement in interest rate Profit or Loss
Increase
by 1%Decrease
by 1%
As at 31st March 2017 - On interest earning assets 14,327 (14,327)
- On interest bearing liabilities (171) 171
14,156 (14,156)
As at 31st March 2016
- On interest earning assets 10,402 (10,402)
- On interest bearing liabilities (157) 157
10,245 (10,245)
32.3.2 Exposure and management of other market price risksEquity price riskThe Group is holding an investment portfolio which includes both listed equity investments and private equity (unlisted) investments.
Listed equity investmentsHaving a substantial portion of 76% (2016 - 82%) of its discretionary portfolio as equity investments designated as listed investments in the Colombo Stock Exchange, market volatilities bring in substantial variations to the Group’s earnings and value of its asset base at the reporting dates. The Group monitors its investment portfolio based on market indices, where decisions concerned with the timing of buy / sell are well supported with structured in-house research recommendations. Transactions of a major magnitude within the portfolio are subject to review and approval by the Investment Committee.
Private equity investmentsDetailed evaluations are carried out prior to investing on both financial and operational feasibilities of the private equity projects that the Company ventures in to, with a view to ascertain the Company’s investment decisions and the risks involved.
Continuous monitoring of the financial and operational results against the investee's business plans and the industry standards ensure that the projects meet the desired outcome and thereby the expected returns. Further, the Company generally enters in to investment agreements with the parties concerned, which carry specific ‘exit clauses’ to private equity projects such as ‘Initial Public Offering’, ‘Buy-out’ etc.
The total asset base which is exposed to equity price risk is tabulated below.
NoteCarrying amount
As at 31st March 2017 2017 2016
Available for sale financial assets - investments in equity securities 22.3.a/b/c 13,780,859 15,600,774
Available for sale financial assets - investment in unit trusts Guardian acuity equity fund 22.3.e 40,822 38,275
Fair value through profit or loss financial assets - investment in equity securities 24.3.a 1,721,907 1,720,003
15,543,588 17,359,052
A broad analysis of the investments made by the Company based on the industry / sector is given in note 22 and 24.

Ceylon Guardian Investment Trust PLC Annual Report 2016/17 114 115
Notes to the Financial StatementsIn Rupees Thousands
32.3.3 Currency riskForeign currency risk is the risk that fair value or future cash flows of a financial instrument will fluctuate, due to changes in foreign exchange rates. The Group is exposed to currency risk, through its' subsidiary, The Sri Lanka fund (a country fund incorporated in Cayman Islands), which is denominated in a currency other than the group's functional currency, which is the prime factor that exposes the Group in to currency risk.
Following are the exchange rates that were used to translate the assets and liabilities of foreign operations, to Sri Lanka Rupees at exchange rates at the reporting date. The income and expenses of foreign operations are translated to Sri Lanka Rupees at the averaged exchange rates for the reporting period.
Conversion rate
For the year ended / As at 31st March 2017 2016
USD/LKRAssets and liabilities 149.75 144.06
Income and expenses 146.01 136.18
32.4 Accounting classification and Fair values
The following table shows the carrying amounts and the fair values of financial assets and financial liabilities. It does not include fair value information for financial assets and financial liabilities not measured at fair value, if the carrying value is a reasonable approximation for fair value.
As at 31st March 2017
Fair value through profit or
loss
Held to maturity
Loans and
receivable
Available for sale
Other financial
liabilities
Total carrying amount
Fair value
Financial assets measured at fair value
Available for sale financial assets - - - 13,821,686 - 13,821,686 13,821,686
Fair value through profit or loss financial assets 3,136,896 - - - - 3,136,896 3,136,896
Financial assets not measured at fair value
Trade and other receivables - - 72,905 - - 72,905
Cash and cash equivalents - - 1,455,298 - - 1,455,298
Total financial assets 3,136,896 - 1,528,203 13,821,686 - 18,486,785
Financial liabilities not measured at fair value
Trade and other payables - - - - 131,529 131,529
Bank overdraft - - - - 17,052 17,052
Total financial liabilities - - - - 148,581 148,581

Management Discussion and Analysis
Our Performance Financial InformationGovernance and Risk Management
Supplementary Information
As at 31st March 2016
Fair value through profit or
loss
Held to maturity
Loans and
receivable
Available for sale
Other financial
liabilities
Total carrying amount
Fair value
Financial assets measured at fair value
Available for sale financial assets - - - 15,721,149 - 15,721,149 15,721,149
Fair value through profit or loss financial assets 2,661,626 - - - - 2,661,626 2,661,626
Financial assets not measured at fair value
Trade and other receivables - - 53,774 - - 53,774
Cash and cash equivalents - - 1,061,077 - - 1,061,077
Total financial assets 2,661,626 - 1,114,851 15,721,149 - 19,497,626
Financial liabilities not measured at fair value
Trade and other payables - - - - 181,046 181,046
Bank overdraft - - - - 15,735 15,735
Total financial liabilities - - - - 196,781 196,781
32.5 Fair value hierarchy
The table below analyses financial instruments carried at fair value by the levels in the fair value hierarchy. The different levels have been defined as follows.
Level 1: Availability of quoted prices (unadjusted) in active markets for identical assets or liabilities.
Level 2: Use of inputs other than quoted prices that are observable for the asset or liability, either directly (i.e. as prices) or indirectly (i.e. derived from prices).
Level 3: Use of inputs for the asset or liability that are not based on observable market data (unobservable inputs).

Ceylon Guardian Investment Trust PLC Annual Report 2016/17 116 117
Notes to the Financial StatementsIn Rupees Thousands
As at 31st March 2017 Level 1 Level 2 Level 3 Total
Available for sale financial assets 13,520,750 - 300,936 13,821,686
Fair value through profit or loss financial assets 3,136,896 - - 3,136,896
16,657,646 - 300,936 16,958,582
As at 31st March 2016
Available for sale financial assets 15,568,697 - 152,452 15,721,149
Fair value through profit or loss financial assets 2,661,626 - - 2,661,626
18,230,323 - 152,452 18,382,775
Reconciliation of Level 3 - fair value : Available for sale financial assets
For the year ended 31st March 2017 2016
Opening balance 152,452 133,634
Additions 94,618 10,256
Change in fair value 53,866 11,452
Disposals - (2,890)
Closing balance 300,936 152,452
32.6 Valuation techniques and significant unobservable inputs
The following table shows the valuation techniques used in measuring Level 3 fair values, as well as the significant unobservable inputs used:
Investment in equity securities
Valuation method / techniques
Unobservable inputs
Ranges Inter-relationship between key unobservable Inputs and fair value. The estimated fair value would increase if
Private equity (unlisted) Discounted cash flows :
The valuation model considers the present value of the net cash flows expected to be generated by the entities operations. The expected net cash flows are discounted using a risk-adjusted discount rate.
Revenue CAGR 13% - 25% Increase
Exit multiple: *P/E-Price to earnings ratio (times) *EV/EBIT-Enterprise value to earnings before interest and tax
5-8 Increase
Discount rate 15.5%-20% Decrease

Management Discussion and Analysis
Our Per formance Financial InformationGovernance and Risk Management
Supplementary Information
33. SEGMENTAL REPORTING
The Group’s Chief Operating Decision Maker (CODM) monitors the operating results of the entity as a whole considering the operations as a single segment Investment holding and asset management for the purpose of making decisions about resource allocation and performance. Therefore no disclosure is made on operating segments.
34. EVENTS AFTER THE REPORTING PERIOD After satisfying the solvency tests in accordance with Section 57 of the Company’s Act, No. 7 of 2007, The Directors has recommended the payment of a first and final dividend of Rs.4/- (2016 - Rs.3/-) per Ordinary and Deferred share for the year ended 31st March 2017 amounting to Rs.355,121,420/- (2016 - Rs. 266,341,065/-) which is to be approved at the forthcoming Annual General Meeting. According to Sri Lanka Accounting Standard (LKAS 10) - “Events after the reporting period” the proposed final dividend has not been recognised as a liability as at 31st March 2017.
Subsequent to the reporting period, no circumstances have arisen which would require adjustments to or disclosure in the financial statements, other than the above.
35. COMMITMENTS AND CONTINGENCIES
35.1 CommitmentsA subsidiary company of the Group, Guardian Capital Partners PLC, has committed to invest a sum of Rs. 51,117,791/- in Swiss Institute For Service Industry Development as a private equity investment. As at 31st March 2017, a sum Rs. 42,118,040/- has been invested in two tranches and balance of Rs. 8,999,751/- is to be invested based on business requirements and the progress of the investee Company.
There were no other commitments or contracts for capital expenditure of a material amount as at the reporting date, other than disclosed above.
35.2 ContingenciesThere were no material contingent liabilities as at the reporting date.
36. COMPARATIVE FIGURESPrevious years' figures and phrases have been rearranged wherever necessary to conform to the current year's presentations.
37. RESPONSIBILITY FOR FINANCIAL STATEMENTSThe Board of Directors is responsible for the preparation and presentation of the financial statements. This is more fully described under the relevant clause in the Directors’ report.

Ceylon Guardian Investment Trust PLC Annual Report 2016/17 118 119
Five Year SummaryIn Rupees Thousands
For the year ended / As at 31st March 2017 2016 2015 2014 2013
RevenueDividend income 846,248 695,279 655,161 906,837 471,025 Net gain on disposal of investments 1,157,783 703,744 1,524,049 1,289,020 1,235,698 Interest income 43,815 101,293 200,972 338,405 154,853 Management fee 91,724 103,405 87,205 66,950 43,755
2,139,570 1,603,721 2,467,387 2,601,212 1,905,331 Less: Inter-group transactions (397,272) (427,395) (400,773) (718,844) (262,732)
1,742,298 1,176,326 2,066,614 1,882,368 1,642,599 Fair value adjustment - unrealised (250,032) (306,875) 113,167 943 38,010
Profit on investment activities 1,492,266 869,451 2,179,781 1,883,311 1,680,609
Profit before taxation 1,277,460 642,073 1,983,577 1,721,756 2,321,078 Income tax expense (21,126) (30,873) (64,315) (109,611) (23,579)Profit for the year 1,256,334 611,200 1,919,262 1,612,145 2,297,499 Non controlling interest (227,584) (98,321) (408,461) (315,542) (411,391)
Profit attributable to the equity holders of the parent 1,028,750 512,879 1,510,801 1,296,603 1,886,108 Dividends paid - Cash (266,341) (263,509) (439,182) (219,591) (175,673)
Statement of Financial PositionCapital employedStated capital 1,128,726 1,128,726 953,167 953,167 953,167 Reserves 14,277,023 15,008,570 21,677,677 19,131,142 13,737,523
Total equity attributable to equity holders of the parent 15,405,749 16,137,296 22,630,844 20,084,309 14,690,690 Non controlling interest 3,214,856 3,414,692 4,827,637 4,256,848 3,139,062
Total equity 18,620,605 19,551,988 27,458,481 24,341,157 17,829,752
Assets employedCurrent assets 4,705,645 3,789,904 4,534,389 4,336,515 3,809,140 Current liabilities (171,104) (221,945) (230,478) (217,337) (87,497)Net current assets 4,534,541 3,567,959 4,303,911 4,119,178 3,721,643
Non-current assets 14,096,543 15,993,557 23,164,604 20,229,588 14,113,534 Non-current liabilities (10,479) (9,528) (10,034) (7,609) (5,425)Net assets 18,620,605 19,551,988 27,458,481 24,341,157 17,829,752
Cash Flow StatementsNet cash generated from / (used in) operating activities 698,375 (402,412) (545,677) 358,525 1,634,668 Net cash generated from / (used in) investing activities 220 (2,766) (440) (4,928) (16,448)Net cash used in financing activities (320,548) (339,972) (516,479) (281,708) (221,043)Net increase / (decrease) in cash & cash equivalents 378,047 (745,150) (1,062,596) 71,889 1,397,177

Management Discussion and Analysis
Our Per formance Financial InformationGovernance and Risk Management
Supplementary Information
For the year ended / As at 31st March 2017 2016 2015 2014 2013
Ratios & statisticsOperational ratio Return on ordinary shareholders funds (%) 6.68 3.18 6.68 6.46 12.84Liquidity ratioCurrent ratio (times) 27.50 17.08 19.67 19.95 43.53 Investor ratios Earnings per share (Rs.) 11.59 5.78 17.02 14.76 21.47 Dividend per share (Rs.) * 4.00 3.00 5.00 5.00 2.50 Dividend cover (times) 2.90 1.93 3.40 2.95 8.57 Dividend growth (%) 33 (40) - 100 25 Dividend yield (%) 4.44 2.51 2.72 2.81 1.56 Dividend payout ratio (%) 34.52 51.90 29.38 33.87 11.67 Net assets value per share - (Rs.) 173.53 181.77 257.65 228.66 247.48 Market value per share (Rs.) ** 90.10 119.70 184.00 177.90 160.00 Price earning ratio (times) 7.77 20.71 10.81 12.05 7.47 Price to book value ratio (times) 0.52 0.66 0.71 0.78 0.65
Market capitalisation 7,476,396 9,932,570 15,105,796 14,605,006 13,135,475 Fair value of investments 18,396,828 19,428,117 27,338,751 24,232,993 26,029,738 All Share Price Index (points) 6,062 6,072 6,820 5,968 5,736 S&P SL 20 Index (points) 3,439 3,204 3,852 3,280 3,294
* Based on proposed / interim dividends.** As at 31st March.

Ceylon Guardian Investment Trust PLC Annual Report 2016/17
US$ FinancialsPreparation of US DollarFinancial StatementsThe Financial Statements of the Group are stated in Sri Lankan Rupees. The translation of Sri Lankan Rupee amounts into US Dollar amounts is included solely for the convenience of Shareholders, Investors, Bankers and other users of these Financial Statements. US Dollar Financials do not form part of the auditedFinancial Statements of the Group.

Financial HighlightsIn United State Dollars
For the year ended / As at 31st March 2017 2016 Change%
Revenue 11,803,387 8,459,734 40Profit from operations 8,634,510 4,585,724 88 Share of profit of equity accounted investee net of tax 18,610 34,585 (46)Profit before taxation 8,654,292 4,617,569 87 Profit for the year 8,511,172 4,395,541 94 Other comprehensive expense for the year (12,586,445) (58,516,713) (78)Total comprehensive expense for the year (4,075,273) (54,121,172) (92)
Net cash generated from / (used in) operating activities 4,731,217 (2,894,009) (263)
Total equity attributable to equity holders of the parent 101,360,280 111,530,140 (9)Earnings per share 0.08 0.04 89 Dividend per share * 0.03 0.04 (32)Net assets per share 1.14 1.26 (9)Ceylon Guardian - Fund value ** 121,039,726 134,274,083 (10)
* Based on proposed / interim dividends** Based on fair value of portfolio after adjusting for cash and cash equivalents
Management Discussion and Analysis
Our Per formance Financial InformationGovernance and Risk Management
Supplementary Information

Ceylon Guardian Investment Trust PLC Annual Report 2016/17 122 123
Statement of Profit or Loss and Other Comprehensive IncomeIn United States Dollars
Group
For the year ended 31st March 2017 2016
Revenue 11,803,387 8,459,734 Impairment loss on available for sale financial assets (1,346,968) (684,876)
Net change in fair value of fair value through profit or loss financial assets (346,901) (1,522,064)
Profit on investment activities 10,109,518 6,252,794
Other operating income - 1,424
Administrative and other operating expenses (1,475,008) (1,668,494)
Profit from operations 8,634,510 4,585,724
Net finance income / (expense) 1,172 (2,740)
Profit from operations after net finance income / (expense) 8,635,682 4,582,984
Share of profit of equity accounted investee net of tax 18,610 34,585
Profit before taxation 8,654,292 4,617,569
Income tax expense (143,120) (222,028)
Profit for the year 8,511,172 4,395,541
Other comprehensive income
Items that will never be reclassified to profit or loss
Actuarial gain on employee benefit obligation 10,297 669
Items that are or may be reclassified to profit or loss
Net change in fair value of available for sale financial assets (7,995,935) (54,601,611)
Transfer of realised gains on disposal of available for sale financial assets (4,718,427) (4,172,154)
Share of other comprehensive income of equity accounted investee net of tax 16,970 6,868
Net exchange differences on translation of foreign operations 100,650 249,515
Other comprehensive expense for the year (12,586,445) (58,516,713)
Total comprehensive expense for the year (4,075,273) (54,121,172)
Profit attributable to:
Equity holders of the parent 6,969,379 3,688,450
Non controlling interest 1,541,793 707,091
8,511,172 4,395,541
Total comprehensive income attributable to:
Equity holders of the parent (3,182,786) (44,442,618)
Non controlling interest (892,487) (9,678,554)
(4,075,273) (54,121,172)
Earnings per share 0.08 0.04

Management Discussion and Analysis
Our Per formance Financial InformationGovernance and Risk Management
Supplementary Information
Statement of Financial PositionIn United States Dollars
Group
As at 31st March 2017 2016
ASSETSNon-current assets
Property, plant and equipment 39,549 60,916
Intangible assets 1,525,870 1,602,854
Investment in equity accounted investee 242,970 218,930
Available for sale financial assets 90,938,127 108,654,012
Total non-current assets 92,746,516 110,536,712
Current assets
Trade and other receivables 619,659 384,961
Current tax assets 126,778 79,487
Fair value through profit or loss financial assets 20,638,832 18,395,370
Cash and cash equivalents 9,574,959 7,333,451
Total current assets 30,960,228 26,193,269
Total assets 123,706,744 136,729,981
EQUITY AND LIABILITIES
Equity
Stated capital 8,834,775 8,834,775
Capital reserves 791,135 774,165
Revenue reserves 91,734,370 101,921,200
Total equity attributable to equity holders of the parent 101,360,280 111,530,140
Non controlling interest 21,151,760 23,600,055
Total equity 122,512,040 135,130,195
Non-Current Liabilities
Employee benefits 68,945 65,851
Total non-current liabilities 68,945 65,851
Current liabilities
Trade and other payables 1,013,185 1,409,704
Current tax liabilities 382 15,481
Bank overdraft 112,192 108,750
Total current liabilities 1,125,759 1,533,935
Total liabilities 1,194,704 1,599,786
Total equity and liabilities 123,706,744 136,729,981
Net assets per ordinary/deferred share 1.14 1.26

Ceylon Guardian Investment Trust PLC Annual Report 2016/17 124 125
Five Year SummaryIn United States Dollars
For the year ended / As at 31st March 2017 2016 2015 2014 2013
Statement of incomeRevenueDividend income 5,732,999 5,000,209 4,993,605 6,969,772 3,635,013 Net gain on disposal of investments 7,843,527 5,061,086 11,616,227 9,907,155 9,536,178 Interest income 296,829 728,465 1,531,799 2,600,915 1,195,038 Management fee 621,394 743,653 664,672 514,565 337,668
14,494,749 11,533,413 18,806,303 19,992,407 14,703,897 Less: Inter-group transactions (2,691,362) (3,073,679) (3,054,672) (5,524,895) (2,027,566)
11,803,387 8,459,734 15,751,631 14,467,512 12,676,331 Profit before taxation 8,654,292 4,617,569 15,118,727 13,233,079 17,912,318 Income tax expenses (143,120) (222,028) (490,206) (842,448) (181,965)Profit for the year 8,511,172 4,395,541 14,628,521 12,390,631 17,730,353 Non controlling interest (1,541,793) (707,091) (3,113,270) (2,425,194) (3,174,803)Profit attributable to the equity holders of the parent 6,969,379 3,688,450 11,515,251 9,965,437 14,555,550
Dividends Paid - Cash (1,804,356) (1,895,067) (3,347,424) (1,687,733) (1,355,707)Statement of Financial positionCapital employedStated capital 8,834,775 8,834,775 8,834,775 8,834,775 8,834,775 Reserves 92,525,505 102,695,365 160,913,530 144,797,208 107,248,236 Total equity attributable to equity holders of the parent 101,360,280 111,530,140 169,748,305 153,631,983 116,083,011 Non controlling interest 21,151,760 23,600,055 36,210,898 32,562,135 24,474,749 Total equity 122,512,040 135,130,195 205,959,203 186,194,118 140,557,760
Assets employedCurrent assets 30,960,228 26,193,269 34,011,319 33,171,536 30,028,695 Current liabilities (1,125,759) (1,533,935) (1,728,758) (1,662,487) (689,768)Net current assets 29,834,469 24,659,334 32,282,561 31,509,049 29,338,927 Non-current assets 92,746,516 110,536,712 173,751,905 154,743,273 111,261,600 Non-current liabilities (68,945) (65,851) (75,263) (58,204) (42,767)Net assets 122,512,040 135,130,195 205,959,203 186,194,118 140,557,760
Cash Flow StatementsNet cash generated from / (used in) operating activities 4,731,217 (2,894,009) (4,159,123) 2,755,553 12,615,087 Net cash generated from / (used) in investing activities 1,490 (19,892) (3,354) (37,876) (126,933)Net cash used in financing activities (2,171,587) (2,444,962) (3,936,578) (2,165,153) (1,705,837)Net (decrease) / increase in cash & cash equivalents 2,561,120 (5,358,863) (8,099,055) 552,524 10,782,317

Management Discussion and Analysis
Our Per formance Financial InformationGovernance and Risk Management
Supplementary Information
Notes to the Financial Statements In United States Dollars
1 Basis of conversion
The translation of Sri Lankan Rupee amounts in to US Dollar amounts is solely for the convenience of the shareholders, investors, bankers and other users of these financial statements.
The translation of the financial statements in to US Dollar were effected based on the following exchange rates.
2017 2016
Statement of Profit or Loss and Other Comprehensive Income - Average rate 147.61 139.05
Monetary assets and liabilities - closing rate 151.99 144.69
Non-monetary assets and liabilities - closing rate 151.99 144.69
Ordinary share capital - historical rate
Gains or losses on conversion are accounted for in the revenue reserve
2 Revenue reserve
For the year ended 31st March 2017 2016
Beginning of the year 101,921,200 160,146,233
Net movement during the year (5,044,604) (47,736,275)
96,876,596 112,409,958
Currency fluctuations (5,142,226) (10,488,758)
As at the end of the year 91,734,370 101,921,200

Ceylon Guardian Investment Trust PLC Annual Report 2016/17 126 127
Information to Shareholders and Investors
1. Stock Exchange Listing
Ceylon Guardian Investment Trust PLC is a Public Quoted Company, the Ordinary Shares of which are listed on the main board of the Colombo Stock Exchange.
Stock Exchange code for Ceylon Guardian Investment Trust PLC shares is “GUAR”.
2. Share Valuation
The market price of the Company’s shares as at 31st March 2017 was Rs. 90/10 per share (2016 Rs. 119/70).
3. Ordinary Shareholders
As at 31st March 2017 2016
Number of Shareholders 1,602 1,603
The number of ordinary shares held by non-residents as at 31st March, 2017 was 7,363,211 (2016 – 7,457,020) which amount to 8.87% (2016 – 9%) of the total number of shares in issue.
Frequency Distribution of Shareholdings as at 31st March 2017
Residents Non - Residents Total
Distribution of Shares No. of share-
holders
No. of Shares
% No. of share-
holders
No. of Shares
% No. of share-
holders
No. of Shares
%
1-1,000 1,008 172,597 0.21 13 3,010 0.00 1,021 175,607 0.21
1001-10,000 368 1,168,896 1.41 16 54,992 0.07 384 1,223,888 1.48
10,001-100,000 127 3,809,693 4.59 23 700,794 0.84 150 4,510,487 5.44
100,001-1,000,000 39 11,771,321 14.18 3 512,278 0.62 42 12,283,599 14.80
Above 1,000,000 2 58,693,150 70.73 3 6,092,137 7.34 5 64,785,287 78.07
Grand Total 1,544 75,615,657 91.12 58 7,363,211 8.87 1,602 82,978,868 100
Categorization of Shareholders as at 31st March 2017
Categories of Shareholders No. of Shareholders
No. of Shares
%
Individuals 1,417 12,948,431 15.60
Institutions 185 70,030,437 84.40
Total 1,602 82,978,868 100
Public Shareholding Percentage of ordinary shares held by the public as at 31st March 2017 was 32.70% (2016 – 32.51%) and the number of public
shareholders were 1590 [2016 - 1589].

Management Discussion and Analysis
Our Performance Governance and Risk Management
4. Market performance - ordinary shares
For the year ended 31st March 2017 2016
As at 31 March 90.10 119.70Highest (Rs.) 175.00 200.00Lowest (Rs.) 89.00 118.50Value of shares traded (Rs.) 66,863,191 425,838,749No. of shares traded 522,846 2,353,433Volume of transactions (Nos.) 221 297
5. Market capitalization
Market capitalisation of the Company which is the number of ordinary shares in issue multiplied by the market value of an ordinary share was Rs.7,476,396,006/80- as at 31st March, 2017 (2016 - Rs. 9,932,570,499/60).
6. Record of Bonus Issues, Rights Issues, Repurchase and Subdivision of shares and Scrip Issues. The undermentioned share issues/repurchase have been made by the Company to date, in relation to its ordinary shares.
Year ended Issue Basis No. of Cumulative No. of
1951 - Initial Capital – 757,525 757,525
1990 - Bonus 01:01 757,525 1,515,050
1992 - Bonus 01:08 189,381 1,704,431
1999 - Bonus 01:04 426,108 2,130,539
2000 - Bonus 01:04 532,634 2,663,173
2002 - April Rights 01:07 380,453 3,043,626
- May Bonus 01:04 760,906 3,804,532
2003 - July Rights 01:05 760,906 4,565,438
- August Bonus 01:06 760,906 5,326,344
2004 - July Rights 01:02 2,663,172 7,989,516
2004 - September Bonus 01:03 2,663,172 10,652,688
2005 - March Rights 01:03 3,550,896 14,203,584
- June Bonus 01:03 4,734,528 18,938,112
2009 - October Repurchase 03.20 (2,840,716) 16,097,396
2010 - November Subdivision 05:01 64,389,584 80,486,980
Capitalisation of Reserves 01:50 1,609,739 82,096,719
2015 - August Scrip 01:93 882,149 82,978,868
7. Dividend
The Directors have recommended a first and final dividend of Rs.4/- per Ordinary share and Deferred share for the year ended 31st March 2017 (2016 - Rs.3/-).
8. Number of Employees
The Company had no employees as at the balance sheet date (2016 - Nil). The Group has 20 (2016 - 20) employees as at the balance sheet date.
9. Major shareholders
A list of major shareholders of the Company as at 31st March 2017 is provided in the Annual Report of the Board of Directors, on page 51
Supplementary InformationFinancial Information

Ceylon Guardian Investment Trust PLC Annual Report 2016/17 128 129
Notice of Meeting
NOTICE IS HEREBY GIVEN that the SIXTY FIFTH Annual General Meeting of CEYLON GUARDIAN INVESTMENT TRUST PLC will be held on Wednesday the 26th day of July 2017 at 3.30 p.m. at the Auditorium, The Institute of Chartered Accountants of Sri Lanka, Ground Floor, 30A, Malalasekera Mawatha, Colombo 07, Sri Lanka for the following purposes :
1. To receive and adopt the Annual Report of the Board of Directors and the Financial Statements for the year ended 31st March 2017, together with the Independent Auditors’ Report thereon.
2. To declare a dividend as recommended by the Directors.
3. To re-elect Mr. K. Selvanathan who retires in terms of Articles 89, 90 and 91 of the Articles of Association of the Company.
4. To re-elect Mr. V. M. Fernando who retires in terms of Articles 89, 90 and 91 of the Articles of Association of the Company.
5. To re-elect Mrs. W. Y. R. Fernando as a Director in terms of Articles 88 and 95 of the Articles of Association of the Company.
6. To re-appoint Mr. C.W. Knight as a Director of the Company who is over Seventy years of age and to consider and if deemed fit to pass the following resolution :
“IT IS HEREBY RESOLVED that the age limit stipulated in Section 210 of the Companies Act No.7 of 2007 shall not be applicable to Mr. C.W. Knight who is Seventy Four years of age and that he be re-appointed a Director of the Company from the conclusion of the Annual General Meeting for a further period of one year.”
7. To re-appoint Messrs. KPMG, Chartered Accountants as Auditors of the Company as set out in Section 154 (1) of the Companies Act No. 7 of 2007 and to authorize the Directors to determine their remuneration.
By Order of the Board
(Sgd)K. D. De Silva (Mrs.)Director
CARSONS MANAGEMENT SERVICES (PRIVATE) LIMITEDSecretaries
Colombo, 21st June 2017
Notes :
1. A shareholder is entitled to appoint a proxy to attend and vote instead of him/her. A proxy need not be a shareholder of the Company. A Form of Proxy accompanies this notice.
2. The completed Form of Proxy must be deposited at the Registered Office, No.61, Janadhipathi Mawatha, Colombo 1, not later than 4.45 p.m. on 24th July 2017.
3. A person representing a Corporation is required to carry a certified copy of the resolution authorising him/
her to act as the representative of the Corporation. A representative need not be a member.
4. The transfer books of the Company will remain open.
5. Security Check
We shall be obliged if the shareholders/proxies attending the Annual General Meeting, produce their National Identity Card to the security personnel stationed at the entrance lobby.

Notes
....................................................................................................................................................................................................................................
....................................................................................................................................................................................................................................
....................................................................................................................................................................................................................................
....................................................................................................................................................................................................................................
....................................................................................................................................................................................................................................
....................................................................................................................................................................................................................................
....................................................................................................................................................................................................................................
....................................................................................................................................................................................................................................
....................................................................................................................................................................................................................................
....................................................................................................................................................................................................................................
....................................................................................................................................................................................................................................
....................................................................................................................................................................................................................................
....................................................................................................................................................................................................................................
....................................................................................................................................................................................................................................
....................................................................................................................................................................................................................................
....................................................................................................................................................................................................................................
....................................................................................................................................................................................................................................
....................................................................................................................................................................................................................................
....................................................................................................................................................................................................................................
....................................................................................................................................................................................................................................
....................................................................................................................................................................................................................................
....................................................................................................................................................................................................................................
....................................................................................................................................................................................................................................
....................................................................................................................................................................................................................................
....................................................................................................................................................................................................................................
....................................................................................................................................................................................................................................
....................................................................................................................................................................................................................................
....................................................................................................................................................................................................................................
....................................................................................................................................................................................................................................
....................................................................................................................................................................................................................................
....................................................................................................................................................................................................................................

Ceylon Guardian Investment Trust PLC Annual Report 2016/17 130 131
....................................................................................................................................................................................................................................
....................................................................................................................................................................................................................................
....................................................................................................................................................................................................................................
....................................................................................................................................................................................................................................
....................................................................................................................................................................................................................................
....................................................................................................................................................................................................................................
....................................................................................................................................................................................................................................
....................................................................................................................................................................................................................................
....................................................................................................................................................................................................................................
....................................................................................................................................................................................................................................
....................................................................................................................................................................................................................................
....................................................................................................................................................................................................................................
....................................................................................................................................................................................................................................
....................................................................................................................................................................................................................................
....................................................................................................................................................................................................................................
....................................................................................................................................................................................................................................
....................................................................................................................................................................................................................................
....................................................................................................................................................................................................................................
....................................................................................................................................................................................................................................
....................................................................................................................................................................................................................................
....................................................................................................................................................................................................................................
....................................................................................................................................................................................................................................
....................................................................................................................................................................................................................................
....................................................................................................................................................................................................................................
....................................................................................................................................................................................................................................
....................................................................................................................................................................................................................................
....................................................................................................................................................................................................................................
....................................................................................................................................................................................................................................
....................................................................................................................................................................................................................................
....................................................................................................................................................................................................................................
....................................................................................................................................................................................................................................
Notes

Form of Proxy
*I/ We..........................................................................................................................................................................................................................
of................................................................................................................................................................................................................................
being *a Shareholder / Shareholders of Ceylon Guardian Investment Trust PLC
hereby appoint............................................................................................................................................................................................................
of.................................................................................................................................................................................................................................
bearing NIC No./ Passport No...................................................................................................................................................... or failing him/her
Mirihana Arachchige Rose Chandralatha Cooray or failing her,
Don Chandima Rajakaruna Gunawardena or failing him,
Vernon Manilal Fernando or failing him,
Krishna Selvanathan or failing him,
Christopher William Knight or failing him,
Timothy Chee Ming Chia or failing him,
Wedage Yasanthi Ruvini Fernando
as *my/our proxy to attend the Annual General Meeting of the Company to be held on Wednesday, the 26th day of July 2017 at 3.30 p.m., at the “Auditorium”, The Institute of Chartered Accountants of Sri Lanka, 30A, Malalasekera Mawatha, Colombo 07, Sri Lanka and at any adjournment thereof and at every poll which may be taken in consequence thereof.
For Against
(i) To adopt the Annual Report of the Board of Directors and the Financial Statements for the year ended 31st March 2017, together with the Independent Auditors‘ Report thereon.
(ii) To declare Rs.4/- per Ordinary share and Deferred share as a First & Final dividend for the financial year ended 31st March 2017 as recommended by the Directors.
(iii) To re-elect Mr. K. Selvanathan who retires in terms of Articles 89, 90 and 91 of the Articles of Association of the Company.
(iv) To re-elect Mr. V. M. Fernando who retires in terms of Articles 89, 90 and 91 of the Articles of Association of the Company.
(v) To re-elect Mrs. W. Y. R. Fernando who retires in terms of Articles 88 and 95 of the Articles of Association of the Company.
(vi) To re-appoint Mr. C.W. Knight who is over Seventy years of age as a Director of the
Company.
(vii) To re-appoint Messrs. KPMG, Chartered Accountants as Auditors of the Company as set out in Section 154 (1) of the Companies Act. No. 07 of 2007 and to authorize the Directors to determine their remuneration.
Signed this……………………day of …………………… Two Thousand and Seventeen.
…………………………………. Signature /sNote: (a) *Please delete the inappropriate words.(b) A shareholder entitled to attend and vote at a General meeting of the company, is entitled to appoint a proxy to attend and vote
instead of him/her and the proxy need not be a shareholder of the company. A proxy so appointed shall have the right to vote on a show of hands or on a poll and to speak at the General Meeting of the shareholders.
(c) A shareholder is not entitled to appoint more than one proxy to attend on the same occasion.(d) Instructions are noted on the reverse hereof.

Ceylon Guardian Investment Trust PLC Annual Report 2016/17 132
INSTRUCTIONS AS TO COMPLETION
1. Kindly perfect the form of proxy after filling in legibly your full name and address and sign in the space provided. Please fill in the date of signature.
2. If you wish to appoint a person other than the Directors as your proxy, please insert the relevant details in the space provided overleaf.
3. In terms of Article 71 of the Articles of Association of the Company, the instrument appointing a proxy shall be in writing and :
(i) in the case of an individual shall be signed by the appointor or by his attorney; and
(ii) in the case of a corporation shall be either under its common seal or signed by its attorney or by an officer on behalf of the corporation.
The Company may, but shall not be bound to, require evidence of the authority of any such attorney or officer. A proxy need not be a member of the company.
4. In terms of Article 66 of the Articles of Association of the Company:
In the case of joint-holders of a share, the senior who tenders a vote, whether in person or by proxy or by attorney or by representative, shall be accepted to the exclusion of the votes of the other joint-holders and for this purpose seniority shall be determined by the order in which the names stands in the Register of Members in respect of the joint holding.
5. To be valid the completed Form of Proxy should be deposited at the Registered Office of the Company situated at No. 61, Janadhipathi Mawatha, Colombo 1 not later than 4.45 p.m. on 24th July 2017.
Please fill in the following details
Name :……………………………………………………………………….............................................................………………….
Address :……………………………………………………………………….............................................................………………….
.……………………………………………………………………….............................................................………………….
Jointly with :……………………………………………………………………….............................................................………………….
Share folio no. :……………………………………………………………………….............................................................………………….
Corporate Information
NAME OF THE COMPANYCeylon Guardian Investment Trust PLC (A Carson Cumberbatch Company)
COMPANY REGISTRATION NO PQ 52
DOMICILE AND LEGAL FORM
Ceylon Guardian Investment Trust PLC is a Public Quoted Company with limited liability, domiciled in Sri Lanka.
The Company was incorporated in Sri Lanka in 1951.
PRINCIPAL ACTIVITY AND NATURE OF OPERATIONS During the year, the principal activity of the Company was holding and managing of an investment portfolio.
PARENT COMPANY
In the opinion of the Directors’ Carson Cumberbatch PLC is the Parent Company of Ceylon Guardian Investment Trust PLC and Bukit Darah PLC is the ultimate Parent and Controlling entity of Ceylon Guardian Investment Trust PLC.
DIRECTORS Mrs. M.A.R.C. Cooray (Chairperson)Mr. D.C.R. GunawardenaMr. V.M. Fernando Mr. K. Selvanathan Mr. C.W. KnightMr. T.C.M. ChiaMrs. W. Y. R. Fernando (Appointed w.e.f. 15.8.2016)Mr. I. Paulraj (Resigned w.e.f. 15.8.2016)
NUMBER OF EMPLOYEES
The Company did not have any employees of its own as at the end of the year.
BANKERS Standard Chartered Bank HSBCCommercial Bank of Ceylon PLCDeutsche Bank A.G.DFCC Bank Peoples’ Bank
AUDITORS AuditorsMessrs. KPMG Chartered Accountants,No. 32A, Sir Mohamed Macan Markar Mawatha, Colombo 3.
INVESTMENT MANAGERGuardian Fund Management LimitedNo. 61, Janadhipathi Mawatha,Colombo 1, Sri Lanka.Tele: +94-11-2039200Fax: +94-11-2039385
MANAGERS & SECRETARIES Carsons Management Services (Private) LimitedNo. 61, Janadhipathi Mawatha,Colombo 1.Tele: +94-11-2039200 Fax: +94-11-2039300
REGISTERED OFFICE & PRINCIPAL PLACE OF BUSINESS No. 61, Janadhipathi Mawatha, Colombo 1.Tele: +94-11-2039200 Fax: +94-11-2039300
CORPORATE WEBSITE www.carsoncumberbatch.comThe Company is a member of the Carson Cumberbatch Group of companies
Designed & produced by
Printed by Printage (Pvt) Ltd

www.carsoncumberbatch.com
Ceylon Guardian Investm
ent Trust PLC Annual Report 2016/17
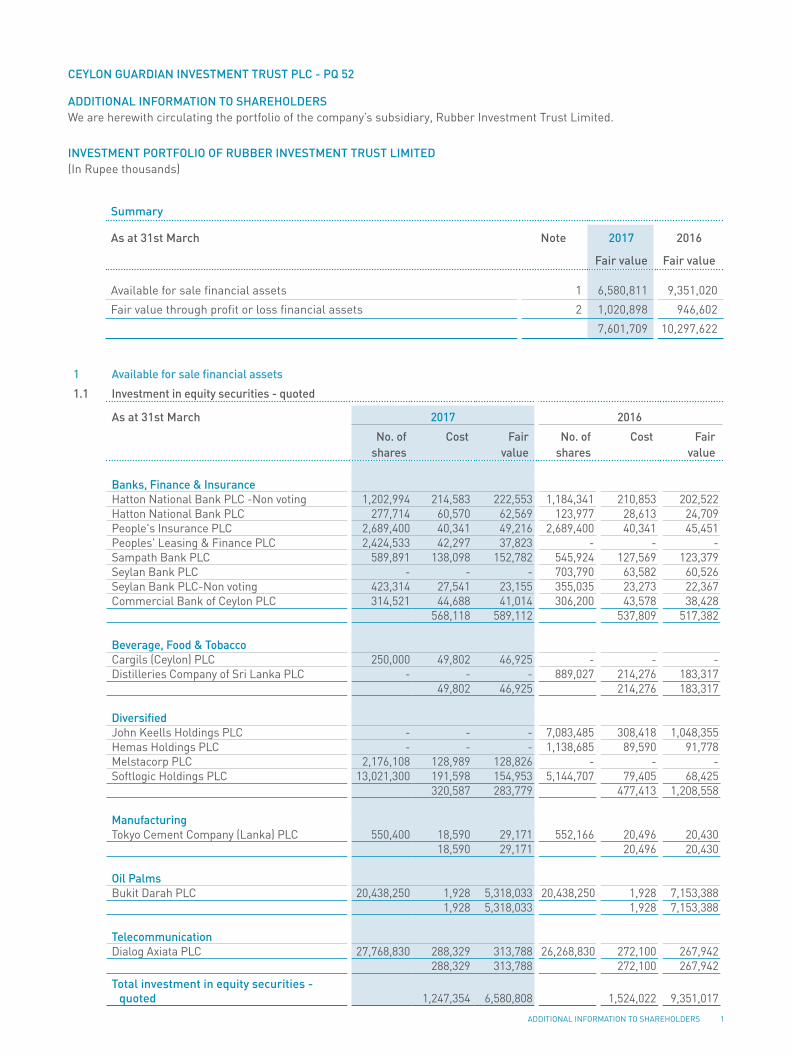
ADDITIONAL INFORMATION TO SHAREHOLDERS 1
CEYLON GUARDIAN INVESTMENT TRUST PLC - PQ 52
ADDITIONAL INFORMATION TO SHAREHOLDERSWe are herewith circulating the portfolio of the company’s subsidiary, Rubber Investment Trust Limited.
INVESTMENT PORTFOLIO OF RUBBER INVESTMENT TRUST LIMITED(In Rupee thousands)
Summary
As at 31st March Note 2017 2016
Fair value Fair value
Available for sale financial assets 1 6,580,811 9,351,020
Fair value through profit or loss financial assets 2 1,020,898 946,602
7,601,709 10,297,622
1 Available for sale financial assets
1.1 Investment in equity securities - quoted
As at 31st March 2017 2016
No. of shares
Cost Fair value
No. of shares
Cost Fair value
Banks, Finance & InsuranceHatton National Bank PLC -Non voting 1,202,994 214,583 222,553 1,184,341 210,853 202,522 Hatton National Bank PLC 277,714 60,570 62,569 123,977 28,613 24,709 People's Insurance PLC 2,689,400 40,341 49,216 2,689,400 40,341 45,451 Peoples' Leasing & Finance PLC 2,424,533 42,297 37,823 - - - Sampath Bank PLC 589,891 138,098 152,782 545,924 127,569 123,379 Seylan Bank PLC - - - 703,790 63,582 60,526 Seylan Bank PLC-Non voting 423,314 27,541 23,155 355,035 23,273 22,367 Commercial Bank of Ceylon PLC 314,521 44,688 41,014 306,200 43,578 38,428
568,118 589,112 537,809 517,382
Beverage, Food & TobaccoCargils (Ceylon) PLC 250,000 49,802 46,925 - - - Distilleries Company of Sri Lanka PLC - - - 889,027 214,276 183,317
49,802 46,925 214,276 183,317
DiversifiedJohn Keells Holdings PLC - - - 7,083,485 308,418 1,048,355 Hemas Holdings PLC - - - 1,138,685 89,590 91,778 Melstacorp PLC 2,176,108 128,989 128,826 - - - Softlogic Holdings PLC 13,021,300 191,598 154,953 5,144,707 79,405 68,425
320,587 283,779 477,413 1,208,558
ManufacturingTokyo Cement Company (Lanka) PLC 550,400 18,590 29,171 552,166 20,496 20,430
18,590 29,171 20,496 20,430
Oil PalmsBukit Darah PLC 20,438,250 1,928 5,318,033 20,438,250 1,928 7,153,388
1,928 5,318,033 1,928 7,153,388
TelecommunicationDialog Axiata PLC 27,768,830 288,329 313,788 26,268,830 272,100 267,942
288,329 313,788 272,100 267,942 Total investment in equity securities -
quoted 1,247,354 6,580,808 1,524,022 9,351,017

2 ADDITIONAL INFORMATION TO SHAREHOLDERS
1.2 Investments in debentures
As at 31st March 2017 2016
No. of debentures
Cost Fair value
No. of debentures
Cost Fair value
Riverina Hotels Limited 56 1 1 56 1 1
Ocean View Limited - 6% 120 1 1 120 1 1
Total investment in debentures 2 2 2 2
1.3 Preference Shares
As at 31st March 2017 2016
No. of shares
Cost Fair value No. of shares
Cost Fair value
Bukit Darah PLC - 8% participative cumulative 31,875 1 1 31,875 1 1
Total investment in Preference Shares 1 1 31,875 1 1
Total investment in available for sale financial assets 1,247,357 6,580,811 1,524,025 9,351,020
INVESTMENT PORTFOLIO OF RUBBER INVESTMENT TRUST LIMITED (Continued)(In Rupee thousands)

ADDITIONAL INFORMATION TO SHAREHOLDERS 3
2 Fair value through profit or loss financial assets
2.1 Investment in equity securities-quoted
As at 31st March 2017 2016
No. of shares
Fair value No. of shares
Fair value
Banks, Finance & InsuranceDFCC Bank PLC 139,699 15,926 139,699 19,139 Hatton National Bank PLC 293,569 66,141 289,620 57,721 National Development Bank PLC 337,189 47,072 - - Peoples' Leasing & Finance PLC 137,500 2,145 - - Seylan Bank PLC 73,790 6,420 370,000 31,820 Seylan Bank PLC - Non voting 198,755 10,872 198,755 12,522 Sinhaputhra Finance PLC - - 100,000 1,670 Union Bank of Colombo PLC 443,345 6,295 1,832,145 30,414
154,871 153,286
Beverage, Food & TobaccoDistilleries Company of Sri Lanka PLC - - 201,278 41,504
- 41,504
Construction & Engineering Access Engineering PLC 1,700,000 40,460 1,700,000 35,360 MTD Walkers PLC 238,013 8,330 428,242 14,260
48,790 49,620
DiversifiedAitken Spence PLC 370,218 20,806 370,218 27,211 Expolanka Holdings PLC 4,373,348 26,240 - - Hemas Holdings PLC - - 604,986 48,762
Hayleys PLC - - 12,457 3,061 Melstacorp PLC 125,112 7,407 - - Softlogic Holdings PLC 2,835,888 33,747 2,656,410 35,330
88,200 114,364
Hotels & TravelsAitken Spence Hotel Holdings PLC 792,093 27,882 792,093 41,981 Serendib Hotels PLC - - 270,067 7,427
27,882 49,408
Land & PropertyOverseas Reality (Ceylon) PLC - - 400,000 9,360
- 9,360
INVESTMENT PORTFOLIO OF RUBBER INVESTMENT TRUST LIMITED (Continued)(In Rupee thousands)

4 ADDITIONAL INFORMATION TO SHAREHOLDERS
As at 31st March 2017 2016
No. of shares
Fair value No. of shares
Fair value
ManufacturingKelani Tyres PLC 267,316 14,702 267,316 17,108 Lanka Tiles PLC - - - - Chevron Lubricants Lanka PLC 354,746 60,307 75,381 22,991 Swisstek (Ceylon) PLC 240,000 15,744 - - Tokyo Cement Company (Lanka) PLC 374,674 22,855 - -
113,608 40,099
TelecommunicationsDialog Axiata PLC 4,400,000 49,720 3,400,000 34,680
49,720 34,680
Total investment in equity securities - quoted 483,071 492,321
2.2 Investments in unit trusts - unquoted
As at 31st March 2017 2016
No of units Fair value No of units Fair value
Guardian Acuity Money Market Fund 21,308,180 300,371 26,205,435 332,809
Guardian Acuity Money Market GILT Fund 2,037,642 237,456 1,140,906 121,472
Total investment in unit trusts - unquoted 537,827 454,281
Total investment in equity securities - quoted 1,020,898 946,602
INVESTMENT PORTFOLIO OF RUBBER INVESTMENT TRUST LIMITED (Continued)(In Rupee thousands)