Embed Size (px)
Citation preview

20 21
inve
stm
ent
• a
llo
cati
on
inve
stm
ent
• a
llo
cati
on
• m
ay 2
016
• IS
SUE
06
• m
ay 2
016
• IS
SUE
06
Banque Pâris Bertrand sturdza Analyst JeAn-eudes Clot
valuation disPersion and value vs growth Source: Banque Pâris Bertrand Sturdza CaPturing valuethe question for investors is how to assess the potential of value to continue outperforming.
the theme should work well because the dispersion of valuation ratios, the gap between the most expensive and cheapest companies, is near record highs.
low dispersion would be a sign of a complacent market not distinguishing between good companies and bad ones. the wide dispersion prevailing today means instead that the market has tended to overreact to bad news, creating a deep discount on companies with real potential for fundamental improvement.
this is particularly the case in the us where uncertainty around Fed policy and the strong appreciation of the dollar have created increased investor wariness towards the most exposed companies.
If value has real potential, it is necessary to consider the best way to implement it.
A value portfolio is supposed to select equities based on the discount between market value and intrinsic value. this is in contrast to growth investing, which focuses on profit growth potential.
the main difficulty is to define the intrinsic value below which an investment becomes attractive. As this measure is not directly observable, value investors prefer to focus on the concept of margin of safety; this means the higher the discount from the intrinsic value estimated by the investor, the higher the probability of making a profit.
lessons from historythis approach based on the margin of safety, of which Warren Buffett is today the most famous supporter, was actually introduced by Benjamin Graham as early as 1934, and puts price monitoring and fundamental analysis on an equal footing.
during the 1980s, value managers ended up relinquishing this fundamental principle, as they relied on style indices whose replication is straightforward but limited to screening price multiples against accounting measures (book value or earnings).
In doing so the asset management industry focused on low prices, relegating the fundamental analysis to crude accounting measures. these indices also influenced the
Russell 3000 Growth / Russell 3000 Value
PER
FOR
MAN
CE %
JAN 99 JAN 01 JAN 03 JAN 05 JAN 07 JAN 09 JAN 11 JAN 13 FEB 16
P/B Dispersion
50
100
150
200
perception of value, with the vast majority of investors now considering it a risky strategy focused on declining companies.
this echoes the academic debate between those who see the outperformance of value indices as market inefficiency and those who consider that it is only a reflection of a risk premium.
the magiC formulaHow can we reconcile the ‘pure’ but apparently subjective margin of safety principle with the ease of implementation of value indices?
solutions can be found in the academic work of Joseph Piotroski or in the methods of investors such as Joel Greenblatt. their approaches are based on the use of public accounting figures and are therefore easy to implement.
But compared with the naive index methodology based
value investing with the ‘magiC formula’
the first quarter of 2016 was largely a repeat of 2015. the risks that appeared during the summer – Fed policy, Chinese growth, oil crash, currency war – intensified in January. this resulted in a significant correction, with the MsCI World Index falling 11% between 1 January and 11 February.
Recent central bank action has allowed the major indices to recover their losses, but the impact on market themes seems to be long lasting, the best illustration being the comeback of value investing after years of disappointing performance.
Between the beginning of the decade and the end of 2015, the Russell 3000 Value Index underperformed the overall us market by 12.1%. 2015 was the worst year of the decade with -4.6% relative performance, but the trend reversed in 2016 with a 1.4% outperformance for the value index as of 18 March.
this rebound of value is part of a broader sector and country rotation that has seen outperformance from the majority of themes that underperformed in 2015, such as emerging markets and oil companies versus healthcare companies.
PerformanCe of Joël greenBlatt’s ‘magiC formula’
Magic Formula
PER
FOR
MAN
CE %
DEC 96 DEC 98 DEC 00 DEC 02 DEC 04 DEC 06 DEC 08 DEC 10 DEC 12 DEC 14 MAR 16
Russell 3000 Value Russell 3000
0
400
800
1,200
200
600
1,000
Source: Banque Pâris Bertrand sturdza
After a protracted period of underperformance, value investing is set for a comeback, argue Banque Pâris Bertrand sturdza’s emmanuel Ferry and Jean-eudes Clot. Could a simple two-step formula really provide consistent outperformance?
Banque Pâris Bertrand sturdzaCIo eMMAnuel FeRRy£€
₣
¥ €
£
22
inve
stm
ent
• a
llo
cati
on
• m
ay 2
016
• IS
SUE
06
the looming prospect of a recession and the uncertainty over how far oil prices will plummet have prompted investors to take a long hard look at their financials exposure. However, the sector offers long-term gains based on the following three reasons.
1. Cheap hunting groundIn the wake of a sell-off at the start of the year, banks are trading at very low price/book values and figures haven’t stooped so low since the sovereign debt crisis.
When valuations are so distressed, he believes that select european banks can be a source of outsized investment returns in the coming years
2. Capital is kingdespite recent volatility, financials fundamentals have strengthened on the back of post-crisis regulation. With leverage limits and a doubling of the requirements for capital ratio in some countries since the last crash, there is more protection for banks.
Given that banks have lurched from crisis to crisis in recent years, investors’ fears are understandable. But, at the same time, Ali says many banks have raised capital, materially improved liquidity positions, cut costs, deleveraged and streamlined operations, resulting in a european financial sector that is much healthier today
3. Profit gainsAs limited monetary policy expansion seems set for this year and inflation is sluggishly creeping up, it would appear investors have everything to gain. With a hike in interest rates predicted to shortly follow, Ali believes profitability for european banks should normalise. When this happens, european banks will be very well positioned, because they will be able to price deposits and loans more profitably.
He thinks several european banks are attractively valued, have the ability to pay dividends and have very strong capital requirements, as well as operating in geographies where fundamentals and market structure are very attractive. these include lloyds in the uK, danske Bank in denmark, KBC in Belgium, InG in the netherlands an Intesa sanpaolo in Italy.
solely on valuation multiples, they add measures of profitability or default risk, resulting in a portfolio whose companies have a minimum level of financial strength, which reconciles the systematic approach with the founding principle of margin of safety.
the ‘magic formula’ developed by Joel Greenblatt is particularly attractive because of its simplicity. It use two factors:
eV/eBIt multiple, which measures the total value of the company’s equity and net debt compared with operating income.
Return on invested capital, which yields operating income to the entire invested capital (sum of long-term assets and working capital).
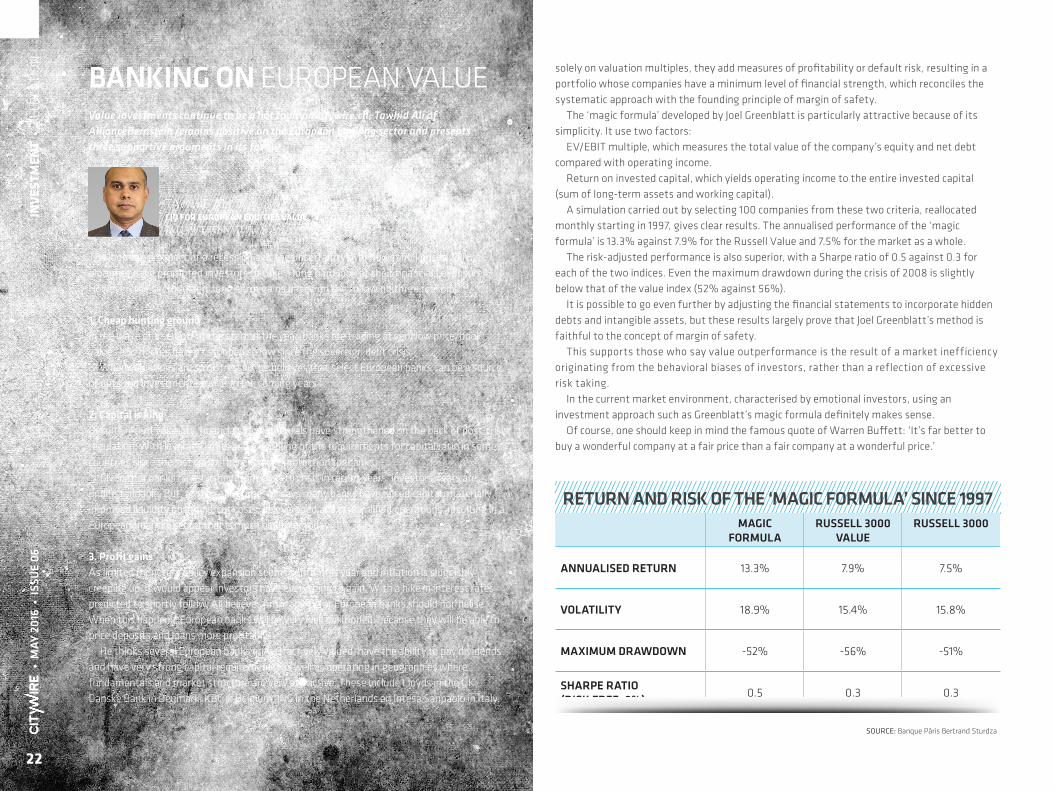
A simulation carried out by selecting 100 companies from these two criteria, reallocated monthly starting in 1997, gives clear results. the annualised performance of the ‘magic formula’ is 13.3% against 7.9% for the Russell Value and 7.5% for the market as a whole.
the risk-adjusted performance is also superior, with a sharpe ratio of 0.5 against 0.3 for each of the two indices. even the maximum drawdown during the crisis of 2008 is slightly below that of the value index (52% against 56%).
It is possible to go even further by adjusting the financial statements to incorporate hidden debts and intangible assets, but these results largely prove that Joel Greenblatt’s method is faithful to the concept of margin of safety.
this supports those who say value outperformance is the result of a market inefficiency originating from the behavioral biases of investors, rather than a reflection of excessive risk taking.
In the current market environment, characterised by emotional investors, using an investment approach such as Greenblatt’s magic formula definitely makes sense.
of course, one should keep in mind the famous quote of Warren Buffett: ‘It’s far better to buy a wonderful company at a fair price than a fair company at a wonderful price.’
AllIAnCeBeRnsteIn CIO fOr EurOpEan EquItIEs valuE
tAWHId AlI
Value investments continue to be a hot topic on citywire.ch. Tawhid Ali of AllianceBernstein remains positive on the European banking sector and presents three supportive arguments in its favour.
Banking on euRoPeAn VAlue
return and risk of the ‘magiC formula’ sinCe 1997magiC
formularussell 3000
valuerussell 3000
annualised return 13.3% 7.9% 7.5%
volatility 18.9% 15.4% 15.8%
maximum drawdown -52% -56% -51%
sharPe ratio (risk free=3%) 0.5 0.3 0.3
Source: Banque Pâris Bertrand sturdza
22
InvE
stm
Ent
• A
llo
CAtI
on
• m
ay 2
016
• is
sue
06