Embed Size (px)
Citation preview
53
Andreas Wibowo | Value for Money Assessment for Government and Business Entity Cooperation Projects by Using the Availability Payment Model: | 53 - 65 Proposition Methodology
This paper proposes a quantitative methodology for ex-ante value-for-money (VfM) assessment to select the best modality option between conventional procurement and public-private partnership under the availability payment model for infrastructure provision within the Indonesian context. The proposed methodology incorporates efficient risk allocation principles into assessment to monetize risk retained by the government and risk transferred to the pri-vate sponsor. A simple numerical example under different scenarios of risk allocation for a road maintenance pro-ject case is presented to demonstrate its applicability. This paper also identifies some relevant issues, acknowledges limitations of the proposed methodology, and recommends directions for future research efforts.
Keywords: public-private partnership, availability payment, value for money, risk allocation, risk mitigation curve, assessment
Tulisan ini menyampaikan proposisi alternatif metodologi asesmen ex-ante value for money (VfM) secara kuantitatif untuk menentukan opsi modalitas terbaik antara pengadaan konvensional dan kerja sama pemerintah dan badan usaha yang menggunakan model pembayaran atas ketersediaan layanan untuk penyediaan infrastruktur untuk konteks Indonesia. Metodologi ini mengaitkan secara langsung prinsip-prinsip alokasi risiko yang efisien dan asesmen VfM untuk memonitisasi risiko yang ditanggung pemerintah dan risiko yang ditransfer kepada badan usaha. Satu contoh numerik sederhana dengan beberapa skenario alokasi risiko pada kasus proyek pemeliharaan jalan dipresentasikan untuk mendemonstrasikan aplikabilitas metodologi tersebut. Tulisan ini juga mengidentifikasi beberapa isu yang relevan, mengenalkan keterbatasan-keterbatasan dari metodologi yang ditawarkan, dan merekomendasikan arah bagi penelitian ke depannya untuk perbaikan metodologi.
Kata Kunci: kerja sama pemerintah dan badan usaha, pembayaran atas ketersediaan layanan, value for money, alokasi risiko, kurva mitigasi risiko, asesmen
Copyright © 2019, Journal of Infrastructure Policy and Management
Corresponding author:[email protected]
Andreas Wibowo
Research and Development Agency of the Ministry of Public Works and Housing of Republic of Indonesia, Jalan Panyawungan,Cileunyi Wetan, Bandung
ABSTRACT
SARI PATI
Value for Money Assessment for Government and Business Entity Cooperation Projects by Using the Availability Payment Model:Proposition Methodology
ISSN: 2599-1086 | e-ISSN: 2656-1778 | Vol. 2 | No. 1

54
Journal of Infrastructure Policy and Management | Vol. 2 No. 01 (2019)
INTRODUCTION
In Presidential Regulation (Perpres) No. 38 of
2015 concerning Public-Private Partnership
(PPP) in the Provision of Infrastructure
mentioned that there are two models of
investment returns for implementing business
entities, namely payment by users in the form
of tariffs and payment for availability of services
(availability payment; AP). In the AP model,
payments will be made by the Contracting
Agency (PJPK) if the infrastructure is ready to
operate and the service indicators as stipulated
in the cooperation agreement have been fulfilled.
As its features, the AP model is suitable to be
applied to wholesale infrastructure projects or
single-buyer models (Laszlo, 2000) while the
rate-based model is appropriate for retail in-
frastructure projects in which business entities
transact directly with their users (read, for ex-
ample, Wibowo (2013)). The AP model can also
be used as an alternative for financing infrastruc-
ture projects that do not generate income (non-
revenue projects) or whose financial feasibility
is far below the desired level; included in this
class are social infrastructure projects (e.g., ur-
ban facilities, educational facilities, sports facili-
ties and infrastructure, tourism).
One of the fundamental differences between
the rate model and the AP model lies in the
allocation of demand or usage risk, in which
the rate model places a business entity as the
party that must bear the risk even though the
risk can be mitigated by providing guarantees
on demand or implementation risk, for example,
shadow toll (shadow toll; Yescombe (2007)) for
toll road infrastructure projects. Neither the
government guarantee of demand risk nor the
shadow toll never been practiced in Indonesia.
However, this does not mean that the AP model
provides risk immunization to business entities.
In some contexts, investment risk that must be
borne by business entities is even higher in this
model than the rate model.
Apart from the investment return model in
accordance with Presidential Regulation
(Perpres) No. 38 of 2015, every PPP project must
meet the principles of partnership, expediency,
competition, risk control and management,
effectively, and efficiently. In addition to closing
the financial gap between funding needs and the
ability of the Government through the State or
Local Budget, PPP projects must also be ensured
to offer value for money (VfM) compared to
conventional projects and this is a general
reference in any country that uses PPP to meet
their infrastructure financing needs (Basheka,
Oluka, & Mugurusi, 2012; De Marco & Mangano,
2013; Eadie, Millar, & Toner, 2013; Grimsey &
Lewis, 2005; Henjewele, Sun, & Fewings, 2014;
Pantelias & Zhang, 2010; Sobhiyah, Bemanian
, & Kashtiban, 2009). There is an expectation
that the involvement of business entities in the
provision of infrastructure can increase VfM (de
la Cruz, del Caño, & de la Cruz, 2008).
Per Perpres 38 of 2015, the provision on VfM
analysis is one of the prerequisites for the identi-
fication of collaborative infrastructure projects.
Indonesia’s National Government Internal Audi-
tor was also discussing VfM audit needs for PPP
projects. An audit is needed to ensure that each
PPP project benefits the government, both the
central and regional governments as PJPK, as
measured through its VfM
The central issue is that although every
government agency with an interest in the
PPP project states that the VfM assessment
is important to do, so far there is no standard
methodology or at least a standard framework
on how VfM is assessed. Academic studies (e.g.,
Pangeran & Wirahadikusumah (2010); Wibowo
(2007)) that have been carried out are still very
limited and have not answered thoroughly the
existing issues.
To fill the knowledge gap above, this paper
offers a basic methodology for calculating
55
Andreas Wibowo | Value for Money Assessment for Government and Business Entity Cooperation Projects by Using the Availability Payment Model: | 53 - 65 Proposition Methodology
risk-based VfM for PPP projects conducted
using the AP model. Although it is still under
development and has a number of limitations,
the methodology offered is operational, as
demonstrated in the case calculation examples
presented in other parts of this paper.
VALUE FOR MONEY:
DEFINISION AND APPROACH
An understanding of VfM is not universal (Eadie
et al., 2013) which allows each organization to
have its own definition. The definition of VfM
issued (HM Treasury, 2006) is globally accepted
as a reference - not the exception of Indonesia -
which states VfM as ”the optimum combination
of costs over the life cycle and quality to meet
user requirements.” Therefore, VfM does not
mean an option that has the lowest initial cost
which must be chosen (Mahdi & Alreshaid,
2005).
Indonesian Ministry of National Development
Planning also uses this definition and then
adds VfM as ”a method for assessing public
acceptance of the maximum benefits of goods or
services obtained with the resources available in
providing public services (Indonesian Ministry
of National Development Planning, n.d.).”.
Methodology
Value for money is very contextual (Daube,
Vollrath, & Alfen, 2008) and VfM assessment is
not an exact science (Pitt, Collins, & Walls, 2006)
so that operations can differ between one and
another organization. In general, there are two
approaches used for VfM assessments, namely
qualitative and quantitative, which in the case
are complementary. A qualitative approach is
usually used as an initial stage of assessment to
determine whether an infrastructure project can
be PPPs while a quantitative approach is taken to
ascertain how much VfM is offered if the project
is made by PPP and decide whether the project
continues to be carried out using a PPP scheme.
However, in many cases, governments often
emphasize the importance of qualitative VfM
factors but in reality put forward quantitative
aspects for their evaluation (Grimsey & Lewis,
2005).
The Indonesia Infrastructure Guarantee Fund
Institute (2016) initiated the preparation of a
qualitative VfM assessment methodology by
considering three criteria, namely achievability,
viability, and desirability, each of which has sub-
criteria and sub-criteria. The determination of
VfM scores on three modality options (i.e., State
Budget, government assignments to SOEs, and
PPP) is based on analytic hierarchy process
(Saaty, 1987). The methodology developed is
then outlined in software that allows users to
only enter input data in the form of pairwise
comparisons (pairwise comparisons) and obtain
the results directly.
Public Sector Comparator
The public sector comparator (PSC) developed in
the UK for their project finance initiative (PFI)
is often used as a reference for quantitative VfM
assessments, both on a practical and academic
level (Bing, Akintoye, Edwards, & Hardcastle,
2005; Grimsey & Lewis, 2005; Jong, Rui, Stead,
Yongchi, & Bao, 2010; Rebeiz, 2012; Yongjian,
Xinping, & Shouqing, 2008; Zhang & S., 2012). In
principle, for a net cost project, the cost present
value of a prospective business entity must be
lower than the PSC for an infrastructure project
that can be PPP and for the net revenue project
(read, Gray, Hall, & Pollard (2010)) applies the
opposite.
There are four PSC elements, namely raw cost,
transferred risks, retained risks, and competitive
neutrality. In general, PSC is calculated as:
PSC = Raw PSC + Competitive Neutrality +
Transferred Risk + Retained Risk (1)
with raw cost = all capital and operating costs
incurred to produce output in accordance with
56
Journal of Infrastructure Policy and Management | Vol. 2 No. 01 (2019)
specifications for a certain period of time in
accordance with the cooperation agreement,
competitive neutrality = profit that is only
owned by the government (and not owned by a
business entity) arising from public ownership,
transferred risk = value of risk transferred from
the government to business entities, retained
risk = value of risk borne by the government.
Details of the PSC calculation can be read in
(Infrastructure Australia, 2008).
PSC is not the only approach used to determine
VfM. Some countries that do not use - or at least
formally do not use - PSC use another approach
to determine VfM. In Germany, for example,
quantitative VfM calculations are based on full
economic analysis of each feasible option whose
process is very detailed and complex (Grimsey &
Lewis, 2005). In the United States, on some VfM
social infrastructure projects, the tender process
is determined by including the provision that the
service costs offered by business entities must
be 5-20% lower than the usual costs incurred by
the government (Schneider, 1999).
Discussions about the PSC have been carried
out both from a technical perspective (eg, Eadie
et al. (2013); Prince & Wirahadikusumah (2010);
Quiggin (2004); Wibowo (2007)) and possible
applications in developing countries (Ballingall,
2013). Despite weaknesses and criticisms, the
PSC is considered a compromise methodology
on the spectrum of very complex methodologies
(e.g., Germany) and very simple (e.g., France;
Grimsey & Lewis, 2005).
Risk Management
Risk is the core of the PPP (Public-Private
Infrastructure Advisory Facility, 2009). In PSC,
efficient risk allocation is one of the vital factors
that determine VfM (Daube et al., 2008; Jin &
Doloi, 2008; Liu & Wilkinson, 2014; Raisbeck,
Duffield, & Xu, 2010). Efficient risk allocation
will occur if a risk is handed over to the party
who is most able to control the risk, has wider
risk mitigation access, or bears the risk at the
lowest cost. While the government is not in the
best position to assume all risks, the hypothesis
that can be built is that VfM should increase
if some of the risk is transferred to business
entities on condition that they have better
mitigation capabilities; in addition, VfM will not
be achieved by holding a PPP.
In the academic field, risk management
including risk allocation between government
and business entities has been widely carried
out (Chan, Yeung, Yu, Wang, & Ke, 2010;
Chan, Yeung, Yu, Wang, & Ke, 2011; Heravi &
Hajihosseini, 2012; Jin, 2010; Wang, 2011). For
the Indonesian context, studies on PPP risk
allocation are relatively limited (eg, Personal
& Prince (2007); Santoso, Joewono, Wibowo,
Sinaga, & Santosa (2012); Wibowo & Mohamed
(2010)) and leave plenty of room for future
research. In addition to the risk assessment
method, risk allocation is still an interesting
area of research because there are some risks
that still cannot be clearly determined who is
the most appropriate to bear them because both
the government and business entities do not
have full control over these risks.
PROPOSITION OF ASSESSMENT
METHODOLOGY
There are two practical issues related to
VfM assessment in Indonesia. First, decision
makers from the Ministry of Finance, technical
ministries, or other government institutions
often need preliminary VfM information for
decision making whether an infrastructure
project can be approved to be held by PPP. What
is suspected by (Grimsey & Lewis, 2005) also
applies to Indonesia. As understood, the PSC
presents the amount of costs during the project
life cycle but to find out VfM, the PSC needs to
be juxtaposed with the bid price (in present
value) proposed by prospective business entities
because by definition VfM is the difference
between the PSC and the bid price.
57
Andreas Wibowo | Value for Money Assessment for Government and Business Entity Cooperation Projects by Using the Availability Payment Model: | 53 - 65 Proposition Methodology
Second, the PSC concept that has been known all
this time is very dependent on the quantification
of risks which incidentally is a function of the
probability and impact of the costs and / or
time incurred if a risk actually occurs during
the period of the cooperation agreement. From
the perspective of probability theory, risk can
be modeled as a random variable that follows
a certain density function. Historical data is
needed to estimate the appropriate function
and its parameters (i.e., shape and location
parameters). In fact in Indonesia, the availability
of data remains one of the biggest challenges in
risk modeling. The optimal solution is to utilize
tacit knowledge owned by expert practitioners
and academics that are knowledgeable and
experienced in certain infrastructure sectors.
This expert judgment will be applied to the
input needed in the methodology offered.
Basic Assumptions
Several methodologies have been developed
to assess VfM. But the basic weakness that
is commonly found is the lack of clarity in
the application of the concept of efficient
risk allocation in the financial model. The
methodology offered in this paper introduces
two new concepts, namely the ability to
mitigate risks and the costs of residual risk.
The assumption used is the higher the ability to
mitigate risk by a party, the lower the residual
risk costs that must be borne by that party. With
this assumption, ceteris paribus, an efficient risk
allocation will produce the highest VfM.
Calculation Formulation
Assume vector s = (s1, j , s2, j ..., si–1, j si, j) is the
ability to mitigate the risk of party j (j ∈1,2) for
risk i (i ∈ 1,2, ..., m) where m = the number of
risks evaluated. As mentioned earlier, there is
no historical data that can be used to assess
this mitigation capability and therefore expert
judgment is needed. In this paper, the ability
to mitigate this is ordinally stated in a Likert
Scale of 0–5 (0 = very ineffective, 5 = very
effective) so that si, j ∈ (0,1,2,3,4,5). This scale
is not absolutely used and can be replaced with
another ordinal scale.
Furthermore, vector w = (w1, j , w2, j ..., wi–1, j wi, j)
is the proportion of risk allocation i borne
by party j with 0 ≤ wi, j ≤ 1, ∀i=1,2,⋯,m,j = 1,2
which is j = 1 for the government and j = 2 for
the business entity and the following simple
relationship applies:
wi, j =1 = 1 - w i,j=2 (2)
If ƒ(si, j ) is a function that describes the risk cost
reduction i which is adjusted to the effectiveness
of party j’s mitigation of risk i, then:
C1i,j,k = wi, j [1–ƒ(si, j )] C
0i,k ∀ i,j,k (3)
where C0i,k = expectation of risk cost i that
occurs in the k-year year and C1i,k is the residual
risk cost borne by party j for risk i in the k-th
year and
C0i,j,k = pi,k ci,k (4)
where pi,k = probability of risk i occurring in the
k-year and ci,k = risk costs arising from risk i
occurring in the k-year. Equation (3) is the
simplest discrete equation for modeling risk.
Theoretically,
0 ≤ ƒ (si, j) ≤ 1 (5)
In ideal and extreme conditions relations can
occur as follows:
ƒ (si, j| si, j = 1) = 0; ƒ (si, j| si, j = 5) = 1 (6)
which explains that if mitigation cannot be
carried out effectively by party j, the risk costs
are still the same as the costs of the non-mitigated
risk. Conversely, if the risk mitigation by j can
be perfectly effective, the risk costs that arise
58
Journal of Infrastructure Policy and Management | Vol. 2 No. 01 (2019)
can be eliminated. Costs over the life cycle to be
borne by the government if an infrastructure
project is to be funded by purely conventional
procurement (i.e. State or Local Budget) can be
calculated as follows:
C1j=1=∑n
k=0
Rj=1,k
(1+r)k
+ ∑nk=0 ∑
mi=1
[1 – ƒ (si, j=1)] c0i,j=1,k
(1+r)k
+ ∑nk=0
Nk
(1+r)k (7)
where C1j=1 = total costs incurred by the
government if the procurement of infrastructure
projects uses pure state or local budget, n =
duration of cooperation agreement, r = selected
discount rate, Rj=1,k = raw cost (or raw cash flows,
depending on whether the net cost project or
net revenue project, or a combination) must be
borne by the government in the k-year year, Nk=
competitive neutrality in the k-year.
If the infrastructure project is to be held by
PPP, from a government perspective, the costs
incurred during the cooperation agreement will
be:
C2j=1=∑n
k=0
Ak
(1+r)k
+ ∑nk=0 ∑
mi=1
wi, j =1 [1 – ƒ (si, j=1)] c0i,j=1,k
(1+r)k
+ ∑nk=0
Nk
(1+r)k(8)
C2j=1 = total costs borne by the government if the
project by PPP, Ak = payment of the availability
of services from the government to business
entities in the k-year. The second term from
Equation (8) reflects the risk costs that must
be borne by the government (retained risks).
From the perspective of a business entity, the
costs incurred C3j=2 are the sum of the raw costs
(or raw cash flows) that must be borne and
the risk costs transferred by the government
(transferred risks):
C3j=2=∑n
k=0
Rj=2,k
(1+r)k
+ ∑nk=0 ∑
mi=1
wi, j =2 [1 – ƒ (si, j=2)] c0i,j=2,k
(1+r)k (9)
If payments are made constant (unitary
payment) every year, then:
Ak =rc3
j=2
1– (1+r)-n (10)
Thus, the resulting VfM is the difference
between Equation (7) and Equation (8):
V = C1j=1 – C2
j=1 (12)
If V > 0, the PPP is a more feasible option,
otherwise the state or local is pure. Pairing
Equations (7) and (8) can determine the
maximum payment amount for availability,
namely:
A* = ∑nk=0 ∑
mi=1
wi, j =1 [1 – ƒ (si, j=1)] c0i,j=1,k
(1+r)k
– ∑nk=0 – ∑n
k=0 ∑mi=1
Rj=1,k
(1+r)k
[1 – ƒ (si, j=1)] c0i,j=1,k
(1+r)k
(13)
where A* = payment of maximum service
availability (current value). Furthermore, if
the raw cost reflects best practice - the same
assumptions are also used in the calculation of
the PSC so the risk must be excluded - then the
following relationship will occur:
Rj=1,k = Rj=2,k (14)
so the value of the risk transferred from the
government to the business entity is the
59
Andreas Wibowo | Value for Money Assessment for Government and Business Entity Cooperation Projects by Using the Availability Payment Model: | 53 - 65 Proposition Methodology
difference between payment of availability and
raw cost (all in present value).
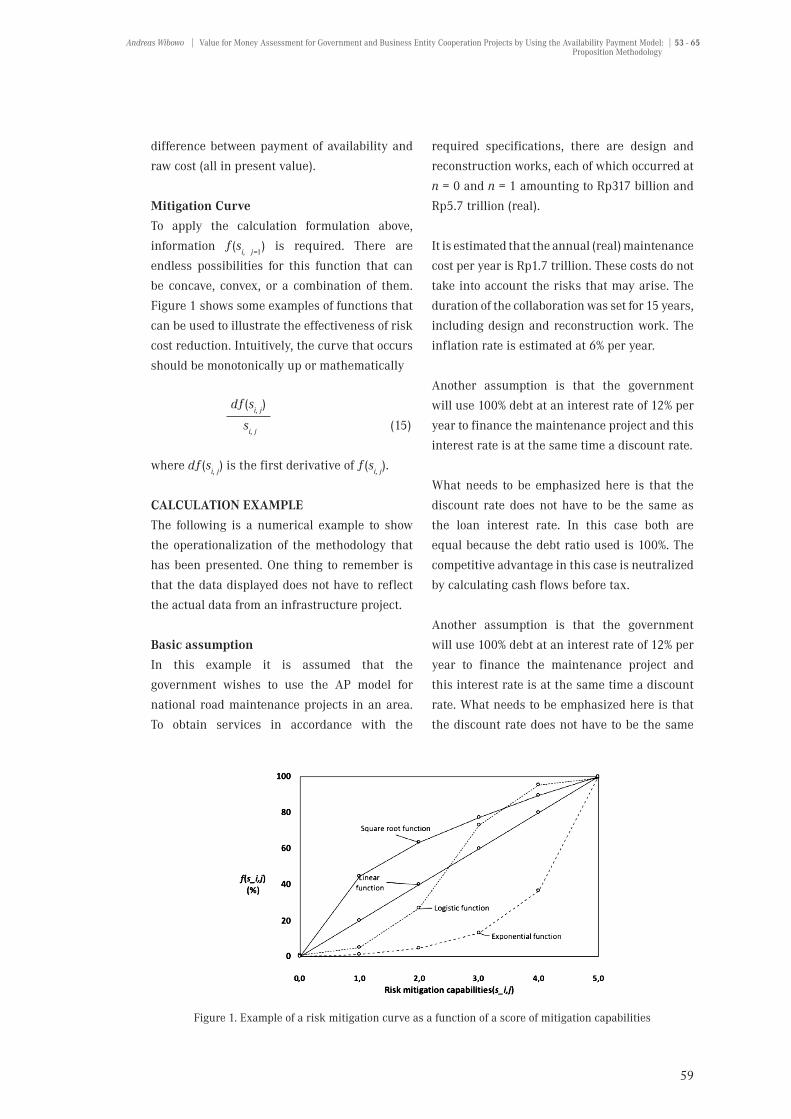
Mitigation Curve
To apply the calculation formulation above,
information ƒ(si, j=1) is required. There are
endless possibilities for this function that can
be concave, convex, or a combination of them.
Figure 1 shows some examples of functions that
can be used to illustrate the effectiveness of risk
cost reduction. Intuitively, the curve that occurs
should be monotonically up or mathematically
dƒ(si, j)
si, j (15)
where dƒ(si, j) is the first derivative of ƒ(si, j).
CALCULATION EXAMPLE
The following is a numerical example to show
the operationalization of the methodology that
has been presented. One thing to remember is
that the data displayed does not have to reflect
the actual data from an infrastructure project.
Basic assumption
In this example it is assumed that the
government wishes to use the AP model for
national road maintenance projects in an area.
To obtain services in accordance with the
required specifications, there are design and
reconstruction works, each of which occurred at
n = 0 and n = 1 amounting to Rp317 billion and
Rp5.7 trillion (real).
It is estimated that the annual (real) maintenance
cost per year is Rp1.7 trillion. These costs do not
take into account the risks that may arise. The
duration of the collaboration was set for 15 years,
including design and reconstruction work. The
inflation rate is estimated at 6% per year.
Another assumption is that the government
will use 100% debt at an interest rate of 12% per
year to finance the maintenance project and this
interest rate is at the same time a discount rate.
What needs to be emphasized here is that the
discount rate does not have to be the same as
the loan interest rate. In this case both are
equal because the debt ratio used is 100%. The
competitive advantage in this case is neutralized
by calculating cash flows before tax.
Another assumption is that the government
will use 100% debt at an interest rate of 12% per
year to finance the maintenance project and
this interest rate is at the same time a discount
rate. What needs to be emphasized here is that
the discount rate does not have to be the same
Figure 1. Example of a risk mitigation curve as a function of a score of mitigation capabilities
60
Journal of Infrastructure Policy and Management | Vol. 2 No. 01 (2019)
as the loan interest rate. In this case both are
equal because the debt ratio used is 100%. The
competitive advantage in this case is neutralized
by calculating cash flows before tax.
There are many risks that need to be identified
from the pre-construction phase to the operation.
For simplification, there are four risks that will
be reviewed, namely design errors, increase
in construction costs, construction delays, and
overloading. The first three risks occur during
the pre-construction and construction period
while the risk of overloading occurs during the
operating period.
Furthermore it is assumed that: (i) the
expected error due to design is an increase in
reconstruction costs by 10%, (ii) the expected
increase in risk costs is 44%, (iii) the expected
delay in construction is 30 days with a
assumed delay of 0.1% per day initial estimated
reconstruction costs. Overloading is estimated to
be the biggest risk with an expectation of 40% of
the estimated initial maintenance costs.
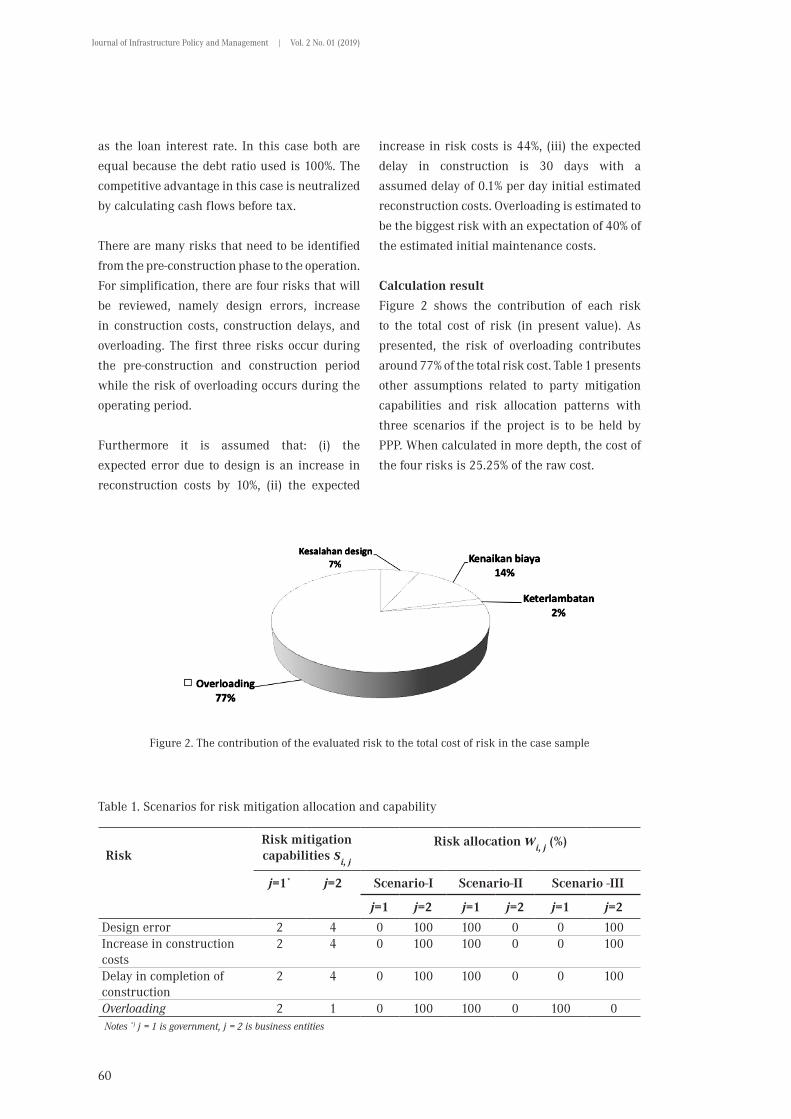
Calculation result
Figure 2 shows the contribution of each risk
to the total cost of risk (in present value). As
presented, the risk of overloading contributes
around 77% of the total risk cost. Table 1 presents
other assumptions related to party mitigation
capabilities and risk allocation patterns with
three scenarios if the project is to be held by
PPP. When calculated in more depth, the cost of
the four risks is 25.25% of the raw cost.
Figure 2. The contribution of the evaluated risk to the total cost of risk in the case sample
RiskRisk mitigation capabilities si, j
Risk allocation wi, j (%)
j=1* j=2 Scenario-I Scenario-II Scenario -III
j=1 j=2 j=1 j=2 j=1 j=2
Design error 2 4 0 100 100 0 0 100Increase in construction costs
2 4 0 100 100 0 0 100
Delay in completion of construction
2 4 0 100 100 0 0 100
Overloading 2 1 0 100 100 0 100 0 Notes *) j = 1 is government, j = 2 is business entities
Table 1. Scenarios for risk mitigation allocation and capability
61
Andreas Wibowo | Value for Money Assessment for Government and Business Entity Cooperation Projects by Using the Availability Payment Model: | 53 - 65 Proposition Methodology
In accordance with information from Table 1,
business entities are better than the government
for the first three risks only and worse for risk
overloading in the context of the ability to
mitigate risks. Scenario I risk allocation patterns
are inefficient. With the ability to better mitigate
the risk of overloading, the government should
get a greater portion of this risk. Inefficiency
occurs in Scenario II where the government
has to bear all risks as is the case with the state
budget project while business entities have
better risk mitigation capabilities for some risks.
Scenario III is an ideal scenario that adheres to
the principle of efficient risk allocation.
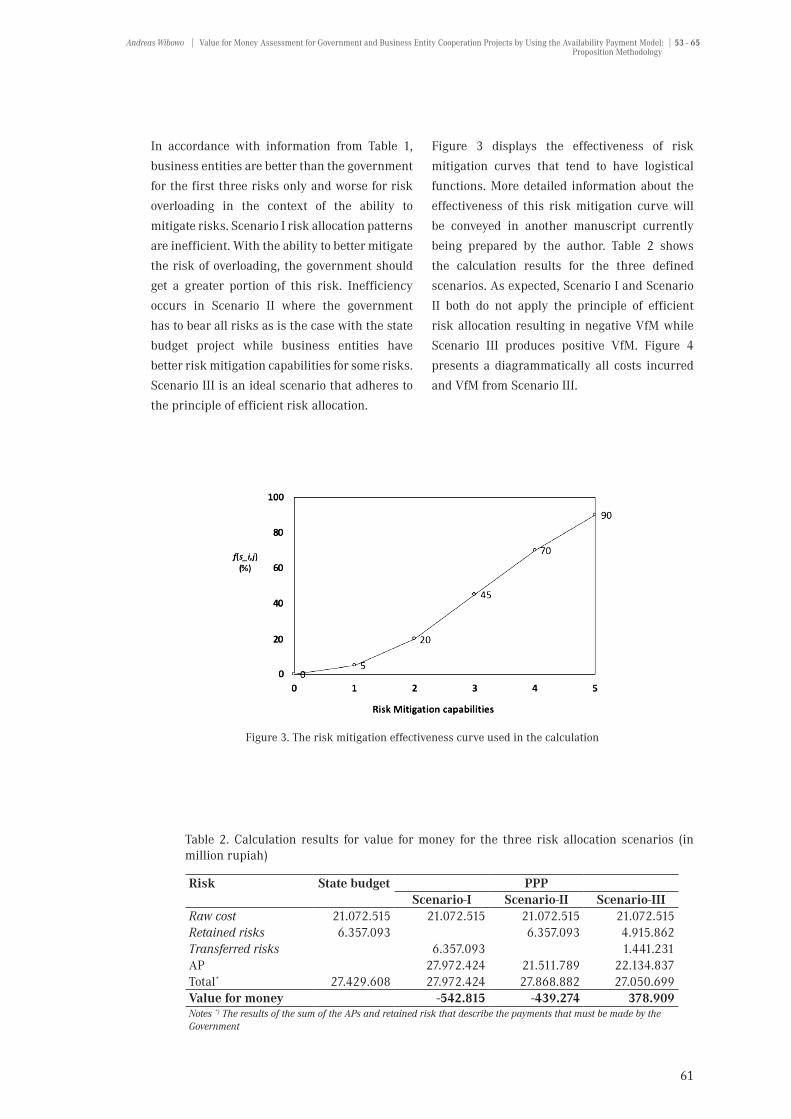
Figure 3 displays the effectiveness of risk
mitigation curves that tend to have logistical
functions. More detailed information about the
effectiveness of this risk mitigation curve will
be conveyed in another manuscript currently
being prepared by the author. Table 2 shows
the calculation results for the three defined
scenarios. As expected, Scenario I and Scenario
II both do not apply the principle of efficient
risk allocation resulting in negative VfM while
Scenario III produces positive VfM. Figure 4
presents a diagrammatically all costs incurred
and VfM from Scenario III.
Figure 3. The risk mitigation effectiveness curve used in the calculation
Table 2. Calculation results for value for money for the three risk allocation scenarios (in million rupiah)
Risk State budget PPPScenario-I Scenario-II Scenario-III
Raw cost 21.072.515 21.072.515 21.072.515 21.072.515Retained risks 6.357.093 6.357.093 4.915.862Transferred risks 6.357.093 1.441.231AP 27.972.424 21.511.789 22.134.837Total* 27.429.608 27.972.424 27.868.882 27.050.699Value for money -542.815 -439.274 378.909Notes *) The results of the sum of the APs and retained risk that describe the payments that must be made by the Government

62
Journal of Infrastructure Policy and Management | Vol. 2 No. 01 (2019)
RELEVANT ISSUES
Risk overestimation
Issues regarding assessment and risk allocation
associated with PSC calculations are very
relevant in the Indonesian context and are still
very limited. As far as the author’s knowledge
is concerned, there are only two studies that
discuss this. Pangeran (2011) calculated the
PSC for a drinking water investment project
and found that the risk costs borne by the
government were 38% of the raw cost, shared
by 82%, and transferred to the government by
110% so that as a whole amounted to 230% of the
raw cost. This amount is certainly difficult to be
accepted.
Wibowo (2007) - one of the preliminary studies
on PSC in Indonesia - uses Technical Guideline
No. Pd.T.01.2005.B regarding guidelines for risk
assessment of toll road investments issued by
the Ministry of Public Works (now the Ministry
of Public Works and Public Housing) to estimate
the magnitude of risk for PSC of a toll road
project. Wibowo gets the risk costs transferred
and borne by the government respectively 54%
and 44% of the raw cost. Although the cost is
low and not as fantastic as the findings of Prince
(2011), the magnitude of this risk is still beyond
normal limits.
In Australia, the value of transferred risk is
on average only 8% and in the UK between 10
and 15% and an average of 12% (Grimsey &
Lewis, 2005). There are at least two reasons
that can explain the excess cost of risk is the
assumption used: each risk is assumed to occur
independently and overestimates the probability
and impact if a risk occurs.
Discount rate
Determination of the discount rate for PPP
projects is still a complicated issue (read,
Gray et al. (2010); Grimsey & Lewis (2004)).
Infrastructure Australia (2008) has provided
guidance on how discount rates are determined
for PSC calculations. In principle, the discount
rate is determined based on the Capital Asset
Pricing Model (CAPM).
In general, risks can be categorized into project-
specific non-systematic risks (idiosyncratic
risks) and systematic risks (or market risks).
The first risk is often assumed to be eliminated
through diversification of assets while not for
the second risk. Therefore, the CAPM used by
Figure 4. The results of the calculation of value for money for Scenario-III
63
Andreas Wibowo | Value for Money Assessment for Government and Business Entity Cooperation Projects by Using the Availability Payment Model: | 53 - 65 Proposition Methodology
Infrastructure Australia (2008) only provides
compensation for systematic risks.
If non-systematic risk is calculated as retained
risk and transferred risks, systematic risk
is calculated in the discount rate so how
much systematic risk will be transferred
by the government to business entities will
affect the amount of the discount rate used.
This understanding is important to avoid the
mismatch of adjusting the discount rate and the
type of risk to be transferred. Discourse about
the discount rate is still and will continue but
the solution to this issue is outside the scope of
this paper.
Inaccurate determination of the discount rate can
have an impact on the net present cost offered
by prospective entities, especially if their cash
flow profiles differ from one another. This paper
assumes the same discount rate for government
and business cash flows. This assumption
is based on the understanding that VfM is
evaluated ex-ante with only one representative
business entity considering the objectives to be
achieved are still limited to making decisions
on two modalities for infrastructure provision:
state/local budget or PPP.
Competitive Neutrality Valuation
The competitive advantages of the government
are one of the elements in the PSC that needs
to be reasonably determined to make the
VfM assessment comparable (like-with-like
VfM assessment). One form of government
competitive advantage is tax that is only
imposed on business entities. In addition to
profits, what needs to be realized is that the
government also has competitive disadvantages
that need to be taken into account in calculating
PSC. Australian Infrastructure (2008) provides
several examples of competitive advantages
and disadvantages. There are two issues. The
first issue is the method for valuation of both
which is not described more clearly than the
other PSC elements. The second issue is related
to its application in the Indonesian context. As
with the determination of the discount rate, a
more detailed discussion of the valuation of
competitive advantages and disadvantages of
the government does not form part of this paper.
CONCLUSION
This paper offers an alternative quantitative VfM
assessment methodology to determine the best
ex-ante modality option between conventional
procurement using the state/local budget and
PPP using a payment model for availability
for infrastructure provision. The proposed
methodology considers the allocation and
capability of risk mitigation by the government
and business entities. The principle if risk is
allocated efficiently will produce the best VfM
fully used in this methodology. However, besides
the advantages offered, the methodology in
this paper has many limitations. Some of
the inputs used and concepts introduced are
still hypothetical. This methodology is still
under development and improvements to this
methodology are still being carried out by
the author by conducting several supporting
studies. Some of the issues raised in this paper
can also be interesting domains for future
research, including the definition of a mitigation
curve, the determination of the discount rate,
and the valuation of competitive advantages
and disadvantages of the government for PSC
calculations.

64
Journal of Infrastructure Policy and Management | Vol. 2 No. 01 (2019)
REFERENCES
Badan Perencanaan dan Pembangunan Nasional. (n.d.). Nilai manfaat uang (value for money). Retrieved Mei 1, 2018, from http://ppptoolkit.or.id/valueformoney-kpbu.html
Ballingall, J. (2013). Value for money in PPP projects: the UK experience and lessons learnt. Retrieved September 1, 2015, from http://wbi.worldbank.org/wbi/Data/wbi/wbicms/files/drupalacquia/wbi/Ballingall(1).pdf
Basheka, B. C., Oluka, P. N., & Mugurusi, G. (2012). Adopting new approaches for public procurement efficiency: critical success factors (CSFs) for the implementation of e-procurement in Uganda’s public sector. International Journal of Procurement Management, 5(6), 712–732. https://doi.org/10.1504/IJPM.2012.049711
Bing, L., Akintoye, A., Edwards, P. J., & Hardcastle, C. (2005). The allocation of risk in PPP/PFI construction projects in the UK. International Journal of Project Management, 23, 25–35. https://doi.org/10.1016/j.ijproman.2004.04.006
Chan, A. P. C., Yeung, J. F. Y., Yu, C. C. P., Wang, S. Q., & Ke, Y. (2010). Empirical study of risk asessment and allocation of public-private partnership projects in China. Journal of Management in Engineering, 27(3), 136–148. https://doi.org/10.1061/(ASCE)ME.1943-5479.0000049.
Daube, D., Vollrath, S., & Alfen, H. W. (2008). A comparison of project finance and the forfeiting model as financing forms for PPP projects in Germany. International Journal of Project Management, 26(4), 376–387. https://doi.org/10.1016/j.ijproman.2007.07.001
de la Cruz, M. P., del Caño, A., & de la Cruz, E. (2008). New paradigms for public procurement of construction projects in the United Kingdom — potential applicability in Spain. Canadian Journal of Civil Engineering, 35(3), 276–286.
De Marco, A., & Mangano, G. (2013). Risk and value in privately financed health care projects. Journal of Construction Engineering and Management, 139(8), 918–926. https://doi.org/10.1061/(ASCE)CO.1943-7862.0000660.
Eadie, R., Millar, P., & Toner, L. (2013). Public private partnerships, reevaluating value for money. International Journal of Procurement Management, 6(2), 152–169. https://doi.org/10.1504/IJPM.2013.052467
Gray, S., Hall, J., & Pollard, G. (2010). The public private partnership paradox. Retrieved from https://papers.ssrn.com/sol3/papers.cfm?abstract_id=1582312
Grimsey, D., & Lewis, M. K. (2004). Discount debates : Rates, risk, uncertainty and value for money in PPPs. Public Infrastructure Bulletin, 1(3), 1–6.
Grimsey, D., & Lewis, M. K. (2005). Are public private partnerships value for money ? Evaluating alternative approaches and comparing academic and practitioner views. Accounting Forum, 29(4), 345–378. https://doi.org/10.1016/j.accfor.2005.01.001
Henjewele, C., Sun, M., & Fewings, P. (2014). Comparative performance of healthcare and transport PFI projects : Empirical study on the influence of key factors. International Journal of Project Management, 32(1), 77–87. https://doi.org/10.1016/j.ijproman.2013.01.008
Heravi, G., & Hajihosseini, Z. (2012). Risk Allocation in Public–Private Partnership Infrastructure Projects in Developing Countries: Case Study of the Tehran–Chalus Toll Road. Journal of Infrastructure Systems, 18(3), 210–217. https://doi.org/10.1061/(ASCE)IS.1943-555X.0000090
HM Treasury. (2006). Value for money assessment guidance. London: HM Treasury.
Indonesia Infrastructure Guarantee Fund Institute. (2016). Petunjuk penggunaan aplikasi Value for Money Tool. Jakarta: Indonesia Infrastructure Guarantee Fund Institute.
Infrastructure Australia. (2008). National PPP guidelines volume 4: Public sector comparator guidance.
Jin, X.-H. (2010). Determinants of efficient risk allocation in privately financed public infrastructure projects in Australia. Journal of Construction Engineering and Management, 136(2), 138–150. https://doi.org/10.1061/(ASCE)CO.1943-7862.0000118
Jin, X.-H., & Doloi, H. (2008). Interpreting risk allocation mechanism in public-private partnership projects : An empirical study in a transaction cost economics perspective. Construction Management and Economics, 26(July), 707–721. https://doi.org/10.1080/01446190801998682
Jong, M. De, Rui, M., Stead, D., Yongchi, M., & Bao, X. (2010). Introducing public – private partnerships for metropolitan subways in China : what is the evidence ? Journal of Transport Geography, 18(2), 301–313. https://doi.org/10.1016/j.jtrangeo.2009.06.013
Laszlo, L. (2000). The Single-buyer model. Public Policy for the Private Sector. Washington, D.C.: World Bank.
Liu, T., & Wilkinson, S. (2014). Large-scale public venue development and the application of Public–Private Partnerships (PPPs). International Journal of Project Management, 32(1), 88–100. https://doi.org/10.1016/j.ijproman.2013.01.003
Mahdi, I. M., & Alreshaid, K. (2005). Decision support system for selecting the proper project delivery method using analytical hierarchy process (AHP). International Journal of Project Management, 23(7), 564–572. https://doi.org/10.1016/j.ijproman.2005.05.007

65
Andreas Wibowo | Value for Money Assessment for Government and Business Entity Cooperation Projects by Using the Availability Payment Model: | 53 - 65 Proposition Methodology
Pangeran, M. H. (2011). Model public sector comparator dalam tender konsesi infrastruktur air minum. Institut Teknologi Bandung.
Pangeran, M. H., & Wirahadikusumah, R. D. (2010). Challenges in implementing the public sector comparator for bid evaluation of PPP’s infrastructure project investment. In Proceedings of the first Makassar International Conference on Civil Engineering (pp. 1229–1239). Makassar: Hasanuddin University.
Pantelias, A., & Zhang, Z. (2010). Methodological framework for evaluation of financial viability of public-private partnerships : Investment risk approach. Journal of Infrastructure Systems, 16(4), 241–250.
Pitt, M., Collins, N., & Walls, A. (2006). The private finance initiative and value for money. Journal of Property Investment & Finance, 24(4), 363–373. https://doi.org/10.1108/14635780610674534
Pribadi, K. S., & Pangeran, M. H. (2007). Important risks on public-private partnership scheme in water supply investment in Indonesia. In W. Dewobroto, H. Hardjasaputra, J. Wijayakusuma, F. M. Sihontang, & M. R. Adventus (Eds.), Proceedings of the 1st. International Conference of European Asian Civil Engineering Forum (pp. 67–74). Tangerang: Universitas Pelita Harapan.
Public-Private Infrastructure Advisory Facility. (2009). Value for money and the PSC.
Quiggin, J. (2004). Risk, PPPs and the public sector comparator. Australian Accounting Review, 14(33), 51–61. https://doi.org/10.1111/j.1835-2561.2004.tb00229.x
Raisbeck, P., Duffield, C., & Xu, M. (2010). Comparative performance of PPPs and traditional procurement in Australia. Construction Management and Economics, 28(4), 345–359. https://doi.org/10.1080/01446190903582731
Rebeiz, K. S. (2012). Public-private partnership risk factors in emerging countries: BOOT illustrative case study. Journal of Management in Engineering, 28(4), 421–428. https://doi.org/10.1061/(ASCE)ME.1943-5479
Saaty, R. W. (1987). The analytic hierarchy process-what it is and how it is used. Mathematical Modelling, 9(3–5), 161–176. https://doi.org/10.1016/0270-0255(87)90473-8
Santoso, D. S., Joewono, T. B., Wibowo, A., Sinaga, H. P. A., & Santosa, W. (2012). Public-private partnerships for tollway construction and operation: Risk assessment and allocation from the perspective of investors. Journal of Construction in Developing Countries, 17(2), 45–66.
Schneider, A. L. (1999). Public-private partnerships in the U.S. prison system. American Behavioral Scientist, 43(1), 192–208. https://doi.org/10.1177/00027649921955119
Sobhiyah, M. H., Bemanian, M. R., & Kashtiban, Y. K. (2009). Increasing VFM in PPP power station projects - Case study: Rudeshur gas turbine power station. International Journal of Project Management, 27(5), 512–521. https://doi.org/10.1016/j.ijproman.2008.07.002
Wang, N. (2011). Risk allocation in the operational stage of private finance initiative projects. Journal of Performance of Constructed Facilities, 25(6), 598–605. https://doi.org/10.1061/(ASCE)CF.1943-5509.0000194.
Wibowo, A. (2007). Public sector comparator dalam penyelenggaraan jalan tol: Potensi aplikasi dan permasalahannya. In Proceedings of the 2nd. Indonesian Construction Industry Conference (pp. 21–32). Jakarta: University of Indonesia.
Wibowo, A. (2013). Konsep wholesale infrastructure berbasis modified shadow toll untuk pembangunan jalan tol nasional. In Seminar Nasional Teknik Sipil IX (pp. 9–16). Surabaya: Institut Teknologi Sepuluh November.
Wibowo, A., & Mohamed, S. (2010). Risk criticality and allocation in privatised water supply projects in Indonesia. International Journal of Project Management, 28(5). https://doi.org/10.1016/j.ijproman.2009.08.003
Yescombe, E. R. (2007). Public-private partnership: Principles of policy and analysis (1st. Ed.). Burlington: Butterworth-Heinemann.
Yongjian, K., Xinping, L., & Shouqing, W. (2008). Equitable financial evaluation method for public-private partnership projects. Tsinghua Science and Technology, 13(5), 702–707.
Zhang, X., & S., C. (2012). A systematic framework for infrastructure development through public private partnerships. IATSS Research, 36(2), 88–97. https://doi.org/10.1016/j.iatssr.2012.11.001