Embed Size (px)
Citation preview
Value-Added Taxes and U.S. Trade Competitiveness
Michael W Nicholson Office of Competition and Economic Analysis
International Trade Administration U.S. Department of Commerce1
July 2010
Abstract
This paper discusses the trade implications of value-added taxes (VATs) that refund domestic taxes paid by exporters of domestic production while imposing taxes on imports of foreign production. VATs are used by over 140 countries of the world, including every member of the OECD less the United States. Our investigation of the implications of border-adjustable taxes on the U.S. trade balance suggests that VATs reduce trade volumes – both imports and exports – and that these impacts are stronger in extractive, location-intensive sectors. We use panel data over 12 years, 29 industries, and 146 countries to conduct the analysis.
JEL Classification: F10, F23, H25, O19, K21
1 1401 Constitution Ave NW, Washington DC, 20230. The views expressed are those of the author and do not necessarily reflect those of the U.S. Department of Commerce, the Secretary of Commerce, the International Trade Administration, or the Undersecretary for International Trade. Martin Johnson, David Riker, Stefan Osborne, Hikaru Ogawa, Narek Sahakyan, and seminar participants at the 2010 Western Economic Association International have provided helpful suggestions. Brandon Thurner provided capable research assistance. Contact: [email protected], +1 202-482-5821.

1. Introduction
This paper discusses the trade implications of valued-added taxes (VATs) that
refund domestic taxes paid by exporters of domestic production while imposing taxes on
imports of foreign production. The WTO allows for these border adjustments on indirect
taxes, such as consumption (or value-added) taxes, to ensure trade neutrality of domestic
taxation. The United States, however, generally employs direct taxes, such as on
personal and corporate income, which cannot be border-adjustable under WTO
obligations. Consequently, U.S. firms may carry forward a non-border-adjustable
domestic tax burden that impairs their trade competitiveness.
We analyze the trade implications of VATs on the U.S. trade balance. Although
some economic evidence suggests that the United States may be able to improve its
business competitiveness if it were to replace certain elements of its existing tax
structure, particularly the corporate income tax, with a border-adjustable tax, this paper
does not address implications of a hypothetical U.S. value-added tax. We only consider
evidence regarding the impact of existing tax regimes of U.S. trade partners, including
VATs, on U.S. trade competitiveness, defined as a relative improvement in exports over
imports. Specifically, we ask whether VATs in other countries of the world affect U.S.
trade and whether the U.S. corporate income tax affects U.S. trade. We ultimately find
that VATs tend to reduce trade volumes – both imports and exports – but that these
impacts can differ substantially across sectors. The effects on exports are robust to
specification and inclusion, but the effects on imports appear to be dominated by oil, gas,
petroleum, and mineral imports from OPEC countries.
1
Section 2 provides background on VATs as they are in effect around the world.
Section 3 sets up an empirical model for testing. Section 4 provides results, Section 5
discusses the implications of OPEC countries on the results, and Section 6 offers
conclusions.
2. Background on Value-Added Taxes
The VAT has emerged in the popular press in recent months on a variety of
issues, including health care, climate change mitigation, and the public debt burden.2
Many commentators in the United States have referred to the VAT as a “European tax”,
given its origins in France and its use throughout the European Union: the VAT,
however, has become a global standard. Currently more than 143 countries have VAT
systems. 3 Since Australia adopted the VAT in 2000, the United States has been the only
OECD country without one.4
2 In The Washington Post on October 13, 2009, Henry Aaron and Isabel Sawhill of the Brookings Institution point out that “mushrooming future deficits” attributable to Medicare and Social Security have produced an unsustainable fiscal outlook. They propose a VAT linked directly to public health-care spending. The Economist magazine from November 19, 2009, describes a potential bipartisan consensus that the VAT might be “the most promising way to raise revenue, reduce the deficit and make the tax system more efficient,” although under a subheader that its advantages may be oversold. The New York Times on December 11, 2009, highlighted the VAT as a means of substantive deficit reduction in the context of an overhaul of the entire federal tax code, quoting Charles McClure of the Hoover Institution who said that a consumption tax would be the best and most obvious way “to start paying our bills.” Fred Bergsten, in the November/December 2009 Foreign Affairs, references a consumption tax as the only plausible policy tool of the U.S. federal government to raise the rate of national savings without vulnerability to the problem of additionality. However, considerable public opinion also resists a federal consumption tax. On February 18 and February 19, 2010, The Wall Street Journal described the proposed Deficit Reduction Commission as a “VAT Commission”, mentioning fears of a “European-style value-added tax that will raise federal revenues by about five percentage points of GDP.” A March 14, 2010 Washington Post article discussing the bipartisan Wyden-Gregg reform plan quotes Bob McIntyre of Citizens for Tax Justice who points out that increasing economic efficiency by broadening the tax base creates winners and losers, whereas even if the gains from the losers far exceed the losses to the losers, the gains are spread widely while the losses are felt deeply. 3 OECD (2008). 4 Avi-Yonah (2005) points out that every other OECD country has a personal and corporate income tax in addition to VAT.
2

Figure 1 displays a map that highlights countries without VAT; a list limited to
Cuba, North Korea, Laos, Burma (Myanmar), the United States, and a collection of oil-
producing states.5 Note that this figure reflects VATs adopted by 2010. The
econometric analysis below takes into account the changes in VAT adoption since the
1990s to estimate the impact on U.S. trade – 32 of our 146 countries adopted the policy in
that time.6 OECD (2008) estimates that 94% of U.S. exports are now subject to a VAT
in their destination countries.7
Figure 1: Countries with value-added taxes
5 It is easy to suggest explanations for trading patterns among these particular countries independent of their choice of tax method. Greenland, an autonomous region of Denmark, also does not impose a VAT, but rather relies on domestic income taxes. See Jensen and Nielson (2003). 6 Table A-1 in the Appendix lists the countries used for the analysis including their dates of VAT introduction. 7 In our dataset, which represents a sample of over 90% of all U.S. trade from 1997-2008, 93% of U.S. imports and 94% of U.S. exports are with countries implementing value-added taxes. We use only a sample, rather than the full universe of trade data, due to the availability of information on certain variables.
3

Trade implications for tax policy arise in part because international obligations, as
well as U.S. bilateral treaties, treat consumption taxes and income taxes very differently.
Unlike VATs, income taxes are not border-adjustable. The WTO allows for refunds of
indirect (consumption) taxes but not direct taxes such as the corporate income tax.8
Consumption taxes currently employed in the United States, such as state sales taxes, do
not include provisions for export rebates because they are applied only one time, at the
final sale.9 A U.S. resident purchasing a good in Europe for consumption in the United
States does not have to pay a European consumption tax (the VAT is levied at the point
of sale and refunded at the border), but a European resident purchasing a good in the
United States subject to a local sales tax must pay the sales tax even if the good will be
consumed in Europe.10 Neither Europeans nor Americans need to pay U.S. VAT on
goods purchased and consumed in the United States because it does not exist; both
Europeans and Americans must pay the consumption tax on goods purchased and
consumed in Europe.11
The VAT has emerged as a tax policy of choice in the contest of increasing
integration, and recent economic discussion has focused on the relationship among
globalization, openness, and tax policy. Hines and Summers (2009) point out that these
forces exacerbate economic distortions caused by direct taxes, such as personal or
corporate income taxes, and that whereas the size of the U.S. economy had previously
8 This exemption was established under GATT and is part of the Agreement on Subsidies and Countervailing Measures (“SCM Agreement”). 9 Sometimes, however, these sales taxes are adjustable across state borders, particularly with on-line transactions. 10 Foreign residents may have to pay VAT if they return to a VAT country from the United States, depending on the amount imported. For example, the United Kingdom levies VAT on goods carried into the country above an allowance of £340 on goods. 11 Everyone must pay local sales taxes in the United States, but our research investigates only central government policies.
4

left it relatively unaffected by the international mobility of economic activity, the pace of
globalization now greatly impacts the U.S. tax base. Although the VAT has proven to be
an attractive method of taxation for other countries of the world, however, it may not be
an ideal system for the United States due to certain factors, including domestic political
considerations and its continuing role as a large economic power.12
Discussions of globalization generally turn on how the term is defined. Research
on tax policy and trade has recently focused on “openness”, as measured by the ratio of
all trade (exports plus imports, or “X+M”) to total output (gross domestic product, or
“GDP”). The economic growth literature recognizes that these measures may not
sufficiently identify the relative openness of an economy; rather, they denote “trade
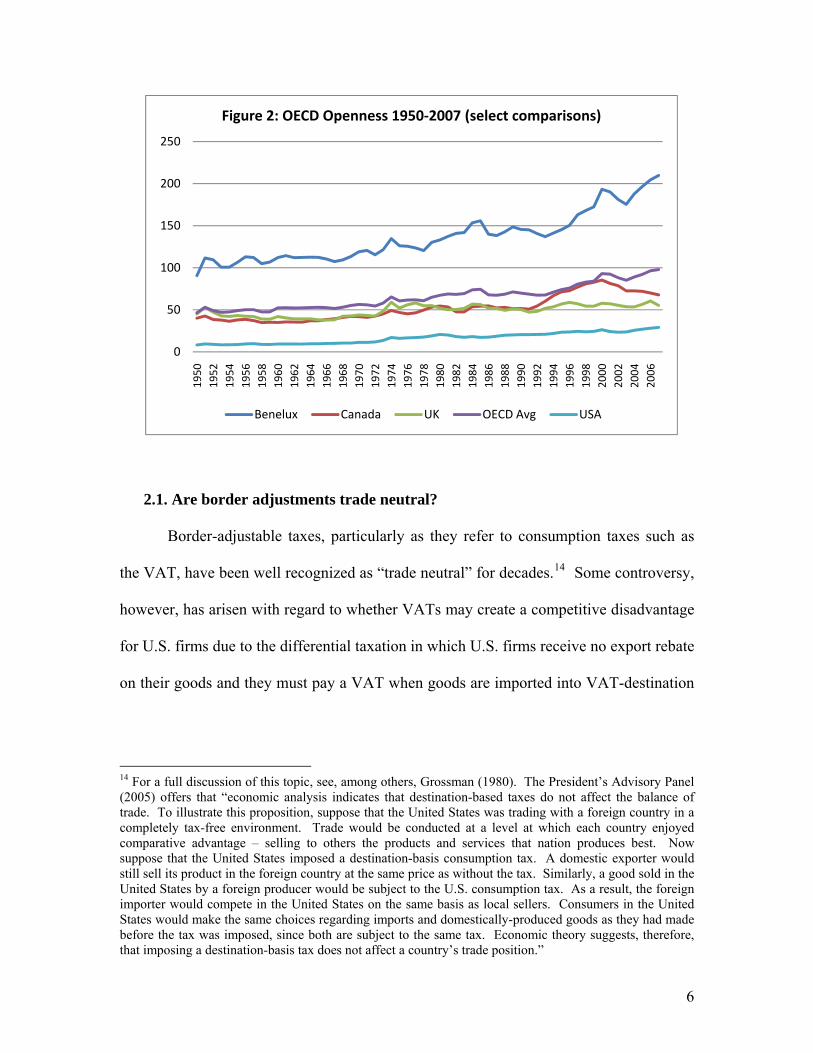
intensity” and not an orientation to a liberal, open trade policy.13 Figure 2 shows
openness as measured by (X+M)/GDP for the United States and select OECD
comparisons from 1950 to 2007. By this standard, the United States is not a particularly
open economy relative to small, central economies or the OECD average, but has been
growing more open over time. Note that “Benelux” refers to an arithmetic average of
Belgium, Netherlands, and Luxembourg: all three of those countries have combined
exports and imports in excess of their gross domestic product.
12 Keen and Lockwood investigate potential determinants of VAT such as involvement in IMF programs following financial crises, demographic factors, and federal government structure. They find that IMF programs may have a positive impact on the decision to adopt a VAT, that a federal government makes is less likely to adopt a VAT, and that demographic factors (such as an aging population) appear to have little impact. 13 See, for example, Baldwin (2003) and Lee, Ricci, and Rigobon (2004).
5
0
50
100
150
200
250
1950
1952
1954
1956
1958
1960
1962
1964
1966
1968
1970
1972
1974
1976
1978
1980
1982
1984
1986
1988
1990
1992
1994
1996
1998
2000
2002
2004
2006
Figure 2: OECD Openness 1950‐2007 (select comparisons)
Benelux Canada UK OECD Avg USA
2.1. Are border adjustments trade neutral?
Border-adjustable taxes, particularly as they refer to consumption taxes such as
the VAT, have been well recognized as “trade neutral” for decades.14 Some controversy,
however, has arisen with regard to whether VATs may create a competitive disadvantage
for U.S. firms due to the differential taxation in which U.S. firms receive no export rebate
on their goods and they must pay a VAT when goods are imported into VAT-destination
14 For a full discussion of this topic, see, among others, Grossman (1980). The President’s Advisory Panel (2005) offers that “economic analysis indicates that destination-based taxes do not affect the balance of trade. To illustrate this proposition, suppose that the United States was trading with a foreign country in a completely tax-free environment. Trade would be conducted at a level at which each country enjoyed comparative advantage – selling to others the products and services that nation produces best. Now suppose that the United States imposed a destination-basis consumption tax. A domestic exporter would still sell its product in the foreign country at the same price as without the tax. Similarly, a good sold in the United States by a foreign producer would be subject to the U.S. consumption tax. As a result, the foreign importer would compete in the United States on the same basis as local sellers. Consumers in the United States would make the same choices regarding imports and domestically-produced goods as they had made before the tax was imposed, since both are subject to the same tax. Economic theory suggests, therefore, that imposing a destination-basis tax does not affect a country’s trade position.”
6

countries, but foreign firms receive an export rebate on their goods when exporting to the
United States yet do not pay an import-related tax because a U.S. VAT does not exist.
Feldstein and Krugman (1990) make a definitive statement in the economic
literature on this subject, stating that “a VAT is not, contrary to popular belief, anything
like a tariff-cum-export subsidy. Indeed, a VAT is no more inherently pro-competitive
than a universal sales tax, to which an ‘idealized’ VAT, levied equally on all
consumption, is in fact equivalent. That VATs do not inherently affect international trade
flows has been well recognized in the international trade literature.”
These effects are relative, however, and recent empirical evidence suggests
border-adjustable taxes may affect trade. Feldstein and Krugman posit that VATs will
not be trade-neutral if they substitute for other taxes which might affect trade. Keen and
Syed (2006) suggest that consumption taxes may affect export behavior depending on
whether VAT rates change over time, whether effective rates of taxation vary across
sector, and whether VAT rebates are perfectly refunded. Graetz (2008) specifically notes
that “the extent that VAT revenues are used to replace corporate income taxes, this may
help make American products become more competitive in the global economy.”15 Note
the emphasis is on substitution and replacement: employing VATs as an alternative to the
current regime.16
15 Expectations for imports are mixed and warrant further study. According to Graetz, “The extent to which substituting a VAT for corporate income taxes will help imports of U.S. products is controversial. Most business executives believe that the current corporate income tax raises the prices of their products and that, by exempting exports, a VAT would make their products more competitive worldwide. The consensus among economists, however, has been that the corporate income tax does not affect prices but instead reduces returns to those who supply capital, although this may be changing with the internationalization of the economy. Economists have also concluded that adjustments to exchange rates will offset any trade advantages of taxing imports and exempting exports.” 16 Toder and Rosenberg (2010) provide a recent analysis of the implication of paying down payroll and corporate taxes with a value-added tax. Militzer and Ontscherenki (1990) suggest that replacing income
7

This paper tests the trade-neutrality of VATs by investigating their impact on U.S.
competitiveness. Our principle dependent variable is bilateral trade by country, by year,
by 3-digit NAICS sector. We recognize two defining choices in the estimation: how to
measure competitiveness and how to measure VAT. Desai and Hines (2005) point out
that the “received wisdom” by economists that border adjustments cannot impact
international trade carries sufficient acceptance that little empirical evidence has been
attempted. However, they produce economic evidence that suggests VAT leads to
decreased openness, as measured by (X+M)/GDP. Keen and Lockwood (2007) show
evidence that may reverse this causality – more open economies are less likely to adopt a
VAT – and thus these results should be interpreted with caution.
Table A-2 in the Appendix replicates the results of the Desai and Hines (2005)
study using independently-obtained data to show that VAT is associated with fewer
exports and imports. For purposes of comparison, Table A-2 is constructed identically to
Desai and Hines (2005)’s Table 2, with the same controls on GDP and geography, and
practically identical results.17 The results for “Export Share” are less robust than those
for “Openness”. We extend the analysis for Table A-2 to measures of trade openness
described by Squalli and Wilson (2006) and find that the results are robust to alternative
measures. Whether the effects of a VAT dummy are coincident with liberal, open trade
policies, or whether the effects are related to declines in exports and/or imports relative to
GDP, the results are sufficiently robust to support the baseline conclusion from Desai and
taxes with VAT would not impact U.S. competitiveness because personal income taxes do not directly affect either producers’ costs or their prices. 17 Geographic controls include: the area of the country, whether the country is landlocked, whether the country is an island, and ‘remoteness’ variables based on Anderson and Van Wincoop (2003) that proxy for distance in a multilateral setting. GDP controls include three powers of log GDP. Our sample includes 168 countries, instead of 136, due to expansion of the PWT data set.
8

Hines (2005): the presence of a VAT policy diminishes trade.18
Keen and Syed (2006) extend Desai and Hines (2005) to investigate effects of
both the VAT and the corporate income tax. They use panel data for 27 OECD countries
from 1967 to 2003. They also collect data on GDP and exports from World Economic
Outlook and tax revenue data from OECD; they use “net exports”, or X-M, as their
dependent variable.19 They identify corporate tax rates from Devereux, Griffith, and
Klemm (2002), VAT rates from IMF data, and measure CIT as corporate tax revenue as a
proportion of GDP.20 Keen and Syed find “powerful and complex effects” for their
proxies of the corporate tax: an increase in either the corporate tax rate or its revenues
leads to a sharp, short-run decrease in net exports, which is quickly reversed and
converges to zero. That is, higher corporate tax rates are associated high a stronger net
export position.21 The overall impact is convergence to zero, results consistent with the
theory of source-based corporate tax. Keen and Syed posit that these results might be
driven by anticipatory behavior, the Feldstein-Krugman effect, or perhaps incomplete
funding of rebates.22
18 Desai and Hines (2005) also investigate the activity of U.S. multinational affiliates and find that “foreign affiliates of American firms do less exporting from countries relying on VATs than they do from other countries, which is consistent with the incentives that they face from high rates of VAT and the inability to collect complete rebates for their exports.” 19 They show in an appendix that their results are robust to the use of export intensity as the dependent variable. 20 If using the marginal effective rate of corporate tax, calculated by Devereauz, Griffith, and Klemm (2002), they find statistically insignificant results. These examples illustrate the challenge – and importance – of choosing appropriate measures of VAT and CIT. 21 Moreover, the VAT proves insignificant in the presence of CIT controls, but the CIT remains robustly positive, suggesting that results such as Desai and Hines (2005) and Table A-1 above may be reflecting a proxy of CIT. 22 In their simple model, Feldstein and Krugman (1990) suggest that VAT may only affect trade in the short-run, before exchange rates adjust, and that exemptions for such non-traded goods as owner-occupied housing and personal services would imply a substitution effect away from imported goods. That is, the effects of a VAT are likely to be felt only in the short run, if at all, and those effects are expected to be a decline in exports.
9

3. Empirics
This section develops an empirical model to investigate further the perceived
effect of value-added taxes on international trade patterns. Economic theory says that a
VAT is “trade neutral” if it is uniformly applied across the globe. In practice, it is not.
The set of countries with a VAT changes over time, and these asymmetries impact trade
flows. This section quantifies these impacts. The analysis employs a time-series cross-
country dataset of U.S. bilateral trade disaggregated to 3-digit NAICS sectors to estimate
the effects of border-adjustable taxes on U.S. trade competitiveness. The subsequent
panel of data is analyzed in the context of the gravity model of international trade.
Section 4 provides estimates as well as robustness checks and extensions.
3.1. Data
Three major categories of data are collected to analyze the implications of border-
adjusted taxes on U.S. competitiveness: trade data, tax data, and country-specific
geographic controls. Bilateral U.S. trade data are collected for 146 countries by 29
sectors by 12 years from the United States International Trade Commission (USITC)
dataweb.23 The larger number of countries allows for greater heterogeneity in the VAT
dummy variable. As mentioned above, within the OECD every country had a VAT
throughout our time period, 1997-2008, except Australia. The 29 sectors include NAICS
211, 212, and the 300’s.24 The sector disaggregation allows a focus on U.S. trade
competitiveness in manufacturing and services. We limit the analysis to 12 years from
1997-2008 to ensure NAICS comparability; prior to 1997, the United States official data
23 http://dataweb.usitc.gov/. 24 Table 5 below lists the sector numbers with a brief description.
10

sources used the Standard Industrial Classification (SIC).25 Like Desai and Hines (2005)
and Keen and Syed (2006), we use the Penn World Tables for macroeconomic
variables.26 The USITC dataweb reports data in current year dollars, and thus we use
current-year values for GDP on an exchange-rate basis (as defined by the PWT).
Like Desai and Hines (2005), our baseline results below employ a dummy
variable for the presence of a VAT policy, the simplest measure of a value-added tax.27
The dummy variable allows for a much broader comparison across countries and time
than using VAT rates. We update VAT data from Ebrill, et al. (2001) into 2010 using
data collected from the internet.28 Table A-3 in the Appendix provides a list of variables
with their sources.
25 As part of our robustness checks below, we use data from 1989-1995 with 2-digit SIC sectors. 26 http://pwt.econ.upenn.edu/ 27 Keen and Syed (2006) point out that the dummy becomes a country fixed-effect after adoption of the VAT and does not capture the breadth of VAT coverage; moreover, the use of a dummy loses the ability to investigate heterogeneity in VAT regimes. They restrict their data to OECD countries and thus incorporate VAT rates, instead of dummy variables, as the basis for their analysis. Alternative measures include the size of VAT rates and VAT revenues as a percent of GDP. Keen and Lockwood (2007) list a number of dimensions of a VAT regime, including: the number and level of rates; the extent of zero-rating and exemptions; the breadth of coverage; and the promptness and extensiveness of refunds. As Figure 1 makes clear, few countries after 2010 can be analyzed due to the presence or absence of a VAT law. Using only OECD countries, we extend the analysis to include VAT rates and find robust results, but do not report them in the interest of avoiding redundancy. 28 Sources include: http://www.tmf-vat.com/; http://www.rma.org.bt/; http://www.africaneconomicoutlook.org/en/countries/east-africa/djibouti/; http://www.state.gov/r/pa/ei/bgn/7221.htm; http://www.gov.gd/vat.html; http://country.alibaba.com/profiles/CU/Cuba/market_access.htm; http://www.deloitte.com/print/en_GX/global/services/tax/article/5715912aff1fb110VgnVCM100000ba42f00aRCRD.htm; http://www.revenuegy.org/laws/Value-Added%20Tax%20Act%202005/Value-Added%20Tax%20Principal%20Law/Value-Added%20Tax%20Act%20PL01%20[2005].pdf; http://www.pwc.com/en_SG/sg/mergers-and-acquisitions-asian-taxation-guide-2008/assets/maasiantaxguide-2008-my.pdf; http://www.imf.org/external/pubs/ft/wp/2009/wp09215.pdf; http://www.thestkittsnevisobserver.com/2010/03/12/vat-november.html; https://www.deloitte.com/assets/Dcom-Global/Local%20Assets/Documents/Tax/Intl%20Tax%20and%20Business%20Guides/2010/dtt_tax_highlight_2010_Yemen.pdf; http://www.oecd.org/dataoecd/13/39/40577125.pdf
11

3.2. Gravity Model
The gravity model of international trade, which explains the empirical tendency of
such trade to increase with size of economies (GDP) and decrease with distance, provides
an empirical basis for the estimation.29 The basic empirical structure is:
jiji
jiji DISTANCE
GDPGDPkT ,
,, 3
21
0*
εβ
βββ
⎟⎟⎠
⎞⎜⎜⎝
⎛=(1) Gravity Model:
Where Ti,j is the trade volume (exports, imports, or both) between country i and country j,
k is a parameter and εi,j is a residual. The above equation expressed in logs becomes:
(2) jijijiji DISTGDPGDPkT ,,3210, )ln()ln()ln()ln()ln( μββββ +−++=
where µi,j = ln(εi,j).
Note that the above equation compares directly to Desai and Hines (2005)’s use
of “Export Share” and “Import Share” if Ti,j were defined as trade shares and restrictions
held β2=1. Statistical estimation of (2) using trade volumes allows the effect of GDP to
change by country, year, or sector.
3.3. Methodology
Data collected for the analysis yield panel regressions over countries, time, and
sector. The empirical equation is:
( ) citccctctctticit GEODISTGDPGDPUSVATTRADE εβββββααα ++−+++++= lnlnln 3,2100(3)
where αi and αt are sector and year fixed effects. U.S. GDP does not change by country or
industry and merely shifts the parameter on year fixed effects; we thus drop it from the
empirical analysis for simplicity. In line with Desai and Hines (2005) and Keen and
Syed (2006), equation (3) includes “geographic controls”, identified by “GEO”, obtained
from Rose (2002), for landlocked country (Landlocked), island country (Island), common
29 See, among others, Anderson (1979), Bergstrand (1985), Deardorff (1998), and Anderson and Van Wincoop (2003) on the gravity specification.
12

language (ComLang30); member of free trade agreement (FTA) with trading partner
(which becomes a “NAFTA” dummy for the 1989-1995 period); and member of World
Trade Organization (WTO). Like other log-linear analysis, (3) faces the “zeroes
problem” in that many of the country-sector-year cells show zero imports or exports and
the log of zero is undefined. For tractability, we thus limit the data set to positive values
in the OLS specification.
Silva and Tenreyro (2006) argue that an OLS log-linear analysis could exhibit
inconsistent estimators, especially in the context of the gravity model. They suggest the
use of Poisson estimation on LHS level variables with RHS log-linear variables. This
estimation solves “zeroes” problem, and also the issue of inconsistent OLS estimator due
to heteroskedasticity.
Using Poisson estimation, as recommended by Silva and Tenreyro, (3) becomes:
(4) ),,ln,ln,,,,( ,0 citcctcctticit GRAVITYDISTGDPVATfTRADE εααα=
Estimation of (4) provides baseline results for the empirical analysis.
4. Results
4.1. Baseline Results
Results for estimation of (3) and (4) are shown in Table 1.31 The middle column
uses the Poisson estimation without zeroes similar to the OLS estimation; like Silva and
Tenreyro (2006), these results are much closer to Poisson estimation of the full data set
than OLS estimation of a smaller data set. This indicates that the major concern with the
OLS estimation is heteroskedasticity rather than the zeroes problem.
30 As we use only bilateral U.S. trade data, the common language in our set is always English. 31 All regressions undertaken on Stata 10.
13

Table 1: Baseline Results for 1997-2008 OLS
(no zeroes) Poisson
(no zeroes) Poisson (zeroes)
ln(Exports) Exports Exports n = 35,913 n = 35,913 n = 38,929 R2 0.7787 R2 = 0.8872 R2 = 0.8900
Coef. t‐stat Coef. z Coef. z VAT ‐0.308 ‐10.970 ‐0.602 ‐7.880 ‐0.588 ‐7.670 Landlocked ‐0.689 ‐29.230 ‐0.245 ‐2.890 ‐0.251 ‐2.950 Island 0.675 28.660 0.358 9.400 0.357 9.400 ComLang 0.699 35.680 0.573 18.430 0.575 18.490 FTA 0.755 22.890 0.918 18.720 0.916 18.680 WTO 0.418 13.240 0.693 8.460 0.753 9.050 lnDISTANCE ‐1.968 ‐109.410 ‐0.894 ‐26.340 ‐0.894 ‐26.320 lnGDP 1.028 249.150 0.797 107.070 0.798 107.310
ln(Imports) Imports Imports n = 30,708 n = 30,708 n = 37,381 R2 = 0.5836 R2 = 0.6741 R2 = 0.6892
Coef. t Coef. Z Coef. z VAT ‐0.230 ‐4.320 ‐0.607 ‐5.120 ‐0.566 ‐4.740 Landlocked ‐0.341 ‐7.690 ‐0.605 ‐8.680 ‐0.660 ‐9.350 Island 0.440 9.350 0.059 0.550 0.047 0.450 ComLang 0.174 4.650 0.134 2.000 0.136 2.020 FTA 0.530 8.680 1.135 12.080 1.142 12.200 WTO 0.741 13.110 0.234 1.670 0.349 2.450 lnDISTANCE ‐1.069 ‐31.200 ‐0.401 ‐4.970 ‐0.404 ‐5.010 lnGDP 1.290 164.520 0.833 39.180 0.850 41.170
The results in Table 1 are broadly consistent with those of Table A-2, and
consequently with Desai and Hines (2005) and Keen and Syed (2006). The presence of a
VAT regime decreases trade volumes as measured by both exports and imports. Note
that extensions below suggest that the empirical relationship is much stronger for exports
than imports. That both specifications have the same sign provides some explanation for
why (X+M)/GDP (openness) has stronger statistical explanatory power in Table A-2 and
Desai and Hines (2005) than just X/GDP (export intensity): the two effects appear
additive.
14

4.2. Robustness Tests
In this section we subject the baseline results of Table 1 to various alternative
specifications, including: analysis of non-OECD countries only; comparison to 1989-
1995 SIC 2-digit sectors; and an interaction with the U.S. corporate income tax.
Table 2 juxtaposes the full-sample baseline results with non-OECD measures. As
noted above, the only OECD country with heterogeneity in the VAT dummy variable
over time is Australia, which did not have a VAT from 1997-1999. VAT rates are
available for many non-OECD countries, but the data are less reliable. Keen (2007),
among others, discusses the implementation challenges of VATs in developing countries,
in particular large informal markets in which the VAT is not applied (and thus becomes
an input tax) as well as broken administrative systems that fail to recover the VAT at
various stages of the production chain.
Table 2: Non-OECD results Exports (n = 31,121) Imports (n = 29,606) R2 =0.8045 R2 = 0.6616 Coef. z Coef. z VAT ‐0.683 ‐8.560 ‐0.176 ‐1.530 Landlocked ‐0.511 ‐5.560 ‐1.425 ‐10.460 Island 1.293 18.720 0.595 4.510 ComLang 0.210 3.230 ‐0.666 ‐6.270 FTA 0.933 17.190 0.378 2.940 WTO 0.935 10.350 0.769 5.340 lnDISTANCE ‐0.766 ‐14.530 0.900 7.580 lnGDP 0.911 77.280 0.885 36.070
As shown, the coefficient on VAT dummy remains negative and statistical for
exports, but not for imports. The presence of a VAT has a negative impact on U.S.
imports from wealthier countries but not from developing countries. From another
15

perspective, for non-OECD countries, adopting a VAT could decrease their imports from
the United States but may not affect their exports to the United States. This result is
consistent with the possibility that VATs in developing countries are applied
disproportionally to goods entering at the border; a form of non-tariff barrier.
Table 3 shows the baseline results are robust to earlier periods of measurement
are also important because of further heterogeneity in the VAT dummy variable. The
WTO variable is not included in this estimation and “FTA” refers specifically to
NAFTA.32
Table 3: Cross-time comparisons
Exports Imports
Baseline (1997‐2008) SIC (1989‐95) Baseline (1997‐2008) SIC (1989‐95) n = 45,285 n=24,119 n = 43,774 n=22,415 R2 =0.8866 R2 =0.8780 R2 = 0.7134 R2 = 0.7235
Coef. z Coef. z Coef. z Coef. z VAT ‐0.473 ‐6.59 ‐0.137 ‐2.76 ‐0.515 ‐4.28 ‐0.396 ‐4.07 Landlocked ‐0.290 ‐3.47 ‐0.574 ‐6.60 ‐0.516 ‐7.82 ‐0.780 ‐7.09 Island 0.410 11.07 0.611 13.63 ‐0.064 ‐0.59 0.775 9.04 ComLang 0.589 20.19 0.823 23.85 0.118 1.90 0.579 8.47 FTA 0.890 18.49 0.443 5.87 1.296 13.22 0.647 4.03 lnDISTANCE ‐0.908 ‐27.32 ‐1.166 ‐39.21 ‐0.312 ‐3.83 ‐0.996 ‐15.21 lnGDP 0.805 110.92 0.778 98.18 0.924 38.50 0.838 51.76
32 The United States had entered an FTA with Israel prior to 1989, but Israel is one of the few countries not included in our data set.
16
4.3. Analysis of U.S. corporate income tax
In this section, following Keen and Syed (2006), we investigate the interaction
between VAT and the corporate income tax (CIT). To supplement the VAT dummy by
year by country, we construct data on CIT by sector in 2004, using information from the
2006 CBO study “Computing Effective Tax Rates on Capital Income.” Tax rates for
CBO sectors were calculated by computing the percentage of total sector capital
accounted for by each type of capital, which were used as weights to compute a sector tax
rate.33 These computations enable a VAT*CIT interactive term by country, industry, and
year.
We expect that higher U.S. CIT will decrease U.S. trade competitiveness and that
the impact of CIT on competitiveness will be exacerbated by presence of VAT in foreign
country. The latter prediction assumes that tax revenues remain constant regardless of
the regime: if no VAT exists, the country must obtain revenues from alternative sources,
presumably income taxes; if a VAT exists, then country can use these revenues to pay
down its CIT to lower rates. As shown in columns (i) and (iii) of Table 4, the CIT does
not affect U.S. exports, but is related to import penetration, which would diminish trade
competitiveness as defined by net exports.
33 Chris Rasmussen conducted the exercise.
17

Table 4: CIT Analysis
Exports (n=45,285) Imports (n=43,774)
(i) (ii) (iii) (iv)
R2 = 0.8866 R2 = 0.8869 R2 = 0.7134 R2 = 0.7158
Coef. z Coef. z Coef. z Coef. z
VAT -0.473 -6.59 5.973 5.44 -0.515 -4.28 -8.244 -5.08 VAT*lnCIT -2.030 -5.68 2.492 4.74
lnCIT 0.128 0.68 2.073 5.63 3.641 11.31 0.064 2.32
Landlocked -0.290 -3.47 -0.290 -3.47 -0.516 -7.82 -0.516 -7.84
Island 0.410 11.07 0.411 11.08 -0.064 -0.59 -0.063 -0.57
ComLang 0.589 20.19 0.589 20.21 0.118 1.90 0.118 1.90
FTA 0.890 18.49 0.890 18.51 1.296 13.22 1.295 13.22
lnDISTANCE -0.908 -27.32 -0.908 -27.35 -0.312 -3.83 -0.313 -3.84
lnGDP 0.805 110.92 0.805 110.79 0.924 38.50 0.924 38.49 _cons 10.033 15.56 3.857 3.23 -7.156 -4.86 2.694 2.41 Columns (ii) and (iv), which include an interactive term, show a more complex
story. Note that the net effects of VAT on trade shares become -0.352 for exports and -
0.478 for imports, comparable to the sign and magnitude of earlier results.34 The positive,
statistically significant sign on the coefficients for “lnCIT” for both imports and exports
is consistent with Keen and Lockwood (2007). The coefficient on the interactive term
indeed suggests that in the presence of a foreign VAT, a higher CIT will decrease exports
and increase imports (i.e. lower U.S. competitiveness).
4.4. Sector Analysis
This section considers whether the VAT impacts on trade may differ across
sectors. In addition to being trade neutral, a VAT is also considered sector-neutral,
34 These are calculated by 5.973-2.030*CIT=-0.352 and -8.244+2.492*CIT=-0.478, where CIT is set equal to its mean value 3.116.
18

depending on exemptions granted in the taxation system, since VAT rates are levied at
constant rates across sectors while corporate tax rates fluctuate significantly.35 Although
VATs do not affect international trade through the border adjustments, they may affect
imports and exports to the extent that they are applied at different rates for different
sectors. Desai and Hines (2005) point out that a country may tend to impose higher
effective VAT rates on traded sectors than on non-traded sectors, which might potentially
induce a negative relationship between VAT and exports.
Disaggregated trade data allow for an investigation of these distortions by sector.
Table 5 ranks trade over the 1997-2008 period by 3-digit NAICS sector. Note the major
trading sectors of 334 (Computer and Electronic Products), 336 (Transportation
Equipment), 325 (Chemicals), and 333 (Machinery, Except Electrical). The United
States imports a considerable volume in 211 (Oil and Gas) but exports relatively little.
Table 5: Total U.S. Trade 1997 to 2008 by 3-digit NAICS sector NAICS Sector Exports Rank Imports Rank Total Trade Rank
211 OIL AND GAS 37,274,132 20 1,327,441,766 3 1,364,715,8985
212 MINERALS AND ORES 82,443,185 15 50,222,777 23 132,665,962 22
311 FOOD AND KINDRED PRODUCTS 338,854,181 6 297,033,862 12 635,888,043 12
312 BEVERAGES AND TOBACCO PRODUCTS 54,183,190 19 128,705,507 19 182,888,697 19
313 TEXTILES AND FABRICS 89,550,946 13 77,577,536 21 167,128,482 20
314 TEXTILE MILL PRODUCTS 27,319,716 23 117,463,510 20 144,783,226 21
315 APPAREL AND ACCESSORIES 74,121,449 16 756,649,087 7 830,770,536 9
316 LEATHER AND ALLIED PRODUCTS 33,137,765 22 282,407,119 13 315,544,884 15
321 WOOD PRODUCTS 54,429,707 18 205,481,488 17 259,911,195 17
322 PAPER 189,842,453 11 231,230,109 15 421,072,562 14
323 PRINTED MATTER AND RELATED PRODUCTS 63,649,712 17 56,272,838 22 119,922,550 23
324 PETROLEUM AND COAL PRODUCTS 181,367,891 12 534,120,863 10 715,488,754 10
325 CHEMICALS 1,166,157,8193 1,215,629,170 4 2,381,786,9893
35 Hufbauer and Grieco (2005) point out that the U.S. corporate tax rate varies across sectors, with taxes ranging from 0.5% to 2.9% on sales and from 1.1% to 8.0% on value-added. This range ignores the outlier of the petroleum sector, which pays 5.0% on sales and over 25% on value added. In addition, as suggested by Nicely (2008), the export rebates may constitute a subsidy to a particular industry if the application of VAT rates is differentiated along the vertical chain of production.
19

326 PLASTICS AND RUBBER PRODUCTS 213,296,780 10 250,513,344 14 463,810,124 13
327 NONMETALLIC MINERAL PRODUCTS 83,839,705 14 179,672,481 18 263,512,186 16
331 PRIMARY METAL MANUFACTURING 326,216,113 7 636,893,442 8 963,109,555 7
332 FABRICATED METAL PRODUCTS, NESOI 275,591,179 9 365,003,697 11 640,594,876 11
333 MACHINERY, EXCEPT ELECTRICAL 1,059,968,6504 1,048,766,568 5 2,108,735,2184
334 COMPUTER AND ELECTRONIC PRODUCTS 1,910,330,2411 2,664,433,146 1 4,574,763,3871
335 ELECTRICAL EQUIPMENT, APPLIANCES, AND COMPONENT
324,210,199 8 535,057,262 9 859,267,461 8
336 TRANSPORTATION EQUIPMENT 1,735,868,8822 2,643,287,381 2 4,379,156,2632
337 FURNITURE AND FIXTURES 34,242,991 21 218,276,536 16 252,519,527 18
339 MISCELLANEOUS MANUFACTURED COMMODITIES 385,894,326 5 792,345,075 6 1,178,239,4016
To isolate these effects, we run regressions on equation (4) separately for each
sector. The panel regressions, with pooled data, force all the coefficients to be the same.
Separate regressions allow the VAT coefficients to vary. In the individual regressions the
control variables broadly maintain their sign and magnitude (e.g., distance is negative and
GDP is positive). The sign and magnitude of the VAT dummies, however, exhibit
considerable differences by sector. Table 6 shows the range of sign and magnitude for
the coefficient on VAT dummy by sector.
Table 6: Range of sign and magnitude for VAT dummy coefficient
Negative Significant
Negative Insignificant
Positive Insignificant
Positive Significant
Exports 22 2 3 5 Imports 5 7 9 10
Figure 3 displays the VAT dummy variables by size of their coefficient for
imports and exports. The oval line identifies regions of statistical significance for the
import regressions – points outside the oval, including the extreme values, are statistically
significant for both the export and the import VAT coefficient.
20

Figure 3: Coefficients on VAT Dummy Variables 1997-2008
By the results of the pooled regressions, most of the coefficients would be
expected in the lower left quadrant. In fact, they are along a line of opposite sign by
sector with a correlation coefficient of about -0.631. As shown, the import results from
above could be determined by three sectors: oil and gas; petroleum and coal products;
and minerals and ores. These sectors are all notably in extractive industries. Table 7
highlights the extreme values on the VAT dummy coefficient for both exports and
imports.
21

Table 7: Extremes for the VAT dummy coefficients Top Exports Top Imports
Exports ExpZ Imports ImpZ Exports ExpZ Imports ImpZ
211 OIL AND GAS 1.896 5.47 -1.638 -4.59 312 BEVERAGES AND TOBACCO PRODUCTS
-0.718 -3.11 1.635 3.98
212 MINERALS AND ORES 1.340 7.86 -1.220 -4.19 336 TRANSPORTATION EQUIPMENT
-0.371 -2.09 1.486 9.13
315 APPAREL AND ACCESSORIES
0.943 3.92 -0.086 -0.47 322 PAPER -0.378 -3.01 1.382 5.46
324 PETROLEUM AND COAL PRODUCTS
0.873 5.75 -1.708 -6.10 316 LEATHER AND ALLIED PRODUCTS
-1.636 -6.57 1.267 4.46
114 FISH, FRESH, CHILLED, OR FROZEN AND OTHER MARINE PRODUCTS
0.511 1.91 0.765 3.63 331 PRIMARY METAL MANUFACTURING
-0.743 -4.42 0.973 4.3
Bottom Exports Bottom Imports Exports ExpZ Imports ImpZ Exports ExpZ Imports ImpZ
327 NONMETALLIC MINERAL PRODUCTS
-0.784 -4.41 0.751 4.84 323 PRINTED MATTER AND RELATED PRODUCTS, NESOI
-0.419 -3.44 -0.805 -2.79
112 LIVESTOCK AND LIVESTOCK PRODUCTS
-0.788 -3.63 0.456 1.08 334 COMPUTER AND ELECTRONIC PRODUCTS
-0.781 -4.12 -0.950 -3.09
335 ELECTRICAL EQUIPMENT, APPLIANCES, AND COMPONENT
-0.880 -6.94 -0.324 -1.47 212 MINERALS AND ORES
1.340 7.86 -1.220 -4.19
337 FURNITURE AND FIXTURES -0.967 -5.58 -0.271 -0.92 211 OIL AND GAS 1.896 5.47 -1.638 -4.59
316 LEATHER AND ALLIED PRODUCTS
-1.636 -6.57 1.267 4.46 324 PETROLEUM AND COAL PRODUCTS
0.873 5.75 -1.708 -6.10
5. On OPEC
Our dataset of 29 sectors and 146 countries comprises over 93% of all U.S. trade
from 1997-2008, and 93% of that trade is subject to VATs. In a more striking difference,
only 1.8% of U.S. exports are to OPEC countries but 4.6% of U.S. imports are from
OPEC countries – it is probably no surprise that the United States carries a substantial
negative trade balance with OPEC countries. These relationships may have an impact on
the VAT analysis. As shown in Figure 4, 19% of U.S. non-VAT exports are to OPEC
countries, while 27% of U.S. non-VAT imports are from OPEC countries. This section
investigates whether this small set of countries in three particular sectors (Oil and Gas,
Petroleum and Petroleum Products, and Minerals and Ores) could be driving the results
of VAT imports.
22

Figure 4: Percent of Non-VAT Trade Accounted by OPEC Countries
OPEC94%
Non‐VAT6%
Total Exports($8.7 trillion)
VAT93%
Non‐VAT7%
Total Imports($14.6 trillion)
OPEC19%
Non‐OPEC81%
Non‐VAT Exports($0.53 trillion)
OPEC27%
Non‐OPEC73%
Non‐VAT Imports($1.03 trillion)
Figure 5 illustrates the importance of these trade patterns by replicating Figure 3
weighted by the size of the sector. As can clearly be seen, the circles in the extractive
sectors are much larger for imports, and driving the results.
23

Figure 5: Coefficient on VAT Dummy by Volume of Trade
‐2.5
‐2
‐1.5
‐1
‐0.5
0
0.5
1
1.5
2
2.5
‐2 ‐1.5 ‐1 ‐0.5 0 0.5 1 1.5 2Expo
rts
Imports
By Volume of Exports
‐2.5
‐2
‐1.5
‐1
‐0.5
0
0.5
1
1.5
2
2.5
‐2 ‐1.5 ‐1 ‐0.5 0 0.5 1 1.5 2Expo
rts
Imports
By Volume of Imports
Table 8 provides results for regressions that have either dropped the three noted
sectors (“Non-Extractives”) or differentiate between OPEC and non-OPEC countries.
For exports, there is no substantive change in any of the results, but for imports the
coefficient on the VAT dummy loses statistical significance under the “non-extractives”
and “Non-OPEC” regressions. The implication is that general conclusions cannot
24

necessarily be drawn about the impact of VAT policies amongst U.S. trading partners on
U.S. imports, given the relative importance that oil, gas, petroleum, and mineral imports
from OPEC countries feature in the trade data. The results about U.S. exports remain
robust.
Table 8: Regressions With/Without OPEC
EXPORTS IMPORTS Non-Extractives Non-OPEC OPEC Non-
ExtractivesNon-OPEC OPEC
n = 35,651 n = 38,877 n=1,599 n=34,799 n = 37,318 n=1,622 R2 = 0.8907 R2 = 0.8903 R2 = 0.7687 R2 = 0.7498 R2 = 0.7134 R2 = 0.7450 Coef. z Coef. z Coef. z Coef. z Coef. z Coef. z VAT -0.495 -6.80 -0.59 -6.410 -0.86 -10.8 -0.190 -1.31 -0.630 -4.370 0.263 1.320 Landlocked -0.244 -2.90 -0.26 -3.070 (omitted) -0.54 -0.341 -5.13 -8.520 (omitted) Island 0.405 10.62 0.352 9.190 (omitted) 0.007 -0.134 -1.15 0.460 (omitted) ComLang 0.598 20.17 0.587 18.200 0.392 1.660 0.062 0.96 0.107 1.510 0.535 2.090 FTA 0.894 18.15 0.904 18.340 (omitted) 1.492 13.2 1.173 (omitted) WTO -0.894 -26.34 0.873 12.790 1.218 9.930 -0.126 -1.36 0.546 3.760 -0.69 -3.36 lnDIST 0.814 107.92 -0.89 -26.040 -3.86 -5.76 1.014 35.74 -0.408 -4.760 0.067 0.150 lnGDP -0.495 -6.80 0.793 106.590 1.865 6.830 -0.190 -1.31 0.871 42.060 0.494 3.050
25

6. Conclusions
This paper presents empirical estimation of the effects of border-adjustable taxes
on U.S. trade competitiveness. In general, the implementation of value-added taxes has
lead to a decline in both U.S. exports and U.S. imports over the past decade. The results
for exports are fairly robust to specification and inclusion, but the VAT effect for imports
appears to be dominated by OPEC countries and extractive sectors. The results for
imports are small and statistically insignificant when accounting for these particular
influences. These three sectors – Oil and Gas, Petroleum and Petroleum Products, and
Minerals and Ores – also provide much of the U.S. trade deficit.
Other results include:
• The impact of the VAT on trade differs substantially by sector. U.S.
exports have a positive, statistically significant sign for the extractive
sectors, but they play a small part of U.S. trade relative to exports in other
sectors and imports in these sectors. The VAT effect for U.S. imports
appears to be dominated by these particular sectors, particularly given the
relatively high shares of trade with non-VAT, OPEC countries.
• Imports from non-OECD countries are not affected by the introduction of a
VAT; the estimated coefficients are small and statistically insignificant;
• The U.S. corporate income tax tends to decrease exports and increase
imports (by definition, therefore, hurting U.S. trade competitiveness).
26
References
Anderson, James. 1979. A Theoretical Foundation for the Gravity Equation. American Economic Review 69:106-116.
Anderson, James and Eric Van Wincoop. 2003. Gravity with Gravitas: A Solution to the
Border Puzzle. American Economic Review 93: 170-192. Avi-Yonah, Reuven. 2005. "Risk, Rents, and Regressivity: Why the United States
Needs Both an Income Tax and a VAT." Tax Notes Int'l 37, no. 2 (2005): 177-95. Baldwin, Robert E. 2003. Openness and Growth: What’s the Empirical Relationship?
NBER Working Paper No. 9578. Bergstrand, Jeffrey H. 1985. The Gravity Equation in International Trade: Some
Microeconomic Foundations and Empirical Evidence. Review of Economic and Statistics 69: 474-481.
Congressional Budget Office. 2006. “Computing Effective Tax Rates on Capital
Income.” Background Paper. Deardorff, Alan V.. 1998. Determinants of Bilateral Trade: Does Gravity Work in a
Neoclassical World? in Jeffrey Frankel (ed.), The Regionalization of the World Economy. Chicago: The University of Chicago Press.
Desai, Mihir A. and James A. Hines. 2005. Value-Added Taxes and International Trade:
The Evidence. Mimeo, University of Michigan. Ebrill, Liam, Michael Keen, Jean-Paul Bodin, and Victoria Summers. 2001. The
Modern VAT. Washington, DC: International Monetary Fund. Feldstein, Martin and Paul Krugman. 1990. International Trade Effects of Value-Added
Taxation in Razin and Slemrod, eds., Taxation in the Global Economy. Chicago: University of Chicago Press.
Graetz, Michael. 2008. 100 Million Unnecessary Returns. New Haven and London:
Yale University Press. Grossman, Gene M. 1980. Border Tax Adjustments: Do They Distort Trade? Journal of
International Economics 10(1): 117-128. Hines, James and Lawrence Summers. 2009. How Globalization Affects Tax Design.
NBER Working Paper No. 14664. Hufbauer and Grieco, Reforming the U.S. Corporate Tax, Institute for International
Economics, September 2005.
27

Jensen, Carsten Vestero and Soren Bo Nielsen. 2003. Tax policy on the outskirts of the
EU: Greenland. Baltic Journal of Economics 4(1): 46-63. Keen, Michael. 2007. VAT, Tariffs, and Withholding: Border Taxes and Informality in
Developing Countries. IMF Working Paper No. WP/07/174. Keen, Michael and Ben Lockwood. 2007. The Value-Added Tax: Its Causes and
Consequences. IMF Working Paper No. WP/07/183. Keen, Michael and Murtaza Syed. 2006. Domestic Taxes and International Evidence:
Some Evidence. IMF Working Paper No. WP/06/47. Lee, Ha Yan, Luca Antonio Ricci, and Roberto Rigobon. 2004. Once again, is openness
good for growth? Journal of Development Economics 75: 451-472. Nicely, Matthew R. “Counteracting Distortive Export Tax and VAT Rebate Policies at
the WTO: A Downstream Industry Perspective,” Thompson Hine LLP, 2008. Militzer, Ken and Ilona Ontscherenki. 1990. The value added tax: its impact on saving.
Business Economics. OECD. 2008. Consumption Tax Trends 2008. President’s Advisory Panel on Federal Tax Reform. 2005.
http://govinfo.library.unt.edu/taxreformpanel/final-report/index.html Rose, Andrew. 2002. Do WTO Members Have a More Liberal Trade Policy? NB ER
Working Paper No. 9347. Silva, J.M.C. Santos and Silvana Tenreyro. 2006. The Log of Gravity. Review of
Economics and Statistics 88(4): 641-658. Slemrod, Joel. 2004. Are Corporate Tax Rates, or Countries, Converging? Journal of
Public Economics 88: 1169-86. Squalli, Jay and Kenneth Wilson. 2006. A New Approach to Measuring Trade Openness,
Economic & Policy Research Unit Working Paper No. 06-07. Zayed University, Dubai, UAE.
Toder, Eric and Joseph Rosenberg. 2010. Effects of Imposing a Value-Added Tax to
Replace Payroll Taxes or Corporate Taxes. Mimeo, Urban-Brooking Tax Policy Center.
Goldberg: http://www.ny.frb.org/research/economists/goldberg/papers.html, citing Levenstein and Suslow (2006)
28

Appendix
Table A-1: List of Countries and Year of VAT introduction Country VAT Country VAT Country VAT ALBANIA 1996 FRANCE 1968 NETHERLANDS 1969 ALGERIA 1992 GABON 1995 NEW_ZEALAND 1986 ANGOLA x GAMBIA x NICARAGUA 1975 ANTIGUA_BARBUDA 2007 GERMANY 1968 NIGER 1986 ARGENTINA 1975 GHANA 1998 NIGERIA 1994 ARMENIA 1992 GREECE 1987 NORWAY 1970 AUSTRALIA 2000 GRENADA 2010 PAKISTAN 1990 AUSTRIA 1973 GUATEMALA 1983 PANAMA 1977 AZERBAIJAN 1992 GUINEA 1996 PARAGUAY 1993 BAHRAIN x GUINEA-BISS x PERU 1973 BANGLADESH 1991 GUYANA 2005 PHILIPPINES 1988 BARBADOS 1997 HAITI 1982 POLAND 1993 BELARUS 1992 HONDURAS 1976 PORTUGAL 1986 BELGIUM 1971 HONG_KONG x ROMANIA 1993 BELIZE 2006 HUNGARY 1988 RUSSIA 1992 BENIN 1991 ICELAND 1990 SAO_TOME&PRINCIPE x BHUTAN 2004 INDIA 2005 SAUDI_ARABIA x BOLIVIA 1973 INDONESIA 1985 SENEGAL 1980 BRAZIL 1967 IRAN 2009 SEYCHELLES x BULGARIA 1994 IRELAND 1972 SIERRA_LEONE x BURKINA_FASO 1993 ISRAEL 1976 SINGAPORE 1994 BURUNDI 2009 ITALY 1973 SLOVAKIA 1993 CAMBODIA 1999 IVORY_COAST 1960 SLOVENIA 1999 CAMEROON 1999 JAMAICA 1991 SOUTH_AFRICA 1991 CANADA 1991 JAPAN 1989 SPAIN 1986 CAPE_VERDE_IS. 2004 JORDAN 1996 SRI_LANKA 1998 CENTRAL_AFR.R. 2001 KAZAKHSTAN 1992 ST.KITTS&NEVIS x CHAD 2000 KENYA 1990 ST.LUCIA x CHILE 1975 KOREA,_REP. 1977 ST.VINCENT&GRE 2007 CHINA 1994 KUWAIT x SWAZILAND x COLOMBIA 1975 KYRGZ_REP 1992 SWEDEN 1969 COMOROS x LATVIA 1992 SWITZERLAND 1995 CONGO 1997 LEBANON 2002 SYRIA x COSTA_RICA 1975 LESOTHO 2003 TAJIKISTAN 1992 CROATIA 1998 LITHUANIA 1994 TANZANIA 1998 CUBA x LUXEMBOURG 1970 THAILAND 1992 CYPRUS 1992 MACAO x TOGO 1995 CZECK_REP. 1993 MADAGASCAR 1994 TRINIDAD&TOBAGO 1990 DENMARK 1967 MALAWI 1989 TUNISIA 1988 DOMINICA 2006 MALAYSIA 2008 TURKEY 1985 DOMINICAN_REP. 1983 MALI 1991 TURKMENISTAN 1992 ECUADOR 1970 MALTA 1995 U.K. 1973 EGYPT 1991 MAURITANIA 1995 UGANDA 1996 EL_SALVADOR 1992 MAURITIUS 1998 UKRAINE 1992 EQ_GNEA 1999 MEXICO 1980 URUGUAY 1968 ERITREA x MOLDOVA 1992 UZBEKISTAN 1992 ESTONIA 1992 MONGOLIA 1998 VIETNAM 1999 ETHIOPIA 2003 MOROCCO 1986 ZAIRE 2009 FIJI 1992 MOZAMBIQUE 1999 ZAMBIA 1995 FINLAND 1994 NEPAL 1997 ZIMBABWE 2004
29

Table A-2: Replication of Desai & Hines (2005)
Dependent Variable: Openness in 2000
(1) (2) (3) (4) (5) (6) (7) (8)
Constant 1.0171 (0.0718
1.0171 (0.0692)
-36.4259 (16.3411)
-35.8126 (15.9678)
1.0944 (0.0634)
1.0773 (0.0629)
-33.7593 (16.2939)
-33.1655 (16.1255)
VAT Dummy -0.1557 (0.0853)
-1.4396 (0.3586)
-0.1945 (0.0795)
-0.1702 (0.0802)
VAT *ln (cgdp)
0.1486 (0.0404)
VAT share of tax revenue
-0.9723 (0.2814)
-4.1650 (1.3810)
-0.8283 (0.2613)
-0.7257 (0.2612)
VAT share*ln (cgdp)
0.3874 (0.1644)
GDP controls? N N Y Y N N Y Y
Geographic controls?
N N N Y N N N Y
No. Obs. 168 168 168 168 162 162 162 162
R-Squared 0.0197 0.0940 0.1767 0.2609 0.0743 0.1055 0.1968 0.2655
Dependent Variable: Exports Share in 2000
(1) (2) (3) (4) (5) (6) (7) (8)
Constant 0.4641 (0.0866)
0.4641 (0.0860)
-36.5841 (19.5696)
-34.6863 (19.8603)
0.4907 (0.0761)
0.4808 (0.0769)
-35.8227 (19.5125)
-33.9694 (19.8649)
VAT Dummy -0.0312 (0.1010)
-0.7420 (0.4157)
-0.0787 (0.0996)
-0.0863 (0.1046)
VAT *ln (cgdp)
0.0824 (0.0468)
VAT share of tax revenue
-0.2556 (0.3187)
-1.7139 (1.5798)
-0.1800 (0.3177)
-0.1713 (0.3306)
VAT share*ln (cgdp)
0.1783 (0.1892)
GDP controls? N N Y Y N N Y Y
Geographic controls?
N N N Y N N N Y
No. Obs. 151 151 151 151 151 151 151 151
R-Squared 0.0006 0.0212 0.0696 0.0985 0.0043 0.0102 0.0676 0.0958
30

31
Table A-3: Variable Description and Data Sources
Variable Description Source Imports # imports to U.S. by 3-digit NAICS
or 2-digit SIC USITC dataweb
Exports # exports from U.S. by 3-digit NAICS or 2-digit SIC
USITC dataweb
VAT dummy
=1 if country has VAT, =0 otherwise Ebrill, et al. (2001) and supra note 28
Landlocked =1 if country is landlocked, =0 otherwise
faculty.haas.berkeley.edu/arose/RecRes.htm
Island =1 if country is island, =0 otherwise faculty.haas.berkeley.edu/arose/RecRes.htm ComLang =1 if English is primary language, =0
otherwise faculty.haas.berkeley.edu/arose/RecRes.htm
FTA =1 if in FTA with USA, =0 otherwise www.ustr.gov/trade-agreements WTO =1 if member of WTO, =0 otherwise www.wto.org/english/thewto_e/whatis_e/tif_e/org6_e
.htm lnDISTANCE Log of distance from trading partner faculty.haas.berkeley.edu/arose/RecRes.htm lnGDP Log of trading partner’s GDP Penn World Table 6.3 OECD =1 if member of OECD, =0 otherwise www.oecd.org/pages/0,3417,en_36734052_36761800
_1_1_1_1_1,00.html CIT Sector-specific corporate income tax CBO (2006) OPEC =1 if member of OPEC, =0 otherwise www.opec.org/opec_web/en/about_us/25.htm