Embed Size (px)
Citation preview


An Industrial Policy to Boost Value Added and Exports 07
There is no shortage of manufacturing products in which Tunisia has the
potential to become a global leader

222 an industrial policy to boost value added and exports
T he previous chapters have highlighted that a key challenge for Tunisia is to transform its economic production structure to enable more value added forms of production. In fact,
although low skill jobs have helped lift many Tunisians out of poverty, they are not adequate to employ the increasing number of graduates entering the labor market each year. Hence, there is a need to build on Tunisia’s achievements so far by enabling (and not impeding) the structural transformation of the economy toward higher-skill activities and jobs creation. Our analysis identified key features of the competition and policy environment which have hindered the transformation, and which the government needs to address in order to foster a process of industrial upgrading. Assuming those fundamental issues are adequately addressed, there is a question as to any additional role that the government can play to accelerate growth. In this chapter we focus on policies to accompany the growth of industrial sectors. Services and agriculture face specific challenges and policies issues, and will be discussed in detail in the next two chapters.
This chapter explores the role the government could play in facilitating the process of structural transformation and economic development by supporting the growth of high-potential industries. There are a number of high-potential export sectors in which Tunisia is already doing well but which continue to remain underdeveloped largely as a result of the existing policy environment—fulfilling the potential of these existing export sectors should constitute a policy priority (World Bank2008c).Similarly, therearesectorswhereTunisiaenjoysastrongrevealedcomparativeadvantage but which have not yet developed and which may have good potential if properly harnessed (El Kadhi 2012). These high-potential sectors could bolster the process of structural transformation and become a source of dynamic growth and jobs creation, notably for graduates. The barriers to unleashing growth in high-potential sectors have been discussed in previous chapters: barriers to competition, distortions resulting from the onshore-offshore duality, excessive red tape, and failures in labor markets and the financial sector. In addition, Tunisia’s strategy and policies for industrial growth and services sectors also require rethinking—the current industrial policy places too much emphasis in providing (distortive) subsidies while too little attention is given to addressing coordination failures, strengthening logistics, and other “soft” aspects of the industrial environment.
7.1 / Untapped potential: An Industrial Sector ready to Climb Up the value Added ladder
A strategic approach to industrial policy entails focusing government action and attention on the most promising sectors. In this chapter we explore the industrial sectors in which
Tunisia appears to hold the highest potential, and that the government could seek to nurture. We draw upon existing analytical frameworks, such as the Growth Identification and Facilitation Framework (Lin and Monga 2010) and the Product Space Analysis (Hausmann, Hwang, and Rodrik 2007;HausmannandKlinger2007),toidentifyhigh-potentialindustriesandproductstodeepenand diversify exports (see also Mehchy, Nasser, and Shiffbauer 2012) 1.
In line with the Growth Identification and Facilitation Framework (GIFF), we compare Tunisia to a set of regional and international benchmark countries. Benchmark countries include those that
An Industrial Policy to Boost Value Added and Exports
07

223the unfinished revolution
are 100 to 300 percent richer than is Tunisia, have grown dynamically over the last twenty years, and have similar factor endowments. This approach is in line with the key selection criteria for benchmark countries proposed under the (first step of the) Growth Identification and Facilitation Framework (Lin and Monga 2010) 2. The idea underpinning the GIFF is that richer countries will tend to have moderately higher prices and wages, such that they may be losing the competitive edge in some of the products they have been exporting—and these changes represent an opportunity for countries that have broadly similar characteristics but are catching up in terms of income levels (and wages).
We then use revealed comparative advantage (RCA) and products space (PS) analysis to help identify export sectors that appear to hold potential. Traditional trade theory argues that welfare is maximized when countries specialize in goods they can produce relatively cheaply—that is, goods in which they have a comparative advantage 3. The traditional measure for identifying comparative advantage is the Revealed Comparative Advantage index 4. More recently the Product Space Analysis has also been proposed to look at countries’ export potential by mapping acountry’scurrentexportperformanceagainstglobalpatterns (HausmannandKlinger2007;seediscussionbelowandbox7.2).InlinewiththeGIFF,wenextlookatthechangesinRCAsinTunisia and the benchmark countries to identify sectors and products in which Tunisia may have potential to increase exports, both in terms of quantity and their value added content.
It is important to note up front, however, that these methodologies present shortcomings when used to identify high-potential products. These methodologies focus on exported products but ignore the role of imports (intermediates) in the production process. This is particularly important in the case of Tunisia since as discussed the domestic content of exported goods tends to be minimal—implyingthattheknow-howinvolvedintheproductsTunisiaexportsisminimal.Also,these measures are based on an analysis of a country’s current export structure, which is not necessarily the result of a true comparative advantage—rather it also reflects the policy distortions that have determined the current exports pattern. Again this is relevant in the case of Tunisia since, as discussed in previous chapters, the policy environment is characterized by distortions and barriers to the operation of markets, which hinder the development of the economy. Finally, these techniques look at export structure and do not take into account capabilities that have been developed through non-exporting manufacturing. It should be emphasized that these techniques are currently only applicable to traded goods (industrial and agricultural goods) but not to services.
dynamics Analysis of revealed Comparative Advantage in tunisia and Benchmark Countries
Tunisia should hold a clear advantage to export wage-intensive goods for which benchmark countries are losing their competitive edge. Following the GIFF approach, we seek to identify export potential by assessing whether benchmark countries with similar endowments are becoming less competitive in the production of some of their exports. In recent decades, increased wages in higher-income countries, combined with a reduction in transportation costs, have shifted significant production from higher-income countries to lower-income countries. In fact Tunisia’s wages have remained relatively low compared to its benchmark countries, which could provide an important advantage for Tunisia to produce and export more wage-intensive goods with a stable or increasing global demand, and where production costs in fast-growing benchmark countries have become relatively expensive.
An analysis of Tunisia’s RCAs reveals that the sector with the largest number of products with high revealed comparative advantage is the textile sector, followed by the mechanical and electrical industry.Outofa totalof148products forwhichTunisiahasanRCAaboveone,39products

224 an industrial policy to boost value added and exports
belongtotextilesandeighttotheleatherandfootwearindustry(annex7.1).Tunisiahasalso19 products in the mechanical and electrical industry with a revealed comparative advantage. SomeagriculturalproductsalsohavehighRCA.OfTunisia’s148productswithanRCAaboveone,globaldemandfor82productshasbeendecliningbetween2000and2010.Sectorswithstrong export growth and global demand growth are fertilizers and some mechanical products such as television receivers, electric motors, and insulated cables.
Our analysis highlights that benchmark countries have seen their RCAs decline in several industries and sectors in which Tunisia already enjoys a good RCA, such that it could take advantage of the expected shifts in production away from benchmark countries. In line with our expectation, an analysis of changes in RCAs in benchmark countries over the past decade confirms asignificantdeclineintheirRCAsinafewwage-intensiveindustries(annex7.2).Inseveralofthese sectors and products, Tunisia has a good RCA; and in many of them it has seen its RCA increase over the past decade (in contrast with benchmark countries). Further, many of these products, though not all, have experienced an increase in global demand over the past decade. Torefinetheanalysis,wedistinguishthesesectorsandproductsinfourgroups(seetable7.1forasummaryatthe3-digitsectorlevelandannex7.3fordetailsatthe4-digitproductlevel)5. We are particularly interested in Group 1, which highlights industries and sectors in which Tunisia holds high potential to increase its share of exports in the midst of increasing global demand. The results highlight that closely related industries and sectors at the 4-digit level may be in different groups, such that overall the analysis reveals potential in a number of sectors likely to move out of benchmark countries, notably: (a) textile and garment, (b) leather and footwear, (c) electrical and mechanical industry and transport equipment, (d) chemical products, (e) glass, iron, and metal materials for construction, and (f) home furniture and sanitary. Tunisia appears to hold potential in these sectors to a different degree, and the various individual products hold more or less promise depending on the evolution of global demand. It is also worth noting that several of these sectors are classified (according to United Nations Industrial Development Organization, UNIDO) as medium-skill and high-skill sectors, and as such they include segments that could provide jobs for graduates.
Based on these results, the GIFF proposes a policy approach to nurture the development of this potential without introducing distortions. The GIFF basically suggests how the authorities can facilitate the trial-and-error process that successful industrial development always involves (Lin and Monga 2010). For high potentialindustriesandsectorsinwhichsomeprivatedomesticfirmsarealreadypresent,suchasthoseidentifiedinGroup1orGroup2,theauthoritiesshouldidentifyconstraintstotechnologicalupgradingor furtherfirmentryandtakeaction to removesuchconstraints.Hereweprovideabriefdiscussionfocusingontextilesandtheelectronicandelectricalsectors(box7.1),butitwillbeimportanttocarryoutin-depthsectoralstudiestoidentifysignificantcoordinationfailuresorothersector-specificconstraints.Inindustrieswherenodomesticfirmsarepresent,suchasthoseidentifiedinGroup4,policymakersmaytrytoattractforeigndirectinvestment(FDI)fromthebenchmarkcountriesororganizenewfirmincubationprograms.Thegovernmentcouldalsocompensatepioneerfirmsintheindustriesidentifiedabovewithtaxincentivesforalimitedperiodand/orco-financingtheinvestments.Thatsaid,beyondtheindustriesidentifiedabove, thegovernmentshouldalsopayattention tospontaneousself-discoverybyprivateenterprises and support the scaling up of successful private innovations in new industries. In this context, specialeconomiczonesorindustrialparksmaybehelpfulinovercomingbarrierstofirmentryandFDIand in encouraging the formation of industrial clusters.

225the unfinished revolution
Group 1: Sectors with an increasing RCA while global demand is increasing
Chemicalproducts-woodbased 13,28% 63,12% 98,74% 143,08% HighskillLeatherindutry(includingfootwear) 205% 240% 476% 43% Lowskill&ressourcebasedTextile 143% 7080% 11003% 55% Lowskill&ressourcebasedMiscellaneous-Textile 320% 814% 928% 19% Lowskill&ressourcebasedGlassandMetal 92% 1120% 1277% 24% Lowskill&technointensiveMachinery (for agriculture and mining) 43% 345% 530% 43% Medium skill&techno intensiveElectricindustry(wiresandcables) 1282% 85% 94% 5% Mediumandhighskill&technointensivePreciseinstruments(medicalinstruments) 91% 336% 467% 30% Highskill&technointensiveMechanicalandtransportmaterial(cycles,ships,andboats) 228% 143% 255% 52% Mediumskill&technointensiveDiverse manufacturing (jewellery and basketwork) 51% 2030% 3062% 35% High and low skill&techno intensive
Group 2: Sectors with an increasing RCA while global demand is decreasing
Textileandgarment(syntheticfiber,yarn,cottonfabrics,carpets) 538% 702% 450% -37% Lowskill&ressourcebasedLeather(sadleryandharness) 253% 28% 13% -11% Lowskill&ressourcebasedMetalandMachinery 70% 20675% 17135% -18% Low&mediumskill&technointensive&resourcebasedMechanical(motorcycles,othervehicles) 8% 402% 299% -15% Mediumskill&technointensiveFurniture and sanitary 236% 22% 6% -14% Medium skill&techno intensiveDiverse manufacturing 166% 504066% 354609% -22% Low & medium/high skill & techno intensive & resource based
Group 3: Sectors with a decreasing RCA while global demand is increasing
Chemicalproducts 37% -43% -27% 37% HighskillFertilizers 4674% -62% -28% 83% HighskillMetal,toolsandmachinery(forwashinganddrying) 17% -66% -57% 23% Lowandmediumskill&technointensiveMechanicalindustry 18% -18% -9% 11% Mediumskill&technointensiveFurnitureandsanitary 68% -58% -55% 8% Low&mediumskill&technointensiveElectricindustry(domesticitems) 9% -39% -27% 20% Low&mediumskill&technointensive&resourcebasedTextileandfur(dressesandapparels) 153% -47% -35% 23% Lowskill&ressourcebased(mediumskillinalowerextend)Diversemanufacturing(umbrellasandotherproducts) 51% -80% -71% 38% Lowskill&technointensive
Group 4: Sectors not produced in Tunisia or with a very low RCA while global demand is increasing
Metalandmachinery 1,83% - - 43,51% Lowskill&technointensiveTransportmaterial(railwayandtramwayfreightandtracks) 1,31% - - 29,89% Lowskill&technointensive
tunisian tunisian global rca's market share demand's tunisian evolution evolution evolution rca in 2010 since 2000 since 2000 since 2000 skills
Table 7.1: Synthesis of GIFF Analysis (First Step): Identifying Industries and Sectors in Which RCAs Decreased in Benchmark Countries, 2000-2010, and in Which Tunisia Has a High RCA
Source: Authors' calculations

226 an industrial policy to boost value added and exports
garment, textile, and leather productsThe garments, textiles, and leather sector accounts for nearly one quarter of total Tunisian exports and nine percent of employment. About eight percent of low-skilled workers are employedinthissector(approximately280,000people)—inparticularitisaveryimportantsector for the employment of low-skilled women in Tunisia. Textile exports as a share of Tunisia’s total exports have been declining with the phasing out of the multi-fiber agreement in the mid-2000s. More generally, the MENA region has been losing market share in textiles against the background of a dramatic increase in Chinese and Indian exports and strong performance by Bulgaria and Turkey. At the same time, global demand for many products in the sector has been declining steeply.Nevertheless, Tunisia’s RCA in several textile export goods has been increasing in recent years (notably for yarn of regenerated fibers, synthetic fabrics, and carpets). This reflects the fact that wages in the textile sector have increased in benchmark countries and other textile exporters—andthismayopenawindowofopportunityforTunisia.The future of Tunisia’s textile sector is likely to depend on whether it will be able to take advantage of its proximity to the European Union. Demand for garments (which offer prospects of higher value added) in the EU tends to be quite heterogeneous, with many smaller producers ordering small batches of customized garments relative to the United States. Responding quickly to changes in client demand, reducing time of production and increasing reliability of exports will be critical in order to meet expectations of EU clients. More standardized apparel articles, however, will probably face fierce competition from Asian countries. Access to cheap inputs will be pivotal in terms of competitiveness because fabric costs tend to represent 60 percent of free-on-board prices. At present, inputs from many countries are subject to relatively high tariffs in Tunisia (World Bank 2010a). Also, the textile sector’s competitiveness is very sensitive to wage increases. Although productivity in Tunisia’s textile sector seems to be similar to regional benchmark countries, wages in the textile sector tend tobehigher—notonlycomparedtocountriesintheregionbutalsotoTurkeyandsomeAsiancountries. For comparison, Egyptian and Jordanian wages are lower than or comparable to those of most Asian exporters, giving these countries an advantage with respect to Tunisia (World Bank 2010a).Contrary to that for textiles and garments, global demand for leather products on average has been steadily increasing. Although Tunisia produces only a few leather products, the Tunisian leather sector accounts for just over one percent of employment (approximately 31,000personsin280companies,ofwhich212aretotallyexportingfirmsemployingabout29,000 persons). Today this sector is dominated by cutting and assembly. Tunisia does not produce its raw material, which it mainly imports from Morocco. While Tunisia’s cost advantage in producing exports of leather goods seems to be mainly driven by low wages, RCAs of leather products have decreased in most benchmark countries with the exception of Turkey, Portugal, and the Slovak Republic, suggesting that this could be a high-potential sector. Electronics and Electrical EquipmentThisindustryhasslowlydevelopedduringthe1980sbehindthecurtainsofimportsubstitutionpolicies, building on existing production capacities in machinery, tools, and welding. These
Box 7.1: Role of Government in the Further Development of Tunisia’s Key High-Potential Exports

227the unfinished revolution
exports have experienced significant growth from 2000 to 2010—it has been one fastestgrowing export segments with an annual growth rate of nearly 20 percent between 2006 and 2010, and it has become Tunisia’s largest export category as of 2010. It includes insulated electrical wire, cables, and radio broadcast receivers. About 93 percent of its total production was exported in 2010. A large part of this sector is geared toward the production of automobile components-composedof threecomponents (mechanical,electrical,andrubber),cablingrepresents89percentofexportsandmostof theseexportsare for theautomobile industry.Since1980,insulated electric wires and cables and electrical apparatus such as switches and relays have seen the largest increase of the nine electrical products whose export share is over one percent in the Tunisian portfolio. Unlike Tunisia, benchmark countries have increased their RCA in many different products of the electrical and electronics industry. Tunisia has also been outstripped by Morocco, which developed a better strategy to attract investors.Tunisia has remained stuck in the low-skill segment mainly producing cables. In fact production of cabling beams in Tunisia largely consists of labor-intensive assembling tasks. Rawmaterialsaloneaccountformorethan70percentoftotalproductcosts.Thisactivityisalso very sensitive to increase of wages for low-skilled workers. In addition, the industry is dependent on fiscal incentives (see Chapter Four). Similar to textiles, the sector benefits from Tunisia’s proximity to Europe. The sector has synergies with the plastics or metal industries. The main issues holding back a further development of the sector and related components are political and social stability. Both have been pinpointed as imperative for this sector’s development given the large up-front investments involved. Other key constraints seem to be logistical costs, delays in production, and adherence to strict quality standards. Process innovation, logistical improvements, and an efficient banking sector are also likely to be important for strengthening this sector.
tunisia’s product Space Analysis 6
Recent research noted that changes in the revealed comparative advantage of nations are governed by the pattern of relatedness of products at the global level. The product space analysis closely complements the analysis of RCAs presented in the previous section. It provides a dynamic representation of the changes in Tunisia’s RCAs, highlighting the potential for Tunisia to diversify into new products based on an analysis of global export patterns. As countries change their export mix, there is a stronger tendency to move toward related goods rather thantogoodsthatarefartheraway(HausmannandKlinger2007;box7.2).Theproductspaceanalysis is based on the assumption that it is easier for a country to export a new product if its factors of production are already used in the production of other goods in this country (HaussmannandKlinger2007).Theproductspaceanalysisrepresentsthisideagraphically.Thedistance between two products is measured as the conditional probability that an exporter with a revealed comparative advantage (RCA) in the product X also has a RCA in product Y 7. This approach builds on the empirical evidence that countries tend to diversify into products close to those they are already specialized in (exporting). Interestingly, it also follows that countries specialized in more “connected” products, whose production requires capabilities used for the production of other goods, are able to upgrade their exports basket more quickly.
228 an industrial policy to boost value added and exports
The product space analysis is based on the assumption that producing goods requires not only machines, raw material, and labor but also specific knowledge. Some of this knowledge canbe readily accessed through manuals, the internet, or by asking experts, but the acquisition of some knowledge—for example, how to run a garment factory—is costly and time consuming, and this type of knowledge is hard to transfer. Hausmann, et al. (2011) refer to this knowledge as “capabilities.” The production of one good tends to require the interaction of individuals with different capabilities. As the complexity of goods increases so does the number of differentcapabilities required to produce a given good. Although the combination of capabilities is unique to a product, production of some goods may require more or less similar capabilities. Moving into a new industry may be easier if the capabilities needed to produce this good already existinthecountry.Firmsthatventureintonewproductsmayfindithardtosecurealltherequisitecapabilities. Some capabilities, such as accounting or human resource management, may be readilyavailable.Butothers,especiallythosethatarespecifictotheproductionofthisgood,maybehardtofind.Specificinfrastructureneedssuchascoldstoragetransportationsystemsmaynotexist,specificregulatoryservicesmaybedifficulttoobtain,researchanddevelopmentcapabilitiesrelated to that industry may not be there, and so on. Moving into a new product may therefore be easier if most of the capabilities required for producing this product are already available in the country. The basic representation of the product space is identical for all countries because the measure of distance between products is computed based on the relative exports shares (and GDP) of all countries. The product space illustrates the existence of a densely connected core and several peripheral clusters. If a country has RCA in many products close to the core or one of these clusters, it has a better future diversification potential. Moreover, the products with high-productivitycontent are typically located in the core of the product space (for example, vehicles, machinery, or chemicals) and the electronics cluster. It follows that a country has a better potential to diversify into higher-value added products if it already hosts export successes in several products close tothedenselyconnectedcoreorelectronicscluster.HausmannandKlinger(2007)andHidalgoetal.(2007)arguethatacountry’scapacitytodiversifyexportsdependsonwherethiscountryproduces in the product space. If a country is producing goods in a dense part of the product space, theprocessofexportdiversificationismucheasierbecausethesetofacquiredcapabilitiescanbe easily redeployed to other nearby products. However, if a country is specialized in peripheral products, this redeployment is more challenging because the distance in capability space is more substantial.Source: Hausmann, et al. 2011; Hausmann and Klinger 2007; For more information visit: http://atlas.media.mit.edu/
Box 7.2: The Product Space Analysis
Tunisia’s product space map is significantly less developed in the densely connected core compared to that of its benchmark countries. Tunisia’s appears to be significantly less developed in the densely connected core when compared to countries such as Croatia, Thailand, or even Indonesia (see Sahnoun and Schiffbauer 2012) 8. Compared to these peers, Tunisia has lower significant export shares in world markets in the industrial core of the product space which includes higher-value added industries such as electronics, chemicals, industrial machinery, and so on (figure 7.1). Given the potential wage cost advantage, Tunisian firmsmay have acomparative advantage in branching out in these markets.
When considering changes in Tunisia’s product space over time, we clearly see the emergence of new products in the electronics cluster. The dynamic illustration of the product space shows the changes in RCAs of Tunisian export products over the last decade in the context of the global exportsproductspace(figure7.1).Thegraphdifferentiatesbetweenfourdifferentcategoriesof

229the unfinished revolution
Tunisian exports. First, the blue triangles refer to the classic products in which Tunisia had an RCAalready intheperiod2000−2002andalso in2007−2009.Second,disappearingproductsare represented as red squares and reflect products in which Tunisia had an RCA in the period 2000−2002butnot2007−2009.Third,emergingproductsarerepresentedasgreendiamondsandshowproducts inwhichTunisiahadanRCAin2007−2009butnot in2000−2002.Finally,marginalproductsreflectproductswhereTunisiahasnotyetacquiredanRCA(0.5<RCA<1)buthasexperiencedpositivegrowth(of10percentofhigher)since2000−2002andarerepresentedas yellow pentagons.
The dynamic illustration of the product space shows that Tunisia continues to have a number of classic products (blue triangles) with RCAs and has gained several RCAs in the closely connected core (green diamonds). Tunisia continues to have a number of classic products with RCAs in the textiles and garments area (blue triangles, figure 7.1) and has gained several RCAs inthe electronics and closely connected cores (green diamonds). Tunisia has gained RCAs in 11 product categories close to the densely connected core or the electronics cluster over the last decade. These are mainly in manufactures of metals as well as iron and steel manufacturing (for example, articles of iron or steel, other sheets and plates of iron or steel, structures and parts of structures, iron), or construction materials. Likewise, Tunisia had an RCA in four classic products (blue triangles) in the electronics cluster and in electrical components close to the core in2000−02andgainedfiveadditionalRCAsconnectedtothatclusterin2007−09(forexample,calculating machines and cash registers, electrical lines for telephone, other electrical machinery and equipment, television receivers, and off-line data processing equipment). These products arehigh-technologygoods (withanaveragePRODYofUS$19,000) 9. Specifically, Tunisia had gainedcompetitivenessinfourhigh-PRODYgoodspriorto2000−02andmanagedtoacquireRCAin six additional goods over the past decade. For example, it is now successfully exporting two types of television receivers. Moreover, Tunisia had an RCA in boxes and packaging containers in 2000−02andgainedRCAsincloselyconnectedproductsby2007−09,suchasmetalcontainersfor storage and transport (casks, drums, boxes of iron or steel) and sugar confectionery and
Source: Sahnoun and Schiffbauer (2012); based on "World Trade Flows: 1962-2000" dataset, The Observatory of Economic Complexity website.
Figure 7.1: DynamicRepresentationofchangesinTunisia’sProductSpace,2000−2002to2007−2009

230 an industrial policy to boost value added and exports
chocolate. The analysis also shows that Tunisia has a growing RCA in numerous additional products close to the closely connected core (yellow pentagons).
The product space analysis suggests Tunisia has the potential to expand its production and exports of goods it already produces, and also has growing opportunities to diversify into new products related to those it currently exports. As noted above, Tunisia has a high revealed comparative advantage in a wide range of goods it already exports, notably in several products in the textile and leather sector and in the mechanical and electrical industry. The product space analysis also highlights high-potential products in areas ranging from textile and fabrics, machinery and electronics, chemicals, and construction materials to food processing. As discussed above, for several of these products global demand has been consistently growing during the past decade. According to this analysis Tunisia has significant potential to expand in several of its existing subsectors/products; however it will be important to carry out in-depth sectoral studies to identify any significant coordination failures or other sector-specific constraints.
looking at Intensive and Extensive margins
One further way to analyze existing sectors with the potential to grow in the future is to analyze how different sectors in Tunisia perform relative to market trends. Exports can grow along two dimensions: a country can export more of the same goods (the intensive margin) or export new goods (the extensive margin) 10. The product of the two margins is the share of the country’s exports relative to the rest of the world.
Tunisia’sexportsdeclinedattheextensivemarginoverthepastdecade,reflectingthefactthatitsexportbasket is heavily dominated by goods that have experienced a slow growth in global trade. Similar to its benchmark and regional comparators, Tunisia’s exports declined at the extensive margin over the past decade. In fact, Tunisia’s decline in the extensive margin was steeper than in most benchmark countries andregionalcomparators(figure7.2).Inaddition,unlikecomparatorcountries,Tunisiadidnotexpandits exports at the intensive margin. Most dynamically growing benchmark countries, with the exception of Malaysia, faced a decline in their extensive margin but were able to increase their export share by expandingattheintensivemargin(figure7.2)11. The Arab Republic of Egypt’s export growth was to a large extent the result of an increase of its export portfolio along the intensive product margin 12.
98969492908886848280
88
86
84
82
80
78
86
740 0 0,05
CZE
MLYKORPOL
TUN
TUNMOR
EGY
JOR
SVK
0,1 0,15 0,2 0,251 2 3 4Exte
nsiv
e Pr
oduc
t M
argi
n
Exte
nsiv
e Pr
oduc
t M
argi
n
Intensive Product Margin
b) Regional comparators
Intensive Product Margin
Source: WITS Comtrade using H2 classification at 4-digit level; data for Egypt is available only for 2008-2012; authors’ calculationsNote: Czech Republic (CZE), Egypt (EGY), Jordan (JOR), Republic of Korea (KOR), Malaysia (MLY), Morocco (MOR), Poland (POL), Slovakia (SVK), Tunisia (TUN).
a) Benchmark countries
Figure 7.2: Evolution of Intensive and Extensive Product Margin, 2002-2011

231the unfinished revolution
Thisweakperformance reflects the fact thatTunisia’sexportportfolio is concentrated ingoods thathave been losing importance in global trade. Global demand for many products related to traditional, non-synthetictextilesorleatherproducts,thekeypillarTunisianexports,hasbeenshrinking(figure7.3).Demandforelectricalcableshasbeengrowingslowly.Fertilizer(aboutfivepercentofTunisia’sexports),electrical equipment (mainly switches), television receivers, and medical instruments are Tunisia’s only export products with an export share above one percent on annual growth rate of world demand above two percent.
Tunisia’s low export penetration suggests theremay be significant scope to increase its exports byexporting more of the products it already sells. One potential way of expanding exports at the intensive margin is by exporting existing products to new markets. To measure the scope of increasing exports along this line, Brenton and Newfarmer (2009) developed the export penetration index. This index is definedas the shareofpotentialdestinationmarkets thatactually import theproducts thatagivencountry exports 13. Tunisia exports only to about seven percent of the countries that import its export goods,suggestingthattheremaybesignificantscopeforTunisiatoexportmoreofexistingproducts(figure7.4).ItseemsthatTunisiapoorlyexploitsopportunitiestosellitsproductsabroadandinitsownregion. In fact, its index is far below that of comparator countries and particular weak for exports to its own region and to the United States.
Figure 7.3: Tunisia’s Main Exports and Evolution of World Trade, 2002-2011
Electric cableFertilizersTV receiversSalts and peroxysaltsElectric machineryOther electric machinery
Petrol and oilsTrousers and breechesInorganic acidsPhosphateAccessories of motorsElectric generatorsParts of interior engines
Outer garmentsFootwearOlive oilPlastic (Miscellaneous)Jerseys and pull-oversPrinted circuits
Electric apparatusOther outer garmentsUnder garmentsFruitsParts of footwearMedical instruments
Source: WITS Comtrade; authors’ calculations
0%-2%-4%-6% 2% 4% 6% 8% 10%
14%
12%
10%
8%
6%
4%
2%
0%
Expo
rt s
hare
in T
unis
ia (
2010
)
Annual Growth Rate

232 an industrial policy to boost value added and exports
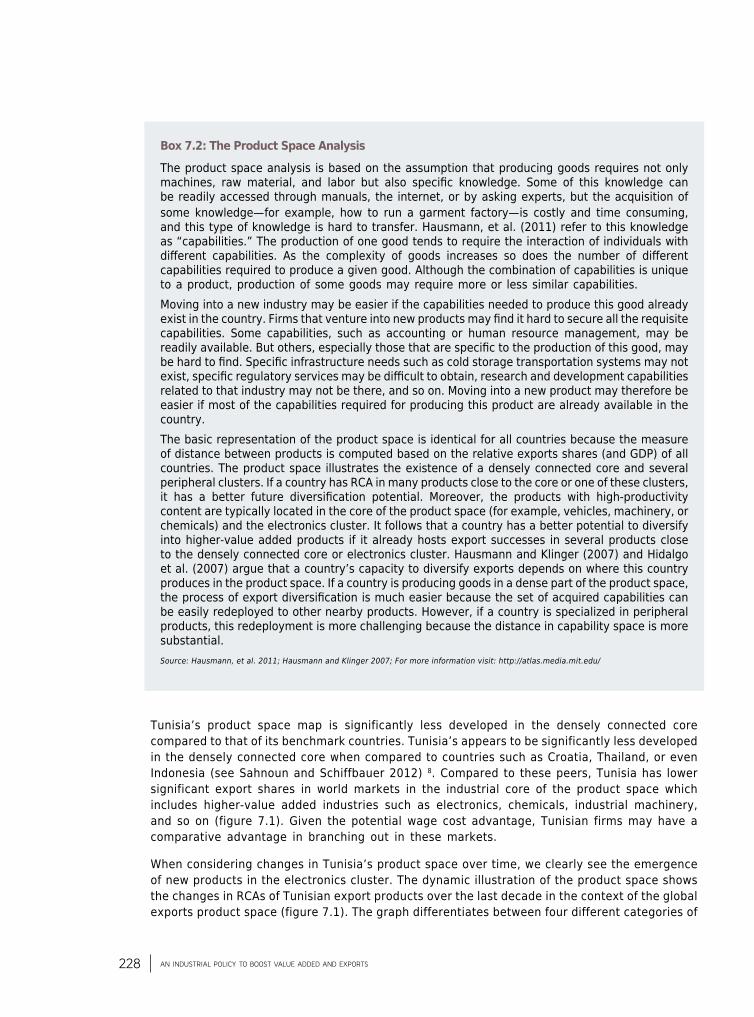
Just focusing on exports to the EU, it is clear that Tunisia has only started to scratch the surface of the potential for exports there. As discussed in Chapter One, the potential for Tunisia to expanditsexportstotheEUremainsfarlargerthanthepotentialinAfricaorMENA(figure7.5).The value of Tunisia’s exports as a share of total EU imports (or GDP) remains insignificant, and indeedTunisiahardlyexports tomostof theEU-28countries (figure7.6).Hence,while itis true that Tunisian exports are concentrated toward the EU and that the growth prospects for the EU are quite limited, these countries present a much greater purchasing power than MENA or Africa. Geographical diversification is of course a significant objective, but it is important to underlinethatthemarketpotentialofferedbytheEU-28remainsbyfarthegreatestopportunityfor Tunisia. Hence, in the short to medium term, in parallel with a push to foster greater trade integration across the Maghreb and with the broader MENA region and the Africa region (World Bank 2012a) 14, Tunisia should continue to seek deeper integration with the EU-28 (that is,beyond France and Italy) (World Bank 2014h).
Figure 7.4: Export Penetration Index, 2002-2011
Figure 7.5: Tunisia’sExportsandRegions’Importsin2007(currentUS$)
40
35
30
25
20
15
10
5
0Korea,
RepPoland
UE MENA Africa
CzechRepublic
Portugal Malaysia Slovak Republic
Mar
ket
shar
es %
Egypt, Arab Rep
Morocco Tunisia Jordan
2002-052006-08 2009-11
Total Tunisia's exports to UE Total UE's imports
Total Tunisia's exports to MENA Total MENA's imports
Total Tunisia's exports to Africa Total Africa's imports
7E+12
6E+12
5E+12
4E+12
3E+12
2E+12
1E+12
0
7E+12
6E+12
5E+12
4E+12
3E+12
2E+12
1E+12
0
7E+12
6E+12
5E+12
4E+12
3E+12
2E+12
1E+12
0
Source: WITS Comtrade; authors’ calculations.
Source: WITS Comtrade; authors’ calculationsNote: Africa refers to Sub-Saharan Africa only
233the unfinished revolution
In sum, Tunisia should focus on creating a level playing field as a prerequisite to increase the intensive margin of its exports and diversify its export portfolio toward products that have a growing global market share. As discussed in Chapter One, the low export penetration reflects the nature of Tunisia’s economic model, which remains focused on assembly and other low-value added tasks for France and Italy. This is largely the result of the policy environment that has prevented companies from climbing up the value added chain. Indeed, as discussed above, Tunisia appears to have great potential to deepen value addition in several of its existing exports and to branch out into closely related products. We next turn to the policies that will be required to realize this potential.
7.2 / Moving Toward a More Effective Industrial Policy
I n recent years, Tunisia has tried to move toward higher-value added production and a knowledge-intensive economy in an effort to absorb the increasing number of unemployed graduates. The
design and objectives of Tunisia’s industrial strategy are summarized in the National Industrial Strategy 2016 (Stratégie industrielle nationale à horizon 2016). The strategy targets a wide range of different groups such as exporters, foreign investors, small and medium-size enterprises, and specific high-value added sectors, using a wide range of different policy instruments. It identifies textiles; food processing; and the mechanical, electrical, and electronics industries as priority sectors. It also added two services sectors to this historical list: information and communication (ITC) and business process outsourcing (BPO). The strategy’s objective is to double exports between2008and2016andmovebeyondtraditionalsectorstomoresophisticatedsectorstocreate jobs and raise value added.
Tunisia’s industrial strategy remains centered on the Investment Incentives Code and preferential treatment for export sectors. The preferential offshore regime (which eventually was enshrined in the Investment Incentives Code in 1993) has been the central pillar of Tunisia’s industrial policy since theearly1970s (annex7.4).Asdiscussed inChapterOneandChapter Four, thedualistic model supported Tunisia’s development until the 1990s; but in recent years it has increasingly hampered Tunisia’s economic development and prevented Tunisia from progressing
Figure 7.6: Tunisia’sExportstoEUandEU’sImportsbyCountriesin2007
German
y
Finlan
d
Polan
d
Austri
a
Franc
e
Portu
gal
Belgium
Greece
Czech
Repub
lic
Bulgari
a
Hanga
ry
Roman
ia
Cyprus
Irelan
d
United
Kingdo
m
Danem
ark
Luxe
mbourgIta
ly
Slova
k Rep
ublic
Spain
Malta
Latvi
a
Slove
nia
Eston
ia
Netherl
ands
Lithu
ania
Swed
en
1,4E+12
9E+11
4E+11
-1E+11
Tunisia's Exports EU countrie's Imports
Source: WITS Comtrade; authors’ calculations.
234 an industrial policy to boost value added and exports
to the next stage of development. In fact, as also discussed in Chapter One and Chapter Four, the segmentation and distortions associated with the onshore-offshore duality actually prevented Tunisia from moving into higher-value added production and better jobs for graduates. As mentioned in Chapter Four, the Investment Code is now in need of profound revision.
Although the focus of Tunisia’s industrial strategy aims toward higher-value added sectors, in fact it has achieved the opposite results. Over the past decade, Tunisia has tried to move toward higher-value added production and a knowledge-intensive economy in the belief that this could address the increasing problem of graduate unemployment. However, as discussed in previous chapters, adopting a strategy designed to create a knowledge-intensive economy without addressing the underlying obstacles to private sector development (namely, the barriers to competitive pressures, the excessive regulatory burden, the pervasive cronyism, and the profound policy-induced distortions) has resulted in continued dependence on assembly and other low-value added production in Tunisia.
Beyond the problems with the underlying environment and the Investment Incentives Code, the design and implementation of instruments and programs needs rethinking. Tunisia’s industrial policy spans a wide range of different objectives, sectors, and instruments, many of which have been in place for decades and do not appear to have been effective15. An arsenal of instruments has been mobilized to support firms, ranging from market-access restrictions to protect incumbents, tax incentives, and horizontal and sector-specific programs and support institutions (annex 7.5)16. In addition to abundant duplication and overlap, many support programs are distortionary because they largely extend support to selected firms rather than providing horizontal sector-wide support to sectors. As a result firms—even within preferredsectors—faceahighlyunevenplayingfield,whichislikelytodiscouragefirmentry(aswellasexit of insiders) and depress productivity growth (see Chapter One and Chapter Two). Also, the focus on market-access restrictions, fiscal incentives, and firm-specific interventions opens the door to rent seeking (see Chapter Two and Chapter Three). Some private sector representatives have gone as far as arguing that Tunisia’s industrial policy may actually impede innovation as
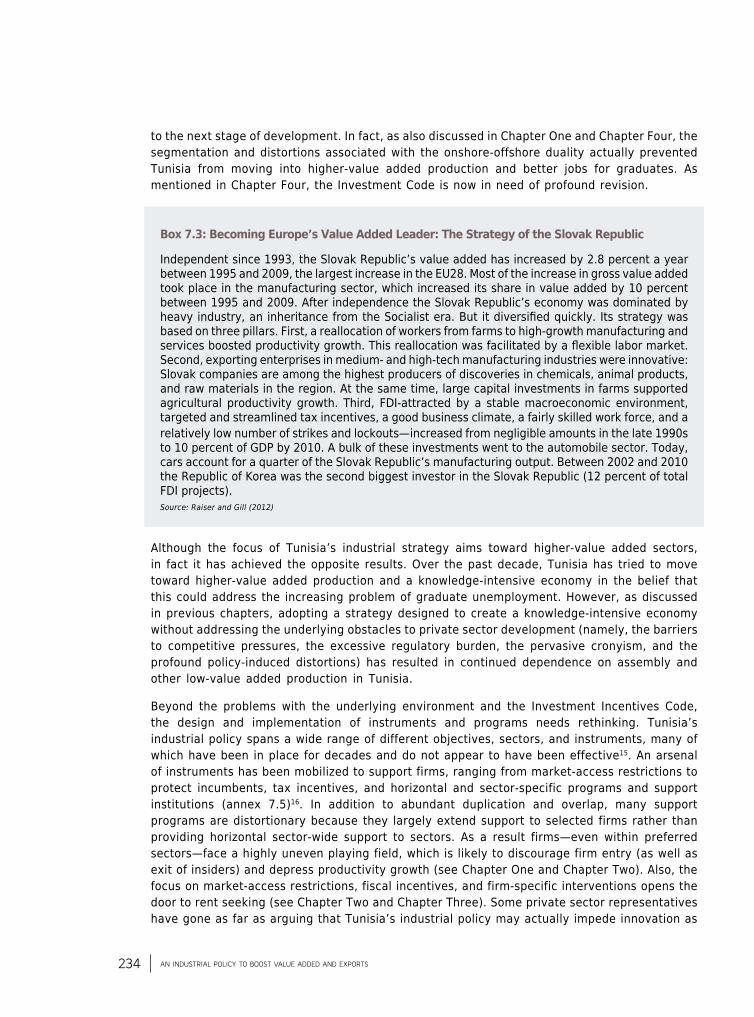
Independentsince1993,theSlovakRepublic’svalueaddedhasincreasedby2.8percentayearbetween1995and2009,thelargestincreaseintheEU28.Mostoftheincreaseingrossvalueaddedtook place in the manufacturing sector, which increased its share in value added by 10 percent between 1995 and 2009. After independence the Slovak Republic’s economy was dominated by heavyindustry,aninheritancefromtheSocialistera.Butitdiversifiedquickly.Itsstrategywasbased on three pillars. First, a reallocation of workers from farms to high-growth manufacturing and servicesboostedproductivitygrowth.Thisreallocationwasfacilitatedbyaflexiblelabormarket.Second, exporting enterprises in medium- and high-tech manufacturing industries were innovative: Slovak companies are among the highest producers of discoveries in chemicals, animal products, and raw materials in the region. At the same time, large capital investments in farms supported agricultural productivity growth. Third, FDI-attracted by a stable macroeconomic environment, targeted and streamlined tax incentives, a good business climate, a fairly skilled work force, and a relatively low number of strikes and lockouts—increased from negligible amounts in the late 1990s to 10 percent of GDP by 2010. A bulk of these investments went to the automobile sector. Today, cars account for a quarter of the Slovak Republic’s manufacturing output. Between 2002 and 2010 the Republic of Korea was the second biggest investor in the Slovak Republic (12 percent of total FDI projects).Source: Raiser and Gill (2012)
Box 7.3: Becoming Europe’s Value Added Leader: The Strategy of the Slovak Republic

235the unfinished revolution
private firms are unlikely to invest unless their innovation falls in government priority sectors with access to public funds. Further, government support is not conditioned on success and has become entrenched over time.
Perhaps more important, the government’s focus on promoting specific sectors has diverted attention away from cross-cutting reforms and addressing coordination failures. As discussed below, empirical evidence shows that reforms in the business climate, improving access to finance, or increasing the provision of public goods and addressing sector-specific coordination failureshavethehighestreturnintermsofboostinginvestment(seealsobox7.3).Theseissuesdo not appear to be at the center of government policy focus in Tunisia, however. For instance, customs continue to pose a substantial barrier to import and export operations (see Chapter ThreeandChapterFour),andmoregenerally—asdiscussedinChapterThree,ChapterFour,andChapterEight—theoperationsoftheportsandairportsremainsinadequate.Atthesametime,the government does not seem to focus on identifying and removing sector-specific constraints, such that bureaucratic hurdles and coordination failures remain unaddressed. For instance, as discussed in Chapter Nine, the trucking sector (freight transportation) is hampered by the lack of logistical coordination, which is likely the main reason for high costs and the resulting high prices. Also, while the government has made an effort to foster industrial clusters with technopoles and incubators (“pépinières”), these efforts remain half-hearted and implementation has been marred by problems17.
What Role for the State in an Effective Industrial Policy?
Fromatheoreticalpointofview,industrialpolicy—thatispoliciesdesignedtopromotespecificindustries or groups of firms—can be welfare enhancing under certain conditions. Theorysuggests that industrial policy can enhance welfare in the presence of externalities. These externalities can result from local (“Marshallian”) externalities, inter-industry externalities, and specific types of coordination failures or information spillovers. Marshallian externalities refer toexternalitiesaffectingagents in thesamegeographicalarea—forexample, throughhumancapitalspilloverswithinaspecificareaorinfrastructure—whichtendtodisappearasthesectorbecomes large (see, for example, Fujita and Thisse 2002; Rosenthal and Strange 2004). Harrison and Rodriguez-Clare (2010) show that, in the presence of these externalities, protection of a sector may be welfare improving as long as protection is temporary and short-run costs not too high 18. Protection of a specific industry can also be welfare enhancing if this protected industry generates positive externalities with the rest of the economy.
Empirical evidence suggests that designing effective industrial policy that distorts prices in support of specific sectors is difficult and likely to result in failure (box 7.4).Harrison andRodriguez-Clare (2010) find little evidence that industrial policy intervention that distort prices, such as tariff protection or production subsidies, are beneficial19. Notably, abundant international experience has warned against ‘seeking to pick winners’ (i.e. seeking to identify new ‘high potential’ sectors). Industrial policies focused on identifying high-potential industries for import-substitution have failed in many countries in Latin America and Sub-Saharan Africa. This is because the discovering new export is a process of significant trial and errors, and government does not have the information to be able to make good choices. Easterly et al. (2009) show, the probability of a big hit decreases exponentially with its size, making ‘picking winners’ a lottery game20. In addition, industrial policies providing advantages to specific sectors are prone to capture by cronies and rent-seeking, as the experience in Tunisia has demonstrated (see Chapter Three).

236 an industrial policy to boost value added and exports
International empirical evidence also suggests that horizontal “soft” industrial policies tend to be beneficial. The same study concludes that soft industrial policies, such as sector-wide government-support training schemes or supporting critical services infrastructure, tend to be beneficial (Harrison and Rodriguez-Clare 2010). Hence, additional efforts may be required to address cross-cutting constraints to export production, whether by improving logistics, increasing access to information and advisory services, and providing private sector room for trial and error (seebox7.5).21
Several eminent economists advocate that government should pursue active industrial policy. They argue that the market failures that industrial policies target—in markets for credit, labor, products, and knowledge—have long been at the core of what development economists study (Rodrik2008,2009;LinandMonga2010;Stiglitz,Lin,andMonga2013).Further,theseeconomistsargue that historical evidence and economic theory suggest that, while markets are indispensable mechanisms for allocating resources to the most productive sectors and industries, government intervention—through the provision of information, coordination of hard and soft infrastructure improvement, and compensation for externalities—is equally indispensable for helping economies move from one stage of development to another. Some authors argue that industrial policy has beenpivotalforsomeEastAsiancountriestoadvancemanufacturing(Amsden1989;Wade1990).EastAsiancountriesclearlypursuedawiderangeofpoliciestopromotespecificsectors,includingthrough export subsidies. Most recently, renewed emphasis has been placed on the market failures and externalities surrounding learning and discovery as the rationale for government intervention.Thereis,however,amplecross-countryevidenceofpracticaldifficultiesandcostlyfailureswithimplementation of industrial policies. The East Asian Tigers provided successful examples of heterodox interventions and protectionist industrial policies; however, industrial policies such as import-substitution-industrialization have failed in many other regions like Latin America and Sub-Saharan Africa. The main criticism against industrial policy arises from the concept of government failure. Industrial policy is seen as harmful because governments lack the required information, capabilities,andincentivestosuccessfullydeterminewhetherthebenefitsofpromotingcertainsectors above others exceed the costs and in turn implement the policies. Further, there is ample evidence that governments in making decisions with regard to electoral or personal incentives can be captured by vested interests—Tunisia being a strong case in point as discussed in Chapter Three-leading to industrial policy that only supports rent seeking by the political elite and distorting theefficientallocationofresourcesbymarketforcesatthesametime.
Box 7.4: The Ongoing Debate on the Effectiveness of Industrial Policy
237the unfinished revolution
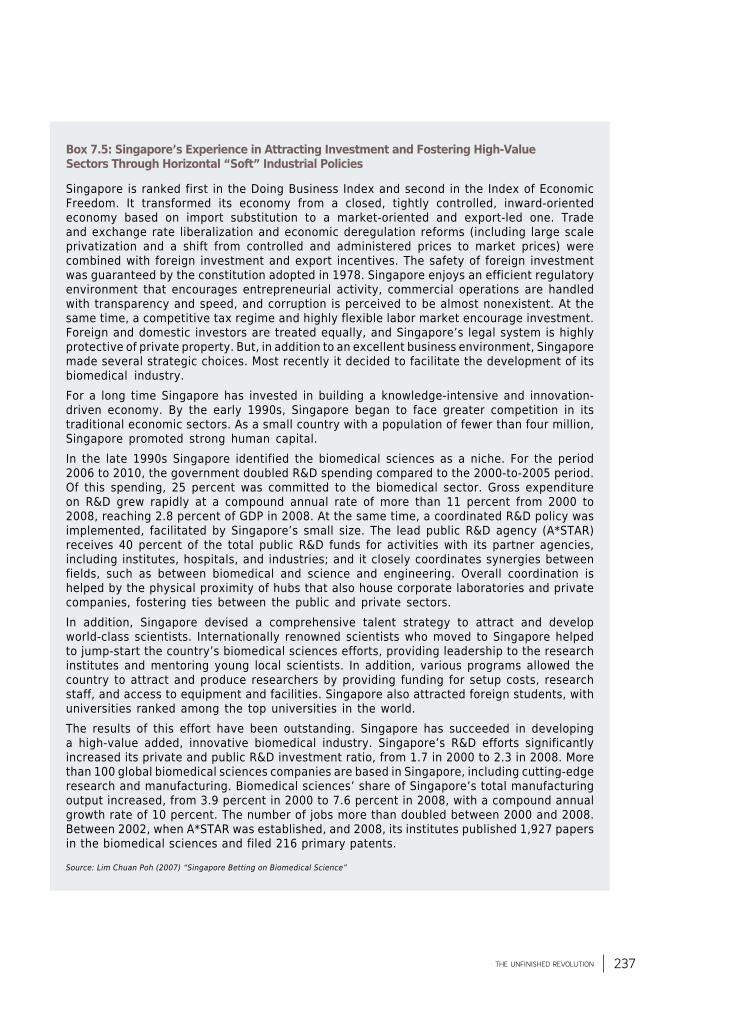
Singapore is ranked first in the Doing Business Index and second in the Index of Economic Freedom. It transformed its economy from a closed, tightly controlled, inward-oriented economy based on import substitution to a market-oriented and export-led one. Trade and exchange rate liberalization and economic deregulation reforms (including large scale privatization and a shift from controlled and administered prices to market prices) were combined with foreign investment and export incentives. The safety of foreign investment wasguaranteedbytheconstitutionadoptedin1978.Singaporeenjoysanefficientregulatoryenvironment that encourages entrepreneurial activity, commercial operations are handled with transparency and speed, and corruption is perceived to be almost nonexistent. At the same time, a competitive tax regime and highly flexible labor market encourage investment. Foreign and domestic investors are treated equally, and Singapore’s legal system is highly protective of private property. But, in addition to an excellent business environment, Singapore made several strategic choices. Most recently it decided to facilitate the development of its biomedical industry. For a long time Singapore has invested in building a knowledge-intensive and innovation-driven economy. By the early 1990s, Singapore began to face greater competition in its traditional economic sectors. As a small country with a population of fewer than four million, Singapore promoted strong human capital. In the late 1990s Singapore identified the biomedical sciences as a niche. For the period 2006 to 2010, the government doubled R&D spending compared to the 2000-to-2005 period. Of this spending, 25 percent was committed to the biomedical sector. Gross expenditure on R&D grew rapidly at a compound annual rate of more than 11 percent from 2000 to 2008,reaching2.8percentofGDPin2008.Atthesametime,acoordinatedR&Dpolicywasimplemented, facilitated by Singapore’s small size. The lead public R&D agency (A*STAR) receives 40 percent of the total public R&D funds for activities with its partner agencies, including institutes, hospitals, and industries; and it closely coordinates synergies between fields, such as between biomedical and science and engineering. Overall coordination is helped by the physical proximity of hubs that also house corporate laboratories and private companies, fostering ties between the public and private sectors.In addition, Singapore devised a comprehensive talent strategy to attract and develop world-class scientists. Internationally renowned scientists who moved to Singapore helped to jump-start the country’s biomedical sciences efforts, providing leadership to the research institutes and mentoring young local scientists. In addition, various programs allowed the country to attract and produce researchers by providing funding for setup costs, research staff, and access to equipment and facilities. Singapore also attracted foreign students, with universities ranked among the top universities in the world.The results of this effort have been outstanding. Singapore has succeeded in developing a high-value added, innovative biomedical industry. Singapore’s R&D efforts significantly increaseditsprivateandpublicR&Dinvestmentratio,from1.7in2000to2.3in2008.Morethan 100 global biomedical sciences companies are based in Singapore, including cutting-edge research and manufacturing. Biomedical sciences’ share of Singapore’s total manufacturing outputincreased,from3.9percentin2000to7.6percentin2008,withacompoundannualgrowthrateof10percent.Thenumberofjobsmorethandoubledbetween2000and2008.Between2002,whenA*STARwasestablished,and2008,itsinstitutespublished1,927papersin the biomedical sciences and filed 216 primary patents.
Source: Lim Chuan Poh (2007) “Singapore Betting on Biomedical Science”
Box 7.5: Singapore’s Experience in Attracting Investment and Fostering High-Value Sectors Through Horizontal “Soft” Industrial Policies

238 an industrial policy to boost value added and exports
A new Industrial Strategy for tunisia
A key policy challenge for Tunisia is to reenergize the development of the industrial sector by exploiting the strengths of the country. Industrial development can be nudged in the direction of the evolving comparative advantages of the country and take advantage of productivity gains from a variety of channels (Rodrik 2009). In line with the discussion above, the “new structural economics” advocates the need for the government to play a “smart” role in industrial policy. The main idea from the new structural economics is that the government should work to harness the comparative advantage with soft industrial policies (Lin and Monga 2010). The government could facilitate the growth focus of those selected sectors by addressing coordination failures (Rodrik 2004; Rodriguez-Clare 2007) and removing key constraints to sectoral growth whileensuring a level playing field.
In Tunisia, there is a need for the government to focus first on creating a level playing field and then to nurture specific sectors via non-distortive policies. In line with the evidence on the challengesofindustrialpolicy(includinginTunisia—seeChapterThree),thegovernmentshouldconsider adopting a two-pronged strategy. First and foremost, the government needs to revise existing policies to ensure a flat environment that supports and rewards risk taking, thereby enabling the private sector to experiment and succeed in new products; and, second, because the government has limited capacity, it could prioritize its focus on interventions (via “soft” and non-distortive policies) aimed at enabling the growth of sectors in which Tunisia appears to have a strong comparative advantage. Soft policies cover capacity-building policies such as investments in infrastructure (transport, telecoms, and energy), fostering technical and scientific skills, and promoting research; they also include horizontal incentivizing measures such as macroeconomic policies (openness to trade, exchange rate policy, and fiscal and financial incentives), promoting human capital and research, supporting business development, harnessing foreign capital and knowledge, and labor market policies. The specific policy options are discussed in details in annex 7.6, which draws on the experience of East Asian countries (Yusuf 2013). There is noscience to guide decision makers in the choice of policy instruments: policies must be designed with reference to the current state of industrial capability and evolving comparative advantage, and it will be critical to calibrate the effort in each category depending on planning and policy implementation capacity and also with reference to existing industrial capabilities.
Tunisia has already experimented with some soft policy tools unsuccessfully, which suggests the need to rethink their scope and design. In Tunisia the design of policies has been tainted by excessive administrative control in an autarkic economic and policy environment, which favors red tape, inefficiency, and capture by cronies. Again this underlines the importance of opening up the economy and removing dualism. It also highlights the importance of designing these programs by adopting international practice and standards, carefully monitoring their performance and outcomes, and working in partnership with the private sector. Experience has shown that the key to a successful industrial policy is to ensure that interventions support joint public-private efforts that lead to “discovery” by firms rather than the picking of winners by policy makers.

239the unfinished revolution
7.3 / Conclusions
T unisia’s industrial strategy and policies require rethinking. Beyond the distortions resulting from the onshore-offshoreduality, industrial policy places toomuchemphasis onproviding subsidies,with
too little attention given to addressing coordination failures and other “soft” aspects of the industrial environment. International evidence suggests that the government can play an active role in accompanying the development of high-potential sectors through horizontal measures and addressing coordination failures.
There is no shortage of products in which Tunisia has the potential to become a global leader; notably Tunisia appears to have a strong competitive advantage to export wage-intensive goods for which benchmark countries are losing their competitive edge. The steep increases in wages in a set of relevant benchmark countries reflectsa significantdecline in theirRCAs ina fewwage-intensive industries,notably in (a)textile and garment; (b) leather and footwear; (c) electrical; (d) chemical; (e) glass, iron, metal materials for construction and mechanical; and (f) home furniture and sanitary. Tunisia already enjoys a good RCA in several of these industries and could take advantage of the expected shifts in production away from benchmark countries. Notably, Tunisia holds potential in several products in the textile and garments and leather and footwear sectors and to expand exports in the mechanical and electrical industries. For several of these products global demand has been consistently growing during the past decade. The challenge, however,isensuringthatfirmsinthesesectorscanclimbupthevalueaddedladderandincreasinglybecome competitive in the higher-value added segments of the production chain.
However, this potential will never be realized unless the investment climate does not improve dramatically. In actual fact, the growth of these high potential sectors has remained stunted and largely limited to low-valueaddedactivities.ByandlargeTunisianfirmshavebeenunabletomovepastsimplelabor-intensivetasks to increase value addition in exported products. As discussed in earlier chapters, this is largely because the distortions and costs associated with current economic policies are too high. The duality in theeconomy,combinedwiththeinefficiencyintheonshoresector,hasresultedinthelackofbackwardand forward links,preventing thedevelopmentoffirms intohigher-valueaddedactivities.Adoptingastrategy designed to create a knowledge-intensive economy without addressing the underlying obstacles toprivatesectordevelopment—namely the lackof competition, theexcessive regulatoryburden, thepervasivecronyism,andtheprofoundpolicy-induceddistortions—hasnotsucceeded;andinsteadTunisiahas experienced continued dependence on assembly and other low-value added production. Therefore, the policy focus needs to shift to address horizontal constraints to domestic production that have impeded the realization of Tunisia’s large industrial potential. As discussed in Chapter Four, the focus of reforms shouldbeonexpandingthepositivetraitsoftheoffshoresector(andnotdestroyingitbyincorporatingitintheonshore,whichisinefficientandpronetorentseeking).Inaddition,thenaturalprocessofeconomicdevelopment suggests that average salaries are likely to increase soon in Tunisia, such that the country willnolongerbecompetitiveinlow-wagejobs—whichfurtherhighlightstheimportanceofenablingarapidtransition toward higher-value added activities.
Beyond creating an environment conducive to private sector growth, the government should act to identify andaddressspecificsectoralconstraints.Somesalientissueshavebeenhighlightedinthischapter,butitwillbeimportanttocarryoutin-depthsectoralstudiestoidentifyanysignificantcoordinationfailuresorothersector-specificconstraints.ThisworkshouldalsoidentifyspecificindustrialnichemarketswhereTunisianfirmsmightbeabletodevelop.
The next two chapters will examine the potential of the services sector and the agricultural sector, respectively. The analysis presented in this chapter has focused almost entirely on industrial goods. However, as will be discussed in the next two chapters, several studies have highlighted that Tunisia also holds large potential in the production and export of services and agricultural products.

240 an industrial policy to boost value added and exports
notes
1. This analysis will be complemented by in-depth strategic sectoral value chain studies to identify specific bottlenecksin high-potential sectors, which have been launched in collaboration with the government. The studies will entail an analysis of existing points of strength and weakness along the value chain, compared to international competitors, and will suggest appropriate ways to support the identified sectors.
2. These criteria apply to the Czech Republic, Malaysia, the Slovak Republic, Poland, and Turkey. The average growth rate of these countries was 4.3 percent, which is similar to Tunisia’s growth rate but higher than the median growth of other countries with a similar income level. Countries with higher growth rates in this income category include, for example, Chile, Lebanon, and Panama, which have a very differenteconomic structure than does Tunisia. Moreover, while Tunisia’srealexportshavegrownby3.7percentonaverage,exports of these countries have grown nearly twice as fast. Benchmark countries also include the Republic of Korea, as a high performing country, and Portugal. Portugal’s economic structure twenty years ago was very similar to Tunisia’s current economic structure. Regional comparators are Egypt, Jordan, and Morocco.
3. Yet some authors argue that the production of some goods generatesspecialeconomicbenefitsandthatexportingthesegoods is particularly good for growth. Low costs of production may not be the only reason to export a good. Marshallian externalitiesorrentscouldpotentiallyoffsetanylossesarisingfrom moving against comparative advantage. Hausmann, Hwang,andRodrik(2007)arguethatgoodsproducedinrichercountries yield spillovers that lead to faster growth.
4.TheindexwasintroducedbyBalassa(1965and1989).TheRCA is calculated as the ratio of product k’s share in country i’s exports to its share in world trade. RCA= (country i exports of good j /total country i exports)/(total world exports of good j/total world exports of all goods). A country is considered as having a revealed comparative advantage if this index is greater than one. In our analysis products are calculated using HS2classificationatthe4-digitlevel.
5. Group 1 highlights sectors and products in which Tunisia has seen an increasing RCA, and for which global demand is increasing; Group 2 highlights sectors and products in which Tunisia has seen an increasing RCA and for which global demand is decreasing; Group 3 highlights sectors and products in which Tunisia has seen a decreasing RCA and for which global demand is increasing; and Group 4 highlights sectors and products currently not produced in Tunisia, or with a very low RCA, and for which global demand is increasing
6.ThissectiondrawsonSahnounandSchiffbauer(2012).
7. It is important to note that distance across products ismeasured across all countries and is a technological feature of products, not of countries. There is therefore one product space in which countries move, rather than a product space for each country.
8. Tunisia’s export structure resembles Portugal’s 15 to 20years ago. Portugal’s export performance over the last 15 years contains valuable information for Tunisian firms. Forinstance, they might consider entering or expanding into new product categories for which Portugal has generated export successes close to the core of the product space over the last two decades (see Sahnoun and Schiffbauer 2012).
9. As explained in Chapter One, the PRODY of an exported good is calculated as the GDP per capita of each country exporting the good weighted by the export of each given country as a share of the sum of all export shares. Goods primarily exported by richer countries are presumed to be more sophisticated and receive higher PRODY.
10. The intensive margin can be calculated as the ratio of the dollar value of a country’s exports to the dollar value of the world’s exports of products that are in this country’s export portfolio.Theextensivemarginisdefinedasthedollarvalueofthe world’s exports of products that are in this country’s export portfolio over the dollar value of all traded goods (Hummels and Klenow 2005).
11. Activity at the extensive margin varies during the economic development process. Klinger and Lederman (2006) show that the number of new exports falls rapidly as countries develop, after peaking at lower-middle income level. The poorest countries that tend to have a narrow export base also have the strongest expansion at the extensive margin.
12.Since2005,aQualifiedIndustrialZones(QIZ)agreementallows Egypt to take advantage of the free trade agreements between the United States and Israel. Thus, goods produced inQIZ-notifiedareascandirectlyaccessU.S.marketswithouttariff or quota restrictions as long as they contain a smallportionofIsraeliinputsandthefinalgoodcontains35percentof value added.
13.Moreprecisely,theexportpenetrationindexisdefinedasthe share of the actual number of export relationships (at the country product level) forged by Country A to the maximum possible number of export relationships it can form given the number of its exports. The denominator is calculated by summing the number of countries that import each product that Country A exports. If Country A were to export to all destination countries of its exports, the index would take on value 100.
14.Non-TariffMeasures(NTMs)andtransportcostsconstitutesevere constraints to intra-regional trade. NTMs are much more prevalent for intra-regional trade within the MENA region and represent a serious bottleneck to the implementation of the Pan Arab Free Trade Area (PAFTA). Intra-Maghreb trade costs are estimated to be at 95 percent for industrial goods, compared to trade costs between Maghreb and Western European countries of75percent.Transport-relatedinfrastructureandrealtradecostsarerankedasthemostsignificantconstraintbythefirmsin the region. There is no coordination mechanism between the MENA countries on customs procedures and systems except for some limited initiatives that have started between Maghreb countries. There is no cross-border coordination between countries, and therefore multiple controls exist on each side of the borders (except the Tunisia-Libyan border at Raz Jair).
15. In fact, although some programs have been assessed in an ad hoc fashion, overall there exists no systematic, rigorous evaluation of the costs and benefits of the multitude ofoverlapping programs.
16. Tere is an array of horizontal and vertical programs introduced in the 1990s to assist firms in upgrading,innovating, and exporting; and a number of technical assistance centers were created. Industrial zones are supposed to play an important role in Tunisia’s industrial policy, but as aresultoftheirpoormanagementtheireffectivenessremains

241the unfinished revolution
largely limited. To support innovation the government also promoted the creation of Technoparks (Technopoles) and business nurseries (Pépinières d’entreprises) at the university level to connect economic production, applied research, and higher education in supporting hi-tech start-ups-and launched competitiveness hubs (pôles de compétitivité) to connect private firms in training, research, and productionwith the aim of supporting innovation, fostering international competitiveness, and promoting foreign investment. The government has also been trying to scale up the supply of high-quality graduates in science and technology.
17.Anadditionalproblemisthatgovernmentresponsibilitiesfor the development and implementation of industrial policies arenotclearlydefined.EventhoughtheMinistryof Industryis one of the main designers of industrial policy and is in charge of the Agency of Industrial Promotion (API) as well as the Industrial Property Agency (AFI), several ministries and agencies have overlapping responsibilities. For instance, the promotion of exports is supported by both the Ministry of Investment and International Cooperation through FIPA and the Ministry of Commerce and Handcraft through the CEPEX.
18.AnexampleofthistypeofcoordinationfailureisthecaseofflowerexportsfromEcuador,whichonlytookoffwhentheassociation of flower exporters, the government, and thenational airline agreed to arrange a required number of cargo flights.
19. Reviewing single industry studies in advanced and developed countries, these authors find that infant industryprotection may lead to higher growth by supporting the development of new industry but tends to result in net welfare losses as consumers have to pay higher prices (Harrison and Rodriguez-Clare 2010). Designing policies that increase overall welfare seems difficult.
20. For instance, few would have guessed that exports of “ceramic bathroom kitchen sanitary items not porcelain” would become one of Egypt’s most successful export products (see Cadot, et al. 2012, for in-depth discussion). Egypt derives 23 percent of its total manufacturing exports from this single product, mainly to Italy (94 percent of Italian imports of this product are from Egypt) (Lederman and Maloney, 2012).
21. Harrison and Rodriguez-Clare (2009) talk of the need to shift to “soft” industrial policy where government, industry, and clusters work together to increase productivity. “Thus, insteadoftariffs,exportsubsidies,andtax-breaksforforeigncorporations, we think of programs and grants to, for example, help particular clusters by increasing the supply of skilled workers, encouraging technology adoption, and improving regulation and infrastructure” (Harrison and Rodriguez-Clare 2009, 76).

242 an industrial policy to boost value added and exports
references
Amsden,A.H.1989.Asia'sNextGiant:South Korea and Late Industrialization. New York: Oxford University Press.
Balassa, Bela. 1965. “Trade Liberalization and Revealed Comparative Advantage." Manchester School of Economic and Social Studies 33: 99-123.
Balassa, Bela. 1989. “Revealed’ Comparative AdvantageRevisited.” In Comparative Advantage, Trade Policy and Economic Development,editedbyBelaBalassa,63–79.NewYork: New York University Press.
Brenton, P., and R. Newfarmer. 2009. “Watching More Than the Discovery Channel to Diversify Exports.” In Breaking into New Markets: Emerging Lessons for Export Diversification, edited by R. Newfarmer, W. Shaw, and P. Walkenhorst, 111-126. Washington, DC: World Bank.
Cadot, Olivier, Ana Fernandes, Julien Gourdon, Aaditiya Mattoo. 2012.“AreExportSupportProgramsEffective?EvidencefromTunisia.” Working Paper, World Bank, Washington, DC.
Easterly, William, Ariell Reshef, and Julia Schwenkenberg. 2009. “The Power of Exports.” Policy Research Working Paper 5081,World Bank,Washington, DC.
ElKadhi,Zouhair.2012.“LedéfidecompétitivitéenTunisie.” IACE Conference, Journée de l’Entreprise 2012. December.
Fujita, Masahisa and Jacques-François Thisse. 2002. “Does Geographical Agglomeration Foster Economic Growth? And Who Gains and Looses From It?” CEPR Discussion Paper 3135, CEPR Discussion Papers.
Harrison, Ann, and Andres Rodriguez-Clare. 2009. “Trade, Foreign Investment, and Industrial Policy for Developing Countries.” NBER Working Paper 15261, NBER, Cambridge, MA.
Harrison, Ann, and Andres Rodriguez-Clare. 2010. “Trade, Foreign Investment, and Industrial Policy for Developing Countries.” Handbook of Development Economics, Volume 5, Chapter 63, 4093-4214.
Hausmann, Ricardo, Jason Hwang, and Dani Rodrik. 2007.“What You Export Matters.” Journal of Economic Growth 12 (1): 1-25.
Hausmann, Ricardo, and Bailey Klinger. 2007. “StructuralTransformation and Patterns of Comparative Advantage in the ProductSpace.”CIDWorkingPaper146,April 2007.
Hausmann, R., C. A. Hidalgo, S. Bustos, M. Coscia, S. Chung, J. Jimenez, A. Simoes, and M. A. Yildirim. 2011. The Atlas of Economic Complexity. Cambridge: Puritan Press.
Hidalgo,C.A.,B.Klinger,A.Barabasi,andR.Hausmann.2007."The Product Space Conditions the Development of Nations." Science317(482,August2007).
Hummels, D., and P. J. Klenow. 2005. “The Variety and Quality of a Nation’s Trade.” The American Economic Review 95 (3): 704–723.
Lederman and Maloney. 2012. Does What You Export Matter? In Search of Empirical Guidance for Industrial Policies. Washington, DC: World Bank.
Lin, Justin Yifu, and Celestin Monga. 2010. “Growth IdentificationandFacilitationFramework.”ResearchWorkingPaper 5313, World Bank, Washington, DC, May 2010.
Mehchy, Zaki, Rabie Nasser, and Marc Schiffbauer. 2012.“Giving Credit Where Credit Is Due-The Firm Determinants of Recent Export Performances in Syria.” Paper presented at the ERF18th Annual Conference, Cairo, 2012.
Poh, Lim Chuan. 2007. “Singapore Betting on BiomedicalScience.” Issues in Science & Technology (Innovation Policy around the World),November27,2013.http://issues.org/26-3/poh/
Raiser, Martin, and Indermit S. Gill. 2012. Golden Growth: Restoring the Lustre of the European Economic Model. Washington, DC: World Bank.
Rodríguez-Clare, Andrés. 2007. “Clusters and ComparativeAdvantage: Implications for Industrial Policy.” Journal of Development Economics 82 (1): 43–57.
Rodrik, Dani. 2004. “Industrial Policy for the Twenty-First Century.” KSG Working Paper RWP04-047.
Rodrik, Dani. 2008. “Industrial Policy: Don’t Ask Why, AskHow.” Middle East Development Journal,DemoIssue(2008):1–29.
Rodrik, Dani. 2009. “Industrial Policy: Don’t Ask Why, Ask How.” Middle East Development Journal 1 (1) : 1–29.
Rosenthal, Stuart S., and William C. Strange. 2004. "Evidence on the Nature and Sources of Agglomeration Economies." In Handbook of Regional and Urban Economics, edited by J. V. Henderson& J. F.Thisse,2119-2171.Elsevier.
Sahnoun, Hania, and Marc Schiffbauer. 2012. “MappingMENA’s Manufacturing: The Export Performance and Prospects of MENA Countries Since the First Structural Reforms.” Mimeo. World Bank,Washington, DC.
Stiglitz, J., Y. Lin, and C. Monga. 2013. “The Rejuvenation of IndustrialPolicy.”PolicyResearchWorkingPaper6628,WorldBank, Washington, DC.
Wade, R. 1990. Governing the Market: Economic Theory and the Role of Government in East Asian Industrialization. Princeton: Princeton University Press.
World Bank. 2008c. “Tunisia's Global Integration: A SecondGeneration of Reforms to Boost Growth and Employment.” Report 40129-TN. World Bank, Washington, DC, November.
World Bank. 2010a. Tunisia Development Policy Review: Towards Innovation-Driven Growth. Washington, DC: World Bank,.
World Bank. 2012a. Regional Economic Integration in the Middle East and North Africa: Going Beyond Trade Reforms. Washington, DC: World Bank.
World Bank. 2014h. Tunisia Advancing Global Integration. Washington, DC: World Bank.
Yusuf, Shahid. 2013. “Industrial Policy for the 21st Century.” Internal Mimeo, World Bank Institute.