Embed Size (px)
Citation preview

Valuation Parameters of Retail Properties
As at: April 2014

________________________________________________________________
2
Valuation Parameters of Retail Properties
This study including all of its parts is protected by copyright. Any unauthorised use outside of the
strict limitations of the copyright law without the consent of TEGoVA is prohibited and liable to
prosecution. This applies in particular to reproductions and translations, microfiching and to the
storage and processing on electronic media. The authors have produced the study with the greatest
of care, but assume no liability for the topicality, correctness, completeness or quality of the study.
Where the study makes reference to legal issues, it is categorically not intended to constitute any
legal advice. Any claims arising against the authors or TEGoVA are excluded, insofar as the au-
thors and TEGoVA have not been intentionally or grossly negligent or are responsible for personal
injury or damage to health.

3
Table of Contents
Table of Contents ________________________________________ 3
Foreword _______________________________________________ 4
Definitions in Retail __________________________________ 7 1
1.1 What is a Retail Property? ______________________________ 7 1.2 Terminology _________________________________________ 7 1.3 Business types _______________________________________ 14
1.3.1 General _______________________________________ 14 1.3.2 Overview of the retail business types _________________ 15
1.4 Area definitions for retail properties _______________________ 19
Checklists __________________________________________ 22 2
2.1 Macro location________________________________________ 22 2.2 Micro location ________________________________________ 23 2.3 Analysis of the property/rental units _______________________ 24
2.3.1 Space concepts and floor plan designs/spatial flexibility/functionality _ 24
2.3.2 Site description __________________________________ 25 2.3.3 Description of the building _________________________ 25 2.3.4 Analysis of condition _____________________________ 26
2.4 Criteria important in terms of planning law regulations _________ 27 2.5 Analysis of lease contracts and cashflow ___________________ 27 2.6 Users_______________________________________________ 28
Data Sheets _________________________________________ 29 3
Valuation Parameters of Retail Properties
4
Foreword
The European Group of Valuers’ Associations (TEGoVA), which is the um-
brella association for national real estate valuation organisations in Europe,
today represents over 70.000 qualified valuers from 59 associations in 32
countries.
One of the main goals of TEGoVA is to create and disseminate uniform
standards for the practice of real estate valuation in Europe. Exemplary in
this connection are the “European Valuation Standards 2012” published by
TEGoVA, which are recommended under EU law and favoured by the Eu-
ropean Central Bank over all other standards. Furthermore, the “Recog-
nised European Valuer (REV)” title awarded by TEGoVA is increasingly
regarded as a key credential. Designed to maintain, improve and harmonise
valuation qualifications, the “REV” title has now been awarded to over 2300
valuers in Europe. The title is conferred in accordance with uniform stand-
ards and serves clients as an indicator of the valuer’s high professional
qualifications and valuation skills.
The goal of offering even more added value in association with the REV
status gave rise to the idea of collecting valuation expertise through the
member associations in many European countries, publishing it in the form
of studies, and providing this information free of charge to all REV valuers.
The present study on the valuation of retail properties is the first such publi-
cation, conceived by a specially selected expert group of TEGoVA mem-
bers. Further studies are planned.
The objective of the study is to give the reader an overview of the common
definitions and the essential aspects to be considered, as well as the key
valuation parameters and ranges in various European countries and for
different property types.
The following persons participated in the preparation of this study, all of
whom we would like to thank here for their work and the expertise they con-
tributed to the task:
Valuation Parameters of Retail Properties
5
France
- Cécile Dubois (Jones Lang LaSalle Expertises, Paris)
Germany
- HypZert Professional Group Retail: Anja Frankemölle (GIB Gesell-
schaft für Immobilienbewertung mbH), Manuel Jahn (GfK GeoMar-
keting GmbH), Gerd Köpp (KSC GmbH), Carolin Lutz-Herrmann
(UniCredit Bank AG), Paul Mattes (LBBW), Jens Rödiger (Ken-
stone GmbH), Carsten Vogt (Nord LB)
- Reiner Lux (CEO, HypZert GmbH)
Greece
- Maria Vlachogianni (AVAG),
- Samantha Karra (AVAG),
- Konstantinos Pallis (AVAG)
- Vangelis Papaliolios (AVAG).
Italy
- Silvia Cappelli (ASSOVIB),
- Federica Selleri (ASSOVIB),
- Nicola Arcaini (ASSOVIB),
- Antonio Campagnoli (IsIVI),
- Elena Del Signore (IsIVI)
Latvia
- Edgars Shins (LIVA)
Poland
- Krzysztof Grzesik (PFVA)
- Ewa Nowak (PFVA)
- Edyta Szmajda (PFVA)
Romania
- Real Estate Division within ANEVAR led by Adrian Vascu (Chair-
man) and coordinated by Adrian Nicolesco (real estate instructor)
Serbia
- Danijela Ilic, NAVS
- Vladislav Ilic, Industrial Solutions d.o.o
Valuation Parameters of Retail Properties
6
- Dragana Djukanovic, Realtis d.o.o
- Milos Vasic, assistant NAVS
Spain
- Leandro Escobar (ATASA)
UK
- John Harrison (Jones Lang LaSalle, London)
Krzysztof Grzesik
Chairman
TEGoVA
Reiner Lux
Managing Director
HypZert GmbH

Valuation Parameters of Retail Properties
7
Definitions in Retail 1
1.1 What is a Retail Property?
Retail properties
- are places where consumers can purchase a wide variety of goods
and services;
- come in many different formats but all are dependent on the
consumer for their success;
- rely on the local population of the surrounding areas as their
customer base.
1.2 Terminology
The definitions of some of the more commonly used retail terms of
relevance to property valuation are provided below.
They are, in part, based on ‘Katalog E1’ (guidelines produced by the Institut
für Handelsforschung (Institute for Retail Research) for the definition of
terminology in retail):
Absorption Rate
This is the mathematical ratio between a retailer’s gross turnover and
the available purchasing power in the catchment area. It is possible to
calculate the theoretical turnover potential for retail tenants in a location
using the purchasing power specific to the product range and
assumptions of possible absorption rates.
Anchor tenant
An anchor or magnet tenant is generally the tenant which occupies the
largest area or generates the highest rental income and is the strongest
attraction for customers (‘customer magnet’ for the whole property) in the
case of larger retail properties.
Start-up phase
1Katalog E; Institut für Handelsforschung, University of Cologne; Fifth Edition
Valuation Parameters of Retail Properties
8
After the opening of a retail property, it takes a certain period of time for
the property to reach the turnover level required to achieve sustainable
financial success. The start-up phase normally lasts between one and
two years, although it can be as long as three years in saturated
markets. Turnover growth during this period can range between
20% and 25% p.a. until the anticipated turnover level has been reached.
The start-up phase can be shortened using marketing tools. Retailers
also include a start-up phase in their considerations.
Demand
– Periodic
All goods required to satisfy short-term or regular needs such as
food, beverages and tobacco, and short-term consumer products.
– Non-periodic
All other goods required to satisfy medium to long-term needs, e.g.
textiles, clothing, household items etc.
Business type
A business type refers to a group of retail businesses with identical or
similar characteristics (size, depth of product range, service intensity
etc.).
Branch / Line of business
Structure of the retail branches according to the primary type of goods
(e.g. consumer electronics, foodstuffs).
Branch mix
The success, particularly of shopping centres, depends on the quality of
the branch mix. Although there are no general rules for the correct
branch mix, the success of a tenant community grows when it is possible
to generate synergy effects. This depends on the number, variety and
positions of the retailers in the centre. In smaller town/city centre
shopping centres in particular, additional synergy effects can also be
generated by retailers outside the centres, thereby improving the overall
attractiveness of the location.
Branch-specific rents
rent-to-sales-ratio
Gross Initial Yield

Valuation Parameters of Retail Properties
9
The gross initial yield is calculated from the ratio of contractual rent
(annual net rent) to market value.
Business Improvement District (BID)
This normally refers to spatially defined inner-city areas or districts within
which landowners are willing to finance and undertake programmes of
works to improve the environment and attractiveness of the area within a
specified period. BIDs are often found in areas dominated by retail and
consumer-based services (e.g. pedestrian precincts).
Centre management
A shopping centre is a shopper’s paradise, which is designed and
constructed as a single unit. Ideally, centre management should be
involved in the design and construction process. If not, it should be in
place by the time the shopping centre opens in order to ensure that the
centre is successfully marketed and positioned as a brand. Therefore,
the quality of the centre management is an important factor in the
valuation of shopping centres.
Catchment area
The area and population from which a retail property/project attracts its
customers.
Chain store saturation
This refers to the percentage of chain retailers in prime pitches in the
market.
Sales per m²
In retail, this is normally defined as the net turnover per m2 of sales area
(p.a.). In the property industry, calculations can also consider turnover
per m² of lettable area and, in some instances, turnover per m² of retail
space (gross and net) if sales area figures are not available. It is
therefore always important to know the basis of the figures.

Valuation Parameters of Retail Properties
10
Source: GfK Germany January 2013
Fig.1.1 Development of sales per m²
Wholesale
Wholesale in the functional sense exists when market players source
goods from manufacturers or other suppliers and distribute these to
resellers, secondary producers, commercial users (e.g. local authorities,
educational institutes or restaurants ), but not to private households. It
should also be noted that qualities, batch sizes or value of the goods do
not play a role in the differentiation between wholesale and retail; the
primary criterion is the focus on satisfying commercial needs.
Purchasing power / average spending
At micro-economic level, this refers to the sum of the individual demand
for goods within a specific segment or product group/range.
Purchasing power refers to the sum of money which private households
have at their disposal over a specified period; it is the disposable net
income plus withdrawals from savings and loans taken out minus money
put aside for saving and the amortisation of loans.
Retail-relevant purchasing power / average spending in retail
Purchasing power (in EUR and as an index) which can be spent in the retail
sector (i.e. point-of-sale and distance selling, but excluding car sales and
fuels) after deduction of monthly expenses such as rent, loan interest and
savings.
0 €
500 €
1.000 €
1.500 €
2.000 €
2.500 €
3.000 €
3.500 €
4.000 €
2006 2007 2008 2009 2010 2011 2012e 2013e
Ne
tto
-Um
sa
tz je
m²
VK
p.a
.
Raumleistung im Einzelhandel 2006–2013
Raumleistung Einzelhandel gesamt Raumleistung Shopping-Center
Sales Productivity in Retail 2006 - 2013
Total sales productivity in retail Sales productivity of shopping centres
Net
turn
over
per
m²
of s
ales
are
a p.
a.

Valuation Parameters of Retail Properties
11
If the valuer is asked to assess the demand potential, then retail-relevant
purchasing power is estimated as follows:
Inh. Av. spend PPI = Demand potential
Inh. = Inhabitants in the catchment area
Av. spending = Average spending per inh.
for branch-specific products
PPI = Purchasing power index for the catchment area
Data providers have different opinions in terms of spending in
pharmacies and the traditional food industry (i.e. butchers, bakers etc.).
Purchasing Power Index
The purchasing power index of a region (federal state, rural district,
municipality) refers to the purchasing power of a region per inhabitant
compared to the federal average (federal average = 100).
The purchasing power index also describes the spending potential of the
local population and demand potential of the respective town, city or
region. The higher the index, the more favourable the outline conditions
for local retail, which can capture a major share of this purchasing
power. A high purchasing power index normally also has a positive
effect on the quality of the location.
Demand volumes
This is a statistic calculated by multiplying the locally adjusted retail-
relevant spending per capita by the number of inhabitants (Inh.).
Purchasing power volumes are also calculated for the main product
groups/part product ranges (→ Analysis of Potential).
Purchasing power volumes = purchasing power per inh. (or per part
product range) no. of inh.
Location categories
Urban retail areas reflect the centrality and attractiveness of specific
sections of towns, cities and communities. The city layout, location of the
shopping areas within settlement boundaries and general central
function of these locations are of relevance to the classification of retail
areas and location qualities.

Valuation Parameters of Retail Properties
12
Standard categories by property agents
– 1-or A-location : Prime retail location in the centre of the town or
city with a high level of footfall;
– 2- or B-location : Secondary retail locations/district centres with
high levels of footfall;
– C-location: Location with a low number of shops, frequently
interspersed by other uses
Other categories
– Scattered locations (e.g. stand-alone stores);
– Neighbourhood centres, generally in residential areas;
– District centres;
– Sub centres/local centres (secondary locations);
– Town/city centres (core retail area), differentiated as follows:
– Mass market retail
– Upmarket retail
– Luxury and high-end retail
– Inner city/city centre fringe (boundary of the core retail area)
Market volumes (sales volumes)
This refers to all adjusted institutional retail sales relating to the specific
location or a defined catchment area (market area).
Tenant fit-out
This refers to physical changes to a shop in the landlord’s building,
undertaken by the tenant at its own cost
Net Initial Yield
This term has different interpretations. Our study considers to the
following definition:
In the property industry, the net initial yield refers to the ratio of the gross
income (net rental income for the first rental year) adjusted by operating
costs which have an effect on liquidity and the property value/purchase
price plus purchaser’s costs (land transfer tax, notary’s fees and court
costs, agency commissions). Operating costs, which have an effect on
liquidity, include expenses for property management and calculated
maintenance costs.

Valuation Parameters of Retail Properties
13
Net initial yield (%) = Gross Rental Income – operating costs which af-
fect liquidity / (property value or purchase price) + purchaser’s on-costs
Restrictions in product ranges
The possible impact of major retail projects on the turnover of existing
central supply areas (cf. Central Supply Areas) is investigated as part
of the planning application process.
Consequently, conditions can be attached to the permission, restricting
the sales area in general or in defined areas to the offer of main product
ranges normally sold in town/city centres. Restrictions in product ranges
can impact on the success and/or operator flexibility and therefore also
detrimentally affect the value of a retail property.
Product ranges, normally sold in town/city centres
These are product ranges normally sold in town/city centres,
neighbourhood and district centres. In particular, they offer goods and
services to cover the everyday, as well as periodic and non-periodic
needs of households.2
Rent-to-sales-ratio / effort rate
For the tenant, this is calculated from the ratio of rent and net turnover
and is used as a benchmark. In Continental Europe, the net rent (in the
UK the gross rent (incl. service charges)) is adopted. There are
standard ranges which can be regarded as sustainable for the tenant,
subject to the tenant and/or branch-specific income and expenditure
situation. The tenant can influence this figure to a certain degree, e.g.
by reducing other costs and/or improving turnover. Abnormally high
rent-to-sales ratios increase the risk of rental loss and/or risk of re-
letting.
Turnover redistribution
This is the proportion of turnover which a new tenant entering the market
will or must absorb from competitors in order to be able to operate its
retail property successfully.
Centrality
Retail centrality measures the balance of the inflow and outflow of
purchasing power of a town/city, in which the retail purchasing power is
2 Katalog E; Institut für Handelsforschung, University of Cologne; Fifth Edition; p.202

Valuation Parameters of Retail Properties
14
compared with retail turnovers within a municipality. A town/city is more
attractive when it can harness more purchasing power than its
inhabitants have at their disposal, i.e. has a high centrality. It must be
determined in each instance whether the more effective indicator of
centrality is the situation in the region or part of a town/city, rather than
the municipality’s administrative limits.
1.3 Business types
1.3.1 General
In an institutional sense, retail business types are principally defined by the
sales policies they apply.
It is important to differentiate between the two distribution channels ‘point-
of-sale’, i.e. the physical offer of goods through retail outlets, and ‘Distance
Selling’, i.e. the virtual offer of goods using a variety of media.
In point-of-sale retail, three main positioning and differentiation strategies
with specific requirements for retail outlets have been developed, which
bring the consumer into direct physical contact with the product and should
thereby satisfy the following expectations:
Experience;
Price;
Convenience.
Distance Selling has similar positioning strategies to point-of-sale retail. This
means that in online / mail order retail, i.e. traditional mail-order, and online
retail, the type of media and means of acquiring information such as using
systematic price comparisons and/or recommendations play a particularly
important role. Distribution is principally regulated by the following media:
Catalogues;
PC;
Smartphone;
TV;
Social networks.

Valuation Parameters of Retail Properties
15
1.3.2 Overview of the retail business types
Retail in Europe
At the point of sale Online/mail order
Experience Price Convenience Distance selling Ambulant retail
Shopping centre Retail park Hybrid centre Mail order
Entertainment centre Factory Outlet
Centre
Convenience store Online shopping
Flagship store Retail warehouse Airport / railway
station shops
Mobile shopping
Concept store Discounter Petrol station shop Tele shopping
Pop-up store Off-price store Museum shop Social shopping
Source: HypZert Germany, 2013
Fig.1.2 Retail in Europe
1.3.3 Terminology for point-of-sale retail
Shopping centres
The term ‘shopping centre’, taken from US terminology, emphasises the
attractiveness of the property. The attractiveness and appeal of a centre
is achieved by designing, constructing and managing a centre as a
single unit, with a high number of shops and service providers offering
extensive product ranges and services. By bringing such as high
number of businesses together in one location, it is possible to generate
synergy effects. Properties with less than 10,000 m² of lettable retail
space are no longer regarded as shopping centres.
Entertainment centres
Also referred to as Urban Entertainment Centres (UEC), entertainment
centres accommodate a mix of leisure uses and are designed,
constructed and managed as a single unit. In addition to leisure facilities

Valuation Parameters of Retail Properties
16
such as cinemas, fitness centres, play and fun, these include
complementary retailers.
Flagship stores
A flagship store is a retail outlet which acts as the showpiece property. It
has a number of special characteristics such as a much sought-after
location, special fitout and/or extended product range. These shops are
increasingly becoming the interfaces to the online product range, e.g. by
using technical installations such as virtual shelving and product
presentations. Flagship stores support the presence of the brand in
terms of public awareness, promote its image and contribute to
customer loyalty, and are therefore considered an important marketing
tool. Particularly elaborate stores, which cannot often be operated
profitably, are financed via the company’s marketing budget.
Concept stores
In contrast to the flagship store in which the individual brand is the
principle factor and which presents the full product range, the concept
store offers a thematic or lifestyle product and brand mix. The offer is
often restricted to selected products from a variety of product groups
which, together, can map whole lifestyles. The themes and product
combinations are regularly changed to encourage repeated visits.
Pop-Up stores
Pop-Up stores are temporarily operated on a daily or monthly basis.
The term comes from ‘popping-up one day’ and then vanishing again to
open somewhere else. The retail sector uses these stores as a
marketing tool; the property industry for short-term lettings and to
improve the image of a property.
Retail park
In a retail park, retail warehouses are designed, constructed and managed
as a single unit in an agglomeration location. In contrast to a shopping
centre, a retail park is not based on the principle of providing an
extensive range of products via a high number of individual retailers, but
is based on the appeal of fewer large, price-aggressive specialist
retailers. Consequently, the demands for the quality of the design and
amenity value of the centre are low.

Valuation Parameters of Retail Properties
17
Factory-Outlet-Centres (FOC)
Increasingly, FOC are following the conceptual and design principles of
shopping centres. They are also designed, constructed and managed
as a single unit. In addition to catering outlet, tenants are outlet stores
which are contractually obliged to offer mainly goods at reduced prices
(generally at a discount of 30–70%). Products on offer are mainly
branded products, sometimes also with manufacturing faults, last
season /surplus goods, discontinued models or goods not sold through
normal retail outlets. Manufacturers often lease units directly, thereby
bypassing intermediate trade. Product ranges offered comprise mainly
middle to higher level clothing, shoe and sports equipment brands.
Higher to top-level brand suppliers are concentrated in so-called
Designer-Outlet-Centres (DOC).
Retail warehouses
A retail warehouse is a large-scale retail outlet, which offers a limited but
extensive specialist product range. Retail warehouses mainly specialise
in products from one branch and are can often pass on price advantages
gained from bulk-buying.
Discounters
Discounters offer a limited and basic product range, mainly on smaller
sales areas than retail warehouses. The products have a very fast
turnaround due to high sales figures and lead to a price advantage
because of possible bulk buying In the case of bulk buying, price
advantages are passed onto customers.
Off-Price stores
In Off-Price stores, which include ‘Pound/€1 Shops’, independent
retailers offer products which are bought in bulk from various
manufacturers. The product range depends on availability of goods and
can include seasonal and surplus goods, which means that the offer
changes continuously. Bargain hunters can often find sought-after
branded products in the form of clearance stock. This encourages
customers to make repeated visits.
Hybrid centres/malls
A hybrid mall combines the features of a shopping centre and retail park.
In contrast to retail parks, in which the cost of construction is low, hybrid

Valuation Parameters of Retail Properties
18
malls are of a higher architectural quality. Hybrid malls can be found in
less densely developed competitive environments, mainly in small and
medium sized towns, distant from the influence of major town/city
centres and larger shopping centres.
Hybrid malls generate higher average rents than retail parks and can
therefore also be developed in smaller town centres.
The branch mix of a hybrid mall is designed to satisfy everyday needs,
as well as offering inexpensive clothing and food outlets.
Convenience stores
Convenience stores are small-scale shops with a limited and basic, but
high priced range of mainly everyday products. The concept is targeted
at the convenience and time-saving requirements of their customers,
which explains the low price sensitivity. Such stores are therefore
ideally situated in busy locations on main transport routes, such as
railway stations and petrol stations.
Airport/railway station shops
Stores specialising in satisfying travellers’ requirements. These include
convenience stores. Further product ranges are offered, in particular
gifts and similar products which encourage spontaneous, less price-
sensitive purchases.
Petrol stations shops
Special format of the convenience store.
Museum shop
Stores specialising in satisfying the wishes of visitors to the museum,
offering a core product range which complements the theme of the
museum, but also many gifts and accessories. It is not only museum
visitors which frequent the museum shop. It can also be used by visitors
in a rush, even in place of a museum visit. The products and their
presentation encourage spontaneous, less price-sensitive purchases.

Valuation Parameters of Retail Properties
19
1.4 Area definitions for retail properties
When assessing retail properties, valuers are confronted with a high volume
of area information. The different figures can be relevant for a variety of
reasons, subject to the purpose of their use such as the approval of a
development plan, planning permission, calculation of construction or
maintenance costs, recovery of general service charges, calculation of
rental income or assessment of tenant performance.
Discussions surrounding the calculation of sales area, which often take
place in the public arena, are of little relevance to the valuer when looking at
the valuation, or verifying sales performance and/or the security of the rental
income. The area is therefore only a means to an end, i.e. when the basis of
the measurement of areas is known, it is possible to roughly convert almost
all area information to other bases.
The main factor in every valuation is the usable area, which the valuer
always compares with the commercial lease contracts and architect’s floor
plans.
The sustainability of the rent to be generated in the location is often only
checked on the basis of the sales productivity which, is defined using the
sales area. Although in the case of published turnovers, it is also referred to
as the ‘Receipt Value’ (sum of the gross receipts), ‘Net sales per m² sales
area’ has been established as the common denominator for sales
productivity. Unfortunately in many countries, there is no standard definition
for sales area and therefore the derivation of what is referred to as sales
productivity must always be explored in detail.
Experience shows that there are no standardised area references in
commercial lease contracts for retail space.
Depending on the property type, size and structure, the valuer can be
confronted with a high volume of area information and references.
When the valuer is analysing a retail property (e.g. a strip mall), the overall
description of the building will generally include gross building dimensions
using the external measurements of the overall development. This is the
unit of measure used to determine items such as the replacement cost new
or density of the site (or floor area ratio). Actual leasable areas are most
often something less than the gross figure and are what rental payments
are based on in the lease agreements. In a strip mall or power centre, gross
building area and net leasable areas may be very similar due to the lack of

Valuation Parameters of Retail Properties
20
common areas. However, enclosed malls have large common areas and
therefore a much greater difference between net and gross.
When valuing multi-tenanted retail properties (e.g. shopping centres), the
gross leasable area (GLA) is an important measurement. GLA is defined as
the total floor area designed for the occupancy and exclusive use of
tenants, including basements and mezzanines. The remainder of the
building, which is used by both tenants and the public is called common
area, and is not included in the rentable area for retail premises. Rent as
per the lease is only charged based on the area of each tenant's premises.
In other words, there is no gross-up factor (or Rentable/Usable ratio) for
retail premises, as there is for office leases.
GLA for retail premises is typically calculated by measuring from the
building line in the case of street frontages, and from the inner surfaces of
the other outer building walls and from the inner surfaces of the corridor and
other permanent partitions and to the centre of partitions that separate the
premises from adjoining rentable areas. No deductions are made for
vestibules inside the building line or for columns or projections necessary to
the building. No additions are made for bay windows extending outside the
building line. Landlords and property managers can often provide accurate
measures of areas by supplying rent rolls and building schematics.
Although this is the general method used, there is not as strict a standard as
is the case with the BOMA International Standard, applicable to office
premises. Landlords and retail centre managers may deviate from this
method. The measurements of the individual rental areas may or may not
equate to the rental area shown in the leases. As well, because
measurement methods may vary, the valuer must be aware of possible.
All available information on sales productivity must be checked in terms of
the factors used in its calculation.
Thus, the following process is recommended:
Examination and review of available property documentation (lease
contracts, rent rolls etc.) for the relevant area definitions;
If necessary, conversion and development of a standard designation of
space with a view to the purpose of the valuation and benchmarking;
Review of the accommodation on-site;
Transparent documentation in the valuation report.

Valuation Parameters of Retail Properties
21
When valuing shopping centres and retail parks, mall areas should be
considered separately in terms of their construction and operating costs.

Valuation Parameters of Retail Properties
22
Checklists 2
Valuation means comparison. As is the case in other types of property, it is
important that key property factors are compared during the valuation
process in order to determine the valuation parameters. Here, the
assessment and comparison of the location, design and construction type,
as well as the cashflow of the valuation property, in terms of the respective
business type, play a significant role.
The following section should be helpful in the classification of the valuation
property and provide guidance on which parameters are important for the
comparison. However, this checklist must be considered as only one of a
variety of approaches to assessing a valuation property and cannot be
regarded as a binding recommended course of action.
2.1 Macro location
Central location: Regional planning designation
Supply of space
Supra-regional infrastructure
Spatial functions and image of the town or city (regional)
Retail centrality: Importance as a retail location
Purchasing power of the subject location versus comparable regions
Population trends (demographics) and structure in the town or city
Commuter patterns
Labour market: employment opportunities, unemployment rate
Economic and branch structure, economic development perspectives
Vacancy rates
Competition analysis
Number of shops and volume of sales area in the location
Number of competitors and volume of sales area of competing
shops in the location (same product range)
Coverage of retail needs (overall supply)
Development of sales productivity
Communal retail concept (if in place)
Development potential (current/future development opportunities,
permissibility of further retail businesses etc.)
Evaluation of location surveys (if available)
Project developments in the area/region.

Valuation Parameters of Retail Properties
23
2.2 Micro location
Retail location classification (prime, off-centre etc., sub-centre, district
centre etc.)
Surrounding area/infrastructure (roads, public transport links, energy
supplies, parking provisions in the area etc.)
Surrounding development, use character of the surrounding area
Direct neighbours: Synergy effects
Accessibility: Accesses/public transport
Parking spaces
Degree of acceptance by the population/ image of the micro location
Client/customer footfall
Perception: visibility and recognition factor
Vacancy
Price level (land values, charges paid for parking spaces not provid-
ed, local authority charges, energy prices etc.)
Advertising effectiveness of the location
Communal retail concept (if in place)
Orientation of the building on the site/expansion potential
Risks of elemental damage, area descriptions
Contamination
Planning law: change of use/extensions
The survey of the relevant catchment areas and their statistics is also
relevant for larger retail properties of regional importance
Geographic spread of the catchment area
Purchasing power/purchasing power development (retail-relevant) in
the catchment area
Customers
Number of visitors (daily, weekly, monthly, seasonally)
Development of visitor numbers (e.g. pedestrian surveys)

Valuation Parameters of Retail Properties
24
2.3 Analysis of the property/rental units
There are several criteria to describe the nature and type of a retail proper-
ty:
Property size (total GLA)
Tenants (anchor and/or major)
Type of products sold
Site size
Distance and travel time
Customer base
2.3.1 Space concepts and floor plan designs/spatial
flexibility/functionality
Dimensions, mix and layout of space
Forecourt/path
Disruptive room components: columns, stairs, lifts, etc.
Display window fronts, room depth, grid measurement
Concept assessment (customised, conventional or innovative,
flexible)
Size and location of storerooms/staff facilities (directly adjacent to the
sales area or on the same floor?)
Efficiency of floor plan design (flexibility of layout, ratio of usable area
to ancillary space etc.)
Servicing
Link to existing pedestrian flows/design of routes/malls inside the
property/internal access
Layout and clear arrangement of sales areas
Number of sales floors and floor-to-floor connections
Design of entrance areas
Restroom facilities
Functionality and size of the goods delivery zone
Functionality/% of circulation space
Divisibility, subdivision potential (floor-by-floor or per building section
etc.)
Extension opportunities
Assessment of third party use potential

Valuation Parameters of Retail Properties
25
2.3.2 Site description
Site area
Building footprint area, land coverage ratio and floor area ratio
Frontages
Boundaries
Entry & Exit
exposure
Parking availability
Traffic circulation
Signage
Landscaping and drainage
Accessibility (transportation facilities and cost of transportation)
Site services available
Site location/topography
Shape
Expansion space and surplus land
Potential damages or contamination
2.3.3 Description of the building
Architectural design
Building appearance (elevation), main facade and exterior materials
Building entrances
Building/type of use ?
Building configuration and shape
Main and ancillary buildings
Year of construction
Uses subject to the quality of the location
Areas and cubiture
Ratios (e.g. parking ratio, efficiency ratio i.e. GLA/GBA
Economic and useful life
Assessment of energetic standards (Green Building and Sustaina-
bility)
Type of construction -solid/skeletal construction
Description of the type of construction
Fitout, general quality of fitout, Assessment of modernity of interior
fittings
Food courts
Circulation, lifts/staircases

Valuation Parameters of Retail Properties
26
IT cabling, if necessary capacity of the wiring/fuses
HVAC, fire protection
Interior signage
Insulation (walls and roof)
Building services (i.e. HVAC)
Special building components
Special fixtures and fittings
State of repair (deferred maintenance/modernisation)
Information on any building components not inspected
Potential damages or contamination
Building insurance
Marketability
Market acceptance and suitability of location
2.3.4 Analysis of condition
General state of repair
State of repair of neighbouring properties
Fitout, general quality of fitout, assessment of modernity of interior
fittings
Assessment of energetic standards
Date of and scope of refurbishments or alterations, extensions or
changes of use
Notes on any completed/planned/required repairs/refurbishment
Criteria which could be of benefit for the assessment of the necessity
of revitalisation works:
Observation of the current Zeitgeist (analysis of fashion trends etc.)
Identification of changes in consumer behaviour (e.g. conflict be-
tween ‘at the point of sale’ and online retail)
Assessment of the changing population structure (e.g. aging of socie-
ty etc.) with its effects on the design of retail space and adapting
product presentation
Identification of deficits in building technology and the calculation of
essential renewal works in the valuation
Preservation of lettability (external appearance; how direct competi-
tors in the location are changing etc.)
Optimal tenant mix

Valuation Parameters of Retail Properties
27
Changes in legislation (e.g. bottle recycling (deposit system))
2.4 Criteria important in terms of planning law
regulations
Development plan stipulations (note: planning law lies within the
jurisdiction of each federal state and there are therefore up to 16 dif-
ferent state planning laws);
Planning permissions and conditions attached
Required number of parking spaces and charges for not providing
required number;
Obligation to undertake compensatory measures
Permissibility of alternative uses
Environmental reports
Restrictions in product ranges
2.5 Analysis of lease contracts and cashflow
An examination of the contents of the lease contract should be structured as
follows:
Leased premises, area information (lettable areas broken down into
the different types of use) and fitout specification (e.g. high-quality
shell condition)
Lease commencement/expiry
Lease term (incl. extension opportunities/options)
(Special) break options
Rental amount
Rent reviews (stepped rents, indexations)
Revaluation clauses
Incentives/rent-free periods
Easements in favour of tenants
Service charges (split between tenant and landlord)
CAM (Common Area Maintenance Charges)
Other operating costs, e.g. promotion and advertising
Collateral agreements (e.g. subletting, operator obligations, tenant
fittings etc.)
Parking
Exterior signs

Valuation Parameters of Retail Properties
28
Radius clause (prohibits merchants from opening another store with-
in a specified radius of the property)
2.6 Users
Creditworthiness
Concept positioning
Extent to which continuation/ maximisation of income/ value will de-
pend on the skills of the owner.
Branch development
Business type development
Branch/tenant mix appropriate for the location
Rental/turnover development

Valuation Parameters of Retail Properties
29
Data Sheets 3
See next page.

Valuation Parameters of Retail Properties Italy
Data Sheets Food Discount
30
Location characteristics
First suburbs, outskirts of residential areas, even near commercial centres; Sufficient number of parking spaces outdoor; Good visibility; Easily accessed by private transport.
Property characteristics
One floor building; Outdoor parking in front of the discount; Functional architecture with basic fit out; Prefabricated building; Large open sale area; Average surface starting from 300 sqm to 1200 sqm.
Facts
Company No. of stores Average GLA in sqm Total sales 2011 (in billion EUR)
LIDL 560 1000 - 1200 2.5
EUROSPIN > 900 600 - 1000 3
IN'S 314 400 - 800 0.5m (year 2010)
PENNY MARKET 348 450 - 1000 0.7
DICO 341 NA 0.5
MD + LD 700 500 - 800 1.4
D PIU' 249 500 - 800 0.5 (year 2010)
OTHERS (Todis, Tuodì, Prixquality, Ekom, etc.) 555 300 - 800 NA

Valuation Parameters of Retail Properties Italy
Data Sheets Food Discount
31
Business type requirements
Product range food oriented
Price level low to average price level (discount campaigns with own brand
competitive price level)
Branch mix one tenant
Sales method self service
Intensity of service low to limited
Valuation factors Market Value
Maintenance p.a. EUR 3 – 6/m²/month
Property management ca. 3 – 5% of GRI p.a.
Allowance for risk of rental loss 2 – 5 %
Modernisation risk Property specific
Useful life 30 – 40 years
Property yield 7 – 10 %
Capitalisation rate 8 – 12 %
Statistics (standard parameters)
Site area 1,000 – 6,000 m²
No. of parking spaces required depending of the surface of the selling area; from 30 to 150
Proportion of value attrib. to the site 10 – 25%
Property size (lettable area) 300 – 1.200 sqm
No. of storeys single storey
Construction ratio usable area/GFA 85 – 90%
Ratio sales area/usable area 70 – 80%
Fit-out specification basic to average
Building costs (excl. site improvements) EUR 600 – 850 /sqm GFA
Ancillary building costs 8 – 12%
Standard market rent p.m. EUR 8 – 15/m²
Gross income multiplier NA
Net Initial Yield 6 – 8 %
Turnover per m² of sales area p.a. EUR 2.500 – 4.000
Rent to sales ratio 5 – 7 %
These recommendations must carefully be verified for each valuation!
Valuation Parameters of Retail Properties Italy
Data Sheets Shopping Centres
32
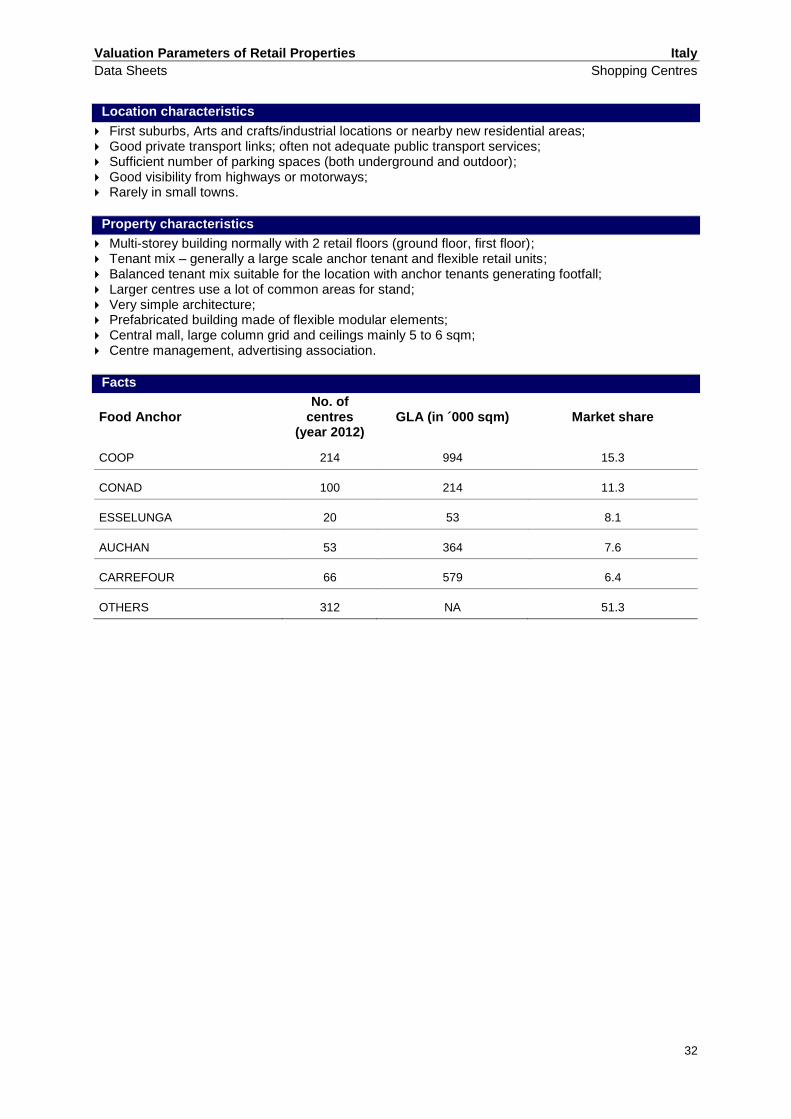
Location characteristics
First suburbs, Arts and crafts/industrial locations or nearby new residential areas; Good private transport links; often not adequate public transport services; Sufficient number of parking spaces (both underground and outdoor); Good visibility from highways or motorways; Rarely in small towns.
Property characteristics
Multi-storey building normally with 2 retail floors (ground floor, first floor); Tenant mix – generally a large scale anchor tenant and flexible retail units; Balanced tenant mix suitable for the location with anchor tenants generating footfall; Larger centres use a lot of common areas for stand; Very simple architecture; Prefabricated building made of flexible modular elements; Central mall, large column grid and ceilings mainly 5 to 6 sqm; Centre management, advertising association.
Facts
Food Anchor No. of
centres (year 2012)
GLA (in ´000 sqm) Market share
COOP 214 994 15.3
CONAD 100 214 11.3
ESSELUNGA 20 53 8.1
AUCHAN 53 364 7.6
CARREFOUR 66 579 6.4
OTHERS 312 NA 51.3
Valuation Parameters of Retail Properties Italy
Data Sheets Shopping Centres
33
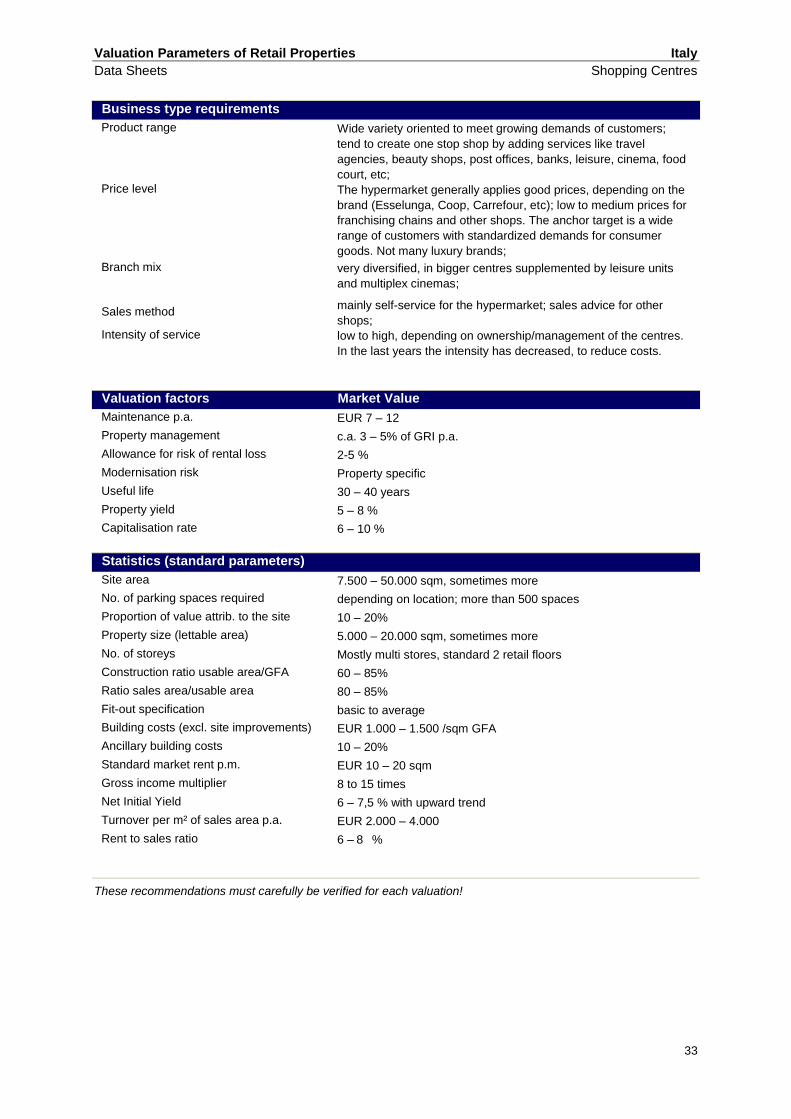
Business type requirements
Product range Wide variety oriented to meet growing demands of customers;
tend to create one stop shop by adding services like travel
agencies, beauty shops, post offices, banks, leisure, cinema, food
court, etc;
Price level The hypermarket generally applies good prices, depending on the
brand (Esselunga, Coop, Carrefour, etc); low to medium prices for
franchising chains and other shops. The anchor target is a wide
range of customers with standardized demands for consumer
goods. Not many luxury brands;
Branch mix very diversified, in bigger centres supplemented by leisure units
and multiplex cinemas;
Sales method mainly self-service for the hypermarket; sales advice for other
shops;
Intensity of service low to high, depending on ownership/management of the centres.
In the last years the intensity has decreased, to reduce costs.
Valuation factors Market Value
Maintenance p.a. EUR 7 – 12
Property management c.a. 3 – 5% of GRI p.a.
Allowance for risk of rental loss 2-5 %
Modernisation risk Property specific
Useful life 30 – 40 years
Property yield 5 – 8 %
Capitalisation rate 6 – 10 %
Statistics (standard parameters)
Site area 7.500 – 50.000 sqm, sometimes more
No. of parking spaces required depending on location; more than 500 spaces
Proportion of value attrib. to the site 10 – 20%
Property size (lettable area) 5.000 – 20.000 sqm, sometimes more
No. of storeys Mostly multi stores, standard 2 retail floors
Construction ratio usable area/GFA 60 – 85%
Ratio sales area/usable area 80 – 85%
Fit-out specification basic to average
Building costs (excl. site improvements) EUR 1.000 – 1.500 /sqm GFA
Ancillary building costs 10 – 20%
Standard market rent p.m. EUR 10 – 20 sqm
Gross income multiplier 8 to 15 times
Net Initial Yield 6 – 7,5 % with upward trend
Turnover per m² of sales area p.a. EUR 2.000 – 4.000
Rent to sales ratio 6 – 8 %
These recommendations must carefully be verified for each valuation!

Valuation Parameters of Retail Properties Italy
Data Sheets Wholesale/Cash & Carry
34
Location characteristics
First suburbs, outskirts of residential areas, even near commercial centres; Sufficient number of parking spaces outdoor; Good visibility; Easily accessed by private transport; Trend: they are going to open not too far from the center of big cities.
Property characteristics
One floor, maximum two floor building; Outdoor parking in front of the building; Functional architecture with basic fit out; Prefabricated building; Large open sale area; Surface starting from 1.000 sqm.
Facts
Food Anchor No. of
Discount Average GLA in
sqm Market share January 2013
METRO 49 1.000 – 3.500 27.8
SELEX (C+C Cash and Carry) 87 1.000 – 3.000 17.8
SIGMA 36 1.000 – 3.000 6.5
CORALIS 31 NA 6.1
CARREFOUR 16 NA 5.8
OTHERS NA NA NA

Valuation Parameters of Retail Properties Italy
Data Sheets Wholesale/Cash & Carry
35
Business type requirements
Product range food oriented
low to average price level Price level
Branch mix one tenant
Sales method self service
Intensity of service low to limited
Valuation factors Market Value
Maintenance p.a. EUR 3 – 6/sqm/mese
Property management ca. 3% – 5% of GRI p.a.
Allowance for risk of rental loss 2 – 5 %
Modernisation risk Property specific
Useful life 30 – 40 years
Property yield 8 – 10 %
Capitalisation rate 8 – 12 %
Statistics (standard parameters)
Site area 1.000 – 6.000 sqm
No. of parking spaces required depending on the surface of the selling area. 40 to 150
Proportion of value attrib. to the site 10 – 25%
Property size (lettable area) 500 – 3.500 sqm
No. of storeys single storey
Construction ratio usable area/GFA 85 – 90%
Ratio sales area/usable area 70 – 80%
Fit-out specification basic to average
Building costs (excl. site improvements) EUR 600 – 850/sqm GFA
Ancillary building costs 8 – 12 %
Standard market rent p.m. EUR 8 – 15/sqm
Gross income multiplier NA
Net Initial Yield 6 – 8%
Turnover per m² of sales area p.a. EUR 2.500 – 4.000
Rent to sales ratio 5 – 7 %
These recommendations must carefully be verified for each valuation!

Valuation Parameters of Retail Properties Romania
Data Sheets Supermarkets
36
Location characteristics
Located mainly within residential areas; The units can be found either in on street premises at the ground floor of apartment blocks or as
standalone units or as anchors within shopping centres; Insufficient parking lots especially for the on street premises; These are the main players on the proximity / convenience retail sector; In terms of items sold, the fresh food areas are representing a trend.
Property characteristics
Mainly single storey buildings/premises; The standalone units are newly raised (built to suit) and cost efficient; Large sales areas with small storage facilities in the back; Parking facilities at the ground level; The international operators are dominating the market;
Facts
Supplier Group No. of stores Total sales
(in million EUR)
Mega Image Delhaize 250 394
Billa REWE 75 284
Source: (Various websites and local knowledge)
The Carrefour Express and Carrefour Market sales are included in the Carrefour’s group total sales in Romania.

Valuation Parameters of Retail Properties Romania
Data Sheets Supermarkets
37
Business type requirements
Product range Offering food and non-food products (i.e. cosmetics,
detergents, beverages); up to 15,000 products to be sold with the
larger formats
Price level average price level (discount campaigns, sometimes
own brands with competitive price levels)
Branch mix one tenant
Sales method Self service; partly salesperson service
Intensity of service limited
Valuation factors Market Value
Maintenance p.a. -
Property management c.a. 1% – 2% of GRI p.a.
Allowance for risk of rental loss -
Modernisation risk -
Useful life 30 years
Property yield 9 – 9,5 %
Capitalisation rate -
Statistics (standard parameters)
Site area 300 – 3.000 sqm
No. of parking spaces required it does not matter, as many as possible, but the one street premise
have very few premises
Proportion of value attrib. to the site 15 – 30%
Property size (lettable area) 150 – 2.500 sqm
No. of storeys usually one storey but, while two storey buildings represent the
exception
Construction ratio usable area/GFA 95%
Ratio sales area/usable area 70 – 80%
Fit-out specification -
Building costs (excl. site improvements) EUR 200 – 3000 /sqm GFA
Ancillary building costs -
Standard market rent p.m. EUR 12 – 16/sqm
Gross income multiplier -
Net Initial Yield 9 – 9 , 5 %
Turnover per m² of sales area p.a. -
Rent to sales ratio -
These recommendations must carefully be verified for each valuation!

Valuation Parameters of Retail Properties Romania
Data Sheets Food Discount
38
Location characteristics
Located mainly within residential areas or at the outskirts of the city on former industrial sites: The units can be found either on street premises at the ground floor of apartment blocks or as
standalone units. There are also few examples on the market when they operate as the food anchor within shopping centres;
Insufficient parking lots especially for the on street premises, otherwise the standalone units have enough parking lots for the potential customers;
Ranked 2nd main players on the proximity / convenience retail sector after supermarkets.
Property characteristics
Mainly single storey buildings / premises; The standalone units are newly raised (built to suit) and cost efficient; Large sales areas (up to 1.200 sqm) with small storage facilities in the back; Parking facilities in the immediate vicinity of the unit; The international operators are dominating the market.
Facts
Supplier Group No. of stores
Total sales (in million EUR)
Lidl Lidl & Schwartz 162 500
Profi Enterprise Investors 168 212
Penny Market REWE 142 450
Source: (Various websites and local knowledge)

Valuation Parameters of Retail Properties Romania
Data Sheets Food Discount
39
Business type requirements
Product range Offering food and non-food products (i.e. cosmetics, detergents,
beverages); up to 1.000 products
Price level Low price level (discount campaigns, sometimes
own brands with competitive price levels)
Branch mix one tenant
Sales method Self service, partly salesperson service
Intensity of service Limited
Valuation factors Market Value
Maintenance p.a. -
Property management -
Allowance for risk of rental loss 3%
Modernisation risk -
Useful life 40 years
Property yield 9 – 9,5 %
Capitalisation rate -
Statistics (standard parameters)
Site area 4.000 – 8.000 sqm
No. of parking spaces required Several hundred up to 600 spaces
Proportion of value attrib. to the site -
Property size (lettable area) 1.000 – 2.500 sqm
No. of storeys one storey
Construction ratio usable area/GFA 95%
Ratio sales area/usable area 75 – 80%
Fit-out specification -
Building costs (excl. site improvements) -
Ancillary building costs -
Standard market rent p.m. EUR 7 – 12/sqm
Gross income multiplier -
Net Initial Yield 9 – 9 , 5 %
Turnover per m² of sales area p.a. -
Rent to sales ratio -
These recommendations must carefully be verified for each valuation!

Valuation Parameters of Retail Properties Romania
Data Sheets Hypermarkets
40
Location characteristics
Located mainly within city limits on the former industrial site due to their size. They can also be found at the outskirts of the cities, with few units operational even on out-of-town sites;
Hypermarkets operate as standalone units with a small to medium shopping galley in front of the cashiers or as food anchors within shopping centres;
Sufficient parking lots for the potential customers (over 1.000), generally located on one level. The underground parking lots are not common for Romania for this type of retail development (with just one exception);
The hypermarkets were the drivers of the modern retail expansion in Romania in early 2000’s since the hypermarket-led schemes were basically the most successful retail format at that time.
Property characteristics
Mainly single storey buildings; The standalone units are newly raised (built to suit) and cost efficient; Large sales areas (up to 17.000 sqm) with storage facilities half of the sales area in the back of the
respective unit; Parking facilities in the immediate vicinity of the unit; The international operators are dominating the market with the local ones not being able to compete
with them.
Facts
Supplier Group No. of stores
Total sales (in million EUR)
Carrefour Carrefour 134 1.100
cora Louis Delhaize 12 328
Auchan Auchan 11 426
Kaufland Lidl& Schwartz 81 1.500
real Metro 24 569
Source: (Various websites and local knowledge)

Valuation Parameters of Retail Properties Romania
Data Sheets Hypermarkets
41
Business type requirements
Product range Offering food and non-food products (i.e. cosmetics, detergents, beverages); up to 60.000 products
Price level Average price level (discount campaigns, sometimes own brands with competitive price levels)
Branch mix one tenant
Sales method Self service, partly salesperson service
Intensity of service Limited
Valuation factors Market Value
Maintenance p.a. -
Property management c.a. 1% of GRI p.a.
Allowance for risk of rental loss 0-1%
Modernisation risk -
Useful life 40 years
Property yield 8 – 8,25 %
Capitalisation rate -
Statistics (standard parameters)
Site area 20.000 – 60.000sqm
No. of parking spaces required 1.000 – 1.500 spaces
Proportion of value attrib. to the site -
Property size (lettable area) 5.000 -15.000sqm
No. of storeys one storey
Construction ratio usable area/GFA 98%
Ratio sales area/usable area 70 – 80%
Fit-out specification -
Building costs (excl. site improvements) -
Ancillary building costs 8 – 10%
Standard market rent p.m. EUR 5 – 10/sqm
Gross income multiplier -
Net Initial Yield 8 – 8 , 2 5 %
Turnover per m² of sales area p.a. -
Rent to sales ratio -
These recommendations must carefully be verified for each valuation!

Valuation Parameters of Retail Properties Romania
Data Sheets DIY Stores
42
Location characteristics
Located mainly on former industrial sites at the outskirts or on out-of-town locations. DIY units can also be found in locations close to means of public transportation within city limits;
The DIY units are generally part of retail parks developed throughout the country and sometimes they operate also standalone units;
Sufficient parking lots for the potential customers (over 800) located on one level; Visible locations on major arteries.
Property characteristics
Mainly single storey buildings; The standalone units are newly raised (built to suit) and cost efficient; Large sales areas (up to 12.000 sqm) with storage facilities half of the sales area in the back of the
respective unit; Parking facilities in the immediate vicinity of the unit; One local retailer is dominating the market with the international ones struggling to keep up the
pace.
Facts
Supplier Group No. of stores
Total sales (in million EUR)
Dedeman Dedeman 30 540
Hornbach Hornbach 5 90
Praktiker Praktiker 27 142
Bricostore Bresson 15 144
Obi Tengelmann 7 138
bauMax bauMax 15 122
Leroy Merlin Adeo 1 30
Source: (Various websites and local knowledge)

Valuation Parameters of Retail Properties Romania
Data Sheets DIY Stores
43
Business type requirements
Product range Offering the largest range of DIY products (over 40.000 items)
Price level Average price level (discount campaigns, sometimes own brands with competitive price levels)
Branch mix one tenant
Sales method Self service, partly salesperson service
Intensity of service Limited
Valuation factors Market Value
Maintenance p.a. -
Property management c.a. 1 – 2% of GRI p.a.
Allowance for risk of rental loss 1%
Modernisation risk -
Useful life 40 years
Property yield 8 – 8,5 %
Capitalisation rate -
Statistics (standard parameters)
Site area 20.000 – 40.000sqm
No. of parking spaces required up to 1.000 spaces
Proportion of value attrib. to the site -
Property size (lettable area) 6.000 -12.000sqm
No. of storeys one storey
Construction ratio usable area/GFA 98%
Ratio sales area/usable area 80 – 85%
Fit-out specification -
Building costs (excl. site improvements) -
Ancillary building costs -
Standard market rent p.m. EUR 7,5 – 9,5/sqm
Gross income multiplier -
Net Initial Yield 8 – 8 , 5 %
Turnover per m² of sales area p.a. -
Rent to sales ratio -
These recommendations must carefully be verified for each valuation!
Valuation Parameters of Retail Properties Romania
Data Sheets Shopping Centres
44
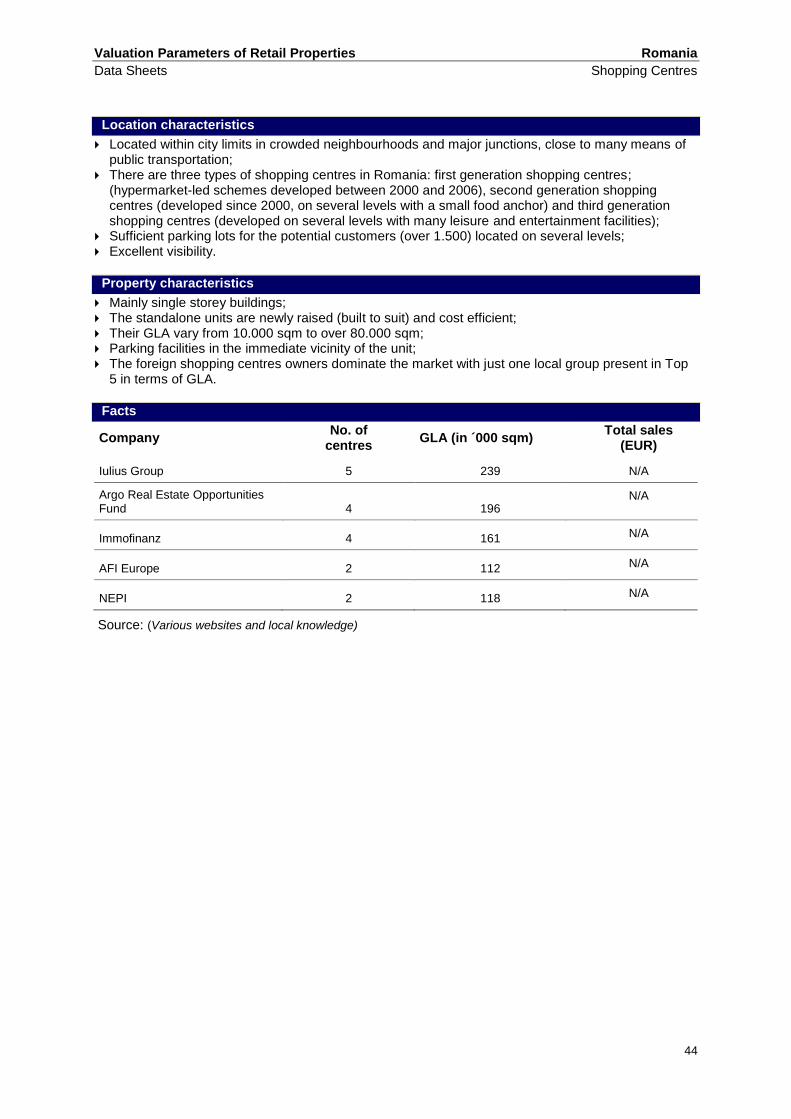
Location characteristics
Located within city limits in crowded neighbourhoods and major junctions, close to many means of public transportation;
There are three types of shopping centres in Romania: first generation shopping centres; (hypermarket-led schemes developed between 2000 and 2006), second generation shopping centres (developed since 2000, on several levels with a small food anchor) and third generation shopping centres (developed on several levels with many leisure and entertainment facilities);
Sufficient parking lots for the potential customers (over 1.500) located on several levels; Excellent visibility.
Property characteristics
Mainly single storey buildings; The standalone units are newly raised (built to suit) and cost efficient; Their GLA vary from 10.000 sqm to over 80.000 sqm; Parking facilities in the immediate vicinity of the unit; The foreign shopping centres owners dominate the market with just one local group present in Top
5 in terms of GLA.
Facts
Company No. of
centres GLA (in ´000 sqm)
Total sales (EUR)
Iulius Group 5 239 N/A
Argo Real Estate Opportunities Fund 4 196
N/A
Immofinanz 4 161 N/A
AFI Europe 2 112 N/A
NEPI 2 118 N/A
Source: (Various websites and local knowledge)
Valuation Parameters of Retail Properties Romania
Data Sheets Shopping Centres
45
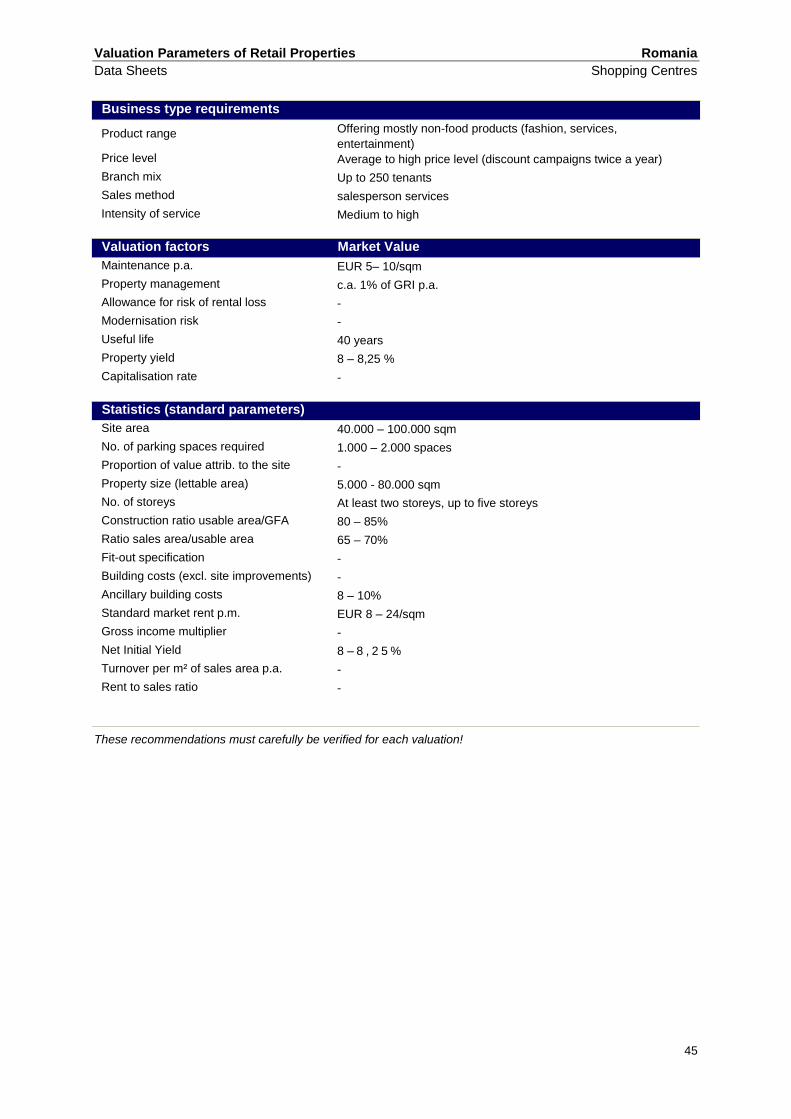
Business type requirements
Product range Offering mostly non-food products (fashion, services,
entertainment)
Price level Average to high price level (discount campaigns twice a year)
Branch mix Up to 250 tenants
Sales method salesperson services
Intensity of service Medium to high
Valuation factors Market Value
Maintenance p.a. EUR 5– 10/sqm
Property management c.a. 1% of GRI p.a.
Allowance for risk of rental loss -
Modernisation risk -
Useful life 40 years
Property yield 8 – 8,25 %
Capitalisation rate -
Statistics (standard parameters)
Site area 40.000 – 100.000 sqm
No. of parking spaces required 1.000 – 2.000 spaces
Proportion of value attrib. to the site -
Property size (lettable area) 5.000 - 80.000 sqm
No. of storeys At least two storeys, up to five storeys
Construction ratio usable area/GFA 80 – 85%
Ratio sales area/usable area 65 – 70%
Fit-out specification -
Building costs (excl. site improvements) -
Ancillary building costs 8 – 10%
Standard market rent p.m. EUR 8 – 24/sqm
Gross income multiplier -
Net Initial Yield 8 – 8 , 2 5 %
Turnover per m² of sales area p.a. -
Rent to sales ratio -
These recommendations must carefully be verified for each valuation!

Valuation Parameters of Retail Properties Romania
Data Sheets Outlet Centres
46
Location characteristics
The only operational factory outlet centre in Romania is located outside Bucharest in the Western area on A1 highway towards Pitesti;
Very good access from the A1 highway as well as from the Western ring road; Sufficient parking lots for the potential customers (over 1.000) located on above ground; Excellent visibility from the A1 highway.
Property characteristics
One storey building; The building is newly raised and cost efficient; The centre hosts retailers that have chosen to sell here their items from older collections; Parking facilities in the immediate vicinity of the unit; Liebrecht&wooD is considering developing another factory outlet centre in the Eastern part of the
Capital on A2 highway towards Constanta.
Facts
Property Group No. of stores
GLA
Fashion House Outlet Centre Liebrecht&wooD 110 16.000
Source: (Various websites and local knowledge)

Valuation Parameters of Retail Properties Romania
Data Sheets Outlet Centres
47
Business type requirements
Product range Offering a large variety of non-food products especially
fashion related
Price level Average price level (permanent discount campaigns
30-70% of the initial price)
Branch mix At least 80 tenants
Sales method salesperson service
Intensity of service Medium to high
Valuation factors Market Value
Maintenance p.a. EUR 4– 8/sqm
Property management c.a. 1% of GRI p.a.
Allowance for risk of rental loss -
Modernisation risk -
Useful life 40 years
Property yield 8,5 – 9 %
Capitalisation rate -
Statistics (standard parameters)
Site area 20.000 – 40.000sqm
No. of parking spaces required 800 – 1.000 spaces
Proportion of value attrib. to the site -
Property size (lettable area) 10.000 -20.000sqm
No. of storeys At least 80 tenants
Construction ratio usable area/GFA 90%
Ratio sales area/usable area 80 – 90%
Fit-out specification -
Building costs (excl. site improvements) -
Ancillary building costs -
Standard market rent p.m. EUR 8 – 15/sqm
Gross income multiplier -
Net Initial Yield 8,5 – 9 %
Turnover per m² of sales area p.a. -
Rent to sales ratio -
These recommendations must carefully be verified for each valuation!

Valuation Parameters of Retail Properties Greece
Data Sheets Shopping Centres
48
Location characteristics
Located largely on the main roads in/out of larger cities/towns, either in central locations of primary or secondary centres, also in district centres;
Often located in or close to the mass market locations; Not met in towns with a population of less than 100.000 residents; Good public and private transport links; If not in city centres, sufficient number of parking spaces (both underground and outdoor); Bad to very good visibility; Trend: revitalisations, project developments in the capital Athens, secondary cities/ towns and -
sometimes - in small towns.
Property characteristics
Construction of modern shopping centers in Greece began after 1990; Multi-storey buildings, normally with 3 retail floors (basement, ground floor, first floor); Normally one - or more - large anchor tenants generate footfall, followed by a wider lettable area,
split into small units occupied by a well balanced tenant mix; Larger centres use a lot of common areas for stand-alone retail stands; The first modern city shopping center in central Athens was "Melathron" by Charagionis Group,
after which the concept of shopping centers changed, and now is more in accordance with shopping centers worldwide;
All shopping centers in Greece have been built in accordance with international requirements for modern shopping centers;
Architecturally modern and functional shopping centers; Column grid, comfortable ceiling heights; Centre management, advertising association; Trend: awareness of operating costs, sustainability and energy efficiency.
Facts
Company No. of
centres GLA (in ´000 sqm) Market share
LAMDA DEVELOPMENT 3 164 NA
VIOHALCO 1 15.5 NA
PASAL 1 18.5 NA
REDS 4 76.5 NA
KONSTANTINOU/TZORTZAKIS 1 23 NA
MC ARTHUR GLEN 1 25 NA
SONAE SIERRA/ROCKSPRING 1 27 NA
CHARAGIONIS 7 38.5 NA
Source: ICSC 2009 (National Committee of Greece), various media portals

Valuation Parameters of Retail Properties Greece
Data Sheets Shopping Centres
49
Business type requirements
Product range Customer oriented, depending on the position of shopping centre
Price level Low to high, depending on location and positioning of the
shopping centre)
Branch mix Diversified branch mix, high proportion of fashion and sportswear,
along with food services and leisure up to a conditional and
cultural level
Sales method Depending on the supplier, ranging from sales advice, self-service
and event shopping
Intensity of service Low to high, depending on the ownership and management of
each centre
Valuation factors Market Value
Maintenance p.a. EUR 4 – 6/sqm/month
Property management ca. 2 – 4% of GRI p.a.
Allowance for risk of rental loss ≥ 5%
Modernisation risk Property specific
Useful life up to 50 years
Property yield 9 – 10 %
Capitalisation rate 12 – 15 %
Statistics (standard parameters)
Site area up to 50.000 sqm
No. of parking spaces required Guideline value: 1 space for 15 – 20 sqm of area
Proportion of value attrib. to the site 20 – 30%
Property size (lettable area) 1.500 – 59.000 sqm
No. of storeys Multi-storey, 2 to 3 retail floors
Construction ratio usable area/GFA N/A
Ratio sales area/usable area ~70%
Fit-out specification Average to high
Building costs (excl. site improvements) EUR 1.000 – 1.500 /sqm GFA
Ancillary building costs 7 – 15%
Standard market rent p.m. EUR 7 – 50 sqm (size based, on usable area)
Gross income multiplier 10 to 12 times
Net Initial Yield 8,5 – 9 , 5 %, depending on investment costs
Turnover per m² of sales area p.a. N/A
Rent to sales ratio -
These recommendations must carefully be verified for each valuation!
Valuation Parameters of Retail Properties Greece
Data Sheets Hypermarkets
50
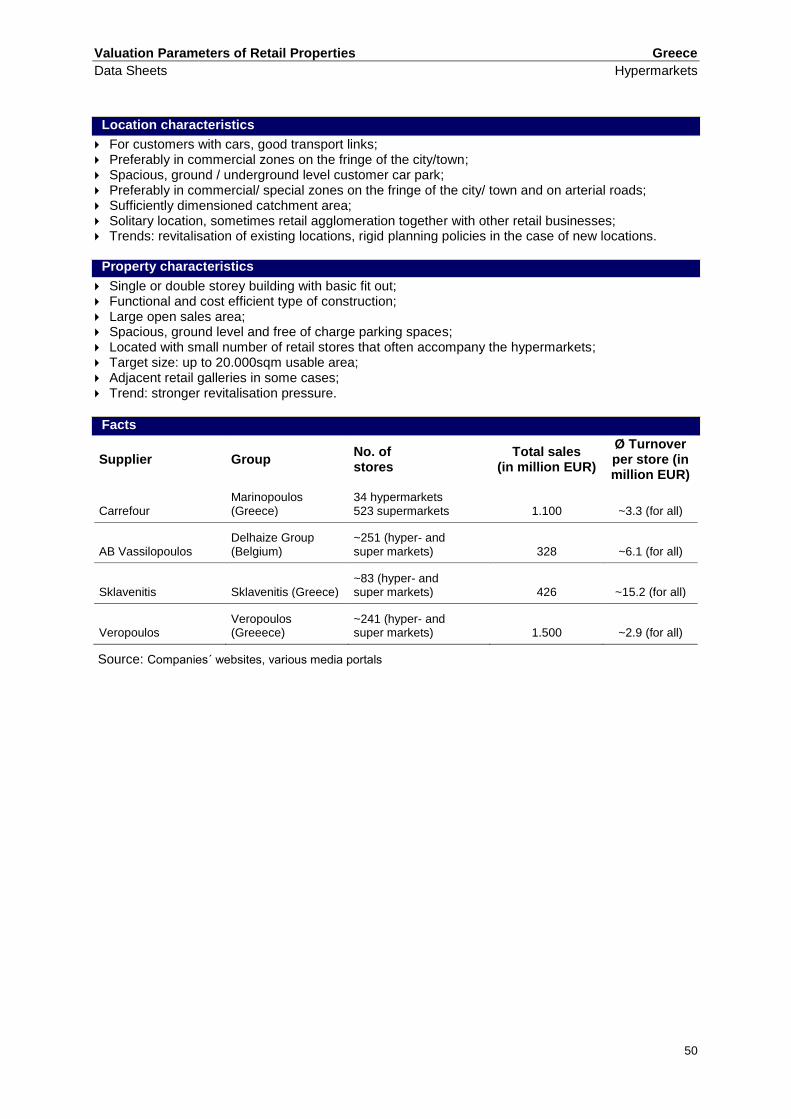
Location characteristics
For customers with cars, good transport links; Preferably in commercial zones on the fringe of the city/town; Spacious, ground / underground level customer car park; Preferably in commercial/ special zones on the fringe of the city/ town and on arterial roads; Sufficiently dimensioned catchment area; Solitary location, sometimes retail agglomeration together with other retail businesses; Trends: revitalisation of existing locations, rigid planning policies in the case of new locations.
Property characteristics
Single or double storey building with basic fit out; Functional and cost efficient type of construction; Large open sales area; Spacious, ground level and free of charge parking spaces; Located with small number of retail stores that often accompany the hypermarkets; Target size: up to 20.000sqm usable area; Adjacent retail galleries in some cases; Trend: stronger revitalisation pressure.
Facts
Supplier Group No. of stores
Total sales (in million EUR)
Ø Turnover per store (in million EUR)
Carrefour Marinopoulos (Greece)
34 hypermarkets 523 supermarkets 1.100 ~3.3 (for all)
AB Vassilopoulos Delhaize Group (Belgium)
~251 (hyper- and super markets) 328 ~6.1 (for all)
Sklavenitis Sklavenitis (Greece) ~83 (hyper- and super markets) 426 ~15.2 (for all)
Veropoulos Veropoulos (Greeece)
~241 (hyper- and super markets) 1.500 ~2.9 (for all)
Source: Companies΄ websites, various media portals

Valuation Parameters of Retail Properties Greece
Data Sheets Hypermarkets
51
Business type requirements
Product range Offering a variety of food, non-food product range, fresh food
department;
Price level Average, with often sales campaigns, some discount-orientated
products and brands (private label);
Branch mix One anchor tenant, plus concessionaires;
Sales method Mainly self-service, high advertising activity, (discounts / special
offers);
Intensity of service Low to average (at specialized sections).
Valuation factors Market Value
Maintenance p.a. EUR 2 – 3/sqm
Property management c.a. 1 – 2% of GRI p.a.
Allowance for risk of rental loss 3 – 5%
Modernisation risk property specific
Useful life 25 – 50 years
Property yield 9,5 –10,5 %
Capitalisation rate 12,5 – 14%
Statistics (standard parameters)
Site area N/A
No. of parking spaces required Guideline value: 1 space for 15-20sqm of area
Proportion of value attrib. to the site 15 – 30%
Property size (lettable area) 5.000 -20.000sqm (Carrefour)
No. of storeys Normally up to two storeys
Construction ratio usable area/GFA ~90%
Ratio sales area/usable area 65 – 80%
Fit-out specification Basic to average
Building costs (excl. site improvements) EUR 450-600/sqm GFA
Ancillary building costs 7 – 15%
Standard market rent p.m. EUR 3,5 – 6/sqm
Gross income multiplier N/A
Net Initial Yield 8,5 – 9 , 5 % depending on investment costs
Turnover per m² of sales area p.a. N/A
Rent to sales ratio 1 – 3%
These recommendations must carefully be verified for each valuation!

Valuation Parameters of Retail Properties Greece
Data Sheets Supermarkets
52
Location characteristics
Good public and private transport links; Located in standalone buildings, on the ground floor of residential or office buildings or in shopping
centers; The majority of the older built supermarkets are situated at the ground floor of residential buildings; Good private and public transport links; Generally good visibility; Sufficient number of parking spaces available, unless situated in central city zones; Trend: re-entering city centres by opening smaller units in a larger number of locations in densely;
populated mixed use areas due to unaffordable transportation costs.
Property characteristics
Single or double storey building with basic fit out; Also ground floor stores in areas of dense development and basement stores in city centres; Functional, cost efficient type of construction; Very limited supply of parking spaces within the city centres; Average functional architecture, if not part of shopping centres or located at the outskirts of cities; Trend: international/some regional chains regularly improve display of goods and fit out, with only
some of the local chains having planned new investments.
Facts
Supplier Group No. of stores
Total sales (in million EUR
EUR, 2011)
ØTurnover per store (in million EUR)
Carrefour, Marinopoulos, OK, Smile
Carrefour / Marinopoulos (Greece) 772 2.497 ~3.2
AB Vassilopoulos Delhaize Group (Belgium) ~251 1.538 ~6.1
Sklavenitis Sklavenitis (Greece) ~83 1.262 ~15.2
Veropoulos Veropoulos (Greece) ~241 703 ~2.9
Lidl Hellas LIDL (German) 230 1.451 6.3
Masoutis Masoutis (Greece) 238 705 3,0
Galaxias PENTE AE (Greece) 132 433 3,3
Arvanitidis Arvanitidis AE & EE (Greece) 170 222 1,3
Makro METRO AG (German) 9 350 38,9
Metro/Cash & Carry, MyMarket
Metro AEBE - Panteliadis (Greece) 90 681 7,6
Source: Companies΄ websites, various media portals

Valuation Parameters of Retail Properties Greece
Data Sheets Supermarkets
53
Business type requirements
Product range Offering a variety of food and convenience goods product range,
with fresh food department; often private label products, new
trend: organic products;
Price level Average, with often sales campaigns, some discount-orientated
products and brands (private label);
Branch mix One tenant;
Sales method Mainly self-service, high advertising activity, (discounts / special
offers); trend: online ordering;
Intensity of service Low to average (at specialized food sections).
Valuation factors Market Value
Maintenance p.a. EUR 1 – 3/sqm
Property management c.a. 1 – 3% of GRI p.a.
Allowance for risk of rental loss at least 5%
Modernisation risk Property specific
Useful life 20 – 40 years
Property yield 9 –11%
Capitalisation rate 12 – 14%
Statistics (standard parameters)
Site area N/A
No. of parking spaces required Guideline value: 1 space for 15-20sqm of area
Proportion of value attrib. to the site 20 – 40%
Property size (lettable area) up to 20.000sqm (Carrefour)
No. of storeys normally up to two storeys
Construction ratio usable area/GFA Less than 80%
Ratio sales area/usable area 65 – 80%
Fit-out specification Basic to average
Building costs (excl. site improvements) EUR 500-700/sqm GFA
Ancillary building costs 7 – 10%
Standard market rent p.m. EUR 3,5 – 5/sqm
Gross income multiplier N/A
Net Initial Yield 8 – 1 0 % depending on investment costs
Turnover per m² of sales area p.a. N/A
Rent to sales ratio 1 – 3%
These recommendations must carefully be verified for each valuation!

Valuation Parameters of Retail Properties Latvia
Data Sheets Supermarkets
54
Location characteristics
Good private and/or public transport access; Local supply function in municipal and private residential areas; If built as greenfield projects within last 10, usually sufficient number of parking spaces; If located in pre 1991 buildings, location is in walking distance from blocks of municipal housing Generally good visibility; Trend: conversion from discounters to small supermarkets to keep customers loyal and happy; Trend: re-entering city centres by anchoring city shopping centres.
Property characteristics
Mostly single storey buildings; Ground floor stores in historical city districts, where new construction is strictly regulated; Ultra functional architecture, if not part of shopping centres; Short supply of parking spaces closer to city centre; Trend: clustering of greenfield projects in some areas; Special feature: supermarkets in pre 1991 buildings usually suffers from inadequate conditions and
due to planning restrictions losing; Special feature: international/regional chains regularly improve display of goods and fit out; some of
the local chains are just happy that initial investment has paid back – no new investments planned to boost ROI.
Facts
Supplier Group No. of stores
Total sales (in million EUR)
ØTurnover Per store (in million EUR)
RIMI RIMI Latvia (ICA Swe/Nor) 34*** 215* 6.32**
MAXIMA MAXIMA Latvia (VP Group- Lithuania) 121 357* 2.95**
IKI Palink (REWE 45% + Coopernik) 52 95 1.83
MEGO Baltstore 66 45 0.682
ELVI Several franchise partners 89 107 0.842
TOP! 16 local partners 179 26 0.145
SKY Skai Baltija 4 31 7.75
Source: company web pages, ICSC Baltic Committee
*) – Calculated turnover for supermarket segment, as retailers are not supplying turnover split by formats
**) – Estimated turnover per supermarket; can change considerably if looking at some particular store – due to actual size (sales
area from 500sqm to 1.400sqm) and location
***) – This number may increase rapidly over coming year, as RIMI has started conversion of its 57 strong “Super Neto”
discount chain into RIMI supermarkets

Valuation Parameters of Retail Properties Latvia
Data Sheets Supermarkets
55
Business type requirements
Product range food and convenience goods;
Price level average, some stores/chains discount-orientated;
Branch mix 5.000 – 15.000 products;
Sales method mostly self-service;
Intensity of service low to average (in smaller stores outside main cities).
Valuation factors Market Value
Maintenance p.a. EUR 4 – 8/sqm
Property management -
Allowance for risk of rental loss 3 – 4 %
Modernisation risk property specific, usually not more than 1%
Useful life 10 – 30 years
Property yield 6 – 12 %
Capitalisation rate 7 – 14 %
Statistics (standard parameters)
Site area 1.000 – 4.000sqm
No. of parking spaces required 1 space per 10 sqm of area
Proportion of value attrib. to the site 8 – 20 %
Property size (lettable area) 200 – 1.500sqm
No. of storeys single storey or integrated
Construction ratio usable area/GFA ~ 95%
Ratio sales area/usable area 75 – 85 %
Fit-out specification Basic to average
Building costs (excl. site improvements) EUR 600-900/sqm GFA
Ancillary building costs Not more than 15 %
Standard market rent p.m. EUR 7 – 12/sqm
Gross income multiplier 6 – 16 times
Net Initial Yield 6 – 9 % depending of fit out quality, location and target customer
segment
Turnover per m² of sales area p.a. EUR 2.000 – 15.000
Rent to sales ratio 2 – 4 %
These recommendations must carefully be verified for each valuation!
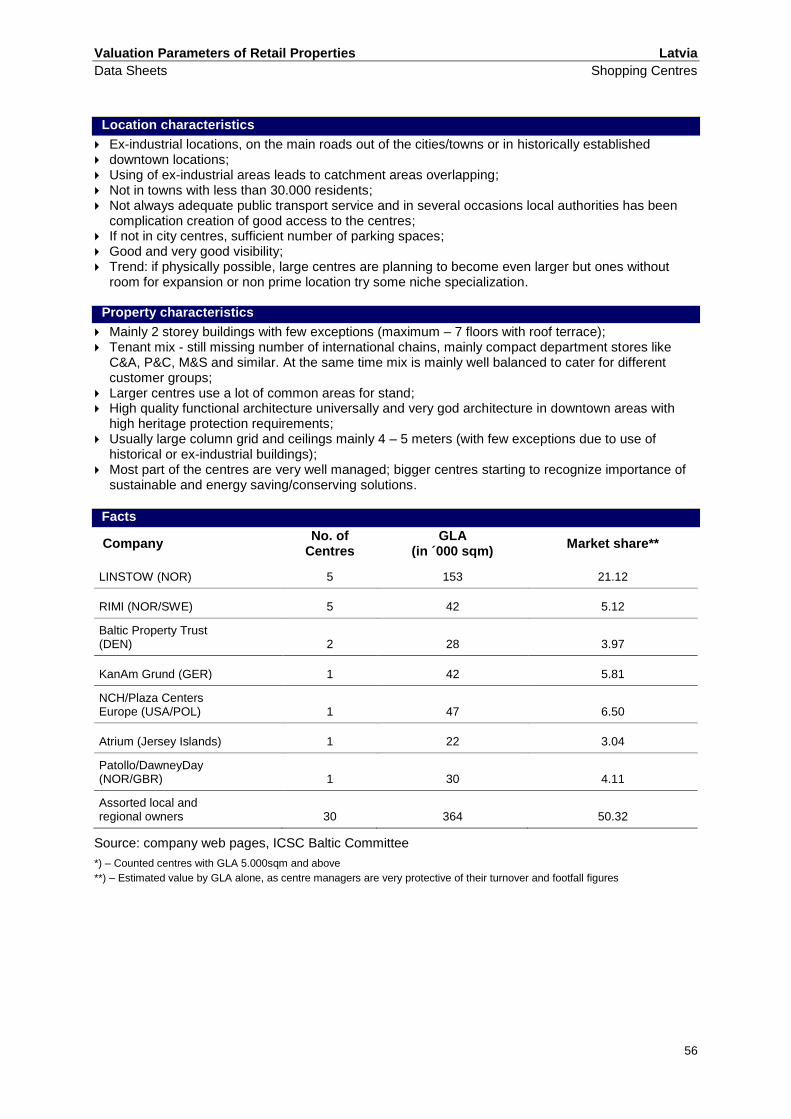
Valuation Parameters of Retail Properties Latvia
Data Sheets Shopping Centres
56
Location characteristics
Ex-industrial locations, on the main roads out of the cities/towns or in historically established downtown locations; Using of ex-industrial areas leads to catchment areas overlapping; Not in towns with less than 30.000 residents; Not always adequate public transport service and in several occasions local authorities has been
complication creation of good access to the centres; If not in city centres, sufficient number of parking spaces; Good and very good visibility; Trend: if physically possible, large centres are planning to become even larger but ones without
room for expansion or non prime location try some niche specialization.
Property characteristics
Mainly 2 storey buildings with few exceptions (maximum – 7 floors with roof terrace); Tenant mix - still missing number of international chains, mainly compact department stores like
C&A, P&C, M&S and similar. At the same time mix is mainly well balanced to cater for different customer groups;
Larger centres use a lot of common areas for stand; High quality functional architecture universally and very god architecture in downtown areas with
high heritage protection requirements; Usually large column grid and ceilings mainly 4 – 5 meters (with few exceptions due to use of
historical or ex-industrial buildings); Most part of the centres are very well managed; bigger centres starting to recognize importance of
sustainable and energy saving/conserving solutions.
Facts
Company No. of
Centres GLA
(in ´000 sqm) Market share**
LINSTOW (NOR) 5 153 21.12
RIMI (NOR/SWE) 5 42 5.12
Baltic Property Trust (DEN) 2 28 3.97
KanAm Grund (GER) 1 42 5.81
NCH/Plaza Centers Europe (USA/POL) 1 47 6.50
Atrium (Jersey Islands) 1 22 3.04
Patollo/DawneyDay (NOR/GBR) 1 30 4.11
Assorted local and regional owners 30 364 50.32
Source: company web pages, ICSC Baltic Committee
*) – Counted centres with GLA 5.000sqm and above
**) – Estimated value by GLA alone, as centre managers are very protective of their turnover and footfall figures
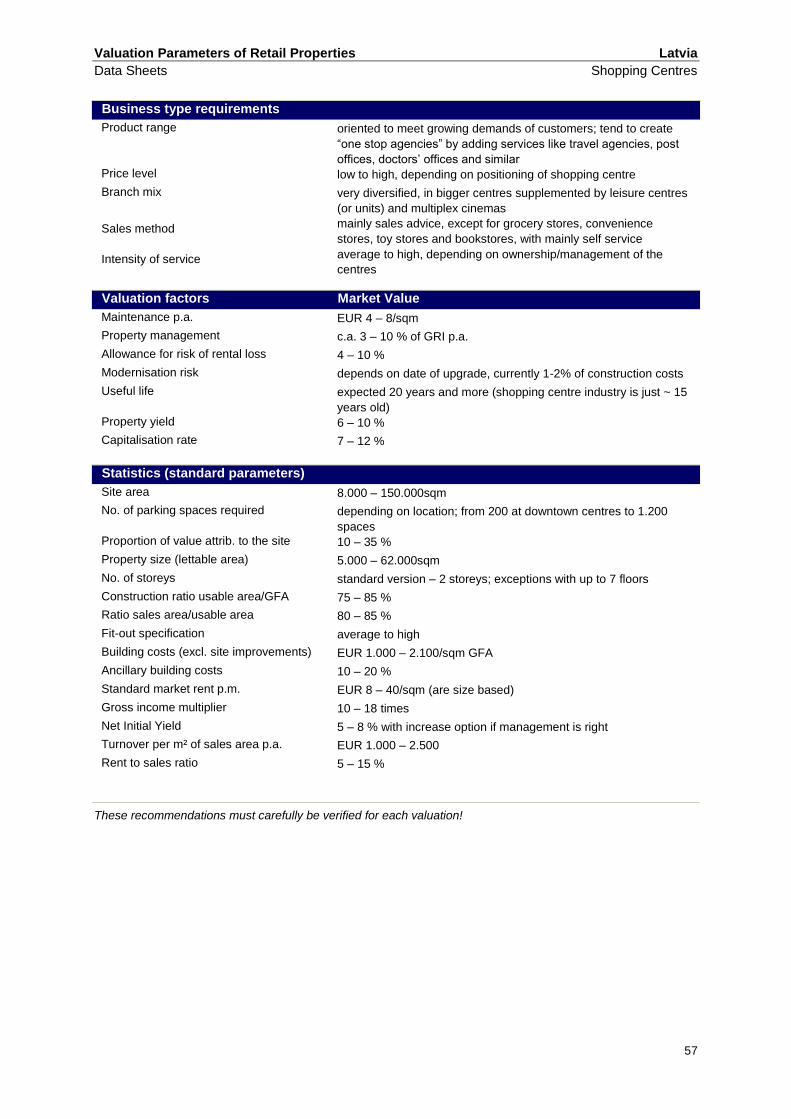
Valuation Parameters of Retail Properties Latvia
Data Sheets Shopping Centres
57
Business type requirements
Product range oriented to meet growing demands of customers; tend to create
“one stop agencies” by adding services like travel agencies, post
offices, doctors’ offices and similar
Price level low to high, depending on positioning of shopping centre
Branch mix very diversified, in bigger centres supplemented by leisure centres
(or units) and multiplex cinemas
Sales method mainly sales advice, except for grocery stores, convenience
stores, toy stores and bookstores, with mainly self service
Intensity of service average to high, depending on ownership/management of the
centres
Valuation factors Market Value
Maintenance p.a. EUR 4 – 8/sqm
Property management c.a. 3 – 10 % of GRI p.a.
Allowance for risk of rental loss 4 – 10 %
Modernisation risk depends on date of upgrade, currently 1-2% of construction costs
Useful life expected 20 years and more (shopping centre industry is just ~ 15
years old)
Property yield 6 – 10 %
Capitalisation rate 7 – 12 %
Statistics (standard parameters)
Site area 8.000 – 150.000sqm
No. of parking spaces required depending on location; from 200 at downtown centres to 1.200
spaces
Proportion of value attrib. to the site 10 – 35 %
Property size (lettable area) 5.000 – 62.000sqm
No. of storeys standard version – 2 storeys; exceptions with up to 7 floors
Construction ratio usable area/GFA 75 – 85 %
Ratio sales area/usable area 80 – 85 %
Fit-out specification average to high
Building costs (excl. site improvements) EUR 1.000 – 2.100/sqm GFA
Ancillary building costs 10 – 20 %
Standard market rent p.m. EUR 8 – 40/sqm (are size based)
Gross income multiplier 10 – 18 times
Net Initial Yield 5 – 8 % with increase option if management is right
Turnover per m² of sales area p.a. EUR 1.000 – 2.500
Rent to sales ratio 5 – 15 %
These recommendations must carefully be verified for each valuation!

Valuation Parameters of Retail Properties Latvia
Data Sheets Hypermarkets
58
Location characteristics
For customers with cars, close to public transport route. Also – inside dense populated areas. Generally very good visibility. If built as out of centre greenfield projects – adequate ground level car parks. Older projects close to centre have limited parking capacity. Latest projects start to try multilevel parking. In major shopping centres or on the main arterial and circular roads inside city limits Initially sufficient catchment area, in some locations spoiled by clustering of hypermarkets All hypermarket networks are planning expansion, some of them looking for potential
buyers/investors. Planning conditions almost always include investment in city infrastructure, but do not prevent
clustering of similar projects in case some location proven successful.
Property characteristics
Almost always single storey Basic and functional design with few exceptions Very functional architecture in greenfield projects with some added design value if hypermarkets is
located inside some industrial heritage building Parking lots at some locations on the city fringe are unofficially used as P&R car depots Trend: periodical improvement of display and interior fit outs; increasing floorspace for
concessionaires, turning several hypermarkets in actual small shopping centres; increasing introduction of compact hypermarkets
Not yet a trend: sustainability and energy efficiency
Facts
Supplier Group No. of stores
Total sales (EUR) 2011/2012
ØTurnover Per store
RIMI RIMI Latvia (ICA Swe/Nor) 20 221mn* 11,05mn**
MAXIMA MAXIMA Latvia (VP Group- Lithuania) 23 272mn* 11,82mn**
PRISMA PRISMA Latvia (S-Group of Finland) 5 24mn 4,8mn***
Source: company web pages, ICSC Baltic Committee
*) – Calculated turnover for hypermarket segment, as retailers are not supplying turnover split by formats
**) – Estimated turnover per hypermarket ; can change considerably if looking at some particular store – due to actual size
(sales area from 1.500sqm to 6.000sqm) and location
***) – 2 out of 5 hypermarkets were opened close to the end of the year

Valuation Parameters of Retail Properties Latvia
Data Sheets Hypermarkets
59
Business type requirements
Product range food and convenience goods, including clothing, footwear,
gardening, DIY and interior decoration segments
Price level average with frequent sales campaigns; MAXIMA and IKI partially
discount oriented
Branch mix up to 40.000 products
Sales method mainly self-service with shop assistants at hot food and some
specialized sections
Intensity of service low to average (in smaller stores outside main cities)
Valuation factors Market Value
Maintenance p.a. EUR 3 – 6/sqm
Property management not more than 1% of GRI p.a. (usually property is retail chain
owned /managed)
Allowance for risk of rental loss Up to 2%
Modernisation risk property and retail chain specific, from 0,5 to 3,0%
Useful life calculated for 20 - 30 years
Property yield 6 – 9%
Capitalisation rate 7 – 11%
Statistics (standard parameters)
Site area 7.000 – 20.000sqm
No. of parking spaces required one space per 10 sqm of sales area
Proportion of value attrib. to the site 5 – 15% (depending on location/proximity to city centre)
Property size (lettable area) 2.500 – 12.000sqm
No. of storeys usually single storey, with few exceptions with underground parking or multistory car park
Construction ratio usable area/GFA 90 – 95%
Ratio sales area/usable area 75 – 90%
Fit-out specification Basic to average
Building costs (excl. site improvements) EUR 750 – 1.000/sqm GFA
Ancillary building costs 8 – 1 5 %
Standard market rent p.m. EUR 7 – 12/sqm
Gross income multiplier 9 – 14 times
Net Initial Yield 7 – 10% depending on construction costs, fit-out level and location
Turnover per m² of sales area p.a. EUR 2.000 – 5.000
Rent to sales ratio 2 – 4%
These recommendations must carefully be verified for each valuation!

Valuation Parameters of Retail Properties Germany
Data Sheets Shopping Centres
60
Location characteristics
In central locations with good public and private transport access in major, medium-sized and increasingly in smaller cities with above-average catchment areas or purchasing power;
New developments mainly in town and city centres.
Property characteristics
Multi-storey building normally with three retail floors (basement, ground to first floors) and often with underground garage;
Balanced tenant mix suitable for the location with large-scale anchor tenants and smaller retail concepts;
Higher quality architecture; daylight in mall areas, transparency of floors; event space in the mall; design concept;
Centre management, advertising association; Trend: green building certification with benefits for service charges; Trend: increasing percentage of space reserved for food services (Food Court with ‘lounge’ area); Trend: efficiency of space.
Facts
Company No. of
Centres GLA
( in ´000 sqm) Market Share
ECE 78 2,328 23,0%
Metro 30 975 9,63%
Mfi 19 668 6,6%
JLL 16 359 3,86%

Valuation Parameters of Retail Properties Germany
Data Sheets Shopping Centres
61
Business type requirements
Product range Orientated to the (often) discerning demands of customers
depending on the positioning of the shopping centre;
Price level Average to high, depending on the positioning of the shopping
centre;
Branch mix Diversified branch mix, high proportion of fashion and food
outlets, supplemented by services and leisure;
Sales method Depending on supplier, ranging from sales advice, event shopping to self-service;
Intensity of service High (central management, advertising association).
Valuation factors Market Value MLV
Maintenance p.a. EUR 9 – 14/sqm EUR 9 – 14/sqm
Property management c.a. 1 – 3% of GRI p.a. c.a. 2 – 3% of GRI p.a.
Allowance for risk of rental loss ≥ 4% ≥ 4%
Modernisation risk Property-specific 0.5 – 3.0% of standard
construction costs
Useful life Up to 50 years 15 – 50 years
Property yield 5,5 – 8,0% -
Capitalisation rate - 6.5 – 9.0%
Statistics (standard parameters)
Site area 6.000 – 20.000sqm
No. of parking spaces required 400 – 1,500 spaces
Proportion of value attrib. to the site 30 – 50%
Property size (lettable area) 10,000 – 30,000sqm
No. of storeys Mostly multi-storey, standard 2–3 retail floors
Construction ratio usable area/GFA ca. 65%
Ratio sales area/usable area ca. 80%
Fit-out specification average to high quality
Building costs (excl. site improvements) EUR 1.300 – 2.800/sqm GFA
Ancillary building costs ca. 15%
Standard market rent p.m. EUR 20 – 35/sqm
Gross income multiplier 13 – 19 times
Net Initial Yield 5.5 – 7.0%, with stable trend
Turnover per m² of sales area p.a. EUR 2.500 – 5.000
Rent to sales ratio 7 – 9%
These recommendations must carefully be verified for each valuation!

Valuation Parameters of Retail Properties Germany
Data Sheets Supermarkets
62
Location characteristics
Normally, good private and public transport links; Local supply function in core and residential areas; Sufficient number of parking spaces available (if existing); Often also combined locations (smaller retail parks); Higher visibility; Trend: increasing presence in town/city centres (local supply function for the residents in the
surrounding area).
Property characteristics
Either single-storey construction or as a shop unit in a residential/commercial property; Generally located at ground floor level, but sometimes also in the basement; Basic and functional design, unpretentious architecture; Trend: new sales concepts (city stores) and improvement in attractiveness (higher quality
presentation of products, new lighting concepts, positioning and height of shelving etc.).
Facts
Supplier Group No. of stores
Total sales (EUR)
ØTurnover per store (EUR)
EDEKA EDEKA 9.309 23,96bn 2,58m
Rewe Rewe Group 2.375 6,15bn 2,59m
Kaisers Tengelmann Tengelmann H. 718 2,54bn 3,53m
Tegut Gutberlet Fam. 300 1,10bn 3,67m
Source: wer-zu-wem.de (as at: September 2009)
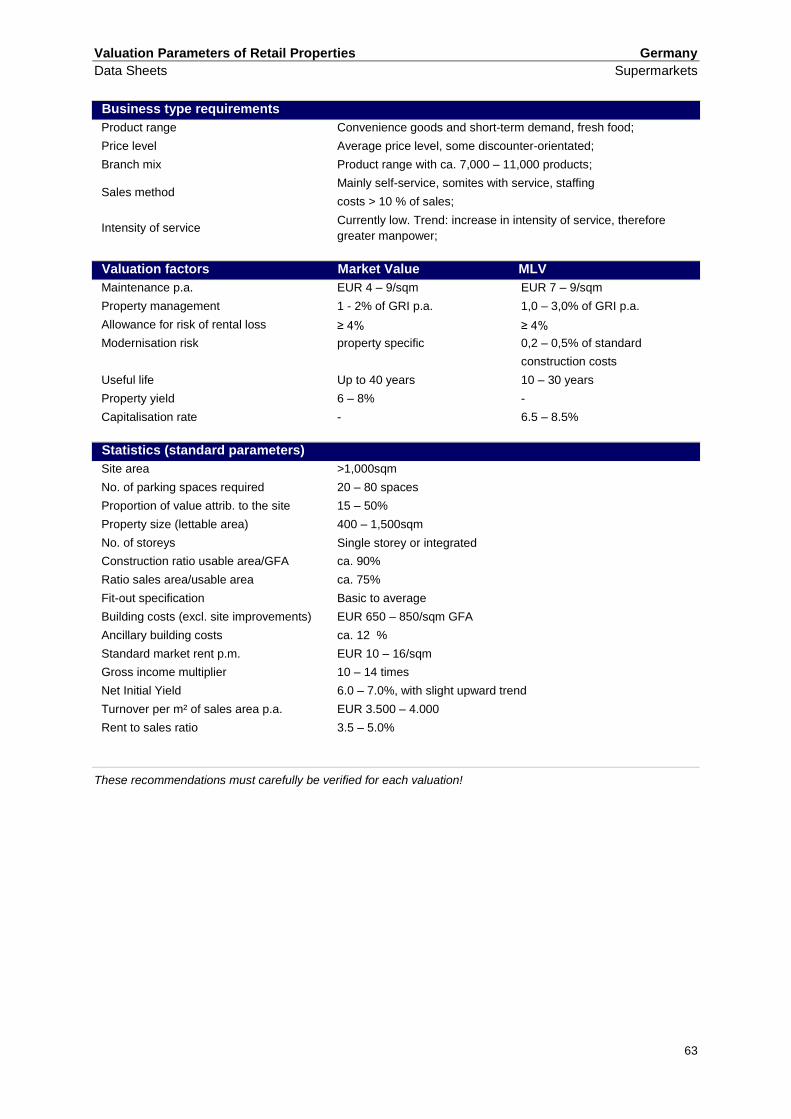
Valuation Parameters of Retail Properties Germany
Data Sheets Supermarkets
63
Business type requirements
Product range Convenience goods and short-term demand, fresh food;
Price level Average price level, some discounter-orientated;
Branch mix Product range with ca. 7,000 – 11,000 products;
Sales method Mainly self-service, somites with service, staffing
costs > 10 % of sales;
Intensity of service Currently low. Trend: increase in intensity of service, therefore
greater manpower;
Valuation factors Market Value MLV
Maintenance p.a. EUR 4 – 9/sqm EUR 7 – 9/sqm
Property management 1 - 2% of GRI p.a. 1,0 – 3,0% of GRI p.a.
Allowance for risk of rental loss ≥ 4% ≥ 4%
Modernisation risk property specific 0,2 – 0,5% of standard
construction costs
Useful life Up to 40 years 10 – 30 years
Property yield 6 – 8% -
Capitalisation rate - 6.5 – 8.5%
Statistics (standard parameters)
Site area >1,000sqm
No. of parking spaces required 20 – 80 spaces
Proportion of value attrib. to the site 15 – 50%
Property size (lettable area) 400 – 1,500sqm
No. of storeys Single storey or integrated
Construction ratio usable area/GFA ca. 90%
Ratio sales area/usable area ca. 75%
Fit-out specification Basic to average
Building costs (excl. site improvements) EUR 650 – 850/sqm GFA
Ancillary building costs ca. 12 %
Standard market rent p.m. EUR 10 – 16/sqm
Gross income multiplier 10 – 14 times
Net Initial Yield 6.0 – 7.0%, with slight upward trend
Turnover per m² of sales area p.a. EUR 3.500 – 4.000
Rent to sales ratio 3.5 – 5.0%
These recommendations must carefully be verified for each valuation!

Valuation Parameters of Retail Properties Germany
Data Sheets Hypermarkets
64
Location characteristics
Positioned on main transport routes, public transport access not essential, sometimes also in town/city centres;
Regional supply function; Sufficient parking spaces, also in multi-storey car parks; Often with cash desks to the front or in conjunction with retail warehouses.
Property characteristics
Single to two-storey construction; Mainly freestanding with good visibility; Good delivery situation for trucks and trailers; Quality of building and architecture subject to quality level; Trends:
- improvement in service quality by offering larger fresh produce departments, service counters, wine departments and café/restaurant;
- requirement for higher quality architecture, interior design and lighting, and corporate design;
- sales area reducing per store; - larger stores are closing and/or being reduced in size;
Facts
Supplier Group No. of stores
Total sales (EUR)
ØTurnover per store (EUR)
REAL Metro Group 349 8,7bn 24,9m
Kaufland Schwarz Stiftung N/A 8,7bn N/A
Marktkauf Edeka 186 4,28bn 23,1m
Globus Rewe N/A N/S N/A
Source: EHI 2008

Valuation Parameters of Retail Properties Germany
Data Sheets Hypermarkets
65
Business type requirements
Product range Products satisfying daily and convenience needs, fresh produce
with large range of quality between retail brands and delicatessen,
clothing, household goods, toys, car accessories, small furniture;
Trend: increasing percentage of organic products;
Trend: reduction in the percentage of clothing and household
goods being offered.
Price level Wide price ranges, according to quality and range of products
offered;
Branch mix Product range of ca. 30,000 – 50,000.
Sales method Self-service, service counters depending on quality of products
offered, staffing costs 11 – 12% of turnover;
Intensity of service Low to high depending on quality of products offered.
Valuation factors Market Value MLV
Maintenance p.a. EUR 5 – 8/sqm EUR 5 – 8/sqm
Property management 1 - 2% of GRI p.a. 1 - 3%of GRI p.a.
Allowance for risk of rental loss ≥ 4% ≥ 4%
Modernisation risk property specific 0.2 – 1,2% of standard
construction costs
Useful life up to 50 years 10 - 40 years
Property yield 6 – 8% -
Capitalisation rate - 6.5 – 9%
Statistics (standard parameters)
Site area >10,000m²
No. of parking spaces required 200 – 500 spaces
Proportion of value attrib. to the site 15 – 30%
Property size (lettable area) 5.000 – 10.000m²
No. of storeys Normally single storey, sometimes underground car park/ parking deck
Construction ratio usable area/GFA ca. 90%
Ratio sales area/usable area ca. 75%
Fit-out specification Basic to average
Building costs (excl. site improvements) EUR 900 – 1.300/m² GFA
Ancillary building costs ca.12%
Standard market rent p.m. EUR 8.00 – 13.00/m²
Gross income multiplier 10 – 13 times
Net Initial Yield 6.0 – 7.0%, with slight upward trend
Turnover per m² of sales area p.a. EUR 3.500 – 4.500
Rent to sales ratio 4.0 – 4.5%
These recommendations must carefully be verified for each valuation!

Valuation Parameters of Retail Properties Germany
Data Sheets Food Discounters
66
Location characteristics
Accessible locations on busy transport routes; Commercial and special zones in municipalities with < 5,000 inhabitants; Soft discounters also in retail agglomerations (central locations, town centre shopping centres); Increasingly grouped together (retail parks in out-of-town locations); Sufficiently sized car park; Accessibility by car from both directions (left hand turning lanes provided).
Property characteristics
Single-storey, basic fitout specification, basic architecture (low cost construction); Standard overall concept; Optimum delivery of goods from a user’s perspective; Trend: integrated bakery dispensers with continuous supply of fresh bakery products; Trend: low energy construction (heat recovery, solar energy etc.).
Facts
Supplier Group No. of stores
Total sales (in billion EUR)
ØTurnover per store (in million
EUR)
Lidl Schwarz Stiftung 3,004 30.6 10.2
Netto (Plus) Edeka 3,676 11.04 3
Aldi-Nord Aldi Gruppe 2,531 9.99 3.95
Aldi-Süd Aldi-Group 1,735 11.35 6.45
Penny Rewe 2,060 5.5 2.57
Source: wer-zu-wem.de (as at: September 2009)
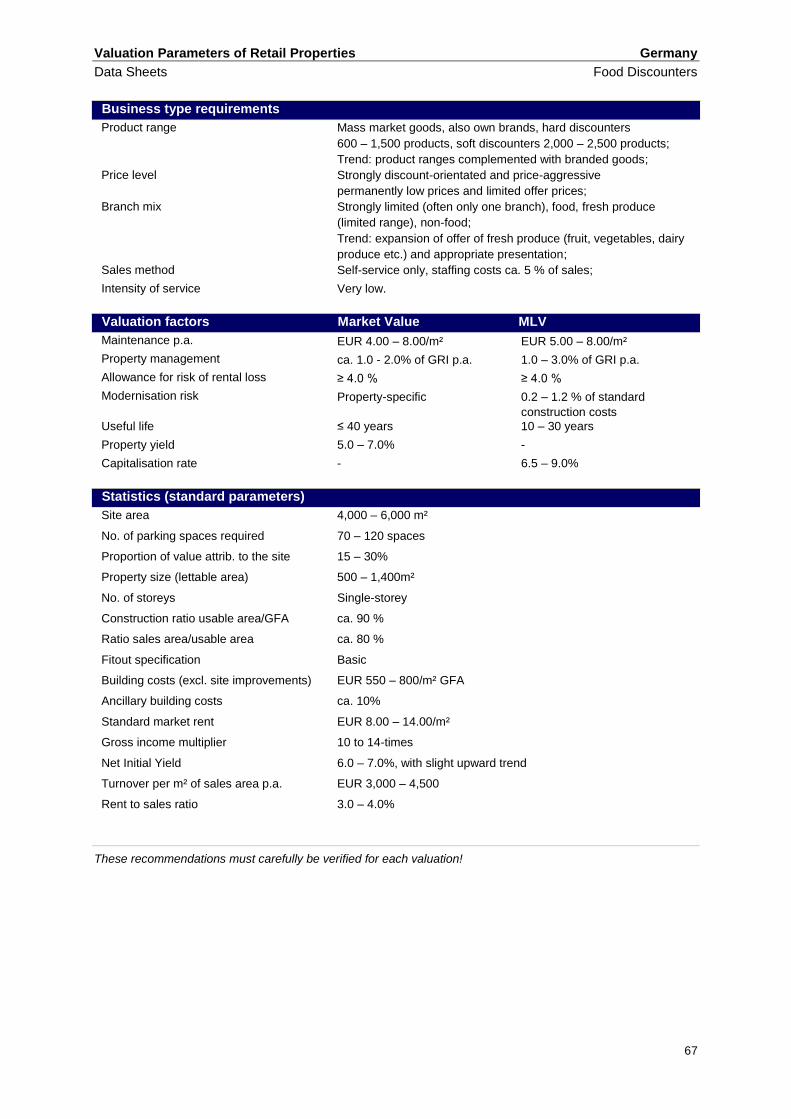
Valuation Parameters of Retail Properties Germany
Data Sheets Food Discounters
67
Business type requirements
Product range Mass market goods, also own brands, hard discounters
600 – 1,500 products, soft discounters 2,000 – 2,500 products;
Trend: product ranges complemented with branded goods;
Price level Strongly discount-orientated and price-aggressive
permanently low prices and limited offer prices;
Branch mix Strongly limited (often only one branch), food, fresh produce
(limited range), non-food;
Trend: expansion of offer of fresh produce (fruit, vegetables, dairy
produce etc.) and appropriate presentation;
Sales method Self-service only, staffing costs ca. 5 % of sales;
Intensity of service Very low.
Valuation factors Market Value MLV
Maintenance p.a. EUR 4.00 – 8.00/m² EUR 5.00 – 8.00/m²
Property management ca. 1.0 - 2.0% of GRI p.a. 1.0 – 3.0% of GRI p.a.
Allowance for risk of rental loss ≥ 4.0 % ≥ 4.0 %
Modernisation risk Property-specific 0.2 – 1.2 % of standard
construction costs
Useful life ≤ 40 years 10 – 30 years
Property yield 5.0 – 7.0% -
Capitalisation rate - 6.5 – 9.0%
Statistics (standard parameters)
Site area 4,000 – 6,000 m²
No. of parking spaces required 70 – 120 spaces
Proportion of value attrib. to the site 15 – 30%
Property size (lettable area) 500 – 1,400m²
No. of storeys Single-storey
Construction ratio usable area/GFA ca. 90 %
Ratio sales area/usable area ca. 80 %
Fitout specification Basic
Building costs (excl. site improvements) EUR 550 – 800/m² GFA
Ancillary building costs ca. 10%
Standard market rent EUR 8.00 – 14.00/m²
Gross income multiplier 10 to 14-times
Net Initial Yield 6.0 – 7.0%, with slight upward trend
Turnover per m² of sales area p.a. EUR 3,000 – 4,500
Rent to sales ratio 3.0 – 4.0%
These recommendations must carefully be verified for each valuation!

Valuation Parameters of Retail Properties Germany
Data Sheets Retail Warehouses
68
Location characteristics
For customers with cars, good transport links; Very good visibility; Spacious ground level customer car park; Preferably in commercial/ special zones on the fringe of the city/ town and on main transport routes; Sufficiently large catchment area; Mainly in retail agglomeration together with other retail businesses (retail parks, retail warehouse
agglomerations) to exploit synergy effects; Trend: also located in sub centres and less attractive secondary locations; Trend: increasingly locating in so-called hybrid malls (hybrids of retail park and shopping centre),
mainly in district centres or town centre locations.
Property characteristics
Single-storey, basic fitout specification; Functional, low cost construction; Spacious if possible ground level with free of charge parking spaces close to the property; Target size: between 200 m² (bed/mattress stores) and 6,500 m² (consumer electronics); Trend: construction of stores which are cost efficient in terms of property maintenance and energy
consumption; Trend: focus on higher quality architectural design, despite basic construction.
Facts
Supplier Group No. of stores
Total sales (in billion EUR)
ØTurnover per store (in million
EUR)
Media-Markt Metro Group 353 10.4 29.5
fressnapf Fressnapf 692 0.674 0.97
dm-Drogerie dm Karlsruhe 936 2.43 0.46
KIK Tengelmann 2,039 0.939 0.46
Concord Concord 600 0.175 0.29
Source: EHI 2008

Valuation Parameters of Retail Properties Germany
Data Sheets Retail Warehouses
69
Business type requirements
Product range Broad and extensive product range. Trend: extension of product
ranges to increase margins;
Price level Low to average price level, some discount-orientated (own
brands);
Branch mix One line of business /type of goods. Trend: additional income by
subletting to bakeries and snack bars;
Sales method Mainly self-service, high advertising activity (discounts/ special
offers);
Intensity of service Low to average. Trend: sustained reduction in service quality to
save staff costs.
Valuation factors Market Value MLV
Maintenance p.a. EUR 5.00 – 8.00/m² EUR 5.00 – 8.00/m²
Property management 1.0 – 2.0% of GRI p.a. 1.0 – 3.0% of GRI p.a
Allowance for risk of rental loss ≥ 4.0% ≥ 4.0%
Modernisation risk Property-specific 0.2 – 1.2% of standard
construction costs
Useful life ≤ 40 years 10 – 30 years
Property yield 6.0 – 8.5% -
Capitalisation rate - 6.5 – 8.5%
Statistics (standard parameters)
Site area General statement not possible
No. of parking spaces required ca. 30 – 300 spaces
Proportion of value attrib. to the site 15 – 30%
Property size (lettable area) 200 – 10,000 m²
No. of storeys Single-storey
Construction ratio usable area/GFA ca. 90%
Ratio sales area/usable area 90%
Fit-out specification Basic
Building costs (excl. site improvements) EUR 550.00 – 800.00/m² GFA
Ancillary building costs ca. 10%
Standard market rent p.m. EUR 5.00 – 20.00/m²
Gross income multiplier 10 to 13-times
Net Initial Yield 6.0 – 7.0%, with stagnating tendency
Turnover per m² of sales area p.a. EUR 1,000 – 6,500
Rent to sales ratio 2.5– 12.5%
Note: Retail parks are normally traded at lower yields/higher gross income multipliers than isolated locations.

Valuation Parameters of Retail Properties Germany
Data Sheets DIY stores
70
Location characteristics
Locations with good transport links, possibly on main transport routes, public transport access not Essential;
Municipal to regional appeal; Sufficient parking provision, highly visible; Often located in commercial estates and in integrated locations with other retail warehouses.
Property characteristics
Single-storey construction; Heated and unheated sheds; Large external sales area (with and without roof) ; Freestanding with high visibility; Good delivery situation for trucks and trailers; Basic construction and architectural quality; Trend: closure, particularly of smaller stores with lower space and cost efficiency; Trend: integration of drive-in concepts.
Facts
Supplier Group No. of stores
Total sales (in billion EUR)
ØTurnover per store (in million
EUR)
Toom Rewe 385 2 5.2
OBI Tengelmann 334 3.5 10.5
Hagebau Hagebau 286 3.3 11.6
Praktiker Praktiker 275 3.9 14.2
Hornbach Hornbach 83 2.4 28.5
Source: wer-zu-wem.de (as at: September 2009)

Valuation Parameters of Retail Properties Germany
Data Sheets DIY stores
71
Business type requirements
Product range DIY product range, building materials, garden tools and supplies,
pet supplies, lamps, car parts, arts & crafts, small furniture;
Price level Low to average;
Branch mix Product range of ca. 15,000 – 30,000;
Sales method Self-service, staff costs < 10% of turnover.
Intensity of service Very low.
Valuation factors Market Value MLV
Maintenance p.a. EUR 3.00 – 8.00/m² EUR 5.00 – 8.00/m²
Property management 1.0 – 2.0% of GRI p.a. 1.0 – 3.0% of GRI p.a
Allowance for risk of rental loss ≥ 4.0% ≥ 4.0%
Modernisation risk Property-specific 0.2 – 1.2% of standard
construction costs
Useful life Up to 50 years 10 – 30 years
Property yield 6.0 – 8.5% -
Capitalisation rate - 6.5 – 8.5%
Statistics (standard parameters)
Site area 10,000 – 50,000 m²
No. of parking spaces required 200 – 400 spaces
Proportion of value attrib. to the site 10 – 35%
Property size (lettable area) 3,500 – 20,000 m²
No. of storeys single-storey
Construction ratio usable area/GFA ca. 95%
Ratio sales area/usable area ca. 90%
Fit-out specification basic
Building costs (excl. site improvements) EUR 550 – 800/m² GFA
Ancillary building costs ca. 10%
Standard market rent p.m. EUR 5.00 – 12.00/m² (normally < EUR 10.00/m²)
Gross income multiplier 9 to 13-times
Net Initial Yield 6.5 – 8.0%, with slight upward trend
Turnover per m² of sales area p.a. EUR 800 – 2,200
Rent to sales ratio 5.5 – 7.5%

Valuation Parameters of Retail Properties Germany
Data Sheets FOC – Factory Outlet Centres
72
Location characteristics
Mainly difficult planning consent procedure (core area, special zones); Good accessibility by car, if possible close to motorway intersections outside of city/ town centres; Often attempts to locate in tourist areas (e.g. Lüneburger Heide); Still of comparatively minor importance in Germany. Highest FOC density in Europe in UK (clear trend of saturation); Preferred catchment area between 4 and up to 5.5 inhabitants or 3 million inhabitants within one
hour’s drive.
Property characteristics
Single-storey buildings with USP, e.g. village style, min. 30 individual shops, each from ca. 200 m². German FOC are on average ca. 20% smaller than those in other European countries;
Uniform opening hours similar to shopping centres; Control and marketing by a very active centre management; Sufficient number of parking spaces free of charge (ca. 1 parking space per 10 m² sales area is considered as convenient); Normally each shop is heated separately; Trend: 3 new openings in 2012 (Neumünster, Soltau and Ochtrup). A further 10 FOCs at advanced
planning stage’ in Germany; Trend: retrospective expansions of existing FOCs with second building phase; Trend: attractive areas to relax (‘event shopping’, ‘Place to be’).
Facts
Property Group
No. of stores (Europe)
Sales area (sqm)
FOC Zweibrücken Neinver 12 18,200
FOC Wustermark Mc Arthur Glen 17 10,300
FOC Wertheim Value Retail 9 13,500
FOC Ingolstadt Value Retail 9 9,400
FOC Wolfsburg OCI-Outlet 1 10,000
Source: ecostra

Valuation Parameters of Retail Properties Germany
Data Sheets FOC – Factory Outlet Centres
73
Business type requirements
Product range Normally unsold stock, collections from the previous season,
sample collections, products with faults (second quality),
discontinued lines;
Price level According to information, min. 30% below recommended retail
price (difficult for customer to verify, example: manufacturers also
produce products exclusively for FOC;
Branch mix Strong focus on clothing including shoes, sportswear,
glass, porcelain, household goods and food outlets;
Sales method Direct sale by industry to the end consumer, thus bypassing local
retail, service (professional shop assistants) with the philosophy
based on ‘brand competence’ and ‘transparent price reductions’.
Trend: integration of online offers in the FOC, e.g. Apps;
Intensity of service High due to well-known brands.
Valuation factors Market Value MLV
Maintenance p.a. EUR 6.50 – 12.00/m² EUR 7.50 – 12.00/m²
Property management 2.0 – 3.0% of GRI p.a. 2.0 – 3.0% of GRI p.a
Allowance for risk of rental loss ≥ 4.0% ≥ 4.0%
Modernisation risk Property-specific 0.2 – 2.0% of standard
construction costs
Useful life up to 50 years Property-specific
Property yield 6.0 – 8.5% -
Capitalisation rate - 6.5 – 9.0%
Statistics (standard parameters)
Site area Normally over 40,000 m²
No. of parking spaces required Over 1,000 spaces
Proportion of value attrib. to the site 15 – 25%
Property size (lettable area) 10,000 – 25,000 m²
No. of storeys 1 – 2 storey
Construction ratio usable area/GFA ca. 85%
Ratio sales area/usable area ca. 80%
Fit-out specification Average
Building costs (excl. site improvements) EUR 1,300 – 2,500/m² GFA
Ancillary building costs ca. 15%
Standard market rent p.m. EUR 25.00 – 35.00/m²
Gross income multiplier 14 to 16-times
Net Initial Yield Over 6.25%, with stable trend
Turnover per m² of sales area p.a. EUR 4,000 – 5,500
Rent to sales ratio 8.0 – 12.0%

Valuation Parameters of Retail Properties Poland
Data Sheets Supermarkets
74
Location characteristics
Location at the residential area; Located in standalone buildings or on the ground floor of residential or office buildings. Also in
shopping centers; Sufficient number of parking spaces.
Property characteristics
Single story building with basic fit out; Ground level parking; Functional, cost efficient type of construction; Large open sales area; Trend: The growing demand for delicatessen especially in large and medium cities.
Facts
Supplier Group No. of stores
Total sales (EUR)
ØTurnover per store
(EUR)
Tesco Tesco 137 (hypermarkets) 313 (supermarkets)
12.6 bn 2011/2012 28mn
Carrefour Carrefour ~100 N/A N/A
E.Leclerc E.Leclerc 40 (hyper – and supermarkets)
~ 662 mn 2011 16,5mn
Stokrotka Emperia Holding 201 437.5 mn
2012 2,2mn
Piotr i Paweł Piotr i Paweł 90 € 460.5 mn
2012 5,1mn
Alma Alma Market No info € 382 mn
2012 N/A
Source: various media portals

Valuation Parameters of Retail Properties Poland
Data Sheets Supermarkets
75
Business type requirements
Product range Offering food and non-food products (i.e. cosmetics,
detergents, beverages);
Price level Average price level (discount campaigns, sometimes own
brands with competitive price levels);
Branch mix One tenant;
Sales method Self service, partly salesperson service;
Intensity of service Limited;
Valuation factors Market Value
Maintenance p.a. EUR 1 – 2/sqm
Property management c.a. 1 – 2% of GRI p.a.
Allowance for risk of rental loss 0%
Modernisation risk property specific
Useful life 20 – 30 years
Property yield 7,25 – 8%
Capitalisation rate 12,5 – 13,7%
Statistics (standard parameters)
Site area 1.000 – 5.000 sqm
No. of parking spaces required N/A
Proportion of value attrib. to the site 10 – 250%
Property size (lettable area) 500 – 2.500 sqm
No. of storeys 1
Construction ratio usable area/GFA ~ 90%
Ratio sales area/usable area 65 – 80%
Fit-out specification basic
Building costs (excl. site improvements) EUR 400 – 600/sqm GFA
Ancillary building costs 8 – 12%
Standard market rent p.m. EUR 8 – 16/sqm
Gross income multiplier N/A
Net Initial Yield 7,25 – 8
Turnover per m² of sales area p.a. N/A
Rent to sales ratio 0%
These recommendations must carefully be verified for each valuation!

Valuation Parameters of Retail Properties Poland
Data Sheets Food Discount
76
Location characteristics
Location at the residential area; Located in standalone buildings or on the ground floor of residential buildings. Sufficient number of parking spaces.
Property characteristics
Single story building with basic fit out; Ground level parking; Functional, cost efficient type of construction; Large open sales area; Trend: The growing demand for delicatessen especially in large and medium cities.
Facts
Supplier Group No. of stores
Total sales (EUR)
ØTurnover per store
(EUR)
Biedronka Jeronimo Martins Polska S.A. 2.100 6,7bn 3,2bn
Lidl Schwarz Group 320 N/A N/A
Netto Dansk Supermarked 281 N/A N/A
Source: various media portals

Valuation Parameters of Retail Properties Poland
Data Sheets Food Discount
77
Business type requirements
Product range Offering food and non-food products (i.e. cosmetics, detergents,
beverages);
Price level Average price level (discount campaigns, sometimes own brands
with competitive price levels);
Branch mix One tenant;
Sales method Self service, partly salesperson service
Intensity of service limited
Valuation factors Market Value
Maintenance p.a. EUR 1 – 2/sqm
Property management c.a. 1 – 2% of GRI p.a.
Allowance for risk of rental loss 0%
Modernisation risk property specific
Useful life 20 – 30 years
Property yield 7,25 – 8%
Capitalisation rate 12,5 – 13,7%
Statistics (standard parameters)
Site area 1.000 – 5.000sqm
No. of parking spaces required N/A
Proportion of value attrib. to the site 10 – 25%
Property size (lettable area) 500 – 2.500sqm
No. of storeys 1
Construction ratio usable area/GFA ~ 90%
Ratio sales area/usable area 65 – 80%
Fit-out specification basic
Building costs (excl. site improvements) EUR 400 – 500/sqm GFA
Ancillary building costs 8 – 12%
Standard market rent p.m. EUR 5 – 8/sqm
Gross income multiplier N/A
Net Initial Yield 7,25 – 8%
Turnover per m² of sales area p.a. N/A
Rent to sales ratio 0%
These recommendations must carefully be verified for each valuation!

Valuation Parameters of Retail Properties Poland
Data Sheets Hypermarkets
78
Location characteristics
Location with good transport links in a suburban area; Well exposed onto street; Location in catchment areas of large towns and agglomerations; Sometimes located in retail parks; High number of parking spaces; For customers with cars.
Property characteristics
Single storey building with basic fit out; Ground level parking; Functional, cost efficient type of construction; Large open sales area; Adjacent retail gallery of circa 15 retail units.
Facts
Supplier Group No. of stores
Total sales (EUR)
ØTurnover per store
(EUR)
Tesco Tesco 137 (hypermarkets) 313 (supermarkets)
12,6bn 2011/2012 28mn
Auchan Auchan 29 ~ €1.6 bn
2011 56mn
Carrefour Carrefour 11 N/A N/A
E.Leclerc E.Leclerc 40 (hyper – and
supermarkets) ~ € 6.6 mln
2011 16,5mn
Source: Various media portals

Valuation Parameters of Retail Properties Poland
Data Sheets Hypermarkets
79
Business type requirements
Product range Offering food and non-food products (i.e. cloths, cosmetics,
toys, detergents);
Price level Low to average price level (discount campaigns, own brands);
Branch mix One tenant;
Sales method Self service, partly salesperson service
Intensity of service limited
Valuation factors Market Value
Maintenance p.a. EUR 1 – 2/sqm
Property management c.a. 1 – 2% of GRI p.a.
Allowance for risk of rental loss 0%
Modernisation risk property specific
Useful life 20 – 30 years
Property yield 7,5 – 8%
Capitalisation rate 12,5 – 13,3%
Statistics (standard parameters)
Site area 5.000 – 20.000sqm
No. of parking spaces required 150 – 700 spaces
Proportion of value attrib. to the site 10 – 20%
Property size (lettable area) 2.500 – 10.000sqm
No. of storeys 1
Construction ratio usable area/GFA ~ 90%
Ratio sales area/usable area 65 – 80%
Fit-out specification Basic
Building costs (excl. site improvements) EUR 400 – 500/sqm GFA
Ancillary building costs 8 – 12%
Standard market rent p.m. EUR 5 – 8/sqm
Gross income multiplier N/A
Net Initial Yield 7,5 – 8%
Turnover per m² of sales area p.a. N/A
Rent to sales ratio 0%
These recommendations must carefully be verified for each valuation!
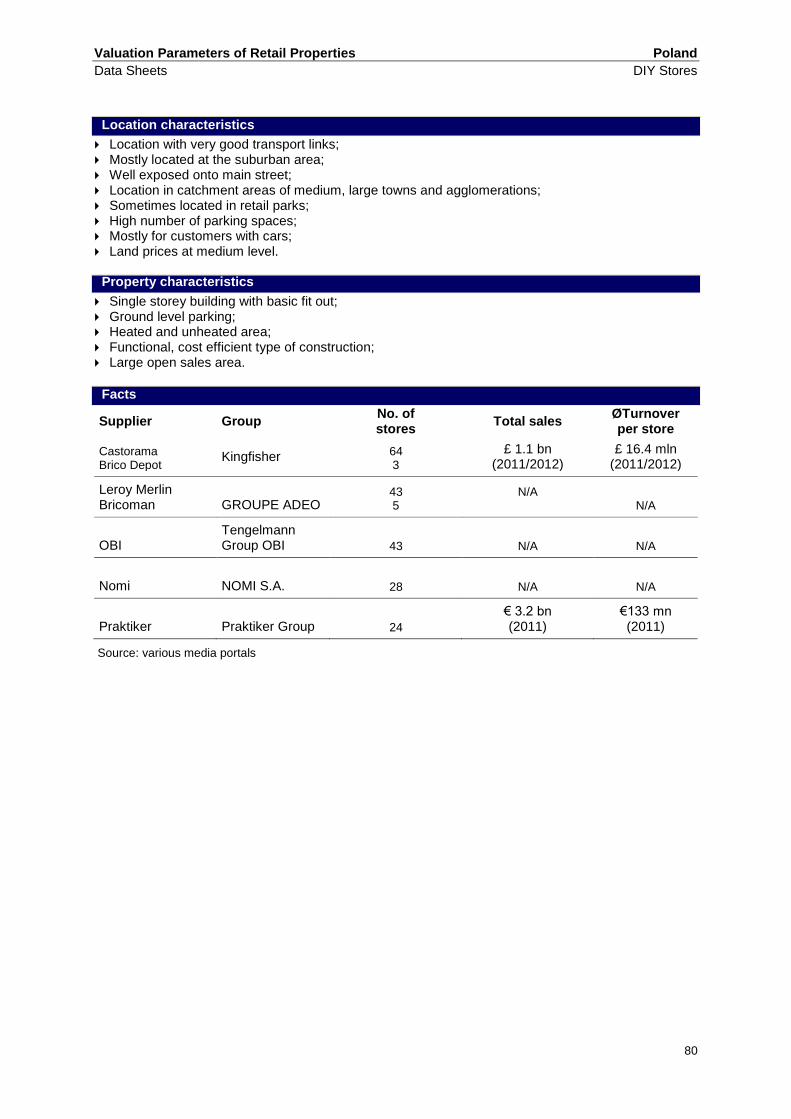
Valuation Parameters of Retail Properties Poland
Data Sheets DIY Stores
80
Location characteristics
Location with very good transport links; Mostly located at the suburban area; Well exposed onto main street; Location in catchment areas of medium, large towns and agglomerations; Sometimes located in retail parks; High number of parking spaces; Mostly for customers with cars; Land prices at medium level.
Property characteristics
Single storey building with basic fit out; Ground level parking; Heated and unheated area; Functional, cost efficient type of construction; Large open sales area.
Facts
Supplier Group No. of stores
Total sales ØTurnover per store
Castorama Brico Depot
Kingfisher 64 3
£ 1.1 bn (2011/2012)
£ 16.4 mln (2011/2012)
Leroy Merlin Bricoman GROUPE ADEO
43 5
N/A N/A
OBI Tengelmann Group OBI 43 N/A N/A
Nomi NOMI S.A. 28 N/A N/A
Praktiker Praktiker Group 24
€ 3.2 bn (2011)
€133 mn (2011)
Source: various media portals

Valuation Parameters of Retail Properties Poland
Data Sheets DIY Stores
81
Business type requirements
Product range DIY product range, often with integrated garden centre and
complementary product range;
Price level Low to average price level (discount campaigns);
Branch mix Mostly one tenant;
Sales method Self service;
Intensity of service limited
Valuation factors Market Value
Maintenance p.a. EUR 1 – 2/sqm
Property management c.a. 1 – 2% of GRI p.a.
Allowance for risk of rental loss 0%
Modernisation risk property specific
Useful life 20 – 30 years
Property yield 7,5 – 8%
Capitalisation rate 11,7 – 13%
Statistics (standard parameters)
Site area 5.000 – 40.000sqm
No. of parking spaces required 150 – 900 spaces
Proportion of value attrib. to the site 10 – 25%
Property size (lettable area) 2.500 – 20.000sqm
No. of storeys 1
Construction ratio usable area/GFA ~ 95%
Ratio sales area/usable area 85 – 95%
Fit-out specification basic
Building costs (excl. site improvements) EUR 350 – 400/sqm GFA
Ancillary building costs 8 – 12%
Standard market rent p.m. EUR 6 – 12/sqm
Gross income multiplier N/A
Net Initial Yield 7,5 – 8,5%
Turnover per m² of sales area p.a. N/A
Rent to sales ratio 0%
These recommendations must carefully be verified for each valuation!

Valuation Parameters of Retail Properties Poland
Data Sheets Shopping Centres
82
Location characteristics
In central locations of primary or secondary centres also in district centres; Often located in or close to mass market locations; Rarely in small towns; Good public and private transport links; Sufficient number of parking spaces; Well exposed Trend: revitalizations of oldest shopping centres to leverage their strengths (e.g. in Warsaw – Klif,
Atrium Promenada, Warszawa Wileñska), extensions (e.g. Galeria Mokotów, Auchan £omianki), construction of communication centres with shopping centres mainly in major Polis cities (e.g. in Poznañ, Katowice and Kraków), project developments in secondary cities/ towns and sometimes in small towns.
Property characteristics
Target size over 5.000sqm lettable area; Minimum 10 tenats; Multi-storey building mostly with 3 retail floors (ground floor, first floor, second floor); In addition to large-scale anchor tenants often division of lettable area into small units; Balanced tenant mix suitable for the location with anchor tenants generating footfall; Exclusive themed architecture with recognition value and good fitout specification; Central mall, large column grid, comfortable ceiling heights ~ 5,00 to 6,00 m; Centre management, advertising association.
Facts
Company No. of
Centres GLA
(sqm) Market Share
Echo Investment 20 382.200 4,6%
Atrium European Real Estate 20 390.000 4,7%
Rank Progress 7 179.250 2,1%
Source: various media portals

Valuation Parameters of Retail Properties Poland
Data Sheets Shopping Centres
83
Business type requirements
Product range Orientated to the (often) discerning demands of customers
depending on the positioning of the shopping centre;
Price level Average to high, depending on the positioning of the shopping
centre;
Branch mix Diversified branch mix, high proportion of fashion and food
outlets, supplemented by services and leisure;
Sales method Depending on supplier, ranging from sales advice, over the counter service to self-service;
Intensity of service High (central management, advertising association).
Valuation factors Market Value
Maintenance p.a. EUR 3 – 6,5/sqm
Property management c.a. 2 – 3% of GRI p.a.
Allowance for risk of rental loss 1 – 5%
Modernisation risk Property-specific
Useful life up to 50 years
Property yield 6 – 8,5%
Capitalisation rate 11,7 – 16,6
Statistics (standard parameters)
Site area 2.500 – 25.000sqm
No. of parking spaces required 150 – 3.000 spaces
Proportion of value attrib. to the site 15 – 30 %
Property size (lettable area) above 5.000- 100.000sqm
No. of storeys Min 10, standard 2–3 retail stores
Construction ratio usable area/GFA 65 – 75%
Ratio sales area/usable area 65 – 85%
Fit-out specification average to high quality
Building costs (excl. site improvements) EUR 600 – 1.200/sqm GFA
Ancillary building costs 8 – 12%
Standard market rent p.m. EUR 30 – 90/sqm in Warsaw
EUR 20 – 50/sqm in regional cities
Gross income multiplier N/A
Net Initial Yield 6 – 8.5%
Turnover per m² of sales area p.a. N/A
Rent to sales ratio 5 – 10%
These recommendations must carefully be verified for each valuation!
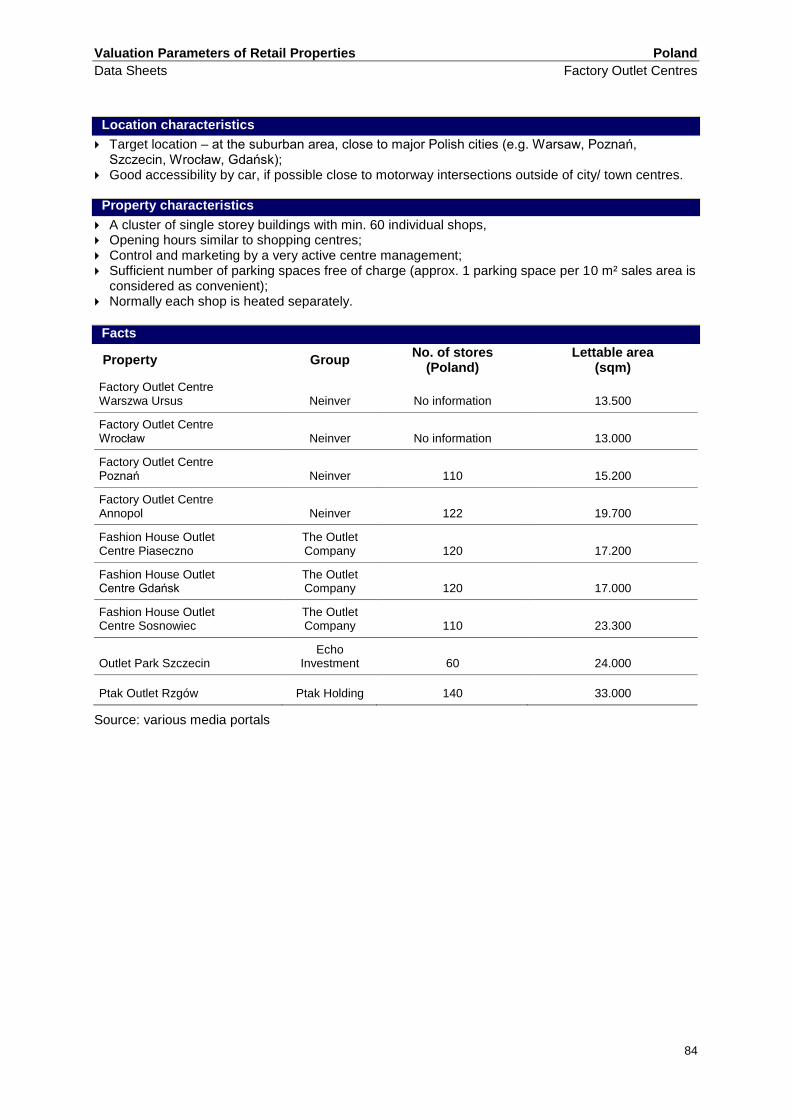
Valuation Parameters of Retail Properties Poland
Data Sheets Factory Outlet Centres
84
Location characteristics
Target location – at the suburban area, close to major Polish cities (e.g. Warsaw, Poznań, Szczecin, Wrocław, Gdańsk);
Good accessibility by car, if possible close to motorway intersections outside of city/ town centres.
Property characteristics
A cluster of single storey buildings with min. 60 individual shops, Opening hours similar to shopping centres; Control and marketing by a very active centre management; Sufficient number of parking spaces free of charge (approx. 1 parking space per 10 m² sales area is
considered as convenient); Normally each shop is heated separately.
Facts
Property Group No. of stores
(Poland) Lettable area
(sqm)
Factory Outlet Centre Warszwa Ursus Neinver No information 13.500
Factory Outlet Centre Wrocław Neinver No information 13.000
Factory Outlet Centre Poznań Neinver 110 15.200
Factory Outlet Centre Annopol Neinver 122 19.700
Fashion House Outlet Centre Piaseczno
The Outlet Company 120 17.200
Fashion House Outlet Centre Gdańsk
The Outlet Company 120 17.000
Fashion House Outlet Centre Sosnowiec
The Outlet Company 110 23.300
Outlet Park Szczecin Echo
Investment 60 24.000
Ptak Outlet Rzgów Ptak Holding 140 33.000
Source: various media portals

Valuation Parameters of Retail Properties Poland
Data Sheets Factory Outlet Centres
85
Business type requirements
Product range Unsold stock by definition, collections of the previous season and products with faults (second quality), sample collection;
Price level According to information min. 30% below recommended retail price (difficult for customer to verify);
Branch mix Strong focus on clothing including shoes, sports ware, household goods;
Sales method Service (professional shop assistants) with the philosophy based on ‘brand competence’ and ‘transparent pricereductions’;
Intensity of service High due to the well-known brands
Valuation factors Market Value
Maintenance p.a. EUR 3 – 5/sqm
Property management c.a. 2 – 3% of GRI p.a.
Allowance for risk of rental loss 1 – 5%
Modernisation risk Property-specific
Useful life up to 50 years
Property yield 7,5 – 8,0%
Capitalisation rate 12,5 – 13,3
Statistics (standard parameters)
Site area 10.000 – 70.000sqm
No. of parking spaces required 500 – 1.500 spaces
Proportion of value attrib. to the site 10 – 20%
Property size (lettable area) 5.500 – 33.000sqm
No. of storeys one storey
Construction ratio usable area/GFA 70 – 75%
Ratio sales area/usable area 70 – 85%
Fit-out specification Average
Building costs (excl. site improvements) EUR 600 – 1.000/sqm GFA
Ancillary building costs 8 – 12%
Standard market rent p.m. EUR 21 – 23/sqm (Basis – usable area)
Gross income multiplier N/A
Net Initial Yield 7.5 – 8.0%, with stable trend
Turnover per m² of sales area p.a. N/A
Rent to sales ratio N/A
These recommendations must carefully be verified for each valuation!

Valuation Parameters of Retail Properties Poland
Data Sheets Outlet Centres
86
Location characteristics
Near large residential estates; In secondary cities/ towns (e.g. Sieradz, Skierniewice, Myślenice, Żyrardów) and districts of large
cities (e.g. Kraków, Szczecin); Good accessibility.
Property characteristics
Mostly single storey buildings with min. 5 individual shops which have separate entrances directly from the parking;
Sometimes 2-storey building with entrances to each store inside; Large-scale anchor tenant (more than 30% of lettable area) e.g. Tesco, Biedronka, the remainder
smaller shops and services addressing the basic needs of the residents of residential estates; Opening hours similar to shopping centres.
Facts
Property Group No. of stores
(Poland) Lettable area
(sqm)
Dekada Myslenice Dekada Realty 16 3.217
Dekada Sieradz Dekada Realty 36 9.842
Dekada Skierniewice Dekada Realty 16 3.415
Dekada Żyrardów Dekada Realty 25 3.800
Dekada Kraków Dekada Realty 16 3.347
Dekada Olsztyn Dekada Realty 14 3.721
Street Mall Vis a Vis Radom Capital Park 20 3.400
Multibox Świecie Budrem 11 5.000
Centrum Zakupów Ząbki NAP Invest 6 3.000
Centrum Zakupów Zgierz NAP Invest 7 3.500
Source: various media portals
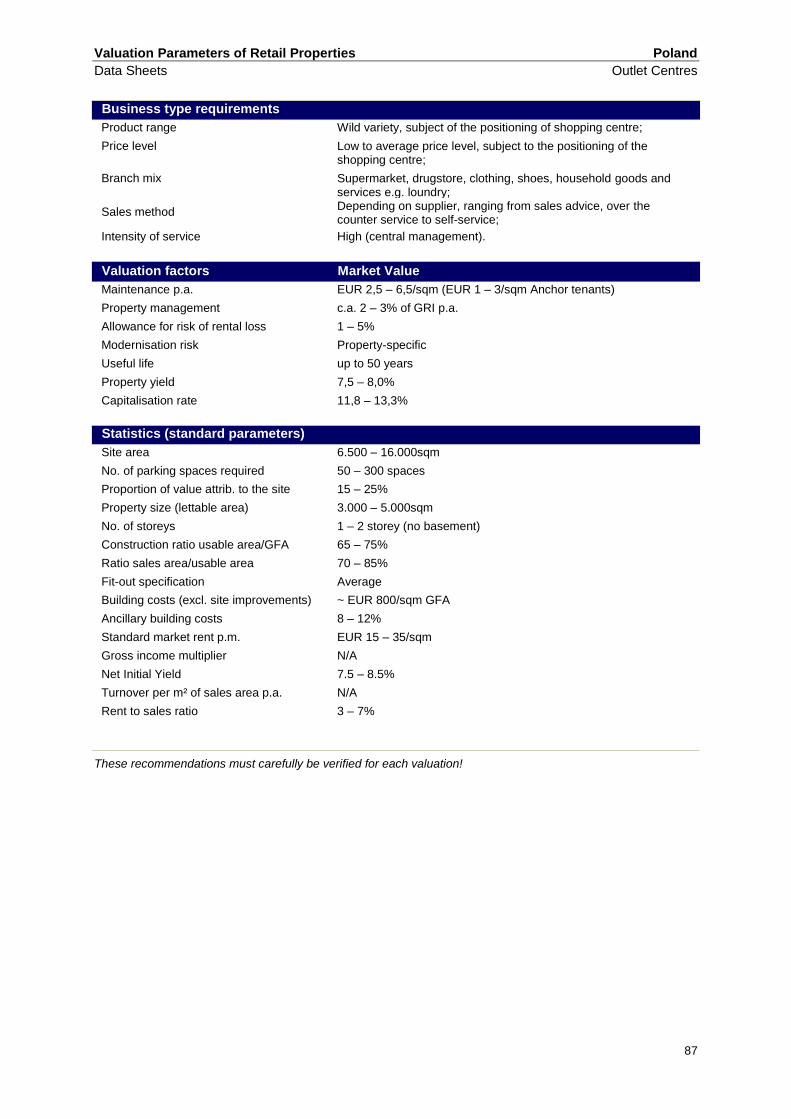
Valuation Parameters of Retail Properties Poland
Data Sheets Outlet Centres
87
Business type requirements
Product range Wild variety, subject of the positioning of shopping centre;
Price level Low to average price level, subject to the positioning of the shopping centre;
Branch mix Supermarket, drugstore, clothing, shoes, household goods and services e.g. loundry;
Sales method Depending on supplier, ranging from sales advice, over the counter service to self-service;
Intensity of service High (central management).
Valuation factors Market Value
Maintenance p.a. EUR 2,5 – 6,5/sqm (EUR 1 – 3/sqm Anchor tenants)
Property management c.a. 2 – 3% of GRI p.a.
Allowance for risk of rental loss 1 – 5%
Modernisation risk Property-specific
Useful life up to 50 years
Property yield 7,5 – 8,0%
Capitalisation rate 11,8 – 13,3%
Statistics (standard parameters)
Site area 6.500 – 16.000sqm
No. of parking spaces required 50 – 300 spaces
Proportion of value attrib. to the site 15 – 25%
Property size (lettable area) 3.000 – 5.000sqm
No. of storeys 1 – 2 storey (no basement)
Construction ratio usable area/GFA 65 – 75%
Ratio sales area/usable area 70 – 85%
Fit-out specification Average
Building costs (excl. site improvements) ~ EUR 800/sqm GFA
Ancillary building costs 8 – 12%
Standard market rent p.m. EUR 15 – 35/sqm
Gross income multiplier N/A
Net Initial Yield 7.5 – 8.5%
Turnover per m² of sales area p.a. N/A
Rent to sales ratio 3 – 7%
These recommendations must carefully be verified for each valuation!
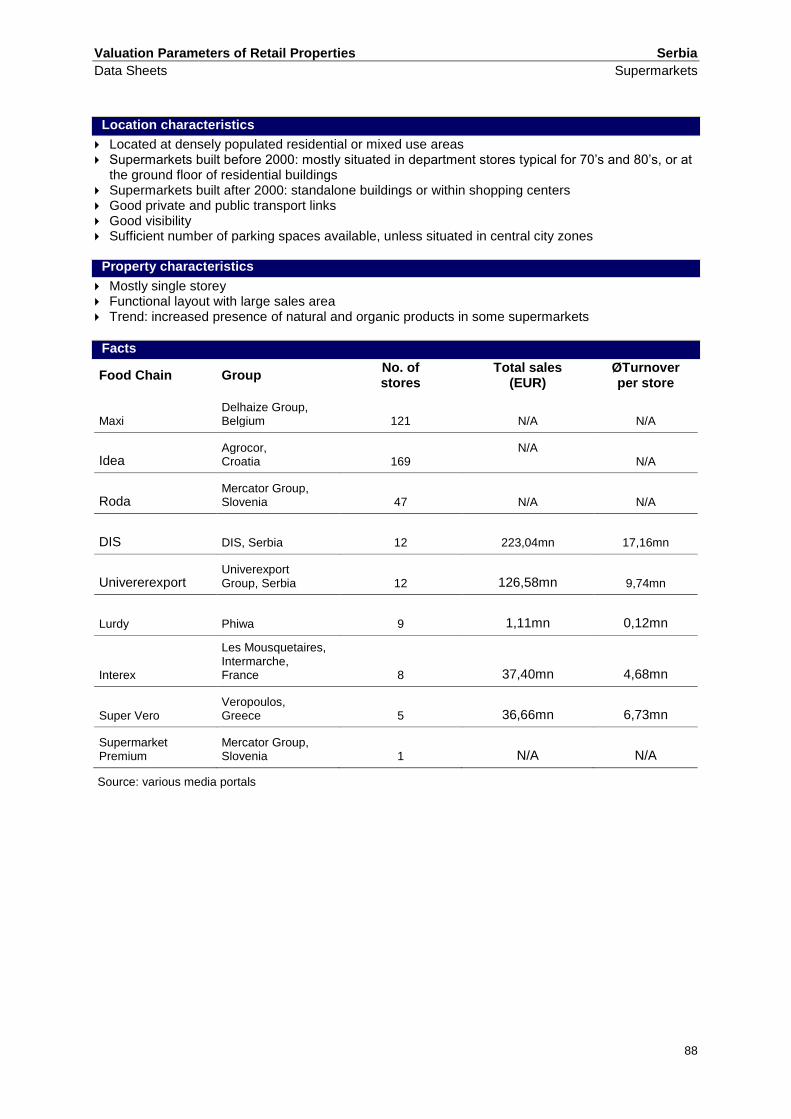
Valuation Parameters of Retail Properties Serbia
Data Sheets Supermarkets
88
Location characteristics
Located at densely populated residential or mixed use areas Supermarkets built before 2000: mostly situated in department stores typical for 70’s and 80’s, or at
the ground floor of residential buildings Supermarkets built after 2000: standalone buildings or within shopping centers Good private and public transport links Good visibility Sufficient number of parking spaces available, unless situated in central city zones
Property characteristics
Mostly single storey Functional layout with large sales area Trend: increased presence of natural and organic products in some supermarkets
Facts
Food Chain Group No. of stores
Total sales (EUR)
ØTurnover per store
Maxi Delhaize Group, Belgium 121 N/A N/A
Idea Agrocor, Croatia 169
N/A N/A
Roda Mercator Group, Slovenia 47 N/A N/A
DIS DIS, Serbia 12 223,04mn 17,16mn
Univererexport Univerexport Group, Serbia 12 126,58mn 9,74mn
Lurdy Phiwa 9 1,11mn 0,12mn
Interex
Les Mousquetaires, Intermarche, France 8 37,40mn 4,68mn
Super Vero Veropoulos, Greece 5 36,66mn 6,73mn
Supermarket Premium
Mercator Group, Slovenia 1 N/A N/A
Source: various media portals

Valuation Parameters of Retail Properties Serbia
Data Sheets Supermarkets
89
Business type requirements
Product range Convenience goods and short-term demand, often private label products, new trend in organic food
Price level Average, with discount campaigns and private label products offered at lower prices
Branch mix 5.000-10.000 products
Sales method Mainly self-service, trend: online ordering
Intensity of service low
Valuation factors Market Value
Maintenance p.a. EUR 1 – 3/sqm
Property management c.a. 1 – 2% of GRI p.a.
Allowance for risk of rental loss 5%
Modernisation risk property specific
Useful life 20 – 40 years
Property yield 11 – 13%
Capitalisation rate 12 – 14%
Statistics (standard parameters)
Site area 1.000 – 3.000sqm
No. of parking spaces required Guideline value: 1 space for 12-15sqm of sales area
Proportion of value attrib. to the site 10 – 30%
Property size (lettable area) 400 – 1.500sqm
No. of storeys Single-storey or integrated
Construction ratio usable area/GFA 90%
Ratio sales area/usable area 70 – 80%
Fit-out specification Basic to average
Building costs (excl. site improvements) EUR 400 – 600/sqm GFA
Ancillary building costs 10 – 15%
Standard market rent p.m. EUR 7 – 12/sqm
Gross income multiplier N/A
Net Initial Yield 7 – 10% depending on investment costs
Turnover per m² of sales area p.a. N/A
Rent to sales ratio Data is not available, but the sales are approximately 30% less
than in the countries of the EU.
These recommendations must carefully be verified for each valuation!
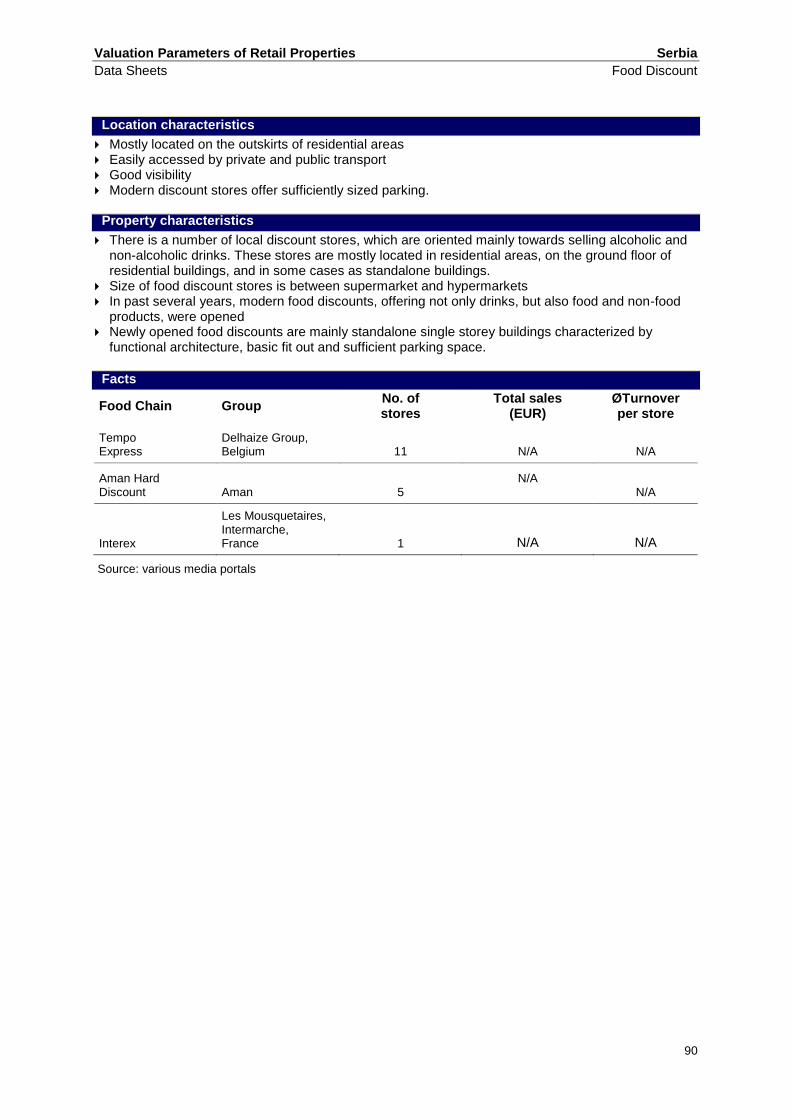
Valuation Parameters of Retail Properties Serbia
Data Sheets Food Discount
90
Location characteristics
Mostly located on the outskirts of residential areas Easily accessed by private and public transport Good visibility Modern discount stores offer sufficiently sized parking.
Property characteristics
There is a number of local discount stores, which are oriented mainly towards selling alcoholic and non-alcoholic drinks. These stores are mostly located in residential areas, on the ground floor of residential buildings, and in some cases as standalone buildings.
Size of food discount stores is between supermarket and hypermarkets In past several years, modern food discounts, offering not only drinks, but also food and non-food
products, were opened Newly opened food discounts are mainly standalone single storey buildings characterized by
functional architecture, basic fit out and sufficient parking space.
Facts
Food Chain Group No. of stores
Total sales (EUR)
ØTurnover per store
Tempo Express
Delhaize Group, Belgium 11 N/A N/A
Aman Hard Discount Aman 5
N/A N/A
Interex
Les Mousquetaires, Intermarche, France 1 N/A N/A
Source: various media portals

Valuation Parameters of Retail Properties Serbia
Data Sheets Food Discount
91
Business type requirements
Product range Food and non-food products (i.e. detergents, beverages)
Price level Low to average price level, discount campaigns periodically to permanently
Branch mix Usually one tenant
Sales method Self-service
Intensity of service Low to limited
Valuation factors Market Value
Maintenance p.a. EUR 1 – 3/sqm
Property management c.a. 1 – 2% of GRI p.a.
Allowance for risk of rental loss 5%
Modernisation risk property specific
Useful life 20 – 40 years
Property yield 11 – 13%
Capitalisation rate 12 – 14%
Statistics (standard parameters)
Site area 2.000 – 4.000sqm
No. of parking spaces required Guideline value: 1 space for 15-20 sqm of sales area
Proportion of value attrib. to the site 10 – 30%
Property size (lettable area) 1.000 – 2.500sqm
No. of storeys Single-storey
Construction ratio usable area/GFA 90%
Ratio sales area/usable area 70 – 80%
Fit-out specification Basic to average
Building costs (excl. site improvements) EUR 300 – 500/sqm GFA
Ancillary building costs 10 – 15%
Standard market rent p.m. EUR 5 – 10/sqm
Gross income multiplier N/A
Net Initial Yield 7 – 10% depending on investment costs
Turnover per m² of sales area p.a. N/A
Rent to sales ratio Data is not available, but the sales are approximately 30% less
than in the countries of the EU.
These recommendations must carefully be verified for each valuation!

Valuation Parameters of Retail Properties Serbia
Data Sheets Hypermarkets
92
Location characteristics
Located in larger cities/towns Preferably in commercial zones on the fringe of the city/town Very good visibility Easily accessed by car High number of parking spaces
Property characteristics
Single storey standalone buildings or situated within larger retail agglomerations, shopping centers Located with small number of retail stores that often accompany the hypermarkets Functional and cost efficient type of construction Basic fit out Large open sales area Ground level parking free of charge
Facts
Food Chain Group No. of stores
Total sales (EUR)
ØTurnover per store
Roda Megamarket
Mercator Group, Slovenia 15 N/A N/A
Mercator Hypermarket
Mercator Group, Slovenia 4
N/A N/A
Idea Agrokor, Croatia 2 N/A N/A
Source: various media portals

Valuation Parameters of Retail Properties Serbia
Data Sheets Hypermarkets
93
Business type requirements
Product range Wide range of food and non-food products, including clothing, footwear, DIY products etc.
Price level Average, with sales campaigns, some with private label products
Branch mix Anchor tenant along with a few small tenants, usually service activity and subleased
Sales method Self service and partially over the counter
Intensity of service Low to average (service at specialized sections)
Valuation factors Market Value
Maintenance p.a. EUR 1 – 3/sqm
Property management c.a. 1 – 2% of GRI p.a.
Allowance for risk of rental loss 5%
Modernisation risk property specific
Useful life 20 – 40 years
Property yield 11 – 13%
Capitalisation rate 12 – 14%
Statistics (standard parameters)
Site area 8.000 – 20.000sqm
No. of parking spaces required Guideline value: 1 space for 10-20sqm of sales area
Proportion of value attrib. to the site 10 – 30%
Property size (lettable area) 4.000 – 10.00sqm
No. of storeys Single-storey
Construction ratio usable area/GFA 90%
Ratio sales area/usable area 70 – 80%
Fit-out specification Basic to average
Building costs (excl. site improvements) EUR 400 – 700/sqm GFA
Ancillary building costs 10 – 15%
Standard market rent p.m. EUR 6 – 11/sqm
Gross income multiplier N/A
Net Initial Yield 7 – 10% depending on investment costs
Turnover per m² of sales area p.a. N/A
Rent to sales ratio Data is not available, but the sales are approximately 30% less
than in the countries of the EU.
These recommendations must carefully be verified for each valuation!
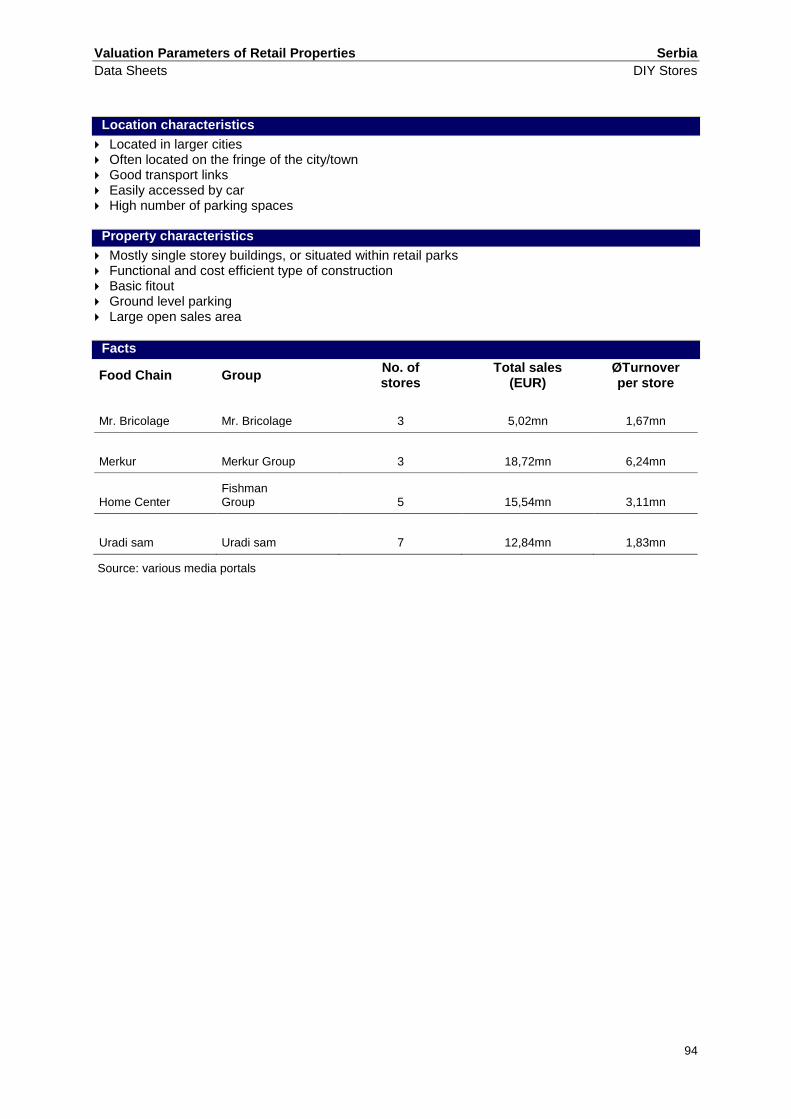
Valuation Parameters of Retail Properties Serbia
Data Sheets DIY Stores
94
Location characteristics
Located in larger cities Often located on the fringe of the city/town Good transport links Easily accessed by car High number of parking spaces
Property characteristics
Mostly single storey buildings, or situated within retail parks Functional and cost efficient type of construction Basic fitout Ground level parking Large open sales area
Facts
Food Chain Group No. of stores
Total sales (EUR)
ØTurnover per store
Mr. Bricolage Mr. Bricolage 3 5,02mn 1,67mn
Merkur Merkur Group 3 18,72mn 6,24mn
Home Center Fishman Group 5 15,54mn 3,11mn
Uradi sam Uradi sam 7 12,84mn 1,83mn
Source: various media portals

Valuation Parameters of Retail Properties Serbia
Data Sheets DIY Stores
95
Business type requirements
Product range DIY products with complementary product ranges (i.e. building material and elements, gardening, tools, interior decoration)
Price level Low to average, discount campaigns
Branch mix Usually one tenant
Sales method Mainly self service
Intensity of service Limited
Valuation factors Market Value
Maintenance p.a. EUR 1 – 3/sqm
Property management c.a. 1 – 2% of GRI p.a.
Allowance for risk of rental loss 5%
Modernisation risk property specific
Useful life 40 – 60 years
Property yield 11 – 13%
Capitalisation rate 12 – 14%
Statistics (standard parameters)
Site area 4.000 – 20.000sqm
No. of parking spaces required Guideline value: 1 space for 10-20sqm of sales area
Proportion of value attrib. to the site 10 – 30%
Property size (lettable area) 2.000 – 10.00sqm
No. of storeys Mostly Single-storey
Construction ratio usable area/GFA 90%
Ratio sales area/usable area 70 – 80%
Fit-out specification Basic to average
Building costs (excl. site improvements) EUR 400 – 600/sqm GFA
Ancillary building costs 10 – 15%
Standard market rent p.m. EUR 4 – 8/sqm
Gross income multiplier N/A
Net Initial Yield 7 – 10% depending on investment costs
Turnover per m² of sales area p.a. N/A
Rent to sales ratio Data is not available, but the sales are approximately 30% less
than in the countries of the EU.
These recommendations must carefully be verified for each valuation!

Valuation Parameters of Retail Properties Serbia
Data Sheets Furniture Stores
96
Location characteristics
Mostly located in urban areas, sometimes on the fringe of city/town with good transport links for customers with cars Good visibility High number of parking spaces, except if located in central city/town areas
Property characteristics
Standalone buildings or situated on the ground floor of residential buildings Single or multi-storey Functional layout with large sales area Modern, functional architecture, unless located in residential buildings Spacious car park, unless located in central city/town areas
Facts
Food Chain Group No. of stores
Total sales (EUR)
ØTurnover per store
Simpo Simpo, Serbia 32 51.00mn 1.59mn
Forma Ideale Forma Ideale, Serbia 22 58.80mn 2.67mn
Aleksandro Aleksandro, Serbia 17 5.48mn 0.32mn
YISK JYSK, Denmark 16 8.54mn 0.53mn
Vitorog Vitorog- Promet, Serbia 4 8.09mn 2.02mn
Eurosalon Eurosalon, Serbia 3 1.27mn 0.42mn
Kika Kika, Austria 1 15.45mn 15.45mn
Source: various media portals

Valuation Parameters of Retail Properties Serbia
Data Sheets Furniture Stores
97
Business type requirements
Product range Furniture, sometimes household goods
Price level Low to high price levels, discount campaigns
Branch mix mostly one tenant
Sales method Self-service to intensive customer support
Intensity of service Average to high
Valuation factors Market Value
Maintenance p.a. EUR 1 – 3/sqm
Property management c.a. 1 – 2% of GRI p.a.
Allowance for risk of rental loss 5%
Modernisation risk property specific
Useful life 40 – 60 years
Property yield 11 – 13%
Capitalisation rate 12 – 14%
Statistics (standard parameters)
Site area 5.000 – 20.000sqm
No. of parking spaces required Guideline value: 1 space for 10-20sqm of sales area
Proportion of value attrib. to the site 10 – 30%
Property size (lettable area) 3.000 – 20.00sqm
No. of storeys 1 to 3 floors
Construction ratio usable area/GFA 90%
Ratio sales area/usable area 70 – 80%
Fit-out specification Basic to average
Building costs (excl. site improvements) EUR 400 – 600/sqm GFA
Ancillary building costs 10 – 15%
Standard market rent p.m. EUR 4 – 8/sqm
Gross income multiplier N/A
Net Initial Yield 7 – 10% depending on investment costs
Turnover per m² of sales area p.a. N/A
Rent to sales ratio Data is not available, but the sales are approximately 30% less
than in the countries of the EU.
These recommendations must carefully be verified for each valuation!

Valuation Parameters of Retail Properties Serbia
Data Sheets Shopping Centres
98
Location characteristics
Located in larger cities/towns, in densely populated residential areas Good public and private transport links Good visibility Large, usually underground parking
Property characteristics
Construction of modern shopping centers in Serbia began after 2000. Slovenian Mercator was the first company to begin with the construction of modern shopping
centers in Serbia. These shopping centers were characterized by large supermarkets accompanied by smaller retail stores that usually follow Mercator supermarkets in their shopping centers (Avenia).
The first major shopping center was Delta City, after which the concept of shopping centers changed in Serbia and now is more in accordance with shopping centers worldwide.
All shopping centers in Serbia have been built in accordance with international requirements for modern shopping centers.
Architecturally modern and functional shopping centers Multi-storey buildings, usually with 3 retail floors Center management and coordinated marketing and other activities
Facts
Company No. of
Centres GLA
(sqm) Market Share
Mercator Group, Slovenia 13
80,000 (sum of all shopping centers) N/A
Verano Group, Serbia 1 7.000
N/A
Shopping Center Stadium 1 28.000
N/A
MPC Properties, Serbia 1 50.000
N/A
Delta Holding, Serbia 1 31.000
N/A
Plaza Centers Group, Israel 1 26.000
N/A
Forum, Nis 1 15.500 N/A
Immo Point 1 10.000 N/A
Source: various media portals
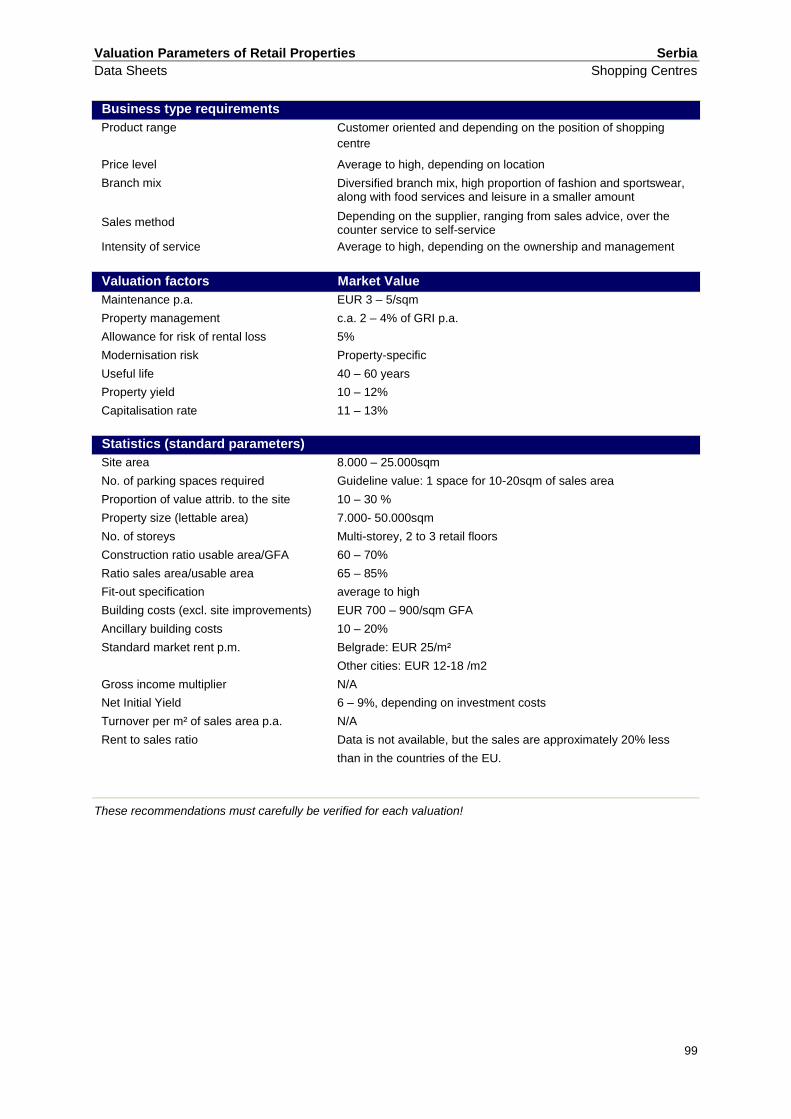
Valuation Parameters of Retail Properties Serbia
Data Sheets Shopping Centres
99
Business type requirements
Product range Customer oriented and depending on the position of shopping
centre
Price level Average to high, depending on location
Branch mix Diversified branch mix, high proportion of fashion and sportswear, along with food services and leisure in a smaller amount
Sales method Depending on the supplier, ranging from sales advice, over the counter service to self-service
Intensity of service Average to high, depending on the ownership and management
Valuation factors Market Value
Maintenance p.a. EUR 3 – 5/sqm
Property management c.a. 2 – 4% of GRI p.a.
Allowance for risk of rental loss 5%
Modernisation risk Property-specific
Useful life 40 – 60 years
Property yield 10 – 12%
Capitalisation rate 11 – 13%
Statistics (standard parameters)
Site area 8.000 – 25.000sqm
No. of parking spaces required Guideline value: 1 space for 10-20sqm of sales area
Proportion of value attrib. to the site 10 – 30 %
Property size (lettable area) 7.000- 50.000sqm
No. of storeys Multi-storey, 2 to 3 retail floors
Construction ratio usable area/GFA 60 – 70%
Ratio sales area/usable area 65 – 85%
Fit-out specification average to high
Building costs (excl. site improvements) EUR 700 – 900/sqm GFA
Ancillary building costs 10 – 20%
Standard market rent p.m. Belgrade: EUR 25/m²
Other cities: EUR 12-18 /m2
Gross income multiplier N/A
Net Initial Yield 6 – 9%, depending on investment costs
Turnover per m² of sales area p.a. N/A
Rent to sales ratio Data is not available, but the sales are approximately 20% less
than in the countries of the EU.
These recommendations must carefully be verified for each valuation!

Valuation Parameters of Retail Properties Serbia
Data Sheets Factory Outlet Centre and Retail Parks
100
Location characteristics
Situated mostly on the outskirts of large cities, or in secondary towns, in the vicinity of large cities Located close to the main roads, often close to the highways outside of city/town Good accessibility by car Good visibility Large ground level parking
Property characteristics
A cluster of mainly single-storey buildings, sometimes 2-storey buildings Specific architecture Uniform opening hours, similar to shopping centres Control and marketing by centre management Sufficient number of parking spaces free of charge
Facts
Property Group No. of stores Lettable area
(sqm)
Immo Outlet Center, Belgrade
MPC Properties 42 8.500
BN Bos, Belgrade BN Bos, Serbia 28 4.500
Italian Mall Outlet, Belgrade Piazza Roma N/A N/A
BIG Center, Novi Sad
BIG CEE, Israel 36 34.000
Fashion Park Outlet Center, Indjija
BlackOak Development 65 30.000
Delta Park, Kragujevac
Delta Holding, Serbia N/A 17.000
Aviv Park, Pancevo Aviv Arlon,
Israel 71 22.000
Source: various media portals

Valuation Parameters of Retail Properties Serbia
Data Sheets Factory Outlet Centre and Retail Parks
101
Business type requirements
Product range Wide variety of products, including unsold stock, collections of the previous seasons and products with faults
Price level Low to average
Branch mix Anchor tenants along with smaller shops in retail parks; different tenants, mainly fashion, in outlet centers
Sales method Sales advice, counter service or self-service, depending on supplier
Intensity of service Low to high, depending on supplier
Valuation factors Market Value
Maintenance p.a. EUR 1 – 3/sqm
Property management c.a. 3 – 5% of GRI p.a.
Allowance for risk of rental loss 5%
Modernisation risk Property-specific
Useful life 40 – 60 years
Property yield 10 – 12%
Capitalisation rate 11 – 13
Statistics (standard parameters)
Site area 10.000 – 90,000sqm
No. of parking spaces required Approximately 1.000
Proportion of value attrib. to the site 10 – 30%
Property size (lettable area) 5.000 – 35.000sqm
No. of storeys 1 – 2 floors
Construction ratio usable area/GFA 60 – 70%
Ratio sales area/usable area 65 – 85%
Fit-out specification Average
Building costs (excl. site improvements) EUR 500 – 700/sqm GFA
Ancillary building costs 10 – 20%
Standard market rent p.m. EUR 10 – 10/sqm
Gross income multiplier N/A
Net Initial Yield 6 – 9%
Turnover per m² of sales area p.a. N/A
Rent to sales ratio Data is not available, but the sales are approximately 30% less
than in the countries of the EU.
These recommendations must carefully be verified for each valuation!

Valuation Parameters of Retail Properties Spain
Data Sheets Discounters
102
Location characteristics
Medium to highly populated residential areas; High visibility; Good transportation access; Sufficient number of parking spaces (mainly outdoor).
Property characteristics
Normally single storey; Mainly outdoor parking spaces (sometimes indoor), mostly for free; Average to low building qualities. Basic design; Sometimes in combination with smaller stores; Surface area < 2,500 m². Average: 800 m².
Facts
Company Group No. of stores
Average GLA in m²
Total sales (in billion EUR)
Dia Dia 2,566 585 3.2
Lidl Schwarz 525 1,230 2.3
Aldi Aldi 220 980 0.6
Source: respective financial reports, Alimarket report and self-elaboration. Figures refer just to discounters, not to the respective groups.

Valuation Parameters of Retail Properties Spain
Data Sheets Discounters
103
Business type requirements
Product range mainly food, but also non-food products
Price level average to low price level (generally including own-brand products
at low prices)
Branch mix one tenant
Sales method self service
Intensity of service low
Valuation factors Market Value
Maintenance p.a. EUR 4 – 8/m²/month
Property management 3 – 5% of GRI p.a.
Allowance for risk of rental loss Approx. 5 %
Modernisation risk Property specific
Useful life 20 – 30 years
Property yield 6 – 8 %
Capitalisation rate 7 – 10 % (real rate)
Statistics (standard parameters)
Site area > 1,000 m²
No. of parking spaces required 20 – 100
Proportion of value attrib. to the site 15 – 35%
Property size (lettable area) 300 – 2,000 m²
No. of storeys Single storey
Construction ratio usable area/GFA 80 – 90%
Ratio sales area/usable area 70 – 85%
Fit-out specification Basic
Building costs (excl. site improvements) EUR 700 – 900 /sqm GFA
Ancillary building costs 8 – 12%
Standard market rent p.m. EUR 8 – 12/m²
Gross income multiplier 8 to 12 times
Net Initial Yield 6 – 8 %
Turnover per m² of sales area p.a. Euro 2,000 – 8,000
Rent to sales ratio 4 - 6 %
These recommendations must carefully be verified for each valuation!

Valuation Parameters of Retail Properties Spain
Data Sheets Supermarkets
104
Location characteristics
Medium to highly populated residential areas; High visibility; Good transportation access; Sufficient number of parking spaces (mainly outdoor).
Property characteristics
Normally single storey; Mainly outdoor parking spaces (sometimes indoor), mostly for free; Average to low building qualities. Basic design; Sometimes in combination with smaller stores; Surface area < 2,500 m². Average: big supermarkets 1,500 m²; medium-size
supermarkets 800 m².
Facts
Company Group Type No. of stores
Average GLA in m²
Total sales (in billion EUR)
Mercadona Mercadona Big supermarket 1,448 1,245 17.8
Eroski center / Caprabo Eroski Big supermarket 1,100 1,247 3.2
Sabeco / Simply Auchan. Big supermarket 209 2,000 1.0
El Árbol El Árbol Medium-size supermarket 459 720 0.8
Carrefour Market Carrefour Big supermarket 112 1,785 0.8
Supercor El Corte Inglés Big supermarket 90 2,000 0.4
Ahorra Más IFA Medium-size supermarket 220 800 1.4
Source: respective financial reports, Alimarket report and self-elaboration. Figures refer just to supermarkets, not to the respective groups.
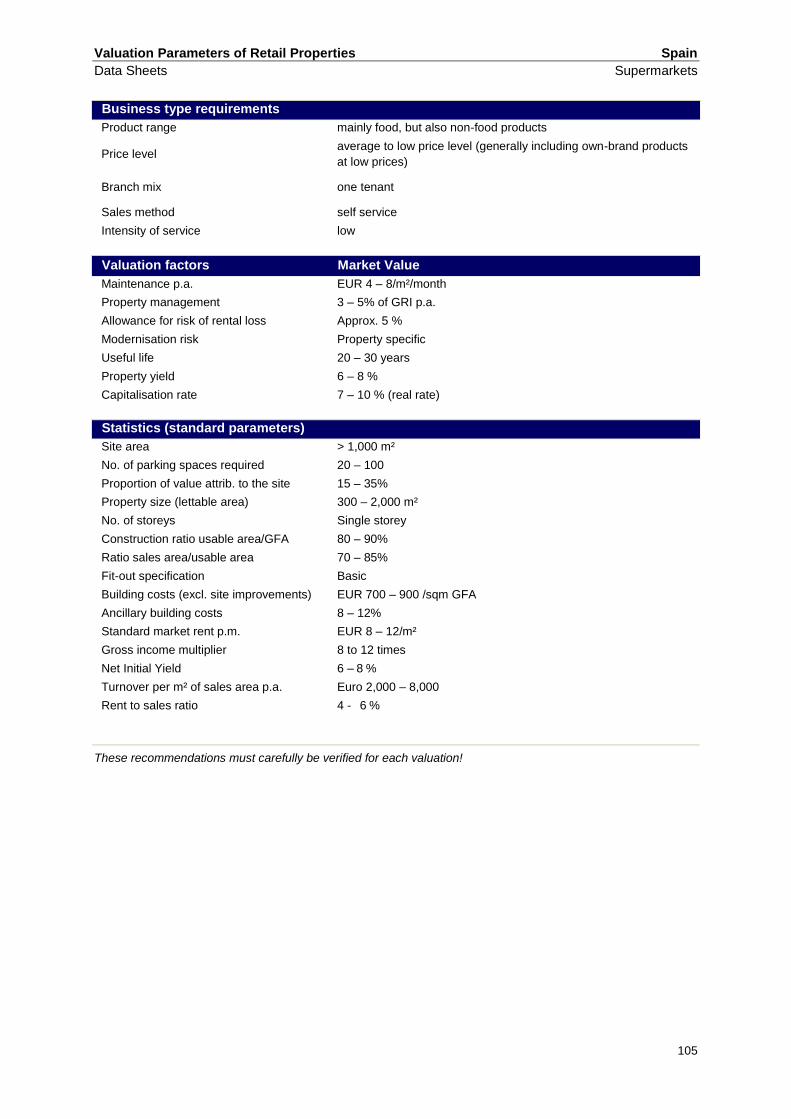
Valuation Parameters of Retail Properties Spain
Data Sheets Supermarkets
105
Business type requirements
Product range mainly food, but also non-food products
Price level average to low price level (generally including own-brand products
at low prices)
Branch mix one tenant
Sales method self service
Intensity of service low
Valuation factors Market Value
Maintenance p.a. EUR 4 – 8/m²/month
Property management 3 – 5% of GRI p.a.
Allowance for risk of rental loss Approx. 5 %
Modernisation risk Property specific
Useful life 20 – 30 years
Property yield 6 – 8 %
Capitalisation rate 7 – 10 % (real rate)
Statistics (standard parameters)
Site area > 1,000 m²
No. of parking spaces required 20 – 100
Proportion of value attrib. to the site 15 – 35%
Property size (lettable area) 300 – 2,000 m²
No. of storeys Single storey
Construction ratio usable area/GFA 80 – 90%
Ratio sales area/usable area 70 – 85%
Fit-out specification Basic
Building costs (excl. site improvements) EUR 700 – 900 /sqm GFA
Ancillary building costs 8 – 12%
Standard market rent p.m. EUR 8 – 12/m²
Gross income multiplier 8 to 12 times
Net Initial Yield 6 – 8 %
Turnover per m² of sales area p.a. Euro 2,000 – 8,000
Rent to sales ratio 4 - 6 %
These recommendations must carefully be verified for each valuation!
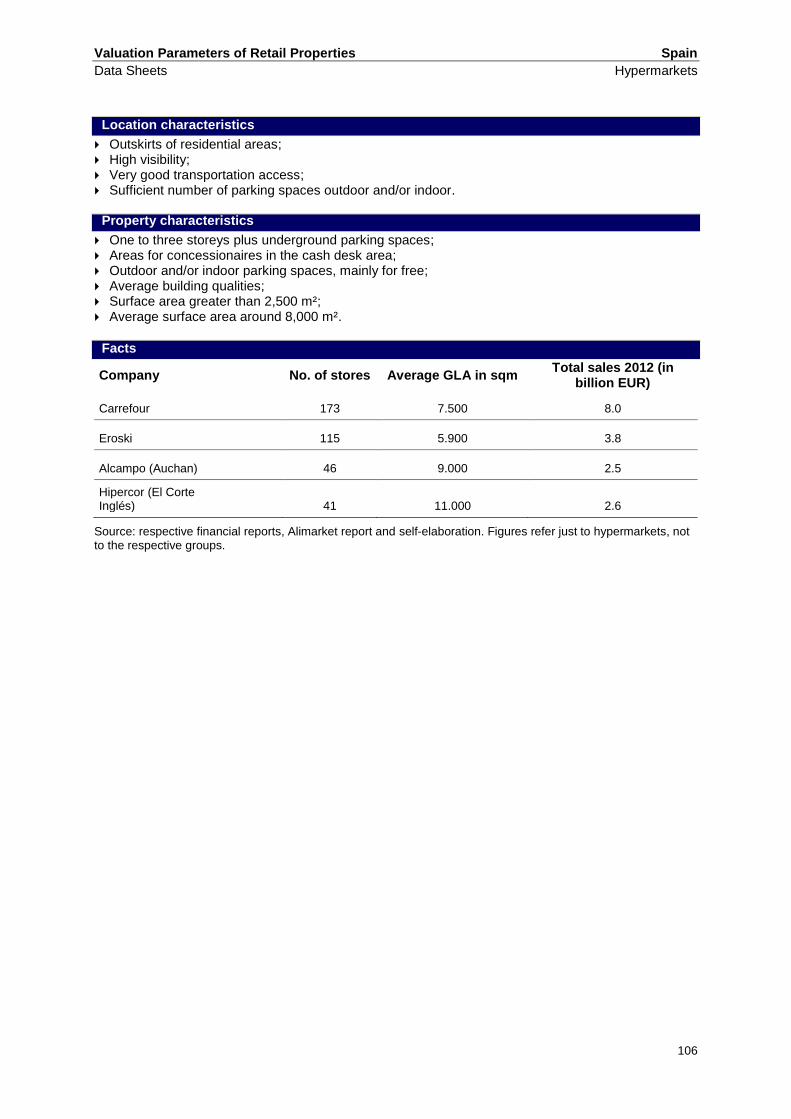
Valuation Parameters of Retail Properties Spain
Data Sheets Hypermarkets
106
Location characteristics
Outskirts of residential areas; High visibility; Very good transportation access; Sufficient number of parking spaces outdoor and/or indoor.
Property characteristics
One to three storeys plus underground parking spaces; Areas for concessionaires in the cash desk area; Outdoor and/or indoor parking spaces, mainly for free; Average building qualities; Surface area greater than 2,500 m²; Average surface area around 8,000 m².
Facts
Company No. of stores Average GLA in sqm Total sales 2012 (in
billion EUR)
Carrefour 173 7.500 8.0
Eroski 115 5.900 3.8
Alcampo (Auchan) 46 9.000 2.5
Hipercor (El Corte Inglés) 41 11.000 2.6
Source: respective financial reports, Alimarket report and self-elaboration. Figures refer just to hypermarkets, not to the respective groups.

Valuation Parameters of Retail Properties Spain
Data Sheets Hypermarkets
107
Business type requirements
Product range both food and non-food products
Price level average price level (generally including own-brand products at low
prices)
Branch mix one tenant
Sales method self service
Intensity of service low
Valuation factors Market Value
Maintenance p.a. EUR 4 – 8/m²/month
Property management 3 – 5% of GRI p.a.
Allowance for risk of rental loss Approx. 5 %
Modernisation risk Property specific
Useful life 20 – 30 years
Property yield 7 – 9 %
Capitalisation rate 7 – 10 % (real rate)
Statistics (standard parameters)
Site area > 10,000 m²
No. of parking spaces required 500 – 1.000
Proportion of value attrib. to the site 15 – 30%
Property size (lettable area) 5,000 – 12,000 sqm
No. of storeys 1 - 3 storeys plus underground parking
Construction ratio usable area/GFA 80 – 90%
Ratio sales area/usable area 60 – 75%
Fit-out specification basic to average
Building costs (excl. site improvements) EUR 700 – 900 /sqm GFA
Ancillary building costs 8 – 12%
Standard market rent p.m. EUR 8 – 12/m²
Gross income multiplier 8 to 12 times
Net Initial Yield 6 –8%
Turnover per m² of sales area p.a. EUR 5,000 – 7.000
Rent to sales ratio 5 –7 %
These recommendations must carefully be verified for each valuation!
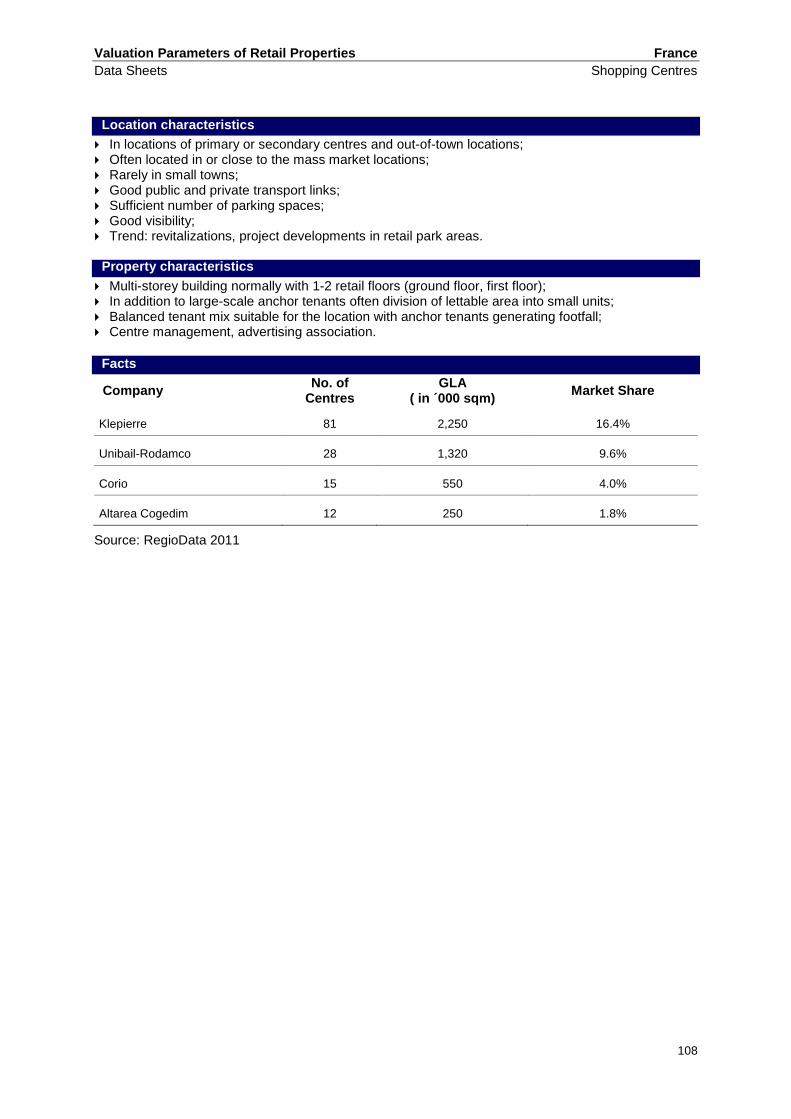
Valuation Parameters of Retail Properties France
Data Sheets Shopping Centres
108
Location characteristics
In locations of primary or secondary centres and out-of-town locations; Often located in or close to the mass market locations; Rarely in small towns; Good public and private transport links; Sufficient number of parking spaces; Good visibility; Trend: revitalizations, project developments in retail park areas.
Property characteristics
Multi-storey building normally with 1-2 retail floors (ground floor, first floor); In addition to large-scale anchor tenants often division of lettable area into small units; Balanced tenant mix suitable for the location with anchor tenants generating footfall; Centre management, advertising association.
Facts
Company No. of
Centres GLA
( in ´000 sqm) Market Share
Klepierre 81 2,250 16.4%
Unibail-Rodamco 28 1,320 9.6%
Corio 15 550 4.0%
Altarea Cogedim 12 250 1.8%
Source: RegioData 2011

Valuation Parameters of Retail Properties France
Data Sheets Shopping Centres
109
Business type requirements
Product range Orientated to the (often) discerning demands of customers
depending on the positioning of the shopping centre;
Price level Average to high, depending on the positioning of the shopping
centre;
Branch mix Diversified branch mix, high proportion of fashion, supplemented
by services and leisure;
Sales method Depending on supplier, ranging from sales advice, event shopping to self-service;
Intensity of service High (central management, advertising association).
Valuation factors Market Value MLV
Maintenance p.a. 7.5 - 15 €/m² 7.5 -15 €/m²
Property management 2% - 3% of the
annual gross income
2% - 3% of the annual
gross income
Allowance for risk of rental loss ≥4% ≥4%
Modernisation risk Property specific 0.5 to 3%
Useful life up to 50 years 15 - 50 years
Property yield 4.50 - 4.75% (prime)
Capitalisation rate 6.5 - 9%
Statistics (standard parameters)
Site area 10.000 – 200.000sqm
No. of parking spaces required 400 – 7,000 spaces
Proportion of value attrib. to the site 30 to 50%
Property size (lettable area) 10,000 – 100,000sqm, larger in individual cases
No. of storeys Mostly multi-storey, standard 1–2 retail floors
Construction ratio usable area/GFA 60 – 75%, subject to the size of the mall
Ratio sales area/usable area 60 – 80%
Fit-out specification average to high quality
Building costs (excl. site improvements) €1,000 - €2,500 per m² of gross area
Ancillary building costs 15 - 20% (incidental building costs)
Standard market rent p.m. EUR 20 – 35/sqm (Basis – usable area)
Gross income multiplier 16 – 25 times
Net Initial Yield 4.50 to 4.75% (prime)
Turnover per m² of sales area p.a. EUR 4,000 – 7,000
Rent to sales ratio 6 – 12%
These recommendations must carefully be verified for each valuation!
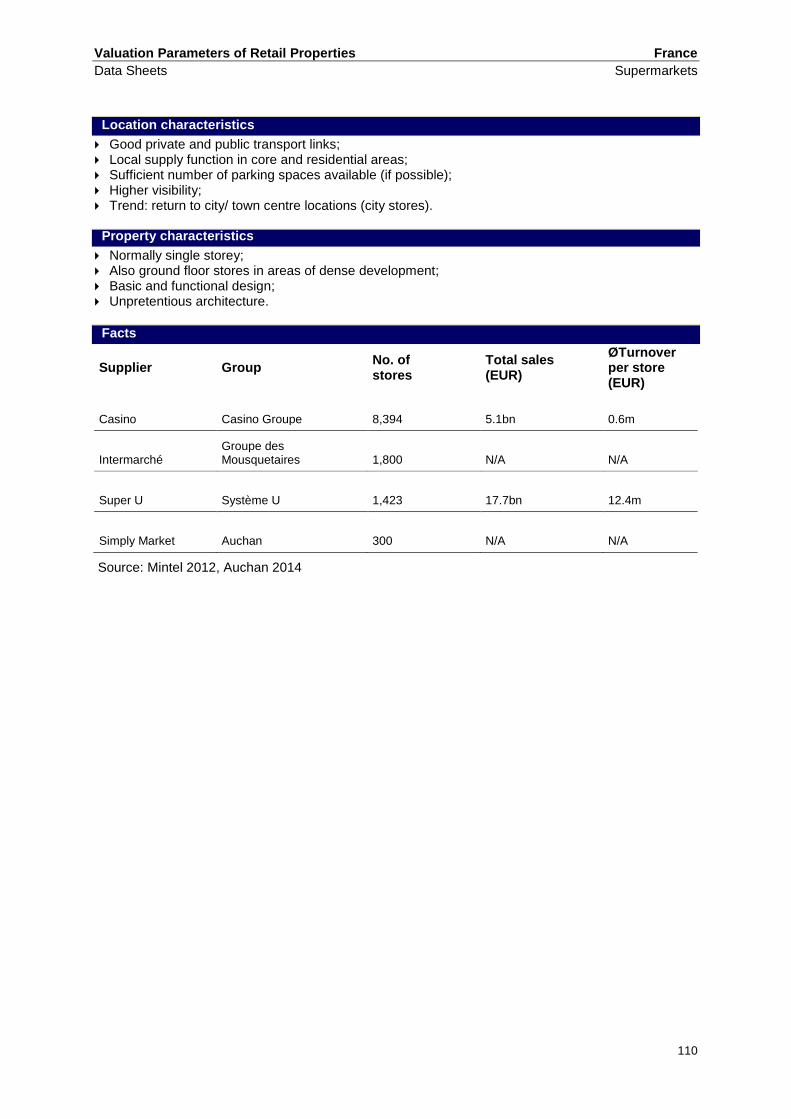
Valuation Parameters of Retail Properties France
Data Sheets Supermarkets
110
Location characteristics
Good private and public transport links; Local supply function in core and residential areas; Sufficient number of parking spaces available (if possible); Higher visibility; Trend: return to city/ town centre locations (city stores).
Property characteristics
Normally single storey; Also ground floor stores in areas of dense development; Basic and functional design; Unpretentious architecture.
Facts
Supplier Group No. of stores
Total sales (EUR)
ØTurnover per store (EUR)
Casino Casino Groupe 8,394 5.1bn 0.6m
Intermarché Groupe des Mousquetaires 1,800 N/A N/A
Super U Système U 1,423 17.7bn 12.4m
Simply Market Auchan 300 N/A N/A
Source: Mintel 2012, Auchan 2014
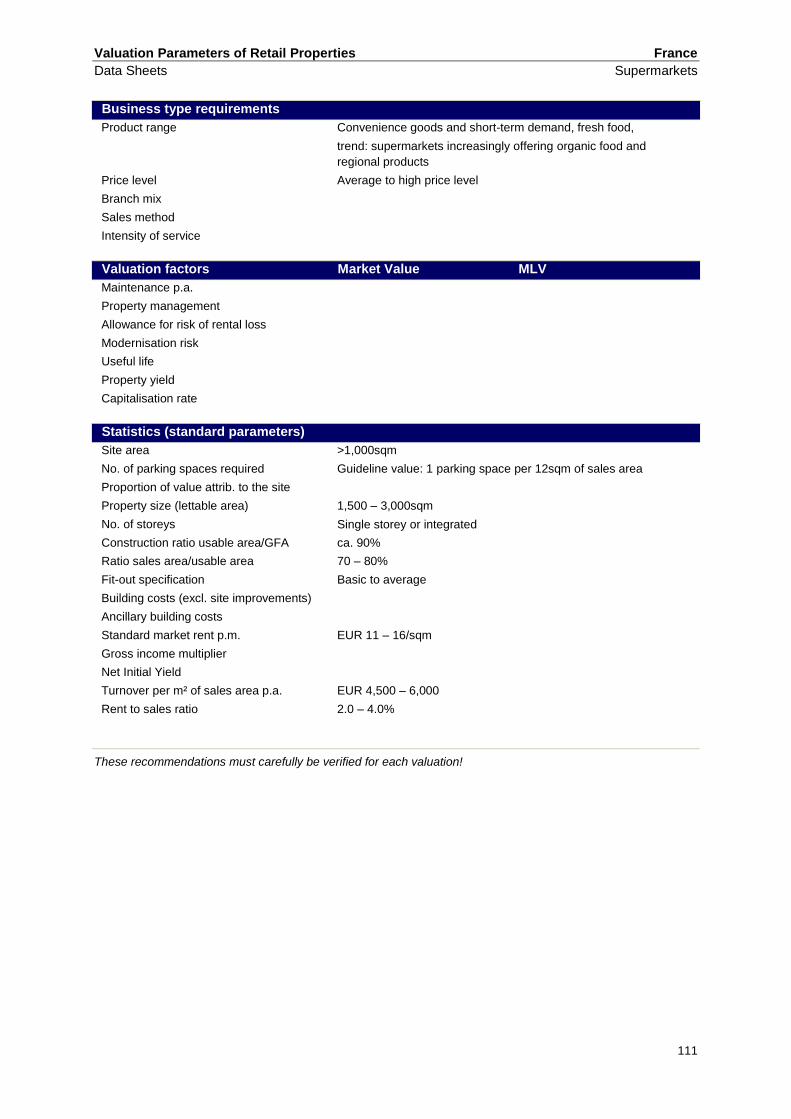
Valuation Parameters of Retail Properties France
Data Sheets Supermarkets
111
Business type requirements
Product range Convenience goods and short-term demand, fresh food,
trend: supermarkets increasingly offering organic food and
regional products
Price level Average to high price level
Branch mix
Sales method
Intensity of service
Valuation factors Market Value MLV
Maintenance p.a.
Property management
Allowance for risk of rental loss
Modernisation risk
Useful life
Property yield
Capitalisation rate
Statistics (standard parameters)
Site area >1,000sqm
No. of parking spaces required Guideline value: 1 parking space per 12sqm of sales area
Proportion of value attrib. to the site
Property size (lettable area) 1,500 – 3,000sqm
No. of storeys Single storey or integrated
Construction ratio usable area/GFA ca. 90%
Ratio sales area/usable area 70 – 80%
Fit-out specification Basic to average
Building costs (excl. site improvements)
Ancillary building costs
Standard market rent p.m. EUR 11 – 16/sqm
Gross income multiplier
Net Initial Yield
Turnover per m² of sales area p.a. EUR 4,500 – 6,000
Rent to sales ratio 2.0 – 4.0%
These recommendations must carefully be verified for each valuation!

Valuation Parameters of Retail Properties France
Data Sheets Hypermarkets
112
Location characteristics
For customers with cars, good transport links; Very good visibility;
Spacious, ground level customer car park Preferably in commercial/ special zones on the fringe of the city/ town and on arterial roads; Sufficiently dimensioned catchment area; Solitary location, often retail agglomeration together with other retail businesses; Trend: Drive-in concepts;
Trend: Property characteristics Single storey, functional and cost efficient type of construction, basic fitout specification; Mostly areas for concessionaires in the cash desk area or attached malls; Spacious, ground level and free of charge parking spaces close to the property; Target size: 5,000 sqm to 20,000 sqm usable area; Trend: higher awareness of service charges, stronger revitalisation pressure; Trend: decreasing useful life.
Facts
Supplier Group No. of stores
Total sales (EUR)
ØTurnover per store (EUR)
Carrefour Carrefour 763 35.2bn 46.1m
E. Leclerc E. Leclerc 560 30bn 53.6m
Auchan Auchan 543 19.9bn 36.6m
Intermarché Groupe des Mousquetaires 356 N/A N/A
Source: Mintel 2012

Valuation Parameters of Retail Properties France
Data Sheets Hypermarkets
113
Business type requirements
Product range Offering a high variety of food, wide non-food product range,
fresh food department;
Price level Average price level, discount-orientated (own brands);
Branch mix Often only one supplier plus small- to mid-sized tenants at the
mall;
Sales method Service for fresh products, high advertising activity;
Intensity of service Average
Valuation factors Market Value MLV
Maintenance p.a. €5 - €8 per m² €5 - €8 per m²
Property management 1 - 3% of the annual gross
income
1 - 3% of the annual gross
income
Allowance for risk of rental loss ≥4% ≥4%
Modernisation risk Property specific 0.2 - 1.2%
Useful life > 30 years 15 - 30 years
Property yield 5.00 - 6.50% (prime)
Capitalisation rate 6.5 - 8.5%
Statistics (standard parameters)
Site area >10,000sqm
No. of parking spaces required 200 – 500 spaces
Proportion of value attrib. to the site 15 - 30% (if not in the inner city)
Property size (lettable area) 5,000 – 20,000sqm
No. of storeys Normally single storey
Construction ratio usable area/GFA ca. 90%
Ratio sales area/usable area 60 – 75%
Fit-out specification Basic to average
Building costs (excl. site improvements) €500 - €750 per m² of gross area
Ancillary building costs 10 - 15% (incidental building costs)
Standard market rent p.m. EUR 7.5 – 11/sqm
Gross income multiplier
Net Initial Yield
Turnover per m² of sales area p.a. EUR 5,000 – 8,000
Rent to sales ratio 2.0 – 3.5%
These recommendations must carefully be verified for each valuation!

Valuation Parameters of Retail Properties France
Data Sheets Food Discounters
114
Location characteristics
Cities/ towns and communities with min. 5,000 inhabitants; Better visibility; Also in commercial/ special zones if aforementioned characteristics are satisfied; Discounters also in retail agglomerations; Increasingly grouped together with e.g. other supermarkets, retail warehouses, beverage stores
etc.; Sufficiently sized car parking; Good Accessibility.
Property characteristics
Single storey, basic fitout specification; Functional, cost efficient type of construction; Building structure/ architecture often standardized with corporate identity; Trend: maximum permissible property sizes under planning law.
Facts
Supplier Group No. of stores
Total sales (in billion EUR)
ØTurnover per store (in million
EUR)
Lidl Schwarz Stiftung 1,500 6.3 4.2
Dia Dia 916 2.4 2.6
Aldi Aldi 885 2.9 3.3
Leader Price Groupe Casino 600 N/A N/A
Netto Les Mousquetaires 340 N/A N/A
Source: Mintel 2012

Valuation Parameters of Retail Properties France
Data Sheets Food Discounters
115
Business type requirements
Product range
Price level Strongly discount-orientated and price-aggressive
permanently low prices and limited offer prices;
Branch mix
Sales method Mostly self-service;
Intensity of service Low.
Valuation factors Market Value MLV
Maintenance p.a.
Property management
Allowance for risk of rental loss
Modernisation risk
Useful life
Property yield
Capitalisation rate
Statistics (standard parameters)
Site area 4,000 – 6,000 sqm
No. of parking spaces required 70 – 120 spaces
Proportion of value attrib. to the site
Property size (lettable area) 1,000 – 1,400sqm
No. of storeys Single-storey
Construction ratio usable area/GFA ca. 90 %
Ratio sales area/usable area ca. 80 %
Fitout specification Basic
Building costs (excl. site improvements)
Ancillary building costs
Standard market rent p.m. EUR 10.00 – 14.00/sqm
Gross income multiplier
Net Initial Yield
Turnover per m² of sales area p.a. EUR 3,000 – 5,000
Rent to sales ratio 3.0 – 4.0%
These recommendations must carefully be verified for each valuation!

Valuation Parameters of Retail Properties France
Data Sheets Retail Warehouses
116
Location characteristics
For customers with cars, good transport links; Very good visibility; Spacious ground level customer car park; Preferably in commercial/ special zones on the fringe of the city/ town and on arterial roads; Sufficiently large catchment area; Mainly in retail agglomeration; Trend: numerous small to mid-size retail warehouses adjoined in out-of-town retail parks.
Property characteristics
Single-storey, basic fitout specification; Functional, cost efficient type of construction; Spacious if possible ground level and free of charge parking spaces close to the property; Several retail warehouse are deprecated; Target size: between 300 sqm (bed/mattress stores) and up to 8,000 sqm (sports); Trend: stores constructed from the perspective of cost efficiency in terms of property maintenance
and energy consumption
Facts
Supplier Group No. of stores
Total sales (in billion EUR)
ØTurnover per store (in million
EUR)
Fnac/Redcats PPR 91 4.3 47.3
INTERSPORT Intersport 585 1.3 2.2
Darty Darty 250 2.8 11.2
Décathlon Groupe Oxylane 250 2.9 11.6
Boulanger HTM Group 171 2.4 14.0
Source: Mintel 2012

Valuation Parameters of Retail Properties France
Data Sheets Retail Warehouses
117
Business type requirements
Product range Broad and extensive product range
Price level Low to average price level, some discount-orientated (own
brands)
Branch mix One supplier
Sales method Mainly self-service, high advertising activity
Intensity of service Broad and extensive product range
Valuation factors Market Value MLV
Maintenance p.a. €5 - €8 per m² €5 to €8 per m²
Property management 1 - 3% of the annual gross
income
1 - 3% of the annual gross
income
Allowance for risk of rental loss ≥4% ≥4%
Modernisation risk Property specific 0.2 - 1.2%
Useful life > 30 years 15 - 30 years
Property yield 5.75 - 6.25% (prime)
Capitalisation rate 6.5 - 8.5%
Statistics (standard parameters)
Site area General statement not possible
No. of parking spaces required ca. 30 – 300 spaces
Proportion of value attrib. to the site 15 - 30%
Property size (lettable area) 500 – 8,000sqm
No. of storeys Single-storey
Construction ratio usable area/GFA ca. 90%
Ratio sales area/usable area 75 – 90%
Fit-out specification Basic
Building costs (excl. site improvements) €500 - €800 (higher cost if the building is within a retail park)
Ancillary building costs 10 - 15% (incidental building costs)
Standard market rent p.m. EUR 8.00 – 25.00/sqm
Gross income multiplier 13 - 15-times
Net Initial Yield 5.75 to 6.25% (prime)
Turnover per m² of sales area p.a. EUR 2,000 – 12,000
Rent to sales ratio 2.0 – 12.0%

Valuation Parameters of Retail Properties France
Data Sheets DIY stores
118
Location characteristics
Locations with good transport links; Often located on the fringe of the city/ town; In catchment areas of large cities and agglomerations; High number of parking spaces; Trend: often in retail agglomeration.
Property characteristics
Mostly single-storey with basic functional appearance; Small neighborhood-stores to large-scale stores; Mostly ground level parking spaces; Heated and unheated warehouse areas; Functional, cost efficient type of construction; Broad column grid > 10 m sensible; Medium open sales area; Trend: drive-through.
Facts
Supplier Group No. of stores
Total sales (in billion EUR)
ØTurnover per store (in million
EUR)
Bricomarché ITM Intermarché 625 1.6 2.6
Gedimat Gedex-Gedimat 380 1.5 3.9
Castorama Kingfisher 205 5.1 10.5
Groupe Adeo Groupe Adeo 120 4.3 35.8
Mr Bricolage Mr Bricolage Group 89* 1.8 20.2
Source: Mintel 2012 * directly-owned stores only.

Valuation Parameters of Retail Properties France
Data Sheets DIY stores
119
Business type requirements
Product range Extensive DIY product range, often with integrated
kitchen furniture
Price level Low to average price level, discount campaigns, without
detailed strategic positioning;
Branch mix Consumer goods and building material for construction
and DIY;
Sales method Mainly self-service
Intensity of service Limited
Valuation factors Market Value MLV
Maintenance p.a. €5 - €8 per m² €5 - €8 per m²
Property management 1 - 3% of the annual gross
income
1 - 3% of the annual gross
income
Allowance for risk of rental loss ≥4% ≥4%
Modernisation risk Property specific 0.2 - 1.2%
Useful life > 30 years 15 to 30 years
Property yield 5.75 - 6.25% (prime)
Capitalisation rate 6.5 - 8.5%
Statistics (standard parameters)
Site area 5,000 – 50,000sqm
No. of parking spaces required 100 – 400 spaces
Proportion of value attrib. to the site 15 - 30%
Property size (lettable area) 1.000 – 20,000sqm
No. of storeys single-storey
Construction ratio usable area/GFA ca. 95%
Ratio sales area/usable area 80 – 90%
Fit-out specification Basic
Building costs (excl. site improvements) €500 - €700
Ancillary building costs 10 - 15% (incidental building costs)
Standard market rent p.m. EUR 6.00 – 15.00/sqm
Gross income multiplier
Net Initial Yield 5.75 - 6.25% (prime)
Turnover per m² of sales area p.a. EUR 1,200 – 3,500
Rent to sales ratio 4.5 – 7.0%

Valuation Parameters of Retail Properties France
Data Sheets FOC – Factory Outlet Centres
120
Location characteristics
Mainly difficult planning consent procedure; Good accessibility by car, if possible close to motorway intersections outside of city/ town centres; Target location often close to regions with high tourism; Of medium importance in France. Highest FOC density in UK; Preferred catchment area between 4 and up to 5.5 million inhabitants or 3 million inhabitants within
a one hour drive.
Property characteristics
A cluster of single storey buildings with USP, e.g. village style, min. 30 individual shops, each approx. 200 sqm;
Opening hours similar to shopping centres; Control and marketing by a very active centre management; Sufficient number of parking spaces free of charge; Normally each shop is heated separately.
Facts
Property Group
No. of stores (Europe)
Sales area (sqm)
McArthurGlen Troyes McArthurGlen 17 28,700
Marques Avenue Troyes Concepts & Distribution 9 25,000
The Style Outlets Roppenheim Neinver 12 22,000
One Nation Paris Plaisir Advantail 3 20,000
Marques Avenue Talange Concepts & Distribution 9 19,000
Source: ecostra 2013

Valuation Parameters of Retail Properties France
Data Sheets FOC – Factory Outlet Centres
121
Business type requirements
Product range
Unsold stock by definition, collections of the previous
season and products with faults (second quality), sample
collection;
Price level
Branch mix Strong focus on clothing including shoes, sports ware,
glass, porcelain, household goods;
Sales method Service (professional shop assistants) with the philosophy
based on ‘brand competence’ and ‘transparent price
reductions’;
Intensity of service High due to well-known brands.
Valuation factors Market Value MLV
Maintenance p.a. . .
Property management . .
Allowance for risk of rental loss . .
Modernisation risk . .
Useful life . .
Property yield . .
Capitalisation rate . .
Statistics (standard parameters)
Site area 20,000 – 50,000sqm
No. of parking spaces required 300 – 1,500 spaces
Proportion of value attrib. to the site
Property size (lettable area) 10,000 – 30,000sqm
No. of storeys 1 – 2 storey
Construction ratio usable area/GFA no information
Ratio sales area/usable area ca. 80%
Fit-out specification Average
Building costs (excl. site improvements)
Ancillary building costs
Standard market rent p.m. EUR 25.00 – 40.00/sqm
Gross income multiplier 14 - 17 times
Net Initial Yield Over 6.5%
Turnover per m² of sales area p.a. EUR 5,000 – 7,000
Rent to sales ratio min. 8.0 – 10.0%

Valuation Parameters of Retail Properties UK
Data Sheets Food Discounters
122
Location characteristics
Retail warehouse park or commercial location on edge of town with main road visibility and frontage Typically smaller and less affluent towns and demographics. Catchment populations ≥10,000 Min. c 3250 sq m sites
Property characteristics
Single storey industrial style unit with some display windows, purpose built or converted retail warehouse.
Free surface parking adjoins typically 80 spaces 1/20 sq m gla Minimal fit out, although the trend is improving 1500 – 2,000 sq m gla ideally Operators prefer to purchase freehold, town centre or edge of centre sites and develop their own
customised building
Facts
Supplier Group No. of stores
Total sales (in billion EUR)
ØTurnover per store (in million EUR)
Aldi Aldi
Lidl Schwartz Stiftung
Netto Edeka
No published UK-specific data
KantarWorldPanel estimate Aldi and Lidl have 4% and 3.1% respectively of UK grocery spend

Valuation Parameters of Retail Properties UK
Data Sheets Food Discounters
123
Business type requirements
Product range Popular lines from major brands plus some own label of modest
quality or other unknown (with Germanic slant)
Price level Permanent discounts;
Branch mix Mainly pre-packed food and groceries; some fresh veg.; alcohol
Sales method Pile it high and sell it cheap
Intensity of service Minimal.
Trend: more and higher quality lines; better presentation
Valuation factors Market Value MLV
Maintenance p.a. Tenants responsibility EUR ≥5
Property management Recovered from tenant 1 - 3%
Allowance for risk of rental loss Implied in yield ≥4%
Modernisation risk Implied in yield 0-1%
Useful life 50 years 15 - 30 Years
Property yield 6 - 9%
Capitalisation rate 6.5 - 9%
Statistics (standard parameters)
Site areas 5000 sq m
No. of parking spaces required 80
Proportion of value attrib. to the site +/- 25%
Property size (lettable area) 1600 sq m ideally
No. of storeys Grd Flr only
Construction ratio usable area/GFA 98%
Ratio sales area/usable area 80
Fitout specification Minimal; painted block walls
Building costs (excl. site improvements) EUR 660 - 840 psm GFA
Ancillary building costs 10%
Standard market rent p.m. EUR 150- 260 psm pa
Gross income multiplier
Net Initial Yield 6 - 9%
Turnover per m² of sales area p.a.
Rent to sales ratio
These recommendations must carefully be verified for each valuation!

Valuation Parameters of Retail Properties UK
Data Sheets Shopping Centres
124
Location characteristics
Town and city centres; occasionally edge of town Generally backland adjacent to established high street with one or more pedestrian links thereto Good pedestrian linkages are fundamental to success Good private and public transport e.g. additional bus routes created if edge of town
Property characteristics
Multi-storey structure with two, three or exceptionally four levels An open mall with no significant servicing is more properly regarded as a terrace of retail units Includes one or more variety chain stores and department store if large enough plus a range of
units of varying sizes Tenants are mainly national chains; very few independents and only at periphery Often incorporate multi-storey car parking which is essential to larger schemes Servicing facilities include delivery bay with goods lifts to servicing corridors Public areas often climate controlled; lifts/escalators On-site management and marketing the centre as an entity Trend: lettings at base rent with turnover top up, close attention to tenant mix; tight control of
operating costs, extended hours and seven day trading
Facts
Company No. of Centres
GLA ( in ´000 sqm)
Market Share
Westfield 5 600
Intu 16 1,700
LaSalle Investment Management 33
585
Land Securities Properties 22 706
Threadneedle Property Investments 31
362
Hammerson 14 669
Source:Trevor Woods/Company Websites
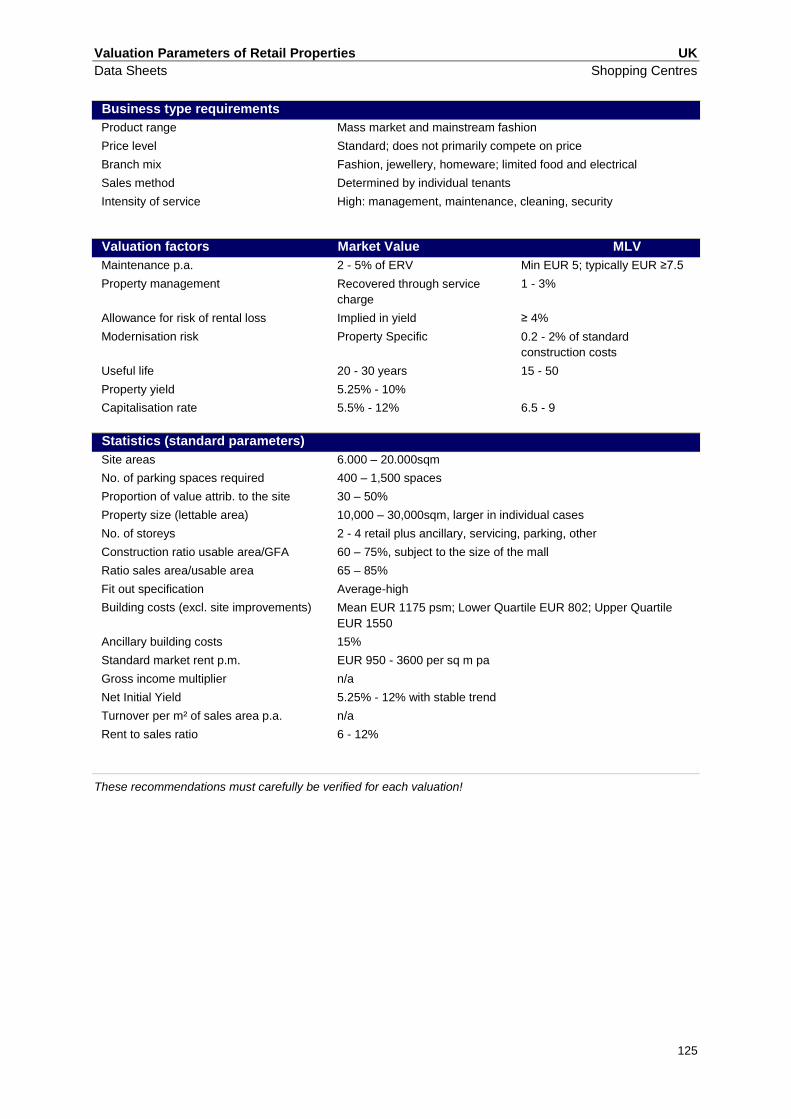
Valuation Parameters of Retail Properties UK
Data Sheets Shopping Centres
125
Business type requirements
Product range Mass market and mainstream fashion
Price level Standard; does not primarily compete on price
Branch mix Fashion, jewellery, homeware; limited food and electrical
Sales method Determined by individual tenants
Intensity of service High: management, maintenance, cleaning, security
Valuation factors Market Value MLV
Maintenance p.a. 2 - 5% of ERV Min EUR 5; typically EUR ≥7.5
Property management Recovered through service
charge
1 - 3%
Allowance for risk of rental loss Implied in yield ≥ 4%
Modernisation risk Property Specific 0.2 - 2% of standard
construction costs
Useful life 20 - 30 years 15 - 50
Property yield 5.25% - 10%
Capitalisation rate 5.5% - 12% 6.5 - 9
Statistics (standard parameters)
Site areas 6.000 – 20.000sqm
No. of parking spaces required 400 – 1,500 spaces
Proportion of value attrib. to the site 30 – 50%
Property size (lettable area) 10,000 – 30,000sqm, larger in individual cases
No. of storeys 2 - 4 retail plus ancillary, servicing, parking, other
Construction ratio usable area/GFA 60 – 75%, subject to the size of the mall
Ratio sales area/usable area 65 – 85%
Fit out specification Average-high
Building costs (excl. site improvements) Mean EUR 1175 psm; Lower Quartile EUR 802; Upper Quartile
EUR 1550
Ancillary building costs 15%
Standard market rent p.m. EUR 950 - 3600 per sq m pa
Gross income multiplier n/a
Net Initial Yield 5.25% - 12% with stable trend
Turnover per m² of sales area p.a. n/a
Rent to sales ratio 6 - 12%
These recommendations must carefully be verified for each valuation!

Valuation Parameters of Retail Properties UK
Data Sheets Supermarkets
126
Location characteristics
Large out of town (OOT) supermarket (4,000sqm upwards): Visible site on or near trunk road, accessible by car, in residential, commercial or rural area
Convenience Store (suburban): (300-2,000 sq m) Visible site on classified road, accessible by car in residential area
Convenience Store (in town): (200-500 sq m) High Street adjoining parking
Property characteristics
OOT: predominantly single storey, (maybe 1st flr ancillary) with own free surface parking; separate
goods entrance; often includes café and perhaps pharmacy. No third party retailers unless part of neighborhood scheme. Can include architectural embellishment/ vernacular features. Fully air conditioned. Rarely build more than 6,000 sq m today; 12,000 sq m stores often being down-sized.
Suburban: Ground floor sales (often 1st flr ancillary) with own free surface parking. Trend to
adapting/converting existing buildings eg former pubs In Town: purpose built with surface, or in larger towns multi storey parking with direct lift access;
smaller stores can be standard shops Trend: Supermarkets are focusing on opening smaller, convenience stores and improving online
operations Operators almost always purchase freehold and develop their own customised building which they
may sell as a leaseback investment when complete Average lease length is 25 years, supermarkets offer excellent covenants and leases increasingly
include regular RPI rent reviews producing strong market values
Facts
Supplier Group
No. of Stores (Of which convenience)
Total sales (EUR Billion)
ØTurnover per store (EUR Million)
Sainsbury's J Sainsbury plc 1,016 (523) 30.7 30.2
Asda Walmart Stores, Inc 564 (0) 27.4 48.5
Tesco (UK food operations only) Tesco plc 3,146 (1601) 52.3 16.6
Morrisons WM Morrison Supermarkets plc 577 (est) (85) 21.7 43.6
Waitrose John Lewis Partnership plc 290 (35) 6.9 23.8
Co-Op Food The Co-operative Group 2,816 (2,816) 8.9 3.2
Source: Companies’ published accounts

Valuation Parameters of Retail Properties UK
Data Sheets Supermarkets
127
Business type requirements
Product range Fresh food, groceries, alcohol, household products; wide range of
“own label” products including growing premium ranges
Price level Standard pricing with selected promotional offers
Branch mix Average of 30,000 lines stocked, of which half are “own label”
Sales method Self service; self scanning/self checkout increasing
Intensity of service Increasing as automation frees up staff
Valuation factors Market Value MLV
Maintenance p.a. Tenants responsibility EUR 5 - 8
Property management Recovered from tenant 1 - 3%
Allowance for risk of rental loss Implied in yield ≥4%
Modernisation risk Property specific 0.2 - 1.2%
Useful life 60 Years 15 - 30
Property yield ≥4.25%
Capitalisation rate ≥4.25% 6.5 - 8.5%
Statistics (standard parameters)
Site areas 20,000 sq m (ideally 25% site cover)
No. of parking spaces required 1 space per 17sq m gross
Proportion of value attrib. to the site 20 – 50%
Property size (lettable area) 5,500 sq m
No. of storeys Single storey with some 1st floor ancillary
Construction ratio usable area/GFA 98%
Ratio sales area/usable area 50% (sales typically excludes checkout area)
Fit out specification Tiled floor, suspended ceiling, air con
Building costs (excl. site improvements) Mean: EUR 1,320 psm; Lower Quartile EUR 972; Upper Quartile:
EUR 1,860
Ancillary building costs 10%
Standard market rent p.m. Typically EUR 21 psm pm. (EUR 10-15 psm pm secondary; EUR
25-35 psm pm Prime)
Gross income multiplier 22
Net Initial Yield 4.25%
Turnover per m² of sales area p.a. EUR 10,000/sq m
Rent to sales ratio 2 - 3% of turnover
These recommendations must carefully be verified for each valuation!

Valuation Parameters of Retail Properties PropertyTypes Data Overview
Supermarkets
128
1 of standard construction costs
Supermarkets
Key figures France Germany Greece Italy Latvia
Valuation factors MV MLV MV MLV Market Value Market Value Market Value
Maintenance p.a. min €4/m² €7/m² €1/m² €4/m²
max €9/m² €9/m² €3/m² €8/m²
Property management (in % of GRI p.a.)
min 1%
1% 1%
max 2% 3% 3%
Allowance of risk of rental loss
min ≥ 4.0% ≥ 4.0% at least 5%
3%
max 4%
Modernisation risk min Property-
specific
0.2% Property specific
Property-specific, not
more than 1% max 0.5%
1
Useful life (years) min
Up to 40 10 20 10
max 30 40 30
Property yield min 6% 9% 6%
max 8% 11% 12%
Capitalisation rate min 6.5% 12% 7%
max 8.5% 14% 14%
Statistics (standard parameters)
Site area min
>1,000m² >1,000m² n/a 1,000m²
max 4,000m²
No. of parking spaces required
min Guideline: 1 space per
12m² of sales area
20 Guideline: 1 space per
15-20m² of sales area 1 space per
10m² sales area max 80
Proportion of value attrib. to the site
min 15% 20% 8%
max 50% 40% 20%
Property size (lettable area)
min 1,500m²
– 3,000sqm
400m² up to 20,000m² (Carrefour)
200m²
max 3,000m² 1,500m² 1,500m²
No. of storeys Single storey or integrated Single storey or integrated Normally up to 2 storeys Single storey or integrated
Construction ratio usable area/GFA
min Ca. 90% Ca. 90% Less than 80%
Ca. 95%
max
Ratio sales area/usable area
min 70% Ca. 75%
65% 75%
max 80% 80% 85%
Fitout specification Basic to average Basic to average Basic to average Basic to average
Building costs (excl. site improvements)
min €650/m² GFA €500/m² GFA €600/m² GFA
max €850/m² GFA €700/m² GFA €900/m² GFA
Ancillary building costs min
Ca. 12% 7% Not more than
15% max 10%
Standard market rent p.m.
min €11/m² €10/m² €3.50/m² €7/m²
max €16/m² €16/m² €5/m² €12/m²
Gross income multiplier
min 10-times n/a
6-times
max 14-times 16-times
Net Initial Yield min 6% 8% 6%
max 7.0% (with slight
upward trend)
10% (depending on
investment costs) 9%
Turnover per m² sales area p.a.
min €4,500 €3,500 n/a
€2,000
max €6,000 €4,000 €15,000
Rent to sales ratio min 2% 3,5% 1% 2%
max 4% 5% 3% 4%

Valuation Parameters of Retail Properties PropertyTypes Data Overview
Supermarkets
129
2 Tenants responsibility 3 Recovered from tenant 4 Implied in yield 5 Lower Quartile 6 Upper Quartile
Supermarkets
Key figures Poland Romania Serbia Spain UK
Valuation factors Market Value Market Value Market Value Market Value MV MLV
Maintenance p.a. min €1/m² €1/m² €4/m² 2
€5/m²
max €2/m² €3/m² €8/m² €8/m²
Property management (in % of GRI p.a.)
min 1% Ca. 1% 1% 3% 3
1%
max 2% 2% 2% 5% 3%
Allowance of risk of rental loss
min 0%
5% 5%
4
≥ 4.0%
max
Modernisation risk min
Property specific
Property specific Property specific Property
specific
0.2%
max 1.2%
Useful life (in years) min 20
30 20 20
60 15
max 30 40 30 30
Property yield min 7.25% 9% 11% 6% ≥ 4.25%
max 8% 9.5% 13% 8%
Capitalisation rate min 12.5% 12% 7% ≥4.25%
4.25% 6.5%
max 13.7% 14% 10% 8.5%
Statistics (standard parameters)
Site area min 1,000m² 300m² 1,000m² >1,000m² 20,000m² (ideally
25% site cover) max 5,000m² 3,000m² 3,000m²
No. of parking spaces required
min n/a Does not matter
Guideline: 1 space for
12-15m² of sales area
20 1 space per m² gross
max 100
Proportion of value attrib. to the site
min 10% 15% 10% 15% 20
max 25% 30% 30% 35% 50
Property size (lettable area)
min 500m² 150m² 400m² 300m² 5,500m²
max 2,000m² 2,500m² 1,500m² 2,200m²
No. of storeys min
1 Usually 1 storey
2 as exception Single storey or
integrated Single-storey
Single storey with
some 1st floor ancillary
max
Construction ratio usable area/GFA
min ~ 90% 95% 90%
80% 98%
max 90%
Ratio sales area/usable area
min 65% 70% 70% 70% 50% (sales typ. ex-
cludes checkout area) max 80% 80% 80% 85%
Fitout specification
Basic Basic to average Basic Tiled floor, suspended
ceiling, air con
Building costs (excl. site improvements)
min €400/m² GFA €200/m² GFA €400/m² GFA €700/m² GFA €972/m² GFA5
max €600/m² GFA €300/m² GFA €600/m² GFA €900/m² GFA €1,860/m² GFA6
Ancillary building costs min 8% 10% 8%
10% max 12% 15% 12%
Standard market rent p.m.
min €8/m² €12/m² €7/m² €8/m² Typic. €21/m² (€ 10-15
second,€25-35 Prime) max €16/m² €16/m² €12/m² €12/m²
Gross income multiplier
min n/a
n/a
8-times 22-times
max 12-times
Net Initial Yield
min 7.25% 9% 7% 6%
4.25% max 8% 9.5%
10% (depending on
investment costs
8%
Turnover per m² sales area p.a.
min n/a
n/a
€2,000 €10,000
max €8,000
Rent to sales ratio min
0% Data n/a, but sales appr.
30% less than in EU
4% 2%
max 6% 3%
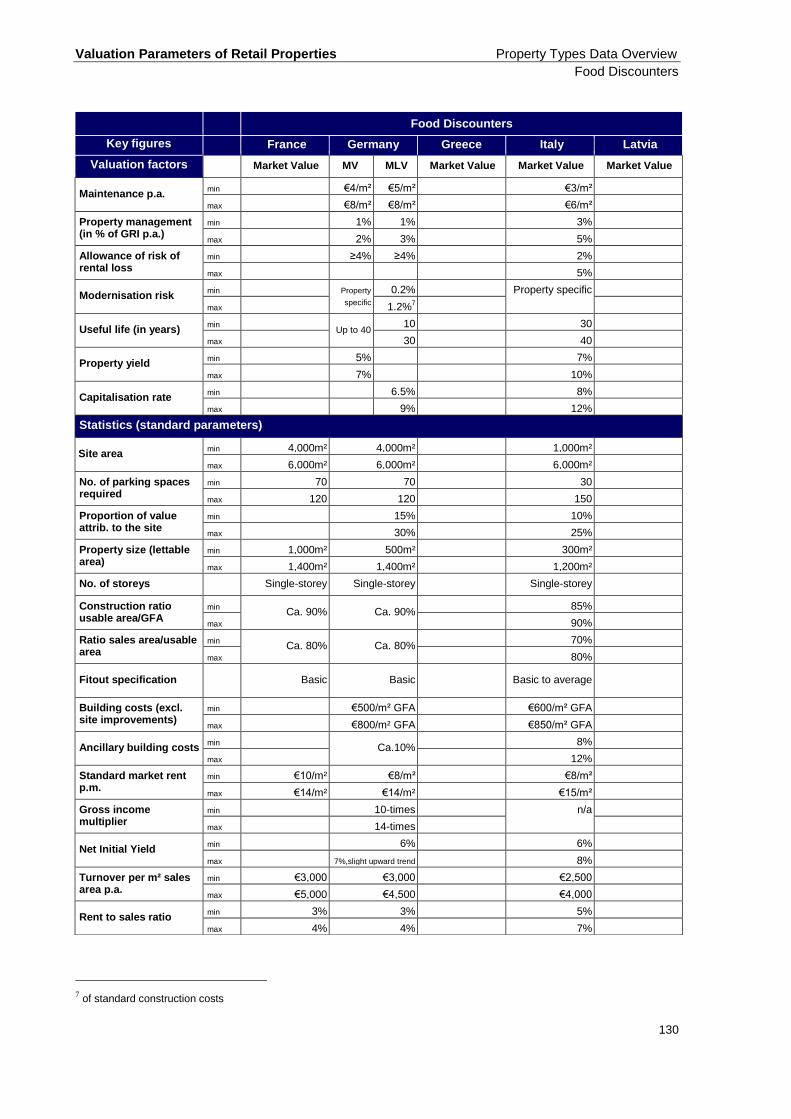
Valuation Parameters of Retail Properties Property Types Data Overview
Food Discounters
130
7 of standard construction costs
Food Discounters
Key figures France Germany Greece Italy Latvia
Valuation factors Market Value MV MLV Market Value Market Value Market Value
Maintenance p.a. min €4/m² €5/m² €3/m²
max €8/m² €8/m² €6/m²
Property management (in % of GRI p.a.)
min 1% 1% 3%
max 2% 3% 5%
Allowance of risk of rental loss
min ≥4% ≥4% 2%
max 5%
Modernisation risk min Property
specific 0.2% Property specific
max 1.2%7
Useful life (in years) min
Up to 40 10 30
max 30 40
Property yield min 5% 7%
max 7% 10%
Capitalisation rate min 6.5% 8%
max 9% 12%
Statistics (standard parameters)
Site area min 4,000m² 4,000m² 1,000m²
max 6,000m² 6,000m² 6,000m²
No. of parking spaces required
min 70 70 30
max 120 120 150
Proportion of value attrib. to the site
min 15% 10%
max 30% 25%
Property size (lettable area)
min 1,000m² 500m² 300m²
max 1,400m² 1,400m² 1,200m²
No. of storeys Single-storey Single-storey Single-storey
Construction ratio usable area/GFA
min Ca. 90% Ca. 90%
85%
max 90%
Ratio sales area/usable area
min Ca. 80% Ca. 80%
70%
max 80%
Fitout specification
Basic Basic Basic to average
Building costs (excl. site improvements)
min €500/m² GFA €600/m² GFA
max €800/m² GFA €850/m² GFA
Ancillary building costs min
Ca.10% 8%
max 12%
Standard market rent p.m.
min €10/m² €8/m² €8/m²
max €14/m² €14/m² €15/m²
Gross income multiplier
min 10-times n/a
max 14-times
Net Initial Yield min 6% 6%
max 7%,slight upward trend 8%
Turnover per m² sales area p.a.
min €3,000 €3,000 €2,500
max €5,000 €4,500 €4,000
Rent to sales ratio min 3% 3% 5%
max 4% 4% 7%

Valuation Parameters of Retail Properties Property Types Data Overview
Food Discounters
131
Food Discounters
Key figures Poland Romania Serbia Spain UK
Valuation factors Market Value Market Value Market Value Market Value MV MLV
Maintenance p.a. p.a. min €1/m² €1/m² €4/m² Tenants
responsib. ≥ €5/m²
max €2/m² €3/m² €8/m²
Property management (in % of GRI p.a.)
min 1% 1% 3% Recov. fr.
tenant
1%
max 2% 2% 5% 3%
Allowance of risk of rental loss
min 0% 3% 5% 5% Implied in yield
≥ €4/m² max
Modernisation risk min
Property specific
Property specific Property specific Implied in yield
0%
max 1%
Useful life (in years) min 20 40 20 20
50 15
max 30 40 30 30
Property yield min 7.25% 9% 11% 6% 6%
max 8% 9.5% 13% 8% 8%
Capitalisation rate min 12.5 12% 7% 6.5%
max 13.7 14% 10% 9%
Statistics (standard parameters)
Site area min 1,000m² 4,000m² 2,000m² >1,000m²
5000m² max 5,000m² 8,000m² 4,000m²
000
No. of parking spaces required
min No info Up to 600
Guideline: 1 space for
15-20m² of sales area
20 80
max 100
Proportion of value attrib. to the site
min 10% 10% 15% ca. 25%
max 25% 30% 35%
Property size (lettable area)
min 500m² 1,000m² 1,000m² 300m² 1600m² ideally
max 2,500m² 2,500m² 2,500m² 2,200m²
No. of storeys min
One storey One storey Single storey Single-storey Ground floor only max
Construction ratio usable area/GFA
min ~90% 95% 90%
80% 98% max 90%
Ratio sales area/usable area
min 65% 75% 70% 70% 80%
max 80% 80% 80% 85%
Fitout specification
Basic Basic to average Basic Minimal; painted
block walls
Building costs (excl. site improvements)
min €400/m² GFA €300/m² GFA €700/m² GFA €660/m² GFA
max €500/m² GFA €500/m² GFA €900/m² GFA €840/m² GFA
Ancillary building costs min 8% 10% 8%
10% max 12% 15% 12%
Standard market rent p.m.
min €5/m² €7/m² €5/m² €8/m² €12.5/m²
max €8/m² €12/m² €10/m² €12/m² €21.5/m²
Gross income multiplier
min n/a
n/a
8-times
max 12-times
Net Initial Yield min 7.25 9% 7% 6% 6%
max 8% 9.5% 10% 8% 9%
Turnover per m² sales area p.a.
min n/a
n/a
€2,000
max €8,000
Rent to sales ratio min
0% Data n/a, but sales appr.
30% less than in EU 4%
max 6%
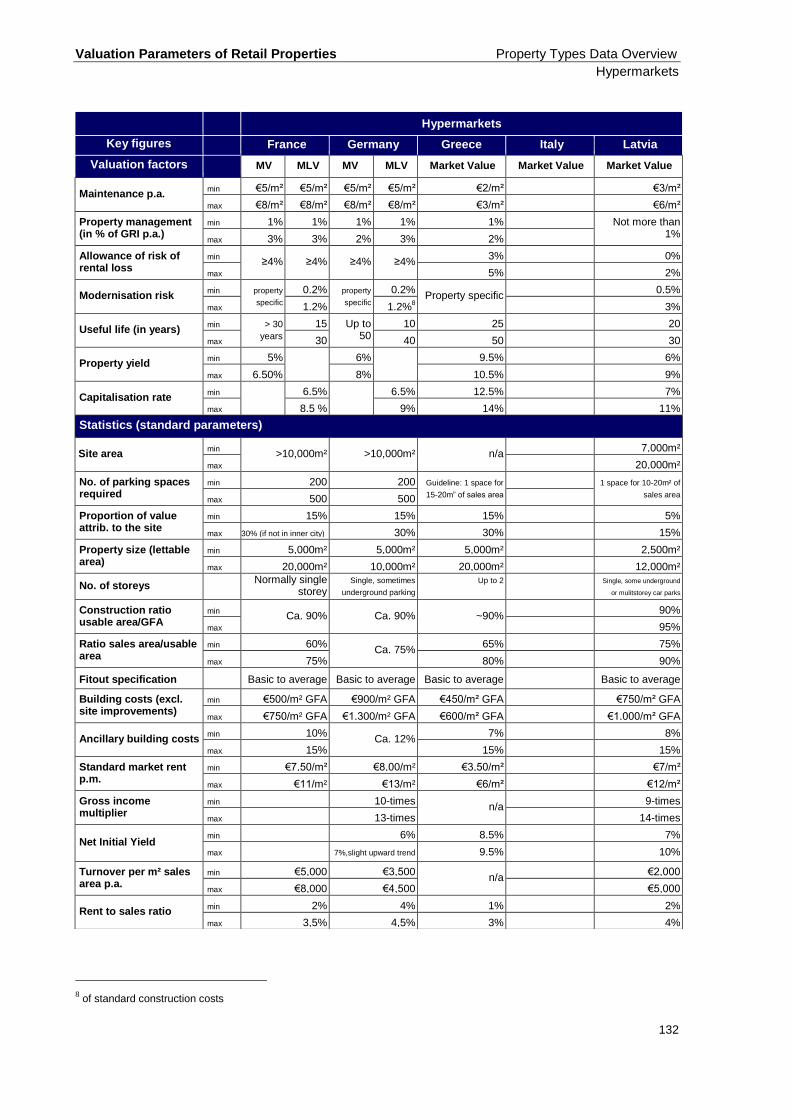
Valuation Parameters of Retail Properties Property Types Data Overview
Hypermarkets
132
8 of standard construction costs
Hypermarkets
Key figures France Germany Greece Italy Latvia
Valuation factors MV MLV MV MLV Market Value Market Value Market Value
Maintenance p.a. min €5/m² €5/m² €5/m² €5/m² €2/m² €3/m²
max €8/m² €8/m² €8/m² €8/m² €3/m² €6/m²
Property management (in % of GRI p.a.)
min 1% 1% 1% 1% 1% Not more than 1%
max 3% 3% 2% 3% 2%
Allowance of risk of rental loss
min ≥4% ≥4% ≥4% ≥4%
3% 0%
max 5% 2%
Modernisation risk min property
specific 0.2% property
specific 0.2%
Property specific 0.5%
max 1.2% 1.2%8 3%
Useful life (in years) min > 30
years 15 Up to
50 10 25 20
max 30 40 50 30
Property yield min 5%
6%
9.5% 6%
max 6.50% (prime
)
8% 10.5% 9%
Capitalisation rate min
6.5%
6.5% 12.5% 7%
max 8.5 % 9% 14% 11%
Statistics (standard parameters)
Site area min
>10,000m² >10,000m² n/a 7,000m²
max 20,000m²
No. of parking spaces required
min 200 200 Guideline: 1 space for
15-20m” of sales area 1 space for 10-20m² of
sales area max 500 500
Proportion of value attrib. to the site
min 15% 15% 15% 5%
max 30% (if not in inner city) 30% 30% 15%
Property size (lettable area)
min 5,000m² 5,000m² 5,000m² 2,500m²
max 20,000m² 10,000m² 20,000m² 12,000m²
No. of storeys Normally single
storey Single, sometimes
underground parking
Up to 2
Single, some underground
or mulitstorey car parks
Construction ratio usable area/GFA
min Ca. 90% Ca. 90% ~90%
90%
max 95%
Ratio sales area/usable area
min 60% Ca. 75%
65% 75%
max 75% 80% 90%
Fitout specification Basic to average Basic to average Basic to average Basic to average
Building costs (excl. site improvements)
min €500/m² GFA €900/m² GFA €450/m² GFA €750/m² GFA
max €750/m² GFA €1,300/m² GFA €600/m² GFA €1,000/m² GFA
Ancillary building costs min 10%
Ca. 12% 7% 8%
max 15% 15% 15%
Standard market rent p.m.
min €7,50/m² €8,00/m² €3,50/m² €7/m²
max €11/m² €13/m² €6/m² €12/m²
Gross income multiplier
min 10-times n/a
9-times
max 13-times 14-times
Net Initial Yield min 6% 8.5% 7%
max 7%,slight upward trend 9.5% 10%
Turnover per m² sales area p.a.
min €5,000 €3,500 n/a
€2,000
max €8,000 €4,500 €5,000
Rent to sales ratio min 2% 4% 1% 2%
max 3,5% 4,5% 3% 4%

Valuation Parameters of Retail Properties Property Types Data Overview
Hypermarkets
133
Hypermarkets
Key figures Poland Romania Serbia Spain UK
Valuation factors Market Value Market Value Market Value Market Value MV MLV
Maintenance p.a. min €1/m³ €1/m³ €4/m²
max €2/m³ €3/m³ €8/m²
Property management (in % of GRI p.a.)
min Ca. 2% Ca. 1%
1% 3%
max 2% 5%
Allowance of risk of rental loss
min 0%
0% 5% 5%
max 1%
Modernisation risk min
Property specific
Property specific Property specific
max
Useful life (in years) min 20
40 20 20
max 30 40 30
Property yield min 7.5% 8% 11% 7%
max 8% 8.25% 13% 9%
Capitalisation rate min 12.5% 12% 7%
max 13.3% 14% 10%
Statistics (standard parameters)
Site area min 5,000m² 20,000m² 8,000m² >10,000m²
max 20,000m² 60,000m² 20,000m²
No. of parking spaces required
min 150 1,000 Guideline: 1 space for
10-20m² of sales area
500
max 700 1,500 1.000
Proportion of value attrib. to the site
min 10% 10% 15%
max 20% 30% 30%
Property size (lettable area)
min 2,500m² 5,000m² 4,000m² 5000m²
max 10,000m² 15,000m² 10,000m² 12,000m²
No. of storeys min
1 One storey Single storey 1-3 storeys + under-
ground parking
max
Construction ratio usable area/GFA
min ~90% 98% 90%
80%
max 90%
Ratio sales area/usable area
min 65% 70% 70% 60%
max 80% 80% 80% 75%
Fitout specification
basic Basic to average Basic to average
Building costs (excl. site improvements)
min €400/m² GFA €400/m² GFA €700/m² GFA
max €500/m² GFA €700/m² GFA €900/m² GFA
Ancillary building costs min 8% 8% 10% 8%
max 12% 10% 15% 12%
Standard market rent p.m.
min €5/m² €5/m² €6/m² €8/m²
max €8/m² €10/m² €11/m² €12/m²
Gross income multiplier
min n/a
n/a
8-times
max 12-times
Net Initial Yield min 7.5% 8% 7% 6%
max 8% 8.25% 10% 8%
Turnover per m² sales area p.a.
min n/a
n/a
€5,000
max €7,000
Rent to sales ratio min
0% Data n/a, but sales appr.
30% less than in EU 5%
max 7%

Valuation Parameters of Retail Properties Property Types Data Overview
DIY Stores
134
9 of standard construction costs 10 of standard construction costs
DIY Stores
Key figures France Germany Greece Italy Latvia
Valuation factors MV MLV MV MLV Market Value Market Value Market Value
Maintenance p.a. min €5/m² €5/m² €3/m² €5/m²
max €8/m² €8/m² €8/m² €8/m²
Property management (in % of GRI p.a.)
min 1% 1% 1% 1%
max 3% 3% 2% 3%
Allowance of risk of rental loss
min ≥4% ≥4% ≥4% ≥4%
max
Modernisation risk min Property
specific 0.2% Property
specific 0.2%
max 1.2%9 1.2%
10
Useful life min Up to
50 10
max 30
Property yield min 5,75% 6%
max 6.25% (prime)
8.5%
Capitalisation rate min 6.5% 6.5%
max 8.5% 8.5%
Statistics (standard parameters)
Site area min 5,000m² 10,000m²
max 50,000m² 50,000m²
No. of parking spaces required
min 100 200
max 400 400
Proportion of value attrib. to the site
min 15% 10%
max 30% 35%
Property size (lettable area)
min 1,000m² 3,500m²
max 20,000m² 20,000m²
No. of storeys Single storey Single-storey
Construction ratio usable area/GFA
min Ca. 95% Ca. 95%
max
Ratio sales area/usable area
min 80% Ca. 90%
max 90%
Fitout specification
Basic Basic
Building costs (excl. site improvements)
min €500/m² GFA €550/m² GFA
max €700/m² GFA €800/m² GFA
Ancillary building costs min 10%
Ca. 10%
max 15%
Standard market rent p.m.
min €6/m² €5/m²
max €15/m² €12/m² (normally <
€10/m²)
Gross income multiplier
min 9-times
max 13-times
Net Initial Yield min 5.75% 6.5%
max 6.25% (prime) 8%,slight upward trend
Turnover per m² sales area p.a.
min €1,200 €800
max €3,500 €2,200
Rent to sales ratio min 4,5% 5,5%
max 7% 7,5%

Valuation Parameters of Retail Properties Property Types Data Overview
DIY Stores
135
DIY Stores
Key figures Poland Romania Serbia Spain UK
Valuation factors Market Value Market Value Market Value Market Value MV MLV
Maintenance p.a. min €1/m² €1/m²
max €2/m² €3/m²
Property management (in % of GRI p.a.)
min 1% Ca. 1% 1%
max 2% Ca. 2% 2%
Allowance of risk of rental loss
min
0% 1% 5%
max
Modernisation risk min
Property specific
Property specific
max
Useful life (in years) min 20
40 40
max 30 60
Property yield min 7.5% 8% 11%
max 8.5% 8.5% 13%
Capitalisation rate min 11.7% 12%
max 13% 14%
Statistics (standard parameters)
Site area min 5,000m² 20,000m² 4,000m²
max 40,000m² 40,000m² 20,000m²
No. of parking spaces required
min 150 Up to 1,000
Guideline: 1 space for
10-20m² of sales area
max 900
Proportion of value attrib. to the site
min 10% 10%
max 25% 30%
Property size (lettable area)
min 2,500m² 6,000m² 2,000m²
max 20,000m² 12,000m² 10,000m²
No. of storeys min
1 One storey Mostly single
storey
max
Construction ratio usable area/GFA
min ~95% 98% 90%
max
Ratio sales area/usable area
min 85% 80% 70%
max 95% 85% 80%
Fitout specification
basic Basic to average
Building costs (excl. site improvements)
min €350/m² GFA €400/m² GFA
max €400/m² GFA €600/m² GFA
Ancillary building costs min 8% 10%
max 12% 15%
Standard market rent p.m.
min €6/m² €7.5/m² €4/m²
max €12/m² €9.5/m² €8/m²
Gross income multiplier
min n/a
n/a
max
Net Initial Yield min 7.5% 8% 7%
max 8.5% 8.5% 10%
Turnover per m² sales area p.a.
min n/a
n/a
max
Rent to sales ratio min
0% Data n/a, but sales appr.
30% less than in EU
max

Valuation Parameters of Retail Properties Property Types Data Overview
Shopping Centres
136
Shopping Centres
Key figures France Germany Greece Italy Latvia
Valuation factors MV MLV MV MLV Market Value Market Value Market Value
Maintenance p.a. min €7.5/m² €7.5/m² €9/m² €9/m² €4/m² €7/m² €4/m²
max €15/m² €15/m² €14/m² €14/m² €6/m² €12/m² €8/m²
Property management (in % of GRI p.a.)
min 2% 2% 1% 2% 2% 3% 3%
max 3% 3% 3% 3% 4% 5% 10%
Allowance of risk of rental loss
min ≥4% ≥4% ≥4% ≥4% ≥5% 2% 4%
max 5% 10%
Modernisation risk min
Property
specific
0.5% Property
specific
0.5% Property specific Property specific
depends on date of
upgrade, currently 1-2% of
construction costs max 3% 3%
Useful life
min Up to
50
15 Up to
50
15 30 >20% (shopping centre
industry is just 15 years
old) max 50 50 50 40
Property yield min 4.5% 5.5% 9% 5% 6%
max 4.75% 8% 10% 8% 10%
Capitalisation rate min 6.5% 6.5% 12% 6% 7%
max 9% 9% 15% 10% 12%
Statistics (standard parameters)
Site area
min 10,000 6,000m² 7,500m² 8,000m²
max 200,000 20,000m² 50,000m²
50,000m² (sometimes
more 150,000m²
No. of parking spaces required
min 400 400 Guideline: 1 space for
15-20m² of sales area Depending on loca-
tion, >500 spaces
200 (downtown)
max 7,000 1,500 1.200
Proportion of value attrib. to the site
min 30% 30% 20% 10% 10%
max 50% 50% 30% 20% 35%
Property size (lettable area)
min 10,000m² 10,000m² 5,000m² 5,000m²
max 100,000m² (larger
in individual cases) 30,000m² 20,000m² 20,000m² (sometimes
more) 62,000m²
No. of storeys Mostly multi-storey,
standard 1–2 retail floors Mostly single-storey,
standard 2-3 retail floors
Multi-storey, 2-3 retail
floors
Mostly multi stores,
standard 2 retail floors
Standard: 2 storeys;
except. with up to 7 floors
Construction ratio usable area/GFA
min 60%
Ca. 65% n/a
60% 75%
max 75% (subject to the
size of the mall) 85% 85%
Ratio sales area/usable area
min 60% Ca. 80% ca 70%
80% 80%
max 80% 85% 85%
Fitout specification Average to high Average to high Average to high Basic to average Average to high
Building costs (excl. site improvements)
min €1,000/m² GFA €1,300/m² GFA €1,000/m² GFA €1,000/m² GFA €1,000/m² GFA
max €2,500/m² GFA €2,800/m² GFA €1,500/m² GFA €1,500/m² GFA €2,100/m² GFA
Ancillary building costs min 15%
ca 15% 7% 10% 10%
max 20% 15% 20% 20%
Standard market rent p.m.
min €20/m² €20/m² €7/m² €10/m² €8/m²
max €35/m² €35/m² €50/m² €20/m² €40/m²
Gross income multiplier
min 16-times 13-times 10-times 8-times 10-times
max 25-times 19-times 12-times 15-times 18-times
Net Initial Yield min 4.50% 5,5% 8,5% 6% 5%
max 4.75% 7% (stable trend) 9.5% 7,5% (upward trend) trend
8%
Turnover per m² sales area p.a.
min €4,000 €2,500 n/a
€2,000 €1,000
max €7,000 €5,000 €4,000 €2,500
Rent to sales ratio min 6% 7%
- 6% 5%
max 12% 9% 8% 15%

Valuation Parameters of Retail Properties Property Types Data Overview
Shopping Centres
137
Shopping Centres
Key figures Poland Romania Serbia UK
Valuation factors Market Value Market Value Market Value Market Value MLV
Maintenance p.a. min €3/m² €5/m² €3/m² 2% of ERV Min €5/m², typi-
cally ≥ €7.5/m² max €6.5/m² €10/m² €5/m² 5%of ERV
Property management (in % of GRI p.a.)
min 2% Ca. 1%
2% Recovered through
service charge
1%
max 3% 4% 3%
Allowance of risk of rental loss
min 1% 5% Implied in yield
≥4%
max 5%
Modernisation risk min
Property specific
Property specific Property specific 0.2%
max 2,2% (of standard
construction costs)
Useful life (in years) min
Up to 50 40 40 20 15
max 60 30 50
Property yield min 6% 8% 10% 5,25%
max 8.5% 8.25% 12% 10%
Capitalisation rate min 11.7 11% 5.5% 6.5%
max 16.6 13% 12% 9.0%
Statistics (standard parameters)
Site area min 2,500m² 40,000m² 8,000m² 6,000m²
max 25,000m² 100,000m² 25,000m² 20,000m²
No. of parking spaces required
min 150 1,000 Guideline: 1 space for
10-20m² of sales area
400
max 3,000 2,000 1.500
Proportion of value attrib. to the site
min 15% 10% 30%
max 30% 30% 50%
Property size (lettable area)
min Above 5,000m² 5,000m² 7,000m² 10,000m²
max 100,000m² 80,000m² 50,000m² 30,000m², larger in individual cases
No. of storeys min Min 10, standard
2-3 retail stores 2 Multi-storey, 2 to
3 retail floors 2-4 retail plus ancillary, servic-
ing, parking, other max 5
Construction ratio usable area/GFA
min 65% 80% 60% 60%
max 75% 85% 70% 75%, subject to size of the mall
Ratio sales area/usable area
min 65% 65% 65% 65%
max 75% 70% 85% 85%
Fitout specification Average to high
quality Average to high Average to high
Building costs (excl. site improvements)
min €600/m² GFA €700/m² GFA 802 (Lower Quartile)
max €1,200/m² GFA €900/m² GFA 1.550 (Upper Quartile)
Ancillary building costs min 8% 8% 10%
15% max 12% 10% 20%
Standard market rent p.m.
min €30/m² in Warsaw
€20/m² €8/m² Belgrade: €25/m² €80/m²
max €90/m² €50/m² €24/m² Other cities: €12-18/m² €300/m²
Gross income multiplier
min n/a
n/a n/a
max
Net Initial Yield min 6% 8% 6% 5.25%
max 8.5% 8.25% 9% 12%, with a stable trende
Turnover per m² sales area p.a.
min n/a
n/a n/a
max
Rent to sales ratio min 5% Data n/a, but appr.
20% less than in EU
6%
max 10% 12%

Valuation Parameters of Retail Properties Property Types Data Overview
Shopping Centres
138