Embed Size (px)
Citation preview

VALUATION:PACKET2RELATIVEVALUATION,ASSET-BASEDVALUATIONANDPRIVATECOMPANYVALUATIONAswathDamodaranUpdated:September20169/2016
Aswath Damodaran 1

2
Test1:Areyoupricingorvaluing?
Aswath Damodaran
2

3
Test2:Areyoupricingorvaluing?
Aswath Damodaran
3

4
TheEssenceofRelativeValuation(Pricing)
¨ Inrelativevaluation,thevalueofanassetiscomparedtothevaluesassessedbythemarketforsimilarorcomparableassets.
¨ Todorelativevaluationthen,¤ weneedtoidentifycomparableassetsandobtainmarketvaluesfortheseassets
¤ convertthesemarketvaluesintostandardizedvalues,sincetheabsolutepricescannotbecomparedThisprocessofstandardizingcreatespricemultiples.
¤ comparethestandardizedvalueormultiplefortheassetbeinganalyzedtothestandardizedvaluesforcomparableasset,controllingforanydifferencesbetweenthefirmsthatmightaffectthemultiple,tojudgewhethertheassetisunderorovervalued
Aswath Damodaran
4

5
Relativevaluationispervasive…
¨ Mostassetvaluationsarerelative.¨ MostequityvaluationsonWallStreetarerelativevaluations.
¤ Almost85%ofequityresearchreportsarebaseduponamultipleandcomparables.
¤ Morethan50%ofallacquisitionvaluationsarebaseduponmultiples¤ Rulesofthumbbasedonmultiplesarenotonlycommonbutareoften
thebasisforfinalvaluationjudgments.¨ Whiletherearemorediscountedcashflowvaluationsin
consultingandcorporatefinance,theyareoftenrelativevaluationsmasqueradingasdiscountedcashflowvaluations.¤ Theobjectiveinmanydiscountedcashflowvaluationsistobackintoa
numberthathasbeenobtainedbyusingamultiple.¤ Theterminalvalueinasignificantnumberofdiscountedcashflow
valuationsisestimatedusingamultiple.
Aswath Damodaran
5

6
Whyrelativevaluation?
“IfyouthinkI’mcrazy,youshouldseetheguywholivesacrossthehall”
JerrySeinfeldtalkingaboutKramerinaSeinfeldepisode
“A little inaccuracy sometimes saves tons of explanation”H.H. Munro
“ If you are going to screw up, make sure that you have lots of company”
Ex-portfolio manager
Aswath Damodaran
6

7
TheMarketImperative….
¨ Relativevaluationismuchmorelikelytoreflectmarketperceptionsandmoodsthandiscountedcashflowvaluation.Thiscanbeanadvantagewhenitisimportantthatthepricereflecttheseperceptionsasisthecasewhen¤ theobjectiveistosellasecurityatthatpricetoday(asinthecaseofan
IPO)¤ investingon“momentum” basedstrategies
¨ Withrelativevaluation,therewillalwaysbeasignificantproportionofsecuritiesthatareundervaluedandovervalued.
¨ Sinceportfoliomanagersarejudgedbaseduponhowtheyperformonarelativebasis(tothemarketandothermoneymanagers),relativevaluationismoretailoredtotheirneeds
¨ Relativevaluationgenerallyrequireslessinformationthandiscountedcashflowvaluation(especiallywhenmultiplesareusedasscreens)
Aswath Damodaran
7

8
Multiplesarejuststandardizedestimatesofprice…
Numerator = What you are paying for the asset
Denominator = What you are getting in return
Market value of equity Market value for the firmFirm value = Market value of equity
+ Market value of debt
Market value of operating assets of firmEnterprise value (EV) = Market value of equity
+ Market value of debt- Cash
Revenuesa. Accounting revenuesb. Drivers- # Customers- # Subscribers= # units
Earningsa. To Equity investors - Net Income - Earnings per shareb. To Firm - Operating income (EBIT)
Book Valuea. Equity= BV of equityb. Firm= BV of debt + BV of equityc. Invested Capital= BV of equity + BV of debt - Cash
Multiple =
Cash flowa. To Equity- Net Income + Depreciation- Free CF to Equityb. To Firm- EBIT + DA (EBITDA)- Free CF to Firm
Aswath Damodaran
8

9
TheFourStepstoDeconstructingMultiples
¨ Definethemultiple¤ Inuse,thesamemultiplecanbedefinedindifferentwaysbydifferent
users.Whencomparingandusingmultiples,estimatedbysomeoneelse,itiscriticalthatweunderstandhowthemultipleshavebeenestimated
¨ Describethemultiple¤ Toomanypeoplewhouseamultiplehavenoideawhatitscrosssectional
distributionis.Ifyoudonotknowwhatthecrosssectionaldistributionofamultipleis,itisdifficulttolookatanumberandpassjudgmentonwhetheritistoohighorlow.
¨ Analyzethemultiple¤ Itiscriticalthatweunderstandthefundamentalsthatdriveeachmultiple,
andthenatureoftherelationshipbetweenthemultipleandeachvariable.¨ Applythemultiple
¤ Definingthecomparableuniverseandcontrollingfordifferencesisfarmoredifficultinpracticethanitisintheory.
Aswath Damodaran
9

10
DefinitionalTests
¨ Isthemultipleconsistentlydefined?¤ Proposition1:Boththevalue(thenumerator)andthestandardizingvariable(thedenominator)shouldbetothesameclaimholdersinthefirm.Inotherwords,thevalueofequityshouldbedividedbyequityearningsorequitybookvalue,andfirmvalueshouldbedividedbyfirmearningsorbookvalue.
¨ Isthemultipleuniformlyestimated?¤ Thevariablesusedindefiningthemultipleshouldbeestimateduniformlyacrossassetsinthe“comparablefirm” list.
¤ Ifearnings-basedmultiplesareused,theaccountingrulestomeasureearningsshouldbeappliedconsistentlyacrossassets.Thesameruleapplieswithbook-valuebasedmultiples.
Aswath Damodaran
10

11
Example1:PriceEarningsRatio:Definition
PE=MarketPriceperShare/EarningsperShare¨ ThereareanumberofvariantsonthebasicPEratioinuse.Theyarebaseduponhowthepriceandtheearningsaredefined.Price: isusuallythecurrentprice
issometimestheaveragepricefortheyearEPS: EPSinmostrecentfinancialyear
EPSintrailing12monthsForecastedearningspersharenextyearForecastedearningspershareinfutureyear
Aswath Damodaran
11

12
Example2:StayingonPEratios
¨ AssumingthatyouarecomparingthePEratiosacrosstechnologycompanies,manyofwhichhaveoptionsoutstanding.WhatmeasureofPEratiowouldyieldthemostconsistentcomparisons?a. Price/PrimaryEPS(actualshares,nooptions)b. Price/FullyDilutedEPS(actualshares+alloptions)c. Price/PartiallyDilutedEPS(countingonlyin-the-money
options)d. Other
Aswath Damodaran
12

13
Example3:EnterpriseValue/EBITDAMultiple
¨ TheenterprisevaluetoEBITDAmultipleisobtainedbynettingcashoutagainstdebttoarriveatenterprisevalueanddividingbyEBITDA.
1. Whydowenetoutcashfromfirmvalue?2. Whathappensifafirmhascrossholdingswhichare
categorizedas:¤ Minorityinterests?¤ Majorityactiveinterests?
Enterprise ValueEBITDA
=Market Value of Equity + Market Value of Debt - Cash
Earnings before Interest, Taxes and Depreciation
Aswath Damodaran
13

14
Example4:AHousingPriceMultiple
Thebubblesandbustsinhousingpriceshasledinvestorstosearchforamultiplethattheycanusetodeterminewhenhousingpricesaregettingoutofline.Onemeasurethathasacquiredadherentsistheratioofhousingpricetoannualnetrentalincome(forrentingoutthesamehouse).Assumethatyoudecidetocomputethisratioandcompareittothemultipleatwhichstocksaretrading.Whichvaluationratiowouldbetheonethatcorrespondstothehouseprice/rentratio?a.PriceEarningsRatiob.EVtoSalesc.EVtoEBITDAd.EVtoEBIT
Aswath Damodaran
14

15
DescriptiveTests
¨ Whatistheaverageandstandarddeviationforthismultiple,acrosstheuniverse(market)?
¨ Whatisthemedianforthismultiple?¤ Themedianforthismultipleisoftenamorereliablecomparisonpoint.
¨ Howlargearetheoutlierstothedistribution,andhowdowedealwiththeoutliers?¤ Throwingouttheoutliersmayseemlikeanobvioussolution,butifthe
outliersalllieononesideofthedistribution(theyusuallyarelargepositivenumbers),thiscanleadtoabiasedestimate.
¨ Aretherecaseswherethemultiplecannotbeestimated?Willignoringthesecasesleadtoabiasedestimateofthemultiple?
¨ Howhasthismultiplechangedovertime?
Aswath Damodaran
15

16
1.Multipleshaveskeweddistributions…
Aswath Damodaran
16
0.
100.
200.
300.
400.
500.
600.
700.
0.01To4 4To8 8To12 12To16 16To20 20To24 24To28 28To32 32To36 36To40 40To50 50To75 75To100 100andover
PERatios:UScompaniesinJanuary2016
Current Trailing Forward

17
2.Makingstatistics“dicey”
Aswath Damodaran
17
CurrentPE TrailingPE ForwardPENumberoffirms 7480 7480 7480NumberwithPE 3,344. 3,223. 2,647.Average 59.42 46.04 29.63Median 18.53 18.29 16.98Minimum 0.11 0.28 0.15Maximum 32,269.00 6,900.00 2,748.00Standarddeviation 777.02 256.06 81.27Standarderror 13.44 4.51 1.58Skewness 37.27 19.9 18.7425thpercentile 11.88 12.32 13.175thpercentile 30.25 29.52 24.28
US firms in January 2016

18
3.Marketshavealotincommon :ComparingGlobalPEs
Aswath Damodaran
18
0.00%
5.00%
10.00%
15.00%
20.00%
25.00%
US Europe Japan EmergingMarkets Aus,NZ&Canada Global
TrailingPERatiosbyRegion
<4
4To8
8To12
12To16
16To20
20To24
24To28
28To32
32To36
36To40
40To50
50To75
75To100
100andover
Average 25thperc. Median 75thperc.UnitedStates 46.04 12.32 18.29 29.52Europe 57.57 10.27 16.69 26.76Japan 29.83 9.96 15.08 24.93EmergingMarkets 91.08 9.57 16.77 39.69Aus,NZ&Canada 67.42 8.87 15.69 27.52Global 71.16 10.00 16.69 32.07

19
3a.Andthedifferencesaresometimesrevealing…PricetoBookRatiosacrossglobe– January2013
Aswath Damodaran
19

20
4.Simplisticrulesalmostalwaysbreakdown…6timesEBITDAwasnotcheapin2010…
Aswath Damodaran
20
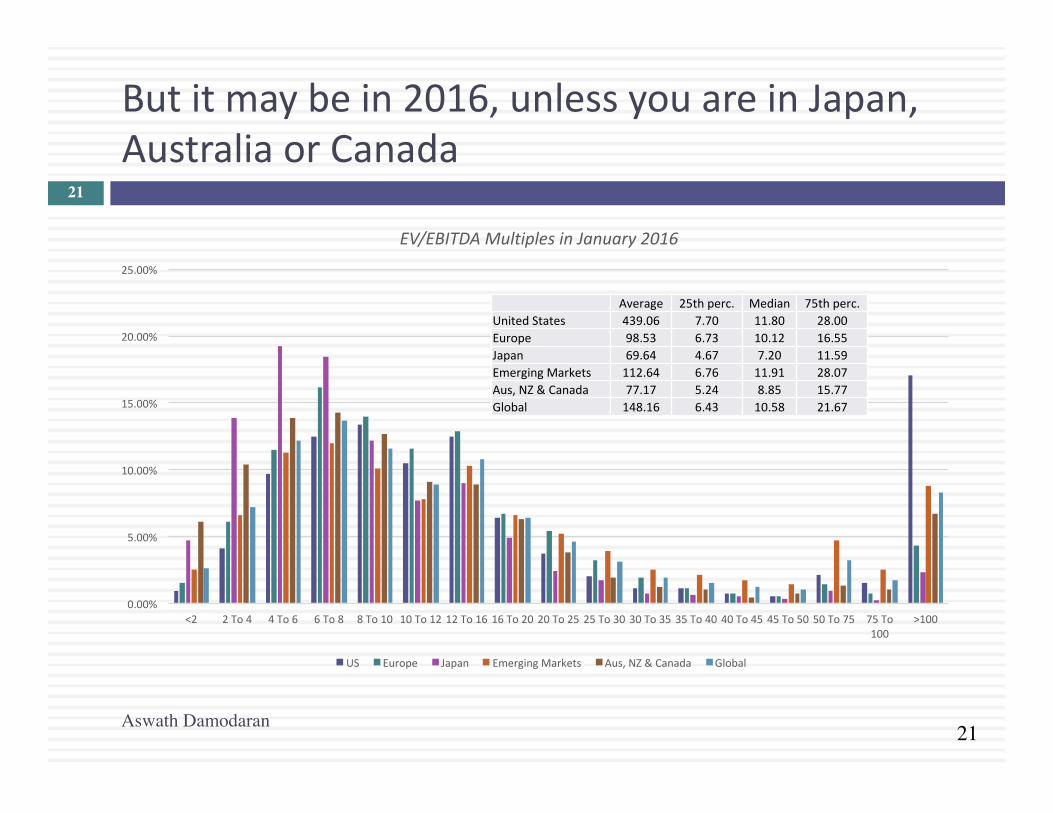
21
Butitmaybein2016,unlessyouareinJapan,AustraliaorCanada
Aswath Damodaran
21
0.00%
5.00%
10.00%
15.00%
20.00%
25.00%
<2 2To4 4To6 6To8 8To10 10To12 12To16 16To20 20To25 25To30 30To35 35To40 40To45 45To50 50To75 75To100
>100
EV/EBITDAMultiplesinJanuary2016
US Europe Japan EmergingMarkets Aus,NZ&Canada Global
Average 25thperc. Median 75thperc.UnitedStates 439.06 7.70 11.80 28.00Europe 98.53 6.73 10.12 16.55Japan 69.64 4.67 7.20 11.59EmergingMarkets 112.64 6.76 11.91 28.07Aus,NZ&Canada 77.17 5.24 8.85 15.77Global 148.16 6.43 10.58 21.67

22
AnalyticalTests
¨ Whatarethefundamentalsthatdetermineanddrivethesemultiples?¤ Proposition2:Embeddedineverymultipleareallofthevariablesthat
driveeverydiscountedcashflowvaluation- growth,riskandcashflowpatterns.
¨ Howdochangesinthesefundamentalschangethemultiple?¤ Therelationshipbetweenafundamental(likegrowth)andamultiple
(suchasPE)isalmostneverlinear.¤ Proposition3:Itisimpossibletoproperlycomparefirmsonamultiple,
ifwedonotknowhowfundamentalsandthemultiplemove.
Aswath Damodaran
22

23
ASimpleAnalyticaldevice
Aswath Damodaran
23
24
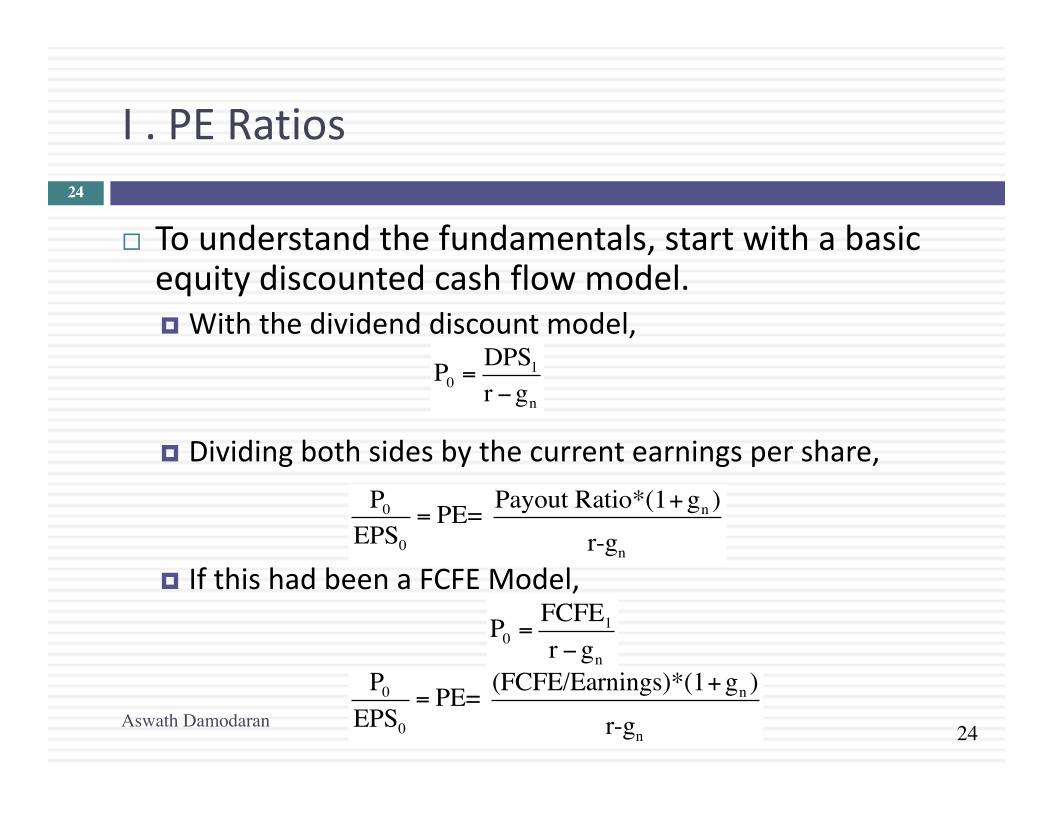
I.PERatios
¨ Tounderstandthefundamentals,startwithabasicequitydiscountedcashflowmodel.¤ Withthedividenddiscountmodel,
¤ Dividingbothsidesbythecurrentearningspershare,
¤ IfthishadbeenaFCFEModel,
P0 =DPS1r −gn
P0
EPS0
= PE= Payout Ratio*(1+gn )
r-gn
P0 =FCFE1r −gn
P0
EPS0
= PE= (FCFE/Earnings)*(1+gn )
r-gnAswath Damodaran
24

25
UsingtheFundamentalModeltoEstimatePEForaHighGrowthFirm
¨ Theprice-earningsratioforahighgrowthfirmcanalsoberelatedtofundamentals.Inthespecialcaseofthetwo-stagedividenddiscountmodel,thisrelationshipcanbemadeexplicitfairlysimply:
¤ Forafirmthatdoesnotpaywhatitcanaffordtoindividends,substituteFCFE/Earningsforthepayoutratio.
¨ Dividingbothsidesbytheearningspershare:
P0 =EPS0*Payout Ratio*(1+g)* 1− (1+g)n
(1+r)n
"
#$
%
&'
r-g+ EPS0*Payout Ration*(1+g)n*(1+gn )
(r-gn )(1+r)n
P0EPS0
=Payout Ratio * (1 + g) * 1 − (1 + g)n
(1+ r)n"
# $ %
& '
r - g+
Payout Ratio n *(1+ g)n * (1 + gn )(r - gn )(1+ r)n
Aswath Damodaran
25

26
ASimpleExample
¨ AssumethatyouhavebeenaskedtoestimatethePEratioforafirmwhichhasthefollowingcharacteristics:
Variable HighGrowthPhase StableGrowthPhaseExpectedGrowthRate 25% 8%PayoutRatio 20% 50%Beta 1.00 1.00Numberofyears 5years Foreverafteryear5Riskfree rate=T.Bond Rate=6%Requiredrateofreturn=6%+1(5.5%)=11.5%
Aswath Damodaran
26
P0
EPS0
=.20*(1.25)* 1− (1.25)5
(1.115)5
"
#$
%
&'
.115-.25+ .50*(1.25)5*(1.08)
(.115-.08)(1.115)5 = 28.75

27
a.PEandGrowth:Firmgrowsatx%for5years,8%thereafter
PE Ratios and Expected Growth: Interest Rate Scenarios
0
20
40
60
80
100
120
140
160
180
5% 10% 15% 20% 25% 30% 35% 40% 45% 50%
Expected Growth Rate
PE
Rati
o r=4%
r=6%
r=8%
r=10%
Aswath Damodaran
27

28
b.PEandRisk:AFollowupExample
PE Ratios and Beta: Growth Scenarios
0
5
10
15
20
25
30
35
40
45
50
0.75 1.00 1.25 1.50 1.75 2.00
Beta
PE
Rati
o g=25%
g=20%
g=15%
g=8%
Aswath Damodaran
28

29
Example1:ComparingPEratiosacrossEmergingMarkets- March2014(pre- Ukraine)
Aswath Damodaran
29
Russia looks really cheap, right?

30
Example2:AnOldExamplewithEmergingMarkets:June2000
Country PE Ratio Interest Rates
GDP Real Growth
Country Risk
Argentina 14 18.00% 2.50% 45Brazil 21 14.00% 4.80% 35Chile 25 9.50% 5.50% 15Hong Kong 20 8.00% 6.00% 15India 17 11.48% 4.20% 25Indonesia 15 21.00% 4.00% 50Malaysia 14 5.67% 3.00% 40Mexico 19 11.50% 5.50% 30Pakistan 14 19.00% 3.00% 45Peru 15 18.00% 4.90% 50Phillipines 15 17.00% 3.80% 45Singapore 24 6.50% 5.20% 5South Korea 21 10.00% 4.80% 25Thailand 21 12.75% 5.50% 25Turkey 12 25.00% 2.00% 35Venezuela 20 15.00% 3.50% 45
Aswath Damodaran
30

31
RegressionResults
¨ TheregressionofPEratiosonthesevariablesprovidesthefollowing–PE=16.16 - 7.94InterestRates
+154.40GrowthinGDP- 0.1116CountryRisk
RSquared=73%
Aswath Damodaran
31

32
PredictedPERatios
Country PE Ratio Interest Rates
GDP Real Growth
Country Risk
Predicted PE
Argentina 14 18.00% 2.50% 45 13.57Brazil 21 14.00% 4.80% 35 18.55Chile 25 9.50% 5.50% 15 22.22Hong Kong 20 8.00% 6.00% 15 23.11India 17 11.48% 4.20% 25 18.94Indonesia 15 21.00% 4.00% 50 15.09Malaysia 14 5.67% 3.00% 40 15.87Mexico 19 11.50% 5.50% 30 20.39Pakistan 14 19.00% 3.00% 45 14.26Peru 15 18.00% 4.90% 50 16.71Phillipines 15 17.00% 3.80% 45 15.65Singapore 24 6.50% 5.20% 5 23.11South Korea 21 10.00% 4.80% 25 19.98Thailand 21 12.75% 5.50% 25 20.85Turkey 12 25.00% 2.00% 35 13.35Venezuela 20 15.00% 3.50% 45 15.35
Aswath Damodaran
32

33
Example3:PEratiosfortheS&P500overtime
Aswath Damodaran
33
0.00
5.00
10.00
15.00
20.00
25.00
30.00
35.00
40.00
45.00
50.00
1969
1970
1971
1972
1973
1974
1975
1976
1977
1978
1979
1980
1981
1982
1983
1984
1985
1986
1987
1988
1989
1990
1991
1992
1993
1994
1995
1996
1997
1998
1999
2000
2001
2002
2003
2004
2005
2006
2007
2008
2009
2010
2011
2012
2013
2014
2015
PERatiosfortheS&P500:1969-2015
PE NormalizedPE CAPE
PE NormalizedPE CAPE1969-2015 16.06 20.70 17.081986-2015 18.52 24.00 20.341996-2015 19.61 25.61 22.292006-2015 16.90 20.88 18.45

34
Islow(high)PEcheap(expensive)?
¨ AmarketstrategistarguesthatstocksareexpensivebecausethePEratiotodayishighrelativetotheaveragePEratioacrosstime.Doyouagree?a. Yesb. No
¨ Ifyoudonotagree,whatfactorsmightexplainthehigherPEratiotoday?
¨ WouldyouresponddifferentlyifthemarketstrategisthasaNobelPrizeinEconomics?
Aswath Damodaran
34

35
E/PRatios,T.BondRatesandTermStructure
Aswath Damodaran
35
-2.00%
0.00%
2.00%
4.00%
6.00%
8.00%
10.00%
12.00%
14.00%
16.00%
1960 1962 1964 1966 1968 1970 1972 1974 1976 1978 1980 1982 1984 1986 1988 1990 1992 1994 1996 1998 2000 2002 2004 2006 2008 2010 2012 2014
EarningstoPriceversusInterestRates:S&P500
EarningsYield T.BondRate Bond-Bill

36
RegressionResults
¨ ThereisastrongpositiverelationshipbetweenE/PratiosandT.Bond rates,asevidencedbythecorrelationof0.66betweenthetwovariables.,
¨ Inaddition,thereisevidencethatthetermstructurealsoaffectsthePEratio.
¨ Inthefollowingregression,using1960-2014data,weregressE/PratiosagainstthelevelofT.Bond ratesandatermstructurevariable(T.Bond - T.Bill rate)E/P=3.51%+0.5598T.Bond Rate– 0.1374(T.Bond Rate-T.Bill Rate)
(4.93) (6.23) (-0.65)Rsquared=41.28%
¨ Goingbackto2008,thisiswhattheregressionlookedlike:E/P=2.56%+0.7044T.Bond Rate– 0.3289(T.Bond Rate-T.Bill Rate)
(4.71) (7.10) (1.46)Rsquared=50.71%TheR-squaredhasdroppedandtheT.Bond rateandthedifferentialwiththeT.Billratehavenoth lostsignificance.Howwouldyoureadthisresult?
Aswath Damodaran
36

37
II.PEGRatio
¨ PEGRatio=PEratio/ExpectedGrowthRateinEPS¤ Forconsistency,youshouldmakesurethatyourearningsgrowth
reflectstheEPSthatyouuseinyourPEratiocomputation.¤ Thegrowthratesshouldpreferablybeoverthesametimeperiod.
¨ TounderstandthefundamentalsthatdeterminePEGratios,letusreturnagaintoa2-stageequitydiscountedcashflowmodel:
¨ DividingbothsidesoftheequationbytheearningsgivesustheequationforthePEratio.Dividingitagainbytheexpectedgrowth‘g:
P0 =EPS0*Payout Ratio*(1+g)* 1− (1+g)n
(1+r)n
"
#$
%
&'
r-g+ EPS0*Payout Ration*(1+g)n*(1+gn )
(r-gn )(1+r)n
PEG=Payout Ratio*(1+g)* 1− (1+g)n
(1+r)n
"
#$
%
&'
g(r-g)+ Payout Ration*(1+g)n*(1+gn )
g(r-gn )(1+r)n
Aswath Damodaran
37

38
PEGRatiosandFundamentals
¨ Riskandpayout,whichaffectPEratios,continuetoaffectPEGratiosaswell.¤ Implication:WhencomparingPEGratiosacrosscompanies,wearemakingimplicitorexplicitassumptionsaboutthesevariables.
¨ DividingPEbyexpectedgrowthdoesnotneutralizetheeffectsofexpectedgrowth,sincetherelationshipbetweengrowthandvalueisnotlinearandfairlycomplex(evenina2-stagemodel)
Aswath Damodaran
38

39
ASimpleExample
¨ AssumethatyouhavebeenaskedtoestimatethePEGratioforafirmwhichhasthefollowingcharacteristics:
Variable HighGrowthPhase StableGrowthPhaseExpectedGrowthRate 25% 8%PayoutRatio 20% 50%Beta 1.00 1.00¨ Riskfree rate=T.Bond Rate=6%¨ Requiredrateofreturn=6%+1(5.5%)=11.5%¨ ThePEGratioforthisfirmcanbeestimatedasfollows:
PEG =0.2 * (1.25) * 1− (1.25)5
(1.115)5
"
#$
%
&'
.25(.115 - .25)+ 0.5 * (1.25)5*(1.08)
.25(.115-.08) (1.115)5 = 115 or 1.15
Aswath Damodaran
39

40
PEGRatiosandRisk
Aswath Damodaran
40

41
PEGRatiosandQualityofGrowth
Aswath Damodaran
41

42
PERatiosandExpectedGrowth
Aswath Damodaran
42

43
PEGRatiosandFundamentals:Propositions
¨ Proposition1:HighriskcompanieswilltradeatmuchlowerPEGratiosthanlowriskcompanieswiththesameexpectedgrowthrate.¤ Corollary1:ThecompanythatlooksmostundervaluedonaPEGratio
basisinasectormaybetheriskiestfirminthesector¨ Proposition2:Companiesthatcanattaingrowthmoreefficiently
byinvestinglessinbetterreturnprojectswillhavehigherPEGratiosthancompaniesthatgrowatthesameratelessefficiently.¤ Corollary2:CompaniesthatlookcheaponaPEGratiobasismaybe
companieswithhighreinvestmentratesandpoorprojectreturns.¨ Proposition3:Companieswithveryloworveryhighgrowthrates
willtendtohavehigherPEGratiosthanfirmswithaveragegrowthrates.Thisbiasisworseforlowgrowthstocks.¤ Corollary3:PEGratiosdonotneutralizethegrowtheffect.
Aswath Damodaran
43

44
III.PricetoBookRatio
¨ Goingbacktoasimpledividenddiscountmodel,
¨ Definingthereturnonequity(ROE)=EPS0/BookValueofEquity,thevalueofequitycanbewrittenas:
¨ Ifthereturnonequityisbaseduponexpectedearningsinthenexttimeperiod,thiscanbesimplifiedto,
P0 =DPS1r −gn
P0 = BV0*ROE*Payout Ratio*(1+gn )r-gn
P0
BV0
= PBV= ROE*Payout Ratio*(1+gn )r-gn
P0
BV0
= PBV= ROE*Payout Ratior-gnAswath Damodaran
44

45
PriceBookValueRatio:StableGrowthFirmAnotherPresentation
¨ Thisformulationcanbesimplifiedevenfurtherbyrelatinggrowthtothereturnonequity:
g=(1- Payoutratio)*ROE¨ SubstitutingbackintotheP/BVequation,
¨ Theprice-bookvalueratioofastablefirmisdeterminedbythedifferentialbetweenthereturnonequityandtherequiredrateofreturnonitsprojects.
¨ Buildingonthisequation,acompanythatisexpectedtogenerateaROEhigher(lowerthan,equalto)itscostofequityshouldtradeatapricetobookratiohigher(lessthan,equalto)one.
P0
BV0
= PBV= ROE - gn
r-gn
Aswath Damodaran
45

46
NowchangingtoanEnterprisevaluemultipleEV/BookCapital
¨ Toseethedeterminantsofthevalue/bookratio,considerthesimplefreecashflowtothefirmmodel:
¨ Dividingbothsidesbythebookvalue,weget:
¨ Ifwereplace,FCFF=EBIT(1-t)- (g/ROC)EBIT(1-t),weget:
V0 = FCFF1
WACC - g
V0
BV= FCFF1/BV
WACC-g
V0
BV= ROC - g
WACC-g
Aswath Damodaran
46

47
IV.EVtoEBITDA- Determinants
¨ Thevalueoftheoperatingassetsofafirmcanbewrittenas:
¨ Nowthevalueofthefirmcanberewrittenas
¨ DividingbothsidesoftheequationbyEBITDA,
¨ ThedeterminantsofEV/EBITDAare:¤ Thecostofcapital¤ Expectedgrowthrate¤ Taxrate¤ Reinvestmentrate(orROC)
€
EV0 = FCFF1 WACC - g
€
EV = EBITDA (1- t) + Depr (t) - Cex - Δ Working Capital
WACC - g
€
EVEBITDA
= (1- t)
WACC - g +
Depr (t)/EBITDAWACC - g
- CEx/EBITDA
WACC - g -
Δ Working Capital/EBITDAWACC - g
Aswath Damodaran
47

48
ASimpleExample
¨ Considerafirmwiththefollowingcharacteristics:¤ TaxRate=36%¤ CapitalExpenditures/EBITDA=30%¤ Depreciation/EBITDA=20%¤ CostofCapital=10%¤ Thefirmhasnoworkingcapitalrequirements¤ Thefirmisinstablegrowthandisexpectedtogrow5%ayearforever.
¨ Inthiscase,theValue/EBITDAmultipleforthisfirmcanbeestimatedasfollows:
ValueEBITDA
= (1- .36) .10 -.05
+ (0.2)(.36).10 -.05
- 0.3.10 - .05
- 0.10 - .05
= 8.24
Aswath Damodaran
48
49
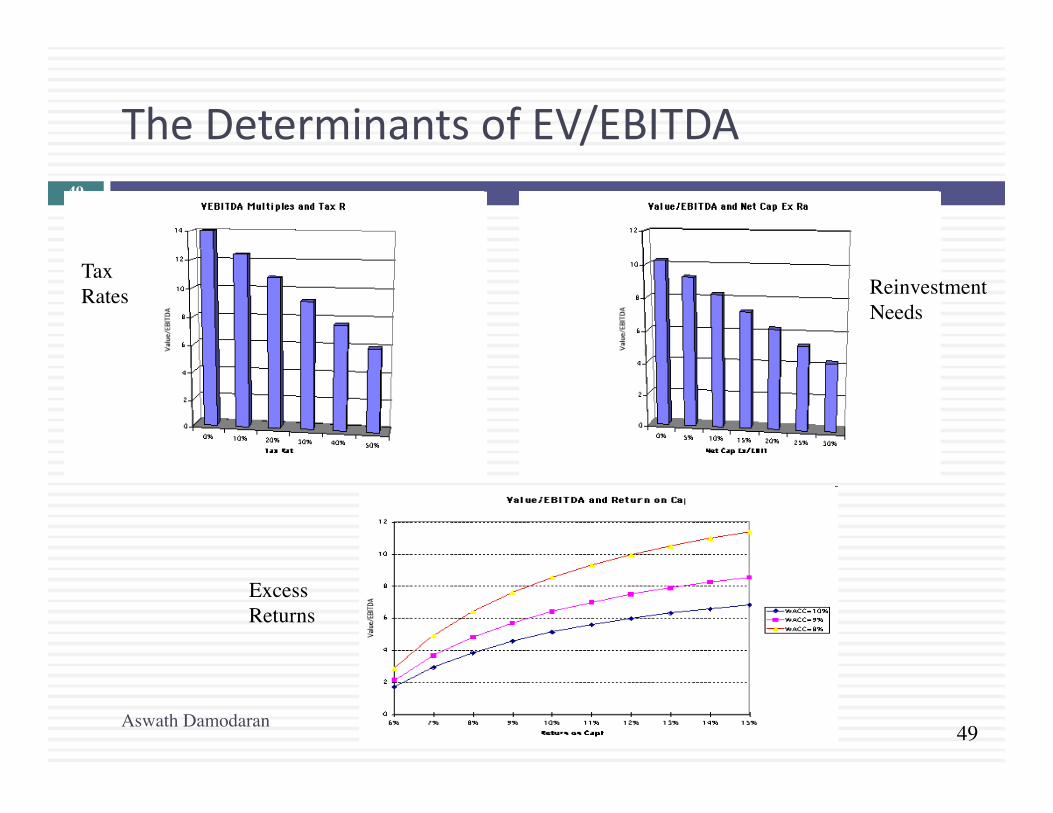
TheDeterminantsofEV/EBITDA
¨TaxRates Reinvestment
Needs
ExcessReturns
Aswath Damodaran
49

50
V.EV/SalesRatio
¨ Ifpre-taxoperatingmarginsareused,theappropriatevalueestimateisthatofthefirm.Inparticular,ifonemakesthereplacestheFCFFwiththeexpandedversion:¤ FreeCashFlowtotheFirm=EBIT(1- taxrate)(1- ReinvestmentRate)
¨ ThentheValueoftheFirmcanbewrittenasafunctionoftheafter-taxoperatingmargin=(EBIT(1-t)/Sales
g=Growthrateinafter-taxoperatingincomeforthefirstnyearsgn=Growthrateinafter-taxoperatingincomeafternyearsforever(Stablegrowthrate)RIRGrowth,Stable=ReinvestmentrateinhighgrowthandstableperiodsWACC=Weightedaveragecostofcapital
Value Sales0
=After-tax Oper. Margin*(1-RIRgrowth )(1+g)* 1− (1+g)n
(1+WACC)n
"
#$
%
&'
WACC-g+ (1-RIRstable )(1+g)n*(1+gn )
(WACC-gn )(1+WACC)n
(
)
****
+
,
----
Aswath Damodaran
50

51
Thevalueofabrandname
¨ Oneofthecritiquesoftraditionalvaluationisthatisfailstoconsiderthevalueofbrandnamesandotherintangibles.
¨ Theapproachesusedbyanalyststovaluebrandnamesareoftenad-hocandmaysignificantlyoverstateorunderstatetheirvalue.
¨ Oneofthebenefitsofhavingawell-knownandrespectedbrandnameisthatfirmscanchargehigherpricesforthesameproducts,leadingtohigherprofitmarginsandhencetohigherprice-salesratiosandfirmvalue.Thelargerthepricepremiumthatafirmcancharge,thegreateristhevalueofthebrandname.
¨ Ingeneral,thevalueofabrandnamecanbewrittenas:¤ Valueofbrandname={(V/S)b-(V/S)g }*Sales¤ (V/S)b =ValueofFirm/Salesratiowiththebenefitofthebrandname¤ (V/S)g =ValueofFirm/Salesratioofthefirmwiththegenericproduct
Aswath Damodaran
51
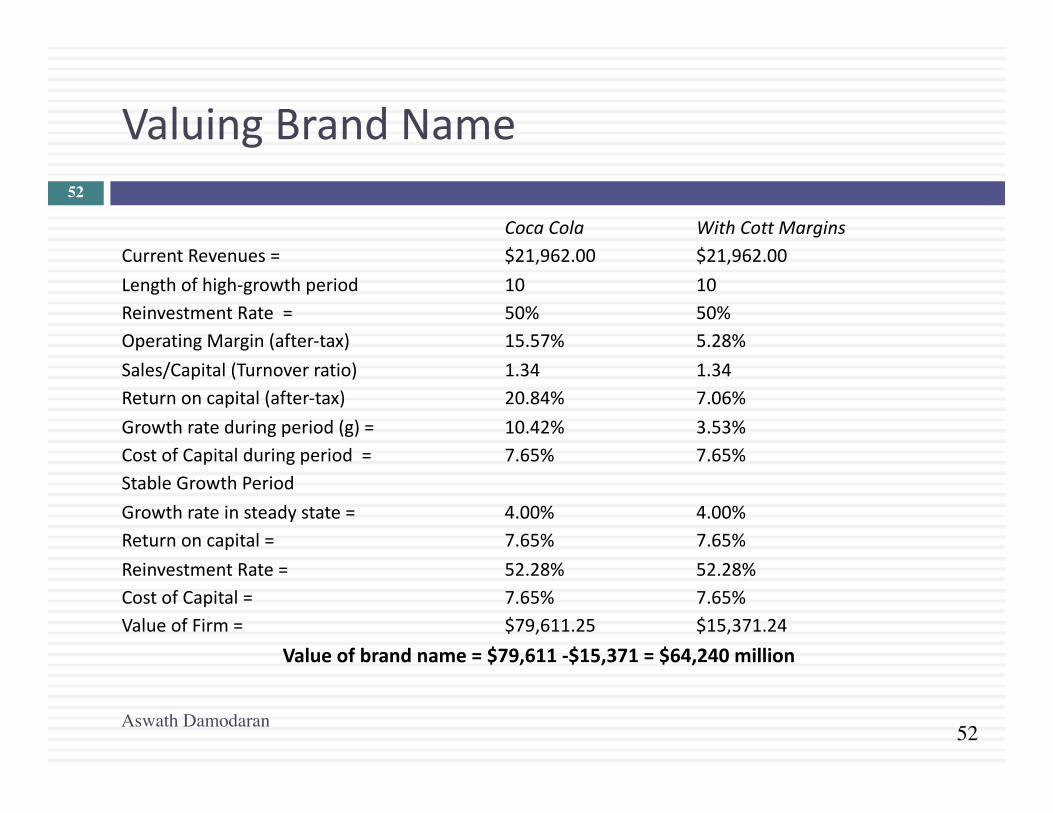
52
ValuingBrandName
CocaCola WithCott MarginsCurrentRevenues= $21,962.00 $21,962.00Lengthofhigh-growthperiod 10 10ReinvestmentRate= 50% 50%OperatingMargin(after-tax) 15.57% 5.28%Sales/Capital(Turnoverratio) 1.34 1.34Returnoncapital(after-tax) 20.84% 7.06%Growthrateduringperiod(g)= 10.42% 3.53%CostofCapitalduringperiod= 7.65% 7.65%StableGrowthPeriodGrowthrateinsteadystate= 4.00% 4.00%Returnoncapital= 7.65% 7.65%ReinvestmentRate= 52.28% 52.28%CostofCapital= 7.65% 7.65%ValueofFirm= $79,611.25 $15,371.24
Valueofbrandname=$79,611-$15,371=$64,240million
Aswath Damodaran
52

53
TheDeterminantsofMultiples…
Value of Stock = DPS 1/(ke - g)
PE=Payout Ratio (1+g)/(r-g)
PEG=Payout ratio (1+g)/g(r-g)
PBV=ROE (Payout ratio) (1+g)/(r-g)
PS= Net Margin (Payout ratio)(1+g)/(r-g)
Value of Firm = FCFF 1/(WACC -g)
Value/FCFF=(1+g)/(WACC-g)
Value/EBIT(1-t) = (1+g) (1- RIR)/(WACC-g)
Value/EBIT=(1+g)(1-RiR)/(1-t)(WACC-g)
VS= Oper Margin (1-RIR) (1+g)/(WACC-g)
Equity Multiples
Firm Multiples
PE=f(g, payout, risk) PEG=f(g, payout, risk) PBV=f(ROE,payout, g, risk) PS=f(Net Mgn, payout, g, risk)
V/FCFF=f(g, WACC) V/EBIT(1-t)=f(g, RIR, WACC) V/EBIT=f(g, RIR, WACC, t) VS=f(Oper Mgn, RIR, g, WACC)
Aswath Damodaran
53

54
ApplicationTests
¨ Giventhefirmthatwearevaluing,whatisa“comparable” firm?¤ Whiletraditionalanalysisisbuiltonthepremisethatfirmsinthesamesectorarecomparablefirms,valuationtheorywouldsuggestthatacomparablefirmisonewhichissimilartotheonebeinganalyzedintermsoffundamentals.
¤ Proposition4:Thereisnoreasonwhyafirmcannotbecomparedwithanotherfirminaverydifferentbusiness,ifthetwofirmshavethesamerisk,growthandcashflowcharacteristics.
¨ Giventhecomparablefirms,howdoweadjustfordifferencesacrossfirmsonthefundamentals?¤ Proposition5:Itisimpossibletofindanexactlyidenticalfirmtotheoneyouarevaluing.
Aswath Damodaran
54

55
Valuingonecompanyrelativetoothers…Relativevaluationwithcomparables
¨ Ideally,youwouldliketofindlotsofpubliclytradedfirmsthatlookjustlikeyourfirm,intermsoffundamentals,andcomparethepricingofyourfirmtothepricingoftheseotherpubliclytradedfirms.Since,theyarealljustlikeyourfirm,therewillbenoneedtocontrolfordifferences.
¨ Inpractice,itisverydifficult(andperhapsimpossible)tofindfirmsthatsharethesamerisk,growthandcashflowcharacteristicsofyourfirm.Evenifyouareabletofindsuchfirms,theywillveryfewinnumber.Thetradeoffthenbecomes:
Small sample of firms that are “just like” your firm
Large sample of firms that are similar in some dimensions but different on others
Aswath Damodaran
55

56
Techniquesforcomparingacrossfirms
1. Directcomparisons:Ifthecomparablefirmsare“justlike” yourfirm,youcancomparemultiplesdirectlyacrossthefirmsandconcludethatyourfirmisexpensive(cheap)ifittradesatamultiplehigher(lower)thantheotherfirms.
2. Storytelling:Ifthereisakeydimensiononwhichthefirmsvary,youcantellastorybaseduponyourunderstandingofhowvaluevariesonthatdimension.Anexample:Thiscompanytradesat12timesearnings,whereastherestofthesectortradesat10timesearnings,butIthinkitischeapbecauseithasamuchhighergrowthratethantherestofthesector.
3. Modifiedmultiple:Youcanmodifythemultipletoincorporatethedimensiononwhichtherearedifferencesacrossfirms.
4. Statisticaltechniques:Ifyourfirmsvaryonmorethanonedimension,youcantryusingmultipleregressions(orvariantsthereof)toarriveata“controlled” estimateforyourfirm.
Aswath Damodaran
56

57
Example1:Let’strysomestorytellingComparingPEratiosacrossfirmsinasector
CompanyName TrailingPE ExpectedGrowth StandardDeviationCoca-ColaBottling 29.18 9.50% 20.58%MolsonInc.Ltd.'A' 43.65 15.50% 21.88%Anheuser-Busch 24.31 11.00% 22.92%CorbyDistilleriesLtd. 16.24 7.50% 23.66%Chalone WineGroup 21.76 14.00% 24.08%AndresWinesLtd.'A'8.96 3.50% 24.70%Todhunter Int'l 8.94 3.00% 25.74%Brown-Forman'B'10.07 11.50% 29.43%Coors(Adolph)'B' 23.02 10.00% 29.52%PepsiCo,Inc. 33.00 10.50% 31.35%Coca-Cola 44.33 19.00% 35.51%BostonBeer'A' 10.59 17.13% 39.58%WhitmanCorp. 25.19 11.50% 44.26%Mondavi (Robert)'A'16.47 14.00% 45.84%Coca-ColaEnterprises37.14 27.00% 51.34%HansenNaturalCorp9.70 17.00% 62.45%
Aswath Damodaran
57

58
AQuestion
¨ Youarereadinganequityresearchreportonthissector,andtheanalystclaimsthatAndresWineandHansenNaturalareundervaluedbecausetheyhavelowPEratios.Wouldyouagree?a. Yesb. No
¨ Whyorwhynot?
Aswath Damodaran
58
59
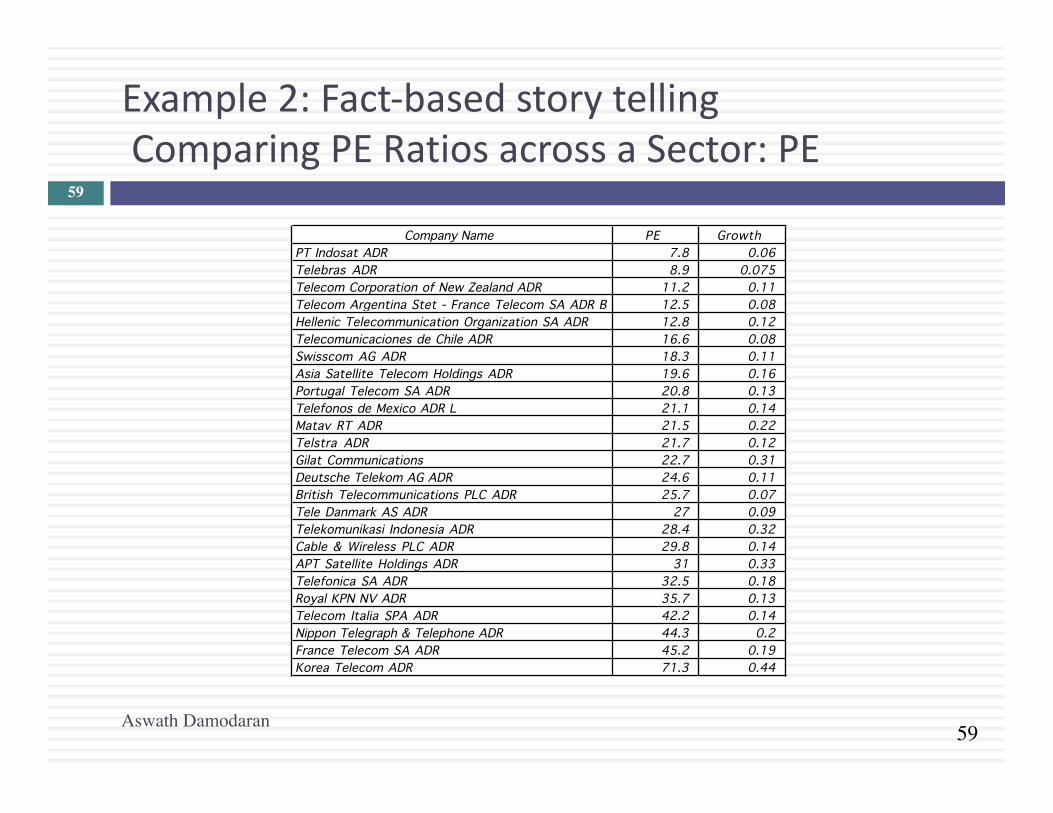
Example2:Fact-basedstorytellingComparingPERatiosacrossaSector:PE
Company Name PE GrowthPT Indosat ADR 7.8 0.06Telebras ADR 8.9 0.075Telecom Corporation of New Zealand ADR 11.2 0.11Telecom Argentina Stet - France Telecom SA ADR B 12.5 0.08Hellenic Telecommunication Organization SA ADR 12.8 0.12Telecomunicaciones de Chile ADR 16.6 0.08Swisscom AG ADR 18.3 0.11Asia Satellite Telecom Holdings ADR 19.6 0.16Portugal Telecom SA ADR 20.8 0.13Telefonos de Mexico ADR L 21.1 0.14Matav RT ADR 21.5 0.22Telstra ADR 21.7 0.12Gilat Communications 22.7 0.31Deutsche Telekom AG ADR 24.6 0.11British Telecommunications PLC ADR 25.7 0.07Tele Danmark AS ADR 27 0.09Telekomunikasi Indonesia ADR 28.4 0.32Cable & Wireless PLC ADR 29.8 0.14APT Satellite Holdings ADR 31 0.33Telefonica SA ADR 32.5 0.18Royal KPN NV ADR 35.7 0.13Telecom Italia SPA ADR 42.2 0.14Nippon Telegraph & Telephone ADR 44.3 0.2France Telecom SA ADR 45.2 0.19Korea Telecom ADR 71.3 0.44
Aswath Damodaran
59

60
PE,GrowthandRisk
Dependentvariableis: PERsquared=66.2%Rsquared(adjusted)=63.1%
Variable Coefficient SE t-ratio ProbabilityConstant 13.1151 3.471 3.78 0.0010Growthrate121.223 19.27 6.29 ≤0.0001EmergingMarket -13.8531 3.606 -3.84 0.0009
EmergingMarketisadummy: 1ifemergingmarket0ifnot
Aswath Damodaran
60

61
IsTelebrasundervalued?
¨ PredictedPE=13.12+121.22(.075)- 13.85(1)=8.35
¨ Atanactualpricetoearningsratioof8.9,Telebrasisslightlyovervalued.
¨ Bottomline:JustbecauseacompanytradesatalowPEratiodoesnotmakeitcheap.
Aswath Damodaran
61

62
Example3:AnEyeballingExercisewithP/BVRatiosEuropeanBanksin2010
Name PBV Ratio Return on Equity Standard DeviationBAYERISCHE HYPO-UND VEREINSB 0.80 -1.66% 49.06%COMMERZBANK AG 1.09 -6.72% 36.21%DEUTSCHE BANK AG -REG 1.23 1.32% 35.79%BANCA INTESA SPA 1.66 1.56% 34.14%BNP PARIBAS 1.72 12.46% 31.03%BANCO SANTANDER CENTRAL HISP 1.86 11.06% 28.36%SANPAOLO IMI SPA 1.96 8.55% 26.64%BANCO BILBAO VIZCAYA ARGENTA 1.98 11.17% 18.62%SOCIETE GENERALE 2.04 9.71% 22.55%ROYAL BANK OF SCOTLAND GROUP 2.09 20.22% 18.35%HBOS PLC 2.15 22.45% 21.95%BARCLAYS PLC 2.23 21.16% 20.73%UNICREDITO ITALIANO SPA 2.30 14.86% 13.79%KREDIETBANK SA LUXEMBOURGEOI 2.46 17.74% 12.38%ERSTE BANK DER OESTER SPARK 2.53 10.28% 21.91%STANDARD CHARTERED PLC 2.59 20.18% 19.93%HSBC HOLDINGS PLC 2.94 18.50% 19.66%LLOYDS TSB GROUP PLC 3.33 32.84% 18.66%Average 2.05 12.54% 24.99%Median 2.07 11.82% 21.93%
Aswath Damodaran
62

63
Themediantest…
¨ Wearelookingforstocksthattradeatlowpricetobookratios,whilegeneratinghighreturnsonequity,withlowrisk.Butwhatisalowpricetobookratio?Orahighreturnonequity?Oralowrisk
¨ Onesimplemeasureofwhatisparforthesectorarethemedianvaluesforeachofthevariables.Asimplisticdecisionruleonunderandovervaluedstockswouldthereforebe:¤ Undervaluedstocks:Tradeatpricetobookratiosbelowthemedianfor
thesector,(2.07),generatereturnsonequityhigherthanthesectormedian(11.82%)andhavestandarddeviationslowerthanthemedian(21.93%).
¤ Overvaluedstocks:Tradeatpricetobookratiosabovethemedianforthesectorandgeneratereturnsonequitylowerthanthesectormedian.
Aswath Damodaran
63

64
Howaboutthismechanism?
¨ Wearelookingforstocksthattradeatlowpricetobookratios,whilegeneratinghighreturnsonequity.Butwhatisalowpricetobookratio?Orahighreturnonequity?
¨ Takingthesampleof18banks,weranaregressionofPBVagainstROEandstandarddeviationinstockprices(asaproxyforrisk).
PBV= 2.27 + 3.63ROE - 2.68Std dev(5.56) (3.32) (2.33)
Rsquaredofregression=79%
Aswath Damodaran
64

65
Andthesepredictions?
Aswath Damodaran
65

66
AfollowuponUSBanks
Aswath Damodaran
66

67
Example4:AlargersamplePricetoBookversusROE:LargestfirmsintheUS:January2010
Aswath Damodaran
67

68
Missinggrowth?
Aswath Damodaran
68

69
PBV,ROEandRisk:LargeCapUSfirms
Cheapest
Most overvalued
Most undervalued
Aswath Damodaran
69
70
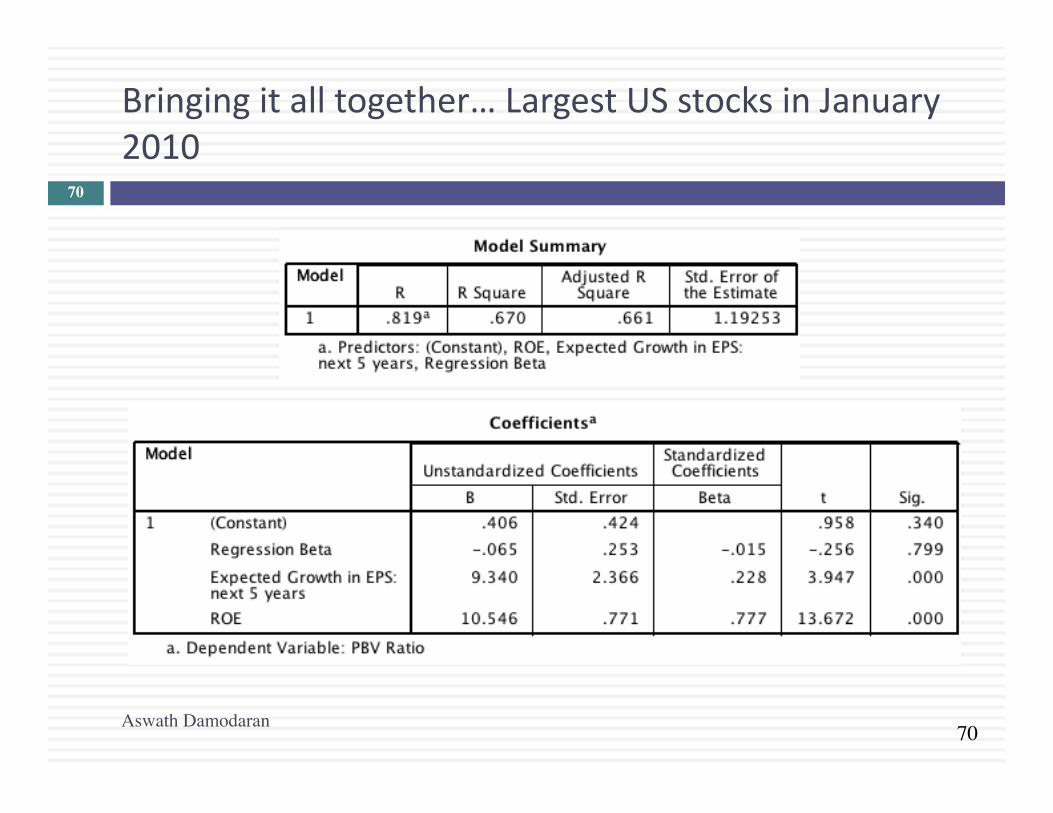
Bringingitalltogether…LargestUSstocksinJanuary2010
Aswath Damodaran
70

71
UpdatedPBVRatios– LargestMarketCapUScompaniesUpdatedtoJanuary2015
Aswath Damodaran
71

72
Example5:Overlookedfundamentals?EV/EBITDAMultipleforTruckingCompanies
Company Name Value EBITDA Value/EBITDAKLLM Trans. Svcs. 114.32$ 48.81$ 2.34Ryder System 5,158.04$ 1,838.26$ 2.81Rollins Truck Leasing 1,368.35$ 447.67$ 3.06Cannon Express Inc. 83.57$ 27.05$ 3.09Hunt (J.B.) 982.67$ 310.22$ 3.17Yellow Corp. 931.47$ 292.82$ 3.18Roadway Express 554.96$ 169.38$ 3.28Marten Transport Ltd. 116.93$ 35.62$ 3.28Kenan Transport Co. 67.66$ 19.44$ 3.48M.S. Carriers 344.93$ 97.85$ 3.53Old Dominion Freight 170.42$ 45.13$ 3.78Trimac Ltd 661.18$ 174.28$ 3.79Matlack Systems 112.42$ 28.94$ 3.88XTRA Corp. 1,708.57$ 427.30$ 4.00Covenant Transport Inc 259.16$ 64.35$ 4.03Builders Transport 221.09$ 51.44$ 4.30Werner Enterprises 844.39$ 196.15$ 4.30Landstar Sys. 422.79$ 95.20$ 4.44AMERCO 1,632.30$ 345.78$ 4.72USA Truck 141.77$ 29.93$ 4.74Frozen Food Express 164.17$ 34.10$ 4.81Arnold Inds. 472.27$ 96.88$ 4.87Greyhound Lines Inc. 437.71$ 89.61$ 4.88USFreightways 983.86$ 198.91$ 4.95Golden Eagle Group Inc. 12.50$ 2.33$ 5.37Arkansas Best 578.78$ 107.15$ 5.40Airlease Ltd. 73.64$ 13.48$ 5.46Celadon Group 182.30$ 32.72$ 5.57Amer. Freightways 716.15$ 120.94$ 5.92Transfinancial Holdings 56.92$ 8.79$ 6.47Vitran Corp. 'A' 140.68$ 21.51$ 6.54Interpool Inc. 1,002.20$ 151.18$ 6.63Intrenet Inc. 70.23$ 10.38$ 6.77Swift Transportation 835.58$ 121.34$ 6.89Landair Services 212.95$ 30.38$ 7.01CNF Transportation 2,700.69$ 366.99$ 7.36Budget Group Inc 1,247.30$ 166.71$ 7.48Caliber System 2,514.99$ 333.13$ 7.55Knight Transportation Inc 269.01$ 28.20$ 9.54Heartland Express 727.50$ 64.62$ 11.26Greyhound CDA Transn Corp 83.25$ 6.99$ 11.91Mark VII 160.45$ 12.96$ 12.38Coach USA Inc 678.38$ 51.76$ 13.11US 1 Inds Inc. 5.60$ (0.17)$ NA
Average 5 .61
Aswath Damodaran
72

73
ATestonEBITDA
¨ RyderSystemlooksverycheaponaValue/EBITDAmultiplebasis,relativetotherestofthesector.Whatexplanation(otherthanmisvaluation)mighttherebeforthisdifference?
¨ WhatgenerallessonswouldyoudrawfromthisontheEV/EBITDAmultiplesforinfrastructurecompaniesastheirinfrastructureages?
Aswath Damodaran
73

74
Example6:RelativevaluationacrosstimePricetoSalesMultiples:GroceryStores- USinJanuary2007
Net Margin
543210-1-2-3
PS_R
ATIO
1 .6
1.4
1.2
1.0
.8
.6
.4
.2
0.0
-.2 Rsq = 0.5947
WFMI
ARD
RDKSWYWMK
AHOOATS
PTMKMARSA
Whole Foods: In 2007: Net Margin was 3.41% and Price/ Sales ratio was 1.41Predicted Price to Sales = 0.07 + 10.49 (0.0341) = 0.43
Aswath Damodaran
74
75
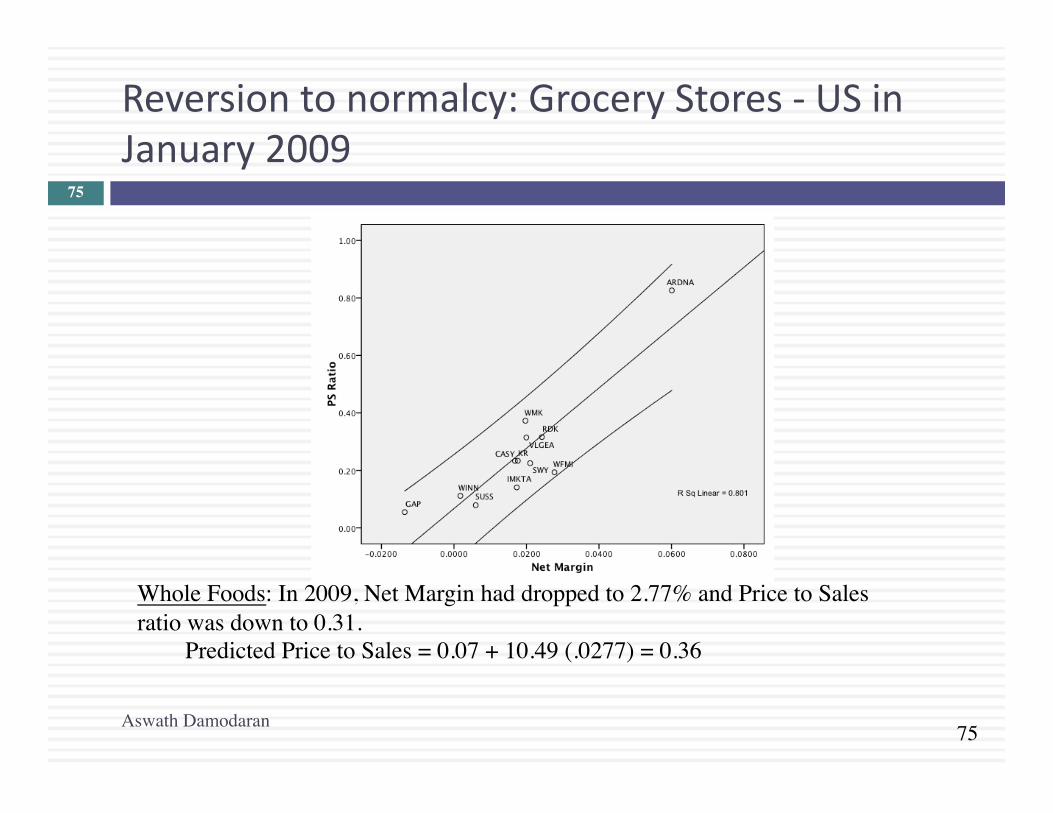
Reversiontonormalcy:GroceryStores- USinJanuary2009
Whole Foods: In 2009, Net Margin had dropped to 2.77% and Price to Sales ratio was down to 0.31.
Predicted Price to Sales = 0.07 + 10.49 (.0277) = 0.36
Aswath Damodaran
75

76
Andagainin2010..
Whole Foods: In 2010, Net Margin had dropped to 1.44% and Price to Sales ratio increased to 0.50.Predicted Price to Sales = 0.06 + 11.43 (.0144) = 0.22
Aswath Damodaran
76

77
Hereis2011…
PS Ratio= - 0.585 + 55.50 (Net Margin) R2= 48.2%PS Ratio for WFMI = -0.585 + 55.50 (.0273) = 0.93At a PS ratio of 0.98, WFMI is slightly over valued.
Aswath Damodaran
77

78
GroceryStores:January2015
Aswath Damodaran
78
PS = 0.557 + 0.085 Net MarginWhole Foods = 0.557 + 8.50 (0.0408) = 0.90At 1.35 times sales, Whole Foods is overvalued (again)
There is a new star in town (Sprouts)

79
Example7:DesperationTimeNothing’sworking!!!InternetStocksinearly2000..
ROWEGSVIPPODTURF BUYX ELTXGEEKRMIIFATB TMNTONEM ABTL INFO ANETITRAIIXLBIZZ EGRPACOMALOYBIDSSPLN EDGRPSIX ATHY AMZN
CLKS PCLNAPNT SONENETO
CBIS NTPACSGPINTW RAMP
DCLKCNETATHMMQST FFIV
SCNT MMXIINTM
SPYGLCOS
PKSI
-0
10
20
30
-0.8 -0.6 -0.4 -0.2
AdjMargin
AdjPS
Aswath Damodaran
79

80
PSRatiosandMarginsarenothighlycorrelated
¨ RegressingPSratiosagainstcurrentmarginsyieldsthefollowingPS=81.36 - 7.54(NetMargin) R2=0.04
(0.49)
¨ Thisisnotsurprising.Thesefirmsarepricedbaseduponexpectedmargins,ratherthancurrentmargins.
Aswath Damodaran
80

81
Solution1:Useproxiesforsurvivalandgrowth:Amazoninearly2000
¨ Hypothesizingthatfirmswithhigherrevenuegrowthandhighercashbalancesshouldhaveagreaterchanceofsurvivingandbecomingprofitable,weranthefollowingregression:(Thelevelofrevenueswasusedtocontrolforsize)
PS=30.61- 2.77ln(Rev)+6.42(RevGrowth)+5.11(Cash/Rev)(0.66) (2.63) (3.49)
Rsquared=31.8%¨ PredictedPS=30.61- 2.77(7.1039)+6.42(1.9946)+5.11
(.3069)=30.42¨ ActualPS=25.63
Stockisundervalued,relativetootherinternetstocks.
Aswath Damodaran
81

82
Solution2:UseforwardmultiplesWatchoutforbumpsintheroad(Tesla)
Aswath Damodaran
82

83
Solution3:Letthemarkettellyouwhatmatters..SocialmediainOctober2013
Aswath Damodaran
83
Company MarketCapEnterprisevalue Revenues EBITDA NetIncome
Numberofusers(millions) EV/User EV/Revenue EV/EBITDA PE
Facebook $173,540.00 $160,090.00 $7,870.00 $3,930.00 $1,490.00 1230.00 $130.15 20.34 40.74 116.47Linkedin $23,530.00 $19,980.00 $1,530.00 $182.00 $27.00 277.00 $72.13 13.06 109.78 871.48Pandora $7,320.00 $7,150.00 $655.00 -$18.00 -$29.00 73.40 $97.41 10.92 NA NAGroupon $6,690.00 $5,880.00 $2,440.00 $125.00 -$95.00 43.00 $136.74 2.41 47.04 NANetflix $25,900.00 $25,380.00 $4,370.00 $277.00 $112.00 44.00 $576.82 5.81 91.62 231.25Yelp $6,200.00 $5,790.00 $233.00 $2.40 -$10.00 120.00 $48.25 24.85 2412.50 NAOpenTable $1,720.00 $1,500.00 $190.00 $63.00 $33.00 14.00 $107.14 7.89 23.81 52.12Zynga $4,200.00 $2,930.00 $873.00 $74.00 -$37.00 27.00 $108.52 3.36 39.59 NAZillow $3,070.00 $2,860.00 $197.00 -$13.00 -$12.45 34.50 $82.90 14.52 NA NATrulia $1,140.00 $1,120.00 $144.00 -$6.00 -$18.00 54.40 $20.59 7.78 NA NATripadvisor $13,510.00 $12,860.00 $945.00 $311.00 $205.00 260.00 $49.46 13.61 41.35 65.90
Average $130.01 11.32 350.80 267.44Median $97.41 10.92 44.20 116.47

84
Readthetealeaves:Seewhatthemarketcaresabout
Aswath Damodaran
84
Market Cap
Enterprise value Revenues EBITDA
Net Income
Number of users (millions)
Market Cap 1.
Enterprise value 0.9998 1.
Revenues 0.8933 0.8966 1.
EBITDA 0.9709 0.9701 0.8869 1.
Net Income 0.8978 0.8971 0.8466 0.9716 1.
Number of users (millions) 0.9812 0.9789 0.8053 0.9354 0.8453 1.
Twitter had 240 million users at the time of its IPO. What price would you attach to the company?

85
Relativevaluationacrosstheentiremarket:Whynot?
¨ Incontrasttothe'comparablefirm'approach,theinformationintheentirecross-sectionoffirmscanbeusedtopredictPEratios.
¨ Thesimplestwayofsummarizingthisinformationiswithamultipleregression,withthePEratioasthedependentvariable,andproxiesforrisk,growthandpayoutformingtheindependentvariables.
Aswath Damodaran
85

86
I.PERatioversusthemarketPEversusExpectedEPSGrowth:January2016
Aswath Damodaran
86

87
PERatio:StandardRegressionforUSstocks-January2016
Aswath Damodaran
87
The regression is run with growth and payout entered as decimals, i.e., 25% is entered as 0.25)

88
Problemswiththeregressionmethodology
¨ ThebasicregressionassumesalinearrelationshipbetweenPEratiosandthefinancialproxies,andthatmightnotbeappropriate.
¨ ThebasicrelationshipbetweenPEratiosandfinancialvariablesitselfmightnotbestable,andifitshiftsfromyeartoyear,thepredictionsfromthemodelmaynotbereliable.
¨ Theindependentvariablesarecorrelatedwitheachother.Forexample,highgrowthfirmstendtohavehighrisk.Thismulti-collinearitymakesthecoefficientsoftheregressionsunreliableandmayexplainthelargechangesinthesecoefficientsfromperiodtoperiod.
Aswath Damodaran
88

89
TheMulticollinearityProblem
Aswath Damodaran
89

90
UsingthePEratioregression
¨ AssumethatyouweregiventhefollowinginformationforDisney.Thefirmhasanexpectedgrowthrateof15%,abetaof1.25anda20%dividendpayoutratio.Basedupontheregression,estimatethepredictedPEratioforDisney.¤ PredictedPE=8.76-4.08Beta+75.24Growth+19.73(Payout)
¨ Disneyisactuallytradingat20timesearnings.WhatdoesthepredictedPEtellyou?
¨ AssumenowthatyouvalueDisneyagainstjustitspeergroup.Willyoucometothesamevaluationjudgmentasyoudidwhenyoulookedatitrelativetothemarket?Whyorwhynot?
Aswath Damodaran
90

91
Thevalueofgrowth
Aswath Damodaran
91
Date Marketpriceofextra%growth ImpliedERP
Jan-16 0.75 6.12%Jan-15 0.99 5.78%Jan-14 1.49 4.96%Jan-13 0.577 5.78%Jan-12 0.408 6.04%Jan-11 0.836 5.20%Jan-10 0.55 4.36%Jan-09 0.78 6.43%Jan-08 1.427 4.37%Jan-07 1.178 4.16%Jan-06 1.131 4.07%Jan-05 0.914 3.65%Jan-04 0.812 3.69%Jan-03 2.621 4.10%Jan-02 1.003 3.62%Jan-01 1.457 2.75%Jan-00 2.105 2.05%

92
II.PEGRatioversusthemarketPEGversusGrowth
Aswath Damodaran
92

93
PEGversusln(ExpectedGrowth)
Aswath Damodaran
93

94
PEGRatioRegression- USstocksJanuary2016
Aswath Damodaran
94

95
Negativeintercepts…andproblemforecasts..
¨ Whentheinterceptinamultiplesregressionisnegative,thereisthepossibilitythatforecastedvaluescanbenegativeaswell.Oneway(albeitimperfect)istore-runtheregressionwithoutanintercept.
Aswath Damodaran
95

96
I.PEratioregressionsacrossmarkets–January2016
Region Regression – January 2016 R2
US PE = 8.76 + 75.24 gEPS + 19.73 Payout – 4.08 Beta 40.5%
Europe PE = 13.43 + 54.46 gEPS + 17.63 Payout - 4.16 Beta 24.7%
Japan PE = 20.10+ 26.46 gEPS + 24.87 Payout – 7.60 Beta 28.4%
Emerging Markets
PE = 15.13 + 40.99 gEPS + 9.03 Payout - 2.14 Beta 11.5%
Australia, NZ, Canada
PE = 7.31 + 73.42 gEPS + 13.94 Payout – 3.73 Beta 26.8%
Global PE = 12.51 + 87.48 gEPS + 11.48 Payout - 3.96 Beta 27.5%
gEPS=Expected Growth: Expected growth in EPS or Net Income: Next 5 yearsBeta: Regression or Bottom up BetaPayout ratio: Dividends/ Net income from most recent year. Set to zero, if net income < 0
Aswath Damodaran
96

97
II.PricetoBookRatio:Fundamentalsholdineverymarket
Region Regression – January 2016 R2
US PBV= -1.68 + 14.59 gEPS – 0.99 Beta + 3.79 Payout + 19.58 ROE 50.2%
Europe PBV = 2.66 + 6.30 gEPS – 1.40 Beta + 9.39 ROE + 1.80 Payout 40.6%
Japan PBV= 2.01 + 2.15 gEPS – 1.18 Beta + 0.97 Payout + 8.28 ROE 29.1%
Emerging Markets
PBV= -0.43 + 2.71 gEPS - 0.74 Beta + 2.48 Payout + 18.91 ROE 34.1%
Australia, NZ, Canada
PBV= -1.20 + 8.97 gEPS - 0.69 Beta + 1.01 Payout + 21.90 ROE 55.4%
Global PBV= 0.22 + 5.41 gEPS - 0.95 Beta + 2.68 Payout +16.09 ROE 43.1%
gEPS=Expected Growth: Expected growth in EPS/ Net Income: Next 5 yearsBeta: Regression or Bottom up BetaPayout ratio: Dividends/ Net income from most recent year. Set to zero, if net income < 0ROE: Net Income/ Book value of equity in most recent year.
97

98
III.EV/EBITDA– January2016
Region Regression – January 2016 R squared
United States EV/EBITDA= 19.54 + 3.64 g - 1.97 WACC – 12.71 DFR – 3.30 Tax Rate
2.3%
Europe EV/EBITDA= 17.28 + 18.82 g - 17.94 WACC – 7.55 DFR –9.10 Tax Rate
9.0%
Japan EEV/EBITDA= 22.49 + 1.75 g - 79.45 WACC – 6.03 DFR –19.00 Tax Rate
%
Emerging Markets
EV/EBITDA= 50.71 + 9.57 g - 212.55 WACC – 18.27 DFR –21.40 Tax Rate
5.9%
Australia, NZ & Canada
EV/EBITDA= 25.86+ 10.10 g - 162.14 WACC – 1.41 DFR –10.50 Tax Rate
8.6%
Global EV/EBITDA= 27.42 + 6.90 g -55.15 WACC – 12.03 DFR –16.20 Tax Rate
3.7%
g = Expected Revenue Growth: Expected growth in revenues: Near term (2 or 5 years)DFR = Debt Ratio : Total Debt/ (Total Debt + Market value of equity)Tax Rate: Effective tax rate in most recent year WACC = Cost of capital (in US$)
98

99
IV.EV/SalesRegressionsacrossmarkets…
Region Regression – January 2016 R SquaredUnited States EV/Sales = 7.42 + 2.47 g+ 2.96 Operating Margin – 2.20
DFR- 9.90 Tax rate10.1%
Europe EV/Sales = -0.89 + 9.81 g+ 14.63 Operating Margin + 14.91 DFR- 6.10 Tax rate
31.4%
Japan EV/Sales = 2.02 - 0.48 g+ 8.73 Operating Margin +2.50 DFR- 5.00 Tax rate
13.6%
Emerging Markets
EV/Sales = 5.66 + 5.05 g+ 7.86 Operating Margin -0.55 DFR- 9.80 Tax rate
14.3%
Australia, NZ & Canada
EV/Sales = -0.35 + 12.03 g+ 5.34 Operating Margin + 13.95 DFR- 2.60 Tax rate
36.3%
Global EV/Sales =4.73+ 3.53 g+ 6.92 Op. Margin + 3.83 DFR- 9.20 Tax rate
11.5%
g =Expected Revenue Growth: Expected growth in revenues: Near term (2 or 5 years)ERP: ERP for country in which company is incorporatedTax Rate: Effective tax rate in most recent year; Operating Margin: Operating Income/ Sales
99

100
RelativeValuation:Someclosingpropositions
¨ Proposition1:Inarelativevaluation,allthatyouareconcludingisthatastockisunderorovervalued,relativetoyourcomparablegroup.¤ Yourrelativevaluationjudgmentcanberightandyourstockcanbehopelesslyovervaluedatthesametime.
¨ Proposition2:Inassetvaluation,therearenosimilarassets.Everyassetisunique.¤ Ifyoudonotcontrolforfundamentaldifferencesinrisk,cashflowsandgrowthacrossfirmswhencomparinghowtheyarepriced,yourvaluationconclusionswillreflectyourflawedjudgmentsratherthanmarketmisvaluations.
¨ Bottomline:Relativevaluationispricing,notvaluation.
Aswath Damodaran
100

101
ChoosingBetweentheMultiples
¨ Aspresentedinthissection,therearedozensofmultiplesthatcanbepotentiallyusedtovalueanindividualfirm.
¨ Inaddition,relativevaluationcanberelativetoasector(orcomparablefirms)ortotheentiremarket(usingtheregressions,forinstance)
¨ Sincetherecanbeonlyonefinalestimateofvalue,therearethreechoicesatthisstage:¤ Useasimpleaverageofthevaluationsobtainedusinganumberof
differentmultiples¤ Useaweightedaverageofthevaluationsobtainedusinganmberof
differentmultiples¤ Chooseoneofthemultiplesandbaseyourvaluationonthatmultiple
Aswath Damodaran
101

102
PickingoneMultiple
¨ Thisisusuallythebestwaytoapproachthisissue.Whilearangeofvaluescanbeobtainedfromanumberofmultiples,the“bestestimate” valueisobtainedusingonemultiple.
¨ Themultiplethatisusedcanbechoseninoneoftwoways:¤ Usethemultiplethatbestfitsyourobjective.Thus,ifyouwantthe
companytobeundervalued,youpickthemultiplethatyieldsthehighestvalue.
¤ UsethemultiplethathasthehighestR-squaredinthesectorwhenregressedagainstfundamentals.Thus,ifyouhavetriedPE,PBV,PS,etc.andrunregressionsofthesemultiplesagainstfundamentals,usethemultiplethatworksbestatexplainingdifferencesacrossfirmsinthatsector.
¤ Usethemultiplethatseemstomakethemostsenseforthatsector,givenhowvalueismeasuredandcreated.
Aswath Damodaran
102

103
AMoreIntuitiveApproach
¨ Managersineverysectortendtofocusonspecificvariableswhenanalyzingstrategyandperformance.Themultipleusedwillgenerallyreflectthisfocus.Considerthreeexamples.¤ Inretailing:Thefocusisusuallyonsamestoresales(turnover)andprofitmargins.Notsurprisingly,therevenuemultipleismostcommoninthissector.
¤ Infinancialservices:Theemphasisisusuallyonreturnonequity.BookEquityisoftenviewedasascarceresource,sincecapitalratiosarebaseduponit.Pricetobookratiosdominate.
¤ Intechnology:Growthisusuallythedominanttheme.PEGratioswereinventedinthissector.
Aswath Damodaran
103

104
Conventionalusage…
Sector Multiple Used RationaleCyclical Manufacturing PE, Relative PE Often with normalized
earningsGrowth firms PEG ratio Big differences in growth
ratesYoung growth firms w/ losses
Revenue Multiples What choice do you have?
Infrastructure EV/EBITDA Early losses, big DA
REIT P/CFE (where CFE = Net income + Depreciation)
Big depreciation charges on real estate
Financial Services Price/ Book equity Marked to market?Retailing Revenue multiples Margins equalize sooner
or later
Aswath Damodaran
104

105
RelativeversusIntrinsicValue
¨ Ifyoudointrinsicvalueright,youwillbringinacompany’srisk,cashflowandgrowthcharacteristicsintotheinputs,preserveinternalconsistencyandderiveintrinsicvalue.Ifyoudorelativevalueright,youwillfindtherightsetofcomparables,controlwellfordifferencesinrisk,cashflowandgrowthcharacteristics.AssumeyouvaluethesamecompanydoingbothDCFandrelativevaluationcorrectly,shouldyougetthesamevalue?¤ Yes¤ No
¨ Ifnot,howwouldyouexplainthedifference?¨ Ifthenumbersaredifferent,whichvaluewouldyouuse?
¤ Intrinsicvalue¤ Relativevalue¤ Acompositeofthetwovalues¤ Thehigherofthetwovalues¤ Thelowerofthetwovalues¤ Dependsonwhatmyvaluation“mission” is.
Aswath Damodaran
105

106
Reviewing:TheFourStepstoUnderstandingMultiples
¨ Definethemultiple¤ Checkforconsistency¤ Makesurethattheyareestimateduniformly
¨ Describethemultiple¤ Multipleshaveskeweddistributions:Theaveragesareseldomgoodindicatorsoftypicalmultiples
¤ Checkforbias,ifthemultiplecannotbeestimated¨ Analyzethemultiple
¤ Identifythecompanionvariablethatdrivesthemultiple¤ Examinethenatureoftherelationship
¨ Applythemultiple
Aswath Damodaran
106
ADETOUR:ASSETBASEDVALUATION
Valueassets,notcashflows?
Aswath Damodaran 107

108
Whatisassetbasedvaluation?
¨ Inintrinsicvaluation,youvalueabusinessbaseduponthecashflowsyouexpectthatbusinesstogenerateovertime.
¨ Inrelativevaluation,youvalueabusinessbaseduponhowsimilarbusinessesarepriced.
¨ Inassetbasedvaluation,youvalueabusinessbyvaluingitsindividualassets.Theseindividualassetscanbetangibleorintangible.
Aswath Damodaran
108

109
Whywouldyoudoassetbasedvaluation?
¨ Liquidation:Ifyouareliquidatingabusinessbysellingitsassetspiecemeal,ratherthanasacompositebusiness,youwouldliketoestimatewhatyouwillgetfromeachassetorassetclassindividually.
¨ Accountingmission:AsbothUSandinternationalaccountingstandardshaveturnedto“fairvalue”accounting,accountantshavebeencalledupontoredobalancesheettoreflecttheassetsattheirfairratherthanbookvalue.
¨ Sumoftheparts: Ifabusinessismadeupofindividualdivisionsorassets,youmaywanttovaluethesepartsindividuallyforoneoftwogroups:¤ Potentialacquirersmaywanttodothis,asaprecursortorestructuringthe
business.¤ Investorsmaybeinterestedbecauseabusinessthatissellingforlessthan
thesumofitspartsmaybe“cheap”.
Aswath Damodaran
109

110
Howdoyoudoassetbasedvaluation?
¨ Intrinsicvalue:Estimatetheexpectedcashflowsoneachassetorassetclass,discountbackatariskadjusteddiscountrateandarriveatanintrinsicvalueforeachasset.
¨ Relativevalue:Lookforsimilarassetsthathavesoldintherecentpastandestimateavalueforeachassetinthebusiness.
¨ Accountingvalue:Youcouldusethebookvalueoftheassetasaproxyfortheestimatedvalueoftheasset.
Aswath Damodaran
110

111
Whenisasset-basedvaluationeasiesttodo?
¨ Separableassets:Ifacompanyisacollectionofseparableassets(asetofrealestateholdings,aholdingcompanyofdifferentindependentbusinesses),asset-basedvaluationiseasiertodo.Iftheassetsareinterrelatedordifficulttoseparate,asset-basedvaluationbecomesproblematic.Thus,whilerealestateoralongtermlicensing/franchisingcontractmaybeeasilyvalued,brandname(whichcutsacrossassets)ismoredifficulttovalueseparately.
¨ Standaloneearnings/cashflows:Anassetismuchsimplertovalueifyoucantraceitsearnings/cashflowstoit.Itismuchmoredifficulttovaluewhenthebusinessgeneratesearnings,buttheroleofindividualassetsingeneratingtheseearningscannotbeisolated.
¨ Activemarketforsimilarassets:Ifyouplantodoarelativevaluation,itiseasierifyoucanfindanactivemarketfor“similar”assetswhichyoucandrawonfortransactionsprices.
Aswath Damodaran
111

112
I.LiquidationValuation
¨ Inliquidationvaluation,youaretryingtoassesshowmuchyouwouldgetfromsellingtheassetsofthebusinesstoday,ratherthanthebusinessasagoingconcern.
¨ Consequently,itmakesmoresensetopricethoseassets(i.e.,dorelativevaluation)thanitistovaluethem(dointrinsicvaluation).Forassetsthatareseparableandtraded(example:realestate),pricingiseasytodo.Forassetsthatarenot,youoftenseebookvalueusedeitherasaproxyforliquidationvalueorasabasisforestimatingliquidationvalue.
¨ Totheextentthattheliquidationisurgent,youmayattachadiscounttotheestimatedvalue.
Aswath Damodaran
112

113
II.AccountingValuation:GlimmersfromFAS157
¨ Theubiquitous“marketparticipant”:ThroughFAS157,accountantsareaskedtoattachvaluestoassets/liabilitiesthatmarketparticipantswouldhavebeenwillingtopay/receive.
¨ Tilttowardsrelativevalue:“Thedefinitionfocusesonthepricethatwouldbereceivedtoselltheassetorpaidtotransfertheliability(anexitprice),notthepricethatwouldbepaidtoacquiretheassetorreceivedtoassumetheliability(anentryprice).” Thehierarchyputs“marketprices”,ifavailableforanasset,atthetopwithintrinsicvaluebeingacceptedonlyifmarketpricesarenotaccessible.
¨ Splitmission:Whileaccountingfairvalueistitledtowardsrelativevaluation,accountantsarealsorequiredtobacktheirrelativevaluationswithintrinsicvaluations.Often,thisleadstoreverseengineering,whereaccountantsarriveatvaluesfirstanddevelopvaluationslater.
Aswath Damodaran
113

114
III.Sumofthepartsvaluation
¨ Youcanvalueacompanyinpieces,usingeitherrelativeorintrinsicvaluation.Whichoneyouusewilldependonwhoyouareandyourmotivesfordoingthesumofthepartsvaluation.
¨ Ifyouarelongterm,passiveinvestorinthecompany,yourintentmaybetofindmarketmistakesthatyouhopewillgetcorrectedovertime.Ifthatisthecase,youshoulddoanintrinsicvaluationoftheindividualassets.
¨ Ifyouareanactivistinvestorthatplanstoacquirethecompanyorpushforchange,youshouldbemorefocusedonrelativevaluation,sinceyourintentistogetthecompanytosplitupandgaintheincreaseinvalue.
Aswath Damodaran
114

115
Let’strythisUnitedTechnologies:RawData- 2009
Aswath Damodaran
115
Division Business Revenues
EBITDA
Pre-tax Operating
Income Capital
Expenditures Depreciation Total Assets
Carrier Refrigeration systems $14,944 $1,510 $1,316 $191 $194 $10,810
Pratt & Whitney Defense $12,965 $2,490 $2,122 $412 $368 $9,650 Otis Construction $12,949 $2,680 $2,477 $150 $203 $7,731 UTC Fire & Security Security $6,462 $780 $542 $95 $238 $10,022 Hamilton Sundstrand Manufacturing $6,207 $1,277 $1,099 $141 $178 $8,648 Sikorsky Aircraft $5,368 $540 $478 $165 $62 $3,985
The company also had corporate expenses, unallocated to the divisions of $408 million in the most recent year.

116
UnitedTechnologies:RelativeValuationMedianMultiples
Aswath Damodaran
116
Division Business EBITDA EV/EBITDAforsector ValueofBusinessCarrier Refrigerationsystems $1,510 5.25 $7,928Pratt&Whitney Defense $2,490 8.00 $19,920Otis Construction $2,680 6.00 $16,080UTCFire&Security Security $780 7.50 $5,850HamiltonSundstrand IndustrialProducts $1,277 5.50 $7,024Sikorsky Aircraft $540 9.00 $4,860Sumofthepartsvalueforbusiness= $61,661

117
UnitedTechnologies:RelativeValuationPlusScalingvariable&ChoiceofMultiples
Aswath Damodaran
117
Division Business Revenues EBITDA Operating Income Capital Invested Carrier Refrigeration systems $14,944 $1,510 $1,316 $6,014 Pratt & Whitney Defense $12,965 $2,490 $2,122 $5,369 Otis Construction $12,949 $2,680 $2,477 $4,301 UTC Fire & Security Security $6,462 $780 $542 $5,575 Hamilton Sundstrand Industrial Products $6,207 $1,277 $1,099 $4,811 Sikorsky Aircraft $5,368 $540 $478 $2,217 Total $58,895 $9,277 $8,034 $28,287

118
UnitedTechnologies:RelativeValuationSumofthePartsvalue
Aswath Damodaran
118
Division Scaling Variable
Current value for scaling variable ROC
Operating Margin
Tax Rate Predicted Multiple
Estimated Value
Carrier EBITDA $1,510 13.57% 8.81% 38% 5.35 – 3.55 (.38) + 14.17 (.1357) =5.92 $8,944.47
Pratt & Whitney Revenues $12,965 24.51% 16.37% 38% 0.85 + 7.32 (.1637) =2.05 $26,553.29
Otis EBITDA $2,680 35.71% 19.13% 38% 3.17 – 2.87 (.38)+14.66 (.3571) =7.31 $19,601.70
UTC Fire & Security Capital $5,575 6.03% 8.39% 38% 0.55 + 8.22 (.0603) =1.05 $5,828.76 Hamilton Sundstrand Revenues $6,207 14.16% 17.71% 38% 0.51 + 6.13 (.1771) =1.59 $9,902.44 Sikorsky Capital $2,217 13.37% 8.90% 38% 0.65 + 6.98 (.1337) =1.58 $3,509.61
Sum of the parts value for operating assets = $74,230.37

119
UnitedTechnologies:DCFpartsvaluationCostofcapital,bybusiness
Aswath Damodaran
119
Division Unlevered Beta
Debt/Equity Ratio
Levered beta
Cost of equity
After-tax cost of debt
Debt to Capital
Cost of capital
Carrier 0.83 30.44% 0.97 9.32% 2.95% 23.33% 7.84% Pratt & Whitney 0.81 30.44% 0.95 9.17% 2.95% 23.33% 7.72% Otis 1.19 30.44% 1.39 12.07% 2.95% 23.33% 9.94% UTC Fire & Security 0.65 30.44% 0.76 7.95% 2.95% 23.33% 6.78% Hamilton Sundstrand 1.04 30.44% 1.22 10.93% 2.95% 23.33% 9.06% Sikorsky 1.17 30.44% 1.37 11.92% 2.95% 23.33% 9.82%
120
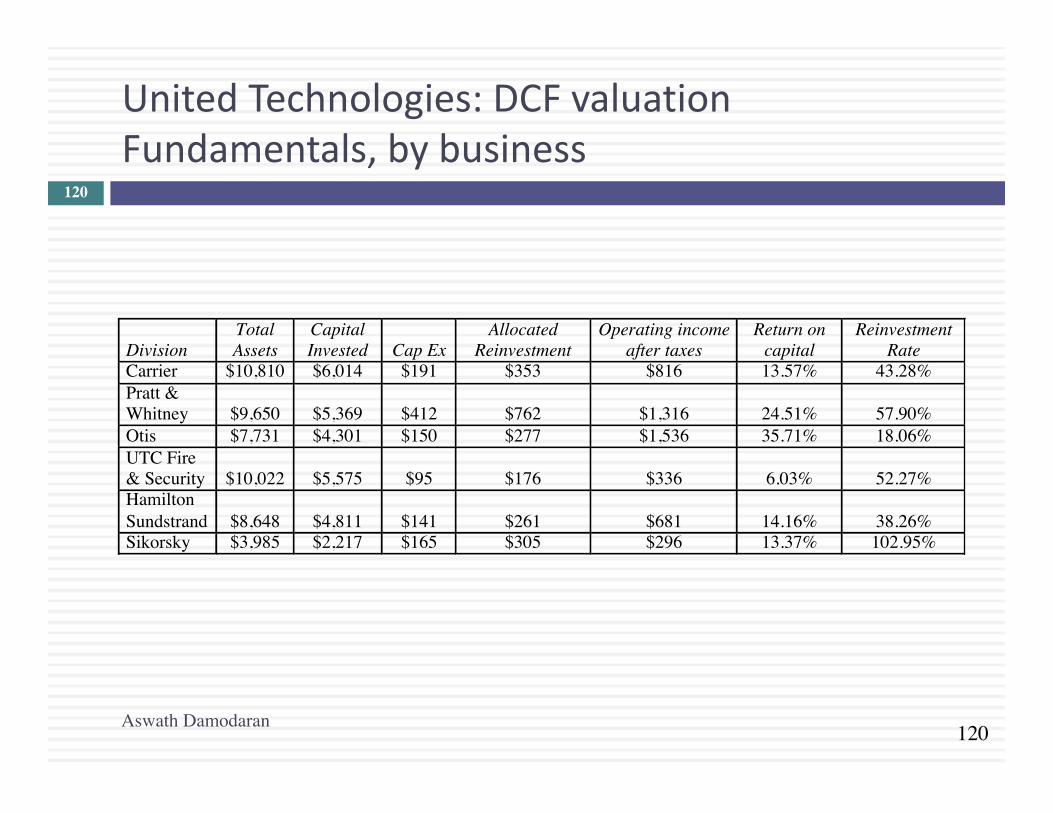
UnitedTechnologies:DCFvaluationFundamentals,bybusiness
Aswath Damodaran
120
Division Total Assets
Capital Invested Cap Ex
Allocated Reinvestment
Operating income after taxes
Return on capital
Reinvestment Rate
Carrier $10,810 $6,014 $191 $353 $816 13.57% 43.28% Pratt & Whitney $9,650 $5,369 $412 $762 $1,316 24.51% 57.90% Otis $7,731 $4,301 $150 $277 $1,536 35.71% 18.06% UTC Fire & Security $10,022 $5,575 $95 $176 $336 6.03% 52.27% Hamilton Sundstrand $8,648 $4,811 $141 $261 $681 14.16% 38.26% Sikorsky $3,985 $2,217 $165 $305 $296 13.37% 102.95%

121
UnitedTechnologies,DCFvaluationGrowthChoices
Aswath Damodaran
121
Division Cost of capital
Return on capital
Reinvestment Rate
Expected growth
Length of growth period
Stable growth rate
Stable ROC
Carrier 7.84% 13.57% 43.28% 5.87% 5 3% 7.84% Pratt & Whitney 7.72% 24.51% 57.90% 14.19% 5 3% 12.00% Otis 9.94% 35.71% 18.06% 6.45% 5 3% 14.00% UTC Fire & Security 6.78% 6.03% 52.27% 3.15% 0 3% 6.78% Hamilton Sundstrand 9.06% 14.16% 38.26% 5.42% 5 3% 9.06% Sikorsky 9.82% 13.37% 102.95% 13.76% 5 3% 9.82%
122
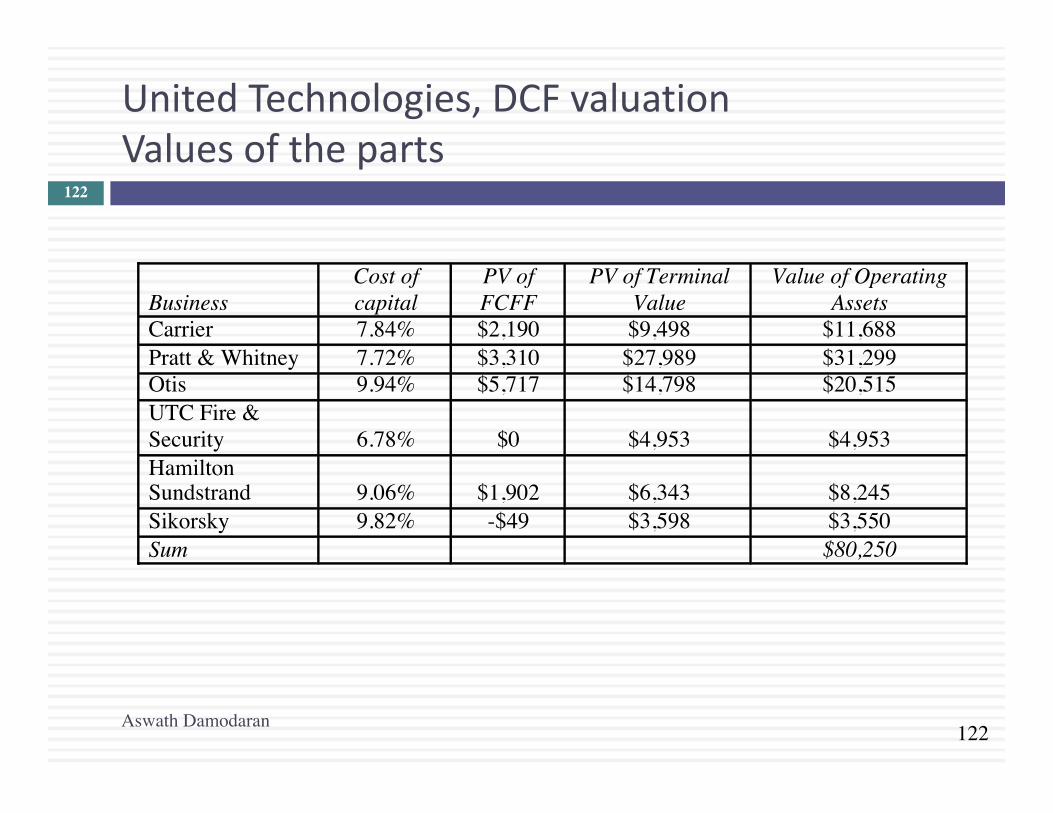
UnitedTechnologies,DCFvaluationValuesoftheparts
Aswath Damodaran
122
Business Cost of capital
PV of FCFF
PV of Terminal Value
Value of Operating Assets
Carrier 7.84% $2,190 $9,498 $11,688 Pratt & Whitney 7.72% $3,310 $27,989 $31,299 Otis 9.94% $5,717 $14,798 $20,515 UTC Fire & Security 6.78% $0 $4,953 $4,953 Hamilton Sundstrand 9.06% $1,902 $6,343 $8,245 Sikorsky 9.82% -$49 $3,598 $3,550 Sum $80,250

123
UnitedTechnologies,DCFvaluationSumoftheParts
Aswath Damodaran
123
Valueoftheparts =$80,250Valueofcorporateexpenses
=$4,587
Valueofoperatingassets(sumofpartsDCF)=$75,663Valueofoperatingassets(sumofpartsRV) =$74,230Valueofoperatingassets(companyDCF) =$71,410Enterprisevalue(basedonmarketprices) =$52,261
=Corporate ExpensesCurrent (1− t)(1+ g)
(Cost of capitalCompany − g)=408(1−.38)(1.03)(.0868−.03)

PRIVATECOMPANYVALUATION
AswathDamodaran
Aswath Damodaran 124

125
ProcessofValuingPrivateCompanies
¨ Theprocessofvaluingprivatecompaniesisnotdifferentfromtheprocessofvaluingpubliccompanies.Youestimatecashflows,attachadiscountratebasedupontheriskinessofthecashflowsandcomputeapresentvalue.Aswithpubliccompanies,youcaneithervalue¤ Theentirebusiness,bydiscountingcashflowstothefirmatthecostof
capital.¤ Theequityinthebusiness,bydiscountingcashflowstoequityatthe
costofequity.¨ Whenvaluingprivatecompanies,youfacetwostandard
problems:¤ Thereisnotmarketvalueforeitherdebtorequity¤ Thefinancialstatementsforprivatefirmsarelikelytogobackfewer
years,havelessdetailandhavemoreholesinthem.
Aswath Damodaran
125

126
1.NoMarketValue?
¨ Marketvaluesasinputs:Sinceneitherthedebtnorequityofaprivatebusinessistraded,anyinputsthatrequirethemcannotbeestimated.1. Debtratiosforgoingfromunleveredtoleveredbetasandfor
computingcostofcapital.2. Marketpricestocomputethevalueofoptionsandwarrants
grantedtoemployees.¨ Marketvalueasoutput:Whenvaluingpubliclytradedfirms,themarketvalueoperatesasameasureofreasonableness.Inprivatecompanyvaluation,thevaluestandsalone.
¨ Marketpricebasedriskmeasures,suchasbetaandbondratings,willnotbeavailableforprivatebusinesses.
Aswath Damodaran
126

127
2.CashFlowEstimationIssues
¨ Shorterhistory:Privatefirmsoftenhavebeenaroundformuchshortertimeperiodsthanmostpubliclytradedfirms.Thereisthereforelesshistoricalinformationavailableonthem.
¨ DifferentAccountingStandards:Theaccountingstatementsforprivatefirmsareoftenbasedupondifferentaccountingstandardsthanpublicfirms,whichoperateundermuchtighterconstraintsonwhattoreportandwhentoreport.
¨ Interminglingofpersonalandbusinessexpenses:Inthecaseofprivatefirms,somepersonalexpensesmaybereportedasbusinessexpenses.
¨ Separating“Salaries” from“Dividends”:Itisdifficulttotellwheresalariesendanddividendsbegininaprivatefirm,sincetheybothendupwiththeowner.
Aswath Damodaran
127

128
PrivateCompanyValuation:Motivematters
¨ Youcanvalueaprivatecompanyfor¤ ‘Show’ valuations
n Curiosity:Howmuchismybusinessreallyworth?n Legalpurposes:Estatetaxanddivorcecourt
¤ Transactionvaluationsn Saleorprospectivesaletoanotherindividualorprivateentity.n Saleofonepartner’sinteresttoanothern Saletoapubliclytradedfirm
¤ Aspreludetosettingtheofferingpriceinaninitialpublicoffering¨ Youcanvalueadivisionordivisionsofapubliclytradedfirm
¤ Aspreludetoaspinoff¤ Forsaletoanotherentity¤ Todoasum-of-the-partsvaluationtodeterminewhetherafirmwillbe
worthmorebrokenuporifitisbeingefficientlyrun.
Aswath Damodaran
128

129
Privatecompanyvaluations:Fourbroadscenarios
¨ Privatetoprivatetransactions:Youcanvalueaprivatebusinessforsalebyoneindividualtoanother.
¨ Privatetopublictransactions:Youcanvalueaprivatefirmforsaletoapubliclytradedfirm.
¨ PrivatetoIPO:Youcanvalueaprivatefirmforaninitialpublicoffering.
¨ PrivatetoVCtoPublic:Youcanvalueaprivatefirmthatisexpectedtoraiseventurecapitalalongthewayonitspathtogoingpublic.
Aswath Damodaran
129

130
I.PrivatetoPrivatetransaction
¨ Inprivatetoprivatetransactions,aprivatebusinessissoldbyoneindividualtoanother.Therearethreekeyissuesthatweneedtoconfrontinsuchtransactions:¨ Neitherthebuyernorthesellerisdiversified.Consequently,risk
andreturnmodelsthatfocusonjusttheriskthatcannotbediversifiedawaywillseriouslyunderestimatethediscountrates.
¨ Theinvestmentisilliquid.Consequently,thebuyerofthebusinesswillhavetofactorinan“illiquiditydiscount” toestimatethevalueofthebusiness.
¨ Keypersonvalue:Theremaybeasignificantpersonalcomponenttothevalue.Inotherwords,therevenuesandoperatingprofitofthebusinessreflectnotjustthepotentialofthebusinessbutthepresenceofthecurrentowner.
Aswath Damodaran
130

131
Anexample:Valuingarestaurant
¨ AssumethatyouhavebeenaskedtovalueaupscaleFrenchrestaurantforsalebytheowner(whoalsohappenstobethechef).Boththerestaurantandthechefarewellregarded,andbusinesshasbeengoodforthelast3years.
¨ Thepotentialbuyerisaformerinvestmentbanker,whotiredoftheratrace,hasdecidetocashoutallofhissavingsandusetheentireamounttoinvestintherestaurant.
¨ Youhaveaccesstothefinancialstatementsforthelast3yearsfortherestaurant.Inthemostrecentyear,therestaurantreported$1.2millioninrevenuesand$400,000inpre-taxoperatingprofit.Whilethefirmhasnoconventionaldebtoutstanding,ithasaleasecommitmentof$120,000eachyearforthenext12years.
Aswath Damodaran
131

132
Pastincomestatements…
3 years ago
2 years ago Last year
Revenues $800 $1,100 $1,200 Operating at full capacity- Operating lease expense $120 $120 $120 (12 years left on the lease)
- Wages $180 $200 $200(Owner/chef does not draw salary)
- Material $200 $275 $300 (25% of revenues)- Other operating expenses $120 $165 $180 (15% of revenues)Operating income $180 $340 $400- Taxes $72 $136 $160 (40% tax rate)Net Income $108 $204 $240
All numbers are in thousands
Aswath Damodaran
132

133
Step1:Estimatingdiscountrates
¨ Conventionalriskandreturnmodelsinfinancearebuiltonthepresumptionthatthemarginalinvestorsinthecompanyarediversifiedandthattheythereforecareonlyabouttheriskthatcannotbediversified.Thatriskismeasuredwithabetaorbetas,usuallyestimatedbylookingatpastpricesorreturns.
¨ Inthisvaluation,bothassumptionsarelikelytobeviolated:¤ Asaprivatebusiness,thisrestauranthasnomarketpricesorreturnstouseinestimation.
¤ Thebuyerisnotdiversified.Infact,hewillhavehisentirewealthtiedupintherestaurantafterthepurchase.
Aswath Damodaran
133

134
Nomarketprice,noproblem…Usebottom-upbetastogettheunleveredbeta
¨ Theaverageunleveredbetaacross75publiclytradedrestaurantsintheUSis0.86.
¨ Acaveat:Mostofthepubliclytradedrestaurantsonthislistarefast-foodchains(McDonald’s,BurgerKing)ormassrestaurants(Applebee’s,TGIF…)Thereisanargumenttobemadethatthebetaforanupscalerestaurantismorelikelytobereflecthigh-endspecialtyretailersthanitisrestaurants.Theunleveredbetafor45high-endretailersis1.18.
Aswath Damodaran
134

80 unitsof firm specificrisk
20 units of market risk
Private owner of businesswith 100% of your weatlthinvested in the business
Publicly traded companywith investors who are diversified
Is exposedto all the riskin the firm
Demands acost of equitythat reflects thisrisk
Eliminates firm-specific risk in portfolio
Demands acost of equitythat reflects only market risk
Market Beta measures justmarket risk
Total Beta measures all risk= Market Beta/ (Portion of the total risk that is market risk)
Private Owner versus Publicly Traded Company Perceptions of Risk in an Investment
Aswath Damodaran135

136
Estimatingatotalbeta
¨ Togetfromthemarketbetatothetotalbeta,weneedameasureofhowmuchoftheriskinthefirmcomesfromthemarketandhowmuchisfirm-specific.
¨ Lookingattheregressionsofpubliclytradedfirmsthatyieldthebottom-upbetashouldprovideananswer.¤ TheaverageR-squaredacrossthehigh-endretailerregressionsis25%.¤ Sincebetasarebasedonstandarddeviations(ratherthanvariances),
wewilltakethecorrelationcoefficient(thesquarerootoftheR-squared)asourmeasureoftheproportionoftheriskthatismarketrisk.
¨ TotalUnleveredBeta=MarketBeta/Correlationwiththemarket=1.18/0.5=2.36
Aswath Damodaran
136

137
Thefinalstepinthebetacomputation:EstimateaDebttoequityratioandcostofequity
¨ Withpubliclytradedfirms,were-leverthebetausingthemarketD/Eratioforthefirm.Withprivatefirms,thisoptionisnotfeasible.Wehavetwoalternatives:¤ Assumethatthedebttoequityratioforthefirmissimilartotheaverage
marketdebttoequityratioforpubliclytradedfirmsinthesector.¤ Useyourestimatesofthevalueofdebtandequityastheweightsinthe
computation.(Therewillbeacircularreasoningproblem:youneedthecostofcapitaltogetthevaluesandthevaluestogetthecostofcapital.)
¨ Wewillassumethatthisprivatelyownedrestaurantwillhaveadebttoequityratio(14.33%)similartotheaveragepubliclytradedrestaurant(eventhoughweusedretailerstotheunleveredbeta).¤ Leveredbeta=2.36(1+(1-.4)(.1433))=2.56¤ Costofequity=4.25%+2.56(4%)=14.50%(TBondratewas4.25%atthetime;4%istheequityriskpremium)
Aswath Damodaran
137

138
Estimatingacostofdebtandcapital
¨ Whilethefirmdoesnothavearatingoranyrecentbankloanstouseasreference,itdoeshaveareportedoperatingincomeandleaseexpenses(treatedasinterestexpenses)CoverageRatio=OperatingIncome/Interest(Lease)Expense
=400,000/120,000=3.33Ratingbasedoncoverageratio=BB+ Defaultspread=3.25%After-taxCostofdebt=(Riskfree rate+Defaultspread)(1– taxrate)
=(4.25%+3.25%)(1- .40)=4.50%¨ Tocomputethecostofcapital,wewillusethesameindustry
averagedebtratiothatweusedtoleverthebetas.¤Costofcapital=14.50%(100/114.33)+4.50%(14.33/114.33)=13.25%¤(Thedebttoequityratiois14.33%;thecostofcapitalisbasedonthedebttocapitalratio)
Aswath Damodaran
138

139
Step2:Cleanupthefinancialstatements
Stated AdjustedRevenues $1,200 $1,200- Operating lease expenses $120 Leases are financial expenses- Wages $200 $350 ! Hire a chef for $150,000/year- Material $300 $300- Other operating expenses $180 $180Operating income $400 $370- Interest expnses $0 $69.62 7.5% of $928.23 (see below)Taxable income $400 $300.38- Taxes $160 $120.15Net Income $240 $180.23
Debt 0 $928.23 ! PV of $120 million for 12 years @7.5%
Aswath Damodaran
139

140
Step3:Assesstheimpactofthe“key” person
¨ Partofthedrawoftherestaurantcomesfromthecurrentchef.Itispossible(andprobable)thatifhesellsandmoveson,therewillbeadropoffinrevenues.Ifyouarebuyingtherestaurant,youshouldconsiderthisdropoffwhenvaluingtherestaurant.Thus,if20%ofthepatronsaredrawntotherestaurantbecauseofthechef’sreputation,theexpectedoperatingincomewillbelowerifthechefleaves.¤ Adjustedoperatingincome(existingchef)=$370,000¤ Operatingincome(adjustedforchefdeparture)=$296,000
¨ Astheowner/chefoftherestaurant,whatmightyoubeabletodotomitigatethislossinvalue?
Aswath Damodaran
140

141
Step4:Don’tforgetvaluationfundamentals
¨ Tocompletethevaluation,youneedtoassumeanexpectedgrowthrate.Aswithanybusiness,assumptionsaboutgrowthhavetobeconsistentwithreinvestmentassumptions.Inthelongterm,Reinvestmentrate=Expectedgrowthrate/Returnoncapital
¨ Inthiscase,wewillassumea2%growthrateinperpetuityanda20%returnoncapital.
Reinvestmentrate=g/ROC=2%/20%=10%¨ Eveniftherestaurantdoesnotgrowinsize,thisreinvestment
iswhatyouneedtomaketokeeptherestaurantbothlookinggood(remodeling)andworkingwell(newovensandappliances).
Aswath Damodaran
141

142
Step5:Completethevaluation
¨ Inputstovaluation¤ AdjustedEBIT=$296,000¤ Taxrate=40%¤ Costofcapital=13.25%¤ Expectedgrowthrate=2%¤ Reinvestmentrate(RIR)=10%
¨ ValuationValueoftherestaurant=ExpectedFCFFnextyear/(Costofcapital–g)=ExpectedEBITnextyear(1- taxrate)(1- RIR)/(Costofcapital–g)
=296,000(1.02)(1-.4)(1-.10)/(.1325- .02)=$1.449million
Valueofequityinrestaurant=$1.449million- $0.928million(PVofleases)b=$0.521million
Aswath Damodaran
142

143
Step6:Considertheeffectofilliquidity
¨ Inprivatecompanyvaluation,illiquidityisaconstanttheme.Allthetalk,though,seemstoleadtoaruleofthumb.Theilliquiditydiscountforaprivatefirmisbetween20-30%anddoesnotvaryacrossprivatefirms.
¨ Butilliquidityshouldvaryacross:¤ Companies:Healthierandlargercompanies,withmoreliquidassets,shouldhavesmallerdiscountsthanmoney-losingsmallerbusinesseswithmoreilliquidassets.
¤ Time:Liquidityisworthmorewhentheeconomyisdoingbadlyandcreditistoughtocomebythanwhenmarketsarebooming.
¤ Buyers:Liquidityisworthmoretobuyerswhohaveshortertimehorizonsandgreatercashneedsthanforlongerterminvestorswhodon’tneedthecashandarewillingtoholdtheinvestment.
Aswath Damodaran
143

144
TheStandardApproach:Illiquiditydiscountbasedonilliquidpubliclytradedassets
¨ Restrictedstock:ThesearestockissuedbypubliclytradedcompaniestothemarketthatbypasstheSECregistrationprocessbutthestockcannotbetradedforoneyearaftertheissue.
¨ Pre-IPOtransactions:Thesearetransactionspriortoinitialpublicofferingswhereequityinvestorsintheprivatefirmbuy(sell)eachother’sstakes.
¨ Inbothcases,thediscountisestimatedthebethedifferencebetweenthemarketpriceoftheliquidassetandtheobservedtransactionpriceoftheilliquidasset.¤ DiscountRestrictedstock=Stockprice– Priceonrestrictedstockoffering
¤ DiscountIPO =IPOofferingprice– Priceonpre-IPOtransaction
Aswath Damodaran
144

145
TheRestrictedStockDiscount
¨ Aggregatediscountstudies¤ Maherexaminedrestrictedstockpurchasesmadebyfourmutualfundsinthe
period1969-73andconcludedthattheytradedanaveragediscountof35.43%onpubliclytradedstockinthesamecompanies.
¤ Moroney reportedameandiscountof35%foracquisitionsof146restrictedstockissuesby10investmentcompanies,usingdatafrom1970.
¤ Inastudyofrestrictedstockofferingsfromthe1980s,Silber(1991)findsthatthemediandiscountforrestrictedstockis33.75%.
¨ Silberrelatedthesizeofthediscounttocharacteristicsoftheoffering:LN(RPRS)=4.33+0.036LN(REV)- 0.142LN(RBRT)+0.174DERN+0.332DCUST¤ RPRS=Relativepriceofrestrictedstock(topubliclytradedstock)¤ REV=Revenuesoftheprivatefirm(inmillionsofdollars)¤ RBRT=RestrictedBlockrelativetoTotalCommonStockin%¤ DERN=1ifearningsarepositive;0ifearningsarenegative;¤ DCUST=1ifthereisacustomerrelationshipwiththeinvestor;0otherwise;
Aswath Damodaran
145

146
CrosssectionaldifferencesinIlliquidity:ExtendingtheSilberregression
Figure 24.1: Illiquidity Discounts: Base Discount of 25% for profitable firm with $ 10 million in revenues
0.00%
5.00%
10.00%
15.00%
20.00%
25.00%
30.00%
35.00%
40.00%
5 10 15 20 25 30 35 40 45 50 100 200 300 400 500 1000Revenues
Dis
coun
t as %
of V
alue
Profitable firm Unprofitable firm
Aswath Damodaran
146

147
TheIPOdiscount:Pricingonpre-IPOtransactions(in5monthspriortoIPO)
Aswath Damodaran
147
148
The“sampling” problem
¨ WithbothrestrictedstockandtheIPOstudies,thereisasignificantsamplingbiasproblem.¤ Thecompaniesthatmakerestrictedstockofferingsarelikelytobe
small,troubledfirmsthathaverunoutofconventionalfinancingoptions.
¤ ThetypesofIPOswhereequityinvestorsselltheirstakeinthefivemonthspriortotheIPOatahugediscountarelikelytobeIPOsthathavesignificantpricinguncertaintyassociatedwiththem.
¨ Withrestrictedstock,themagnitudeofthesamplingbiaswasestimatedbycomparingthediscountonallprivateplacementstothediscountonrestrictedstockofferings.Onestudyconcludedthatthe“illiquidity” aloneaccountedforadiscountoflessthan10%(leavingthebalanceof20-25%tobeexplainedbysamplingproblems).
Aswath Damodaran
148

149
Analternativeapproach:Usethewholesample¨ Alltradedassetsareilliquid.Thebidaskspread,measuringthe
differencebetweenthepriceatwhichyoucanbuyandselltheassetatthesamepointintimeistheilliquiditymeasure.
¨ Wecanregressthebid-askspread(asapercentoftheprice)againstvariablesthatcanbemeasuredforaprivatefirm(suchasrevenues,cashflowgeneratingcapacity,typeofassets,varianceinoperatingincome)andarealsoavailableforpubliclytradedfirms.
¨ Usingdatafromtheendof2000,forinstance,weregressedthebid-askspreadagainstannualrevenues,adummyvariableforpositiveearnings(DERN:0ifnegativeand1ifpositive),cashasapercentoffirmvalueandtradingvolume.Spread=0.145– 0.0022ln(AnnualRevenues)-0.015(DERN)– 0.016(Cash/FirmValue)– 0.11($Monthlytradingvolume/FirmValue)Youcouldpluginthevaluesforaprivatefirmintothisregression(withzerotradingvolume)andestimatethespreadforthefirm.
Aswath Damodaran
149

150
EstimatingtheilliquiditydiscountfortherestaurantApproach used Estimated discount Value of restaurantBludgeon (Fixed discount) 25% $0.521 (1- .25) = $0.391
millionRefined Bludgeon (Fixed discount with adjustment for revenue size/ profitability)
28.75% (Silber adjustment for small revenues and positive profits to a base discount of 25%)
$0.521 (1-.2875) = $0.371 million
Bid-ask spread regression = 0.145 – 0.0022 ln (1.2) -0.015 (1) –0.016 (.05) – 0.11 (0)= 12.88%
$0.521 (1-.1288) = $0.454 million
Aswath Damodaran
150
151
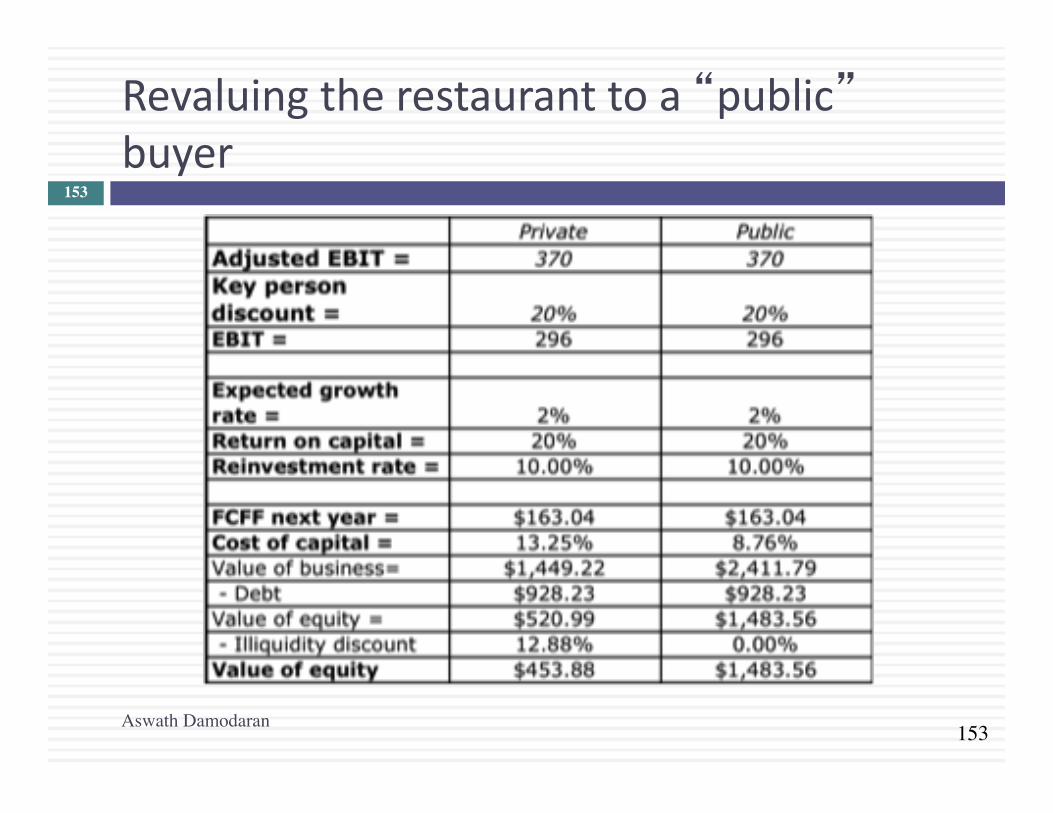
II.Privatecompanysoldtopubliclytradedcompany¨ Thekeydifferencebetweenthisscenarioandthepreviousscenarioisthatthesellerofthebusinessisnotdiversifiedbutthebuyeris(oratleasttheinvestorsinthebuyerare).Consequently,theycanlookatthesamefirmandseeverydifferentamountsofriskinthebusinesswiththesellerseeingmoreriskthanthebuyer.
¨ Thecashflowsmayalsobeaffectedbythefactthatthetaxratesforpubliclytradedcompaniescandivergefromthoseofprivateowners.
¨ Finally,thereshouldbenoilliquiditydiscounttoapublicbuyer,sinceinvestorsinthebuyercanselltheirholdingsinamarket.
Aswath Damodaran
151

152
Revisitingthecostofequityandcapital:RestaurantValuation
Private Public
Unlevred beta 2.36 1.18
Debt to equity ratio 14.33% 14.33%
Tax rate 40% 40%
Pre-tax cost of debt 7.50% 7.50%
Levered beta 2.56 1.28
Riskfree rate 4.25% 4.25%
Equity risk premium 4% 4%
Cost of equity 14.5% 9.38%
After-tax cost of debt 4.50% 4.50%
Cost of capital 13.25% 8.76%
Aswath Damodaran
152
153
Revaluingtherestauranttoa“public”buyer
Aswath Damodaran
153

154
So,whatpriceshouldyouaskfor?
¨ Assumethatyourepresentthechef/owneroftherestaurantandthatyouwereaskingfora“reasonable” pricefortherestaurant.Whatwouldyouaskfor?
a. $454,000b. $1.484millionc. Somenumberinthemiddle¨ Ifitis“somenumberinthemiddle”,whatwilldetermine
whatyouwillultimatelygetforyourbusiness?
¨ Howwouldyoualtertheanalysis,ifyourbestpotentialbidderisaprivateequityorVCfundratherthanapubliclytradedfirm?
Aswath Damodaran
154
155
III.Privatecompanyforinitialpublicoffering
¨ Inaninitialpublicoffering,theprivatebusinessisopeneduptoinvestorswhoclearlyarediversified(oratleasthavetheoptiontobediversified).
¨ Therearecontrolimplicationsaswell.Whenaprivatefirmgoespublic,itopensitselfuptomonitoringbyinvestors,analystsandmarket.
¨ Thereportingandinformationdisclosurerequirementsshifttoreflectapubliclytradedfirm.
Aswath Damodaran
155

Aswath Damodaran156
Terminal year (11)EBIT (1-t) $1,849
- Reinvestment $ 416FCFF $1,433
Terminal Value10= 1433/(.08-.027) = $27.036
Cost of capital = 11.32% (.983) + 5.16% (.017) = 11.22%
90% advertising (1.44) + 10% info svcs (1.05)
Risk Premium6.15%
Operating assets $9,611+ Cash 375+ IPO Proceeds 1000- Debt 207Value of equity 10,779- Options 805Value in stock 9,974/ # of shares 574.44Value/share $17.36
Cost of Debt(2.7%+5.3%)(1-.40)= 5.16%
Stable Growthg = 2.7%; Beta = 1.00;
Cost of capital = 8% ROC= 12%;
Reinvestment Rate=2.7%/12% = 22.5%
Cost of Equity11.32% Weights
E = 98.31% D = 1.69%
Riskfree Rate:Riskfree rate = 2.7% +
Beta 1.40 X
Cost of capital decreases to 8% from years 6-10
D/E=1.71%
Twitter Pre-IPO Valuation: October 5, 2013
Revenue growth of 55% a year for 5 years, tapering down to 2.7% in year
10
Pre-tax operating
margin increases to 25% over the next 10 years
Sales to capital ratio of
1.50 for incremental
sales
Starting numbers
75% from US(5.75%) + 25% from rest of world (7.23%)
2012 Trailing+2013Revenues $316.9 $448.2Operating+Income ?$77.1 ?$92.9Adj+Op+Inc $4.3Invested+Capital $549.1Operating+Margin 0.96%Sales/Capital 0.82
1 2 3 4 5 6 7 8 9 10Revenues 694.7$33333333 1,076.8$3333 1,669.1$3333 2,587.1$3333 4,010.0$3333 5,796.0$3333 7,771.3$3333 9,606.8$3333 10,871.1$33 11,164.6$33Operating3Income 23.3$3333333333 62.0$3333333333 136.3$33333333 273.5$33333333 520.3$33333333 891.5$33333333 1,382.2$3333 1,939.7$3333 2,456.3$3333 2,791.2$3333Operating3Income3after3taxes 23.3$3333333333 62.0$3333333333 136.3$33333333 265.3$33333333 364.2$33333333 614.2$33333333 937.1$33333333 1,293.8$3333 1,611.4$3333 1,800.3$3333Reinvestment 164.3$33333333 254.7$33333333 394.8$33333333 612.0$33333333 948.6$33333333 1,190.7$3333 1,316.8$3333 1,223.7$3333 842.8$33333333 195.7$33333333FCFF (141.0)$333333 (192.7)$333333 (258.5)$333333 (346.6)$333333 (584.4)$333333 (576.5)$333333 (379.7)$333333 70.0$3333333333 768.5$33333333 1,604.6$3333

157
Thetwistsinaninitialpublicoffering
¨ Valuationissues:¤ Useoftheproceedsfromtheoffering:Theproceedsfromtheoffering
canbeheldascashbythefirmtocoverfutureinvestmentneeds,paidtoexistingequityinvestorswhowanttocashoutorusedtopaydowndebt.
¤ Warrants/Specialdealswithpriorequityinvestors:Ifventurecapitalistsandotherequityinvestorsfromearlieriterationsoffundraisinghaverightstobuyorselltheirequityatpre-specifiedprices,itcanaffectthevaluepershareofferedtothepublic.
¨ Pricingissues:¤ Institutionalset-up:MostIPOsarebackedbyinvestmentbanking
guaranteesontheprice,whichcanaffecthowtheyarepriced.¤ Follow-upofferings:Theproportionofequitybeingofferedatinitial
offeringandsubsequentofferingplanscanaffectpricing.
Aswath Damodaran
157

158
A.UseoftheProceeds
¨ Theproceedsfromaninitialpublicofferingcanbe¤ Takenoutofthefirmbytheexistingowners¤ Usedtopaydowndebtandotherobligations¤ Heldascashbythecompanytocoverfuturereinvestmentneeds
¨ Howyoudealwiththeissuancewilldependuponhowtheproceedsareused.¤ Iftakenoutofthefirm->Ignoreinvaluation¤ Ifusedtopaydowndebt->Changethedebtratio,whichmaychangethecostofcapitalandthevalueofthefirm
¤ Ifheldascashtocoverfuturereinvestmentneeds->AddthecashproceedsfromtheIPOtotheDCFvaluationofthecompany.
Aswath Damodaran
158

159
TheIPOProceeds:Twitter
¨ Howmuch? Newsstoriessuggestthatthecompanyisplanningonraisingabout$1billionfromtheoffering.
¨ Use:IntheTwitterprospectusfiling,thecompanyspecifiesthatitplanstokeeptheproceedsinthecompanytomeetfutureinvestmentneeds.¤ Inthevaluation,Ihaveaddedabilliontotheestimatedvalueoftheoperatingassetsbecausethatcashinfusionwillaugmentthecashbalance.
¨ Howwouldthevaluationhavebeendifferentiftheownersannouncedthattheyplannedtowithdrawhalfoftheofferingproceeds?
Aswath Damodaran
159

160
B.Claimsfrompriorequityinvestors
¨ Whenaprivatefirmgoespublic,therearealreadyequityinvestorsinthefirm,includingthefounder(s),venturecapitalistsandotherequityinvestors.Insomecases,theseequityinvestorscanhavewarrants,optionsorotherspecialclaimsontheequityofthefirm.
¨ Ifexistingequityinvestorshavespecialclaimsontheequity,thevalueofequitypersharehastobeaffectedbytheseclaims.Specifically,theseoptionsneedtobevaluedatthetimeoftheofferingandthevalueofequityreducedbytheoptionvaluebeforedeterminingthevaluepershare.
Aswath Damodaran
160

161
TheclaimsonTwitter’sequity
¨ TheoverallvaluethatweestimateforTwitter’sequityis$10,779million.Therearemultipleclaimsonthisequity.¤ Theownersofthecompanyownthecommonsharesinthecompany¤ Twitterhassevenclassesofconvertible,preferredstockonthecompany
(fromdifferentVCs).¤ Twitterhas86millionrestrictedstockunitsthatithasusedinemployee
compensation.¤ Twitterhas44.16millionunitsofemployeeoptions,alsousedin
compensationcontracts.(Strikeprice=$1.82,life=6.94years)¤ TwitterhasagreedtopayMoPubstockholderswith14.791millionshares.
¨ Theconvertiblepreferredshareswillbeconvertedatthetimeoftheofferingandthecommonsharesoutstandingwillbe472.61million,notcountingRSUsandoptions.Inthevaluation:¤ Numberofcommonsshares=574.44million(allbutoptions)¤ Optionvalue=$805million(withmaturitysetto3.47years)
Aswath Damodaran
161
162
C.TheInvestmentBankingguarantee…
¨ AlmostallIPOsaremanagedbyinvestmentbanksandarebackedbyapricingguarantee,wheretheinvestmentbankerguaranteestheofferingpricetotheissuer.
¨ Ifthepriceatwhichtheissuanceismadeislowerthantheguaranteedprice,theinvestmentbankerwillbuythesharesattheguaranteedpriceandpotentiallybeartheloss.
Aswath Damodaran
162

163
PricingversusValue
¨ EarlierIassessedthevalueofequityatTwittertobe$9.97billion(withavaluepershareof$17.36/share).
¨ Assume,however,thatthemarketappetiteforsocialmediastocksishighandthatyoupullupthevaluationsofotherpubliclytradedstocksinthemarket:
¨ Whatwouldyoubaseyourofferpriceon?Howwouldyousellit?
Aswath Damodaran
163

164
TheevidenceonIPOpricing
Aswath Damodaran
164

165
Aninvestmentopportunity?
¨ Assumethatinvestmentbankstrytounderpriceinitialpublicofferingsbyapproximately10-15%.Asaninvestor,whatstrategywouldyouadopttotakeadvantageofthisbehavior?
¨ Whymightitnotwork?
Aswath Damodaran
165

166
D.Theofferingquantity
¨ AssumenowthatyouaretheownerofTwitterandwereoffering100%ofthesharesincompanyintheofferingtothepublic?Ifinvestorsarewillingtopay$20billionforthecommonstock,howmuchdoyoulosebecauseoftheunderpricing(15%)?
¨ Assumethatyouwereofferingonly10%ofthesharesintheinitialofferingandplantosellalargeportionofyourremainingstakeoverthefollowingtwoyears?Wouldyourviewsoftheunderpricinganditseffectonyourwealthchangeasaconsequence?
Aswath Damodaran
166

167
IV.AnIntermediateProblemPrivatetoVCtoPublicoffering…¨ Assumethatyouhaveaprivatebusinessoperatinginasector,wherepubliclytraded
companieshaveanaveragebetaof1andwheretheaveragecorrelationoffirmswiththemarketis0.25.Considerthecostofequityatthreestages(Riskfreerate=4%;ERP=5%):
¨ Stage1:Thenascentbusiness,withaprivateowner,whoisfullyinvestedinthatbusiness.
PerceivedBeta=1/0.25=4
CostofEquity=4%+4(5%)=24%
¨ Stage2:Angelfinancingprovidedbyspecializedventurecapitalist,whoholdsmultipleinvestments,inhightechnologycompanies.(Correlationofportfoliowithmarketis0.5)
PerceivedBeta=1/0.5=2
CostofEquity=4%+2(5%)=14%
¨ Stage3:Publicoffering,whereinvestorsareretailandinstitutionalinvestors,withdiversifiedportfolios:
PerceivedBeta=1
CostofEquity=4%+1(5%)=9%
Aswath Damodaran
167

168
Tovaluethiscompany…
1 2 3 4 5Terminal
year
E(Cash flow) $100 $125 $150 $165 $170 $175Market beta 1 1 1 1 1 1Correlation 0.25 0.25 0.5 0.5 0.5 1Beta used 4 4 2 2 2 1Cost of equity 24.00% 24.00% 14.00% 14.00% 14.00% 9.00%Terminal value $2,500Cumulated COE 1.2400 1.5376 1.7529 1.9983 2.2780 2.4830PV $80.65 $81.30 $85.57 $82.57 $1,172.07
Value of firm $1,502 (Correct value, using changing costs of equity)
Value of firm $1,221 (using 24% as cost of equity forever. You will undervalue firm)
Value of firm $2,165 (Using 9% as cost of equity forever. You will overvalue firm)
Assume that this company will be fully owned by its current owner for two years, will access the technology venture capitalist at the start of year 3 and that is expected to either go public or be sold to a publicly traded firm at the end of year 5.
Growth rate 2% forever after year 5
175/ (.09-.02)
168

169
Implications
¨ Proposition1:Thevalueofaprivatebusinessthatisexpectedtotransitiontoapubliclytradedcompanywillbehigherthanthevalueofanotherwisesimilarprivatebusinessthatdoesnotexpecttomakethistransition.¤ Privatebusinessesinsectorsthatare“hot”intermsofgoingpublic(social
mediain2014)willbeworthmorethanprivatebusinessesinlesssexysectors.
¤ AsIPOsboom(bust)privatecompanyvaluationswillincrease(decrease).¤ Privatecompaniesincountriesthathaveeasyaccesstopublicmarketswill
havehighervaluethancompaniesincountrieswithoutthataccess.¨ Proposition2:Thevalueofaprivatebusinessthatexpectstomake
thetransitiontoapubliccompanysoonerwillbehigherthanthevalueofanotherwisesimilarcompanythatwilltakelonger.¤ Privatebusinesseswillbeworthmoreifcompaniesareabletogopublic
earlierintheirlifecycle.
Aswath Damodaran
169

170
Privatecompanyvaluation:Closingthoughts¨ Thevalueofaprivatebusinesswilldependonthepotentialbuyer.¨ Ifyouarethesellerofaprivatebusiness,youwillmaximizevalue,
ifyoucansellto¤ Alongterminvestor¤ Whoiswelldiversified(orwhoseinvestorsare)¤ Anddoesnotthinktoohighlyofyou(asaperson)
¨ Ifyouarevaluingaprivatebusinessforlegalpurposes(taxordivorcecourt),theassumptionsyouuseandthevalueyouarriveatwilldependonwhichsideofthelegaldivideyouareon.
¨ Asafinalproposition,alwayskeepinmindthattheownerofaprivatebusinesshastheoptionofinvestinghiswealthinpubliclytradedstocks.Therehastobearelationshipbetweenwhatyoucanearnonthoseinvestmentsandwhatyoudemandasareturnonyourbusiness.
Aswath Damodaran
170