Embed Size (px)
Citation preview

A
Assessment
VALU
t and Taxati
UATION O
20
Ass
ion Departm
OF INCOM
014 Gene
City sessment an
Febr
ment • Serv
E-PRODU
eral Asse
of Winnipegd Taxation D
ruary 6, 2013
vice de l’éva
UCING PR
essment
g Department3
aluation et d
ROPERTIE
des taxes
ES

TABLE OF CONTENTS
INTRODUCTION ........................................................................................................................................... 1 DATA COLLECTION .................................................................................................................................... 1 MODEL DESCRIPTION ................................................................................................................................. 2 VALUATION OF MULTI-FAMILY PROPERTIES.............................................................................................. 3
Market Regions ..................................................................................................................................... 3 Description of Multi-Family Inventory ................................................................................................. 5 Independent Variables .......................................................................................................................... 6 Calibration of the Sub-Models .............................................................................................................. 6
VALUATION OF OFFICE AND RETAIL PROPERTIES ...................................................................................... 7 Market Regions ..................................................................................................................................... 7 Description of Office and Retail Inventory ........................................................................................... 9 Independent Variables ........................................................................................................................ 10 Calibration of the Sub-models ............................................................................................................ 11
VALUATION OF INDUSTRIAL PROPERTIES ................................................................................................. 14 Market Regions ................................................................................................................................... 14 Description of Industrial Inventory ..................................................................................................... 16 Independent Variables ........................................................................................................................ 17 Calibration of the Sub-models ............................................................................................................ 17
TESTING AND EVALUATION OF THE MODELS ........................................................................................... 18 MIXED-USE PROPERTIES .......................................................................................................................... 18

February 6, 2013 City of Winnipeg Assessment and Taxation Department 1
Introduction This document provides an overview of the City of Winnipeg Assessment and Taxation Department’s mass appraisal models for income-producing properties for the 2014 general assessment. These models predict the full market value of the fee simple interest for each property as of the reference date of April 1, 2012. The income approach models described on the following pages are developed using multiple regression analysis. These models are comprised of sub-models which predict the potential income (rent, parking, and other), vacancy and collection loss, operating expenses, and capitalization rates. The ratio statistics for the income-producing models meet the Standard on Ratio Studies published by the International Association of Assessing Officers (approved January 2010).
Data Collection Physical Characteristics The physical descriptions of land and improvements are obtained and updated from field inspections, building plans, and property owners. This information is stored in the Assessment and Taxation Department’s CAMA database. Sales Basic details regarding transfers of land come from the provincial Land Titles Office. The sales are investigated to determine if they are arm’s-length transfers and good indicators of market value. Questionnaires mailed to the purchasers assist in this verification process. Rents, Vacancy, and Expenses Rents, vacancy rates, and operating expenses come primarily from questionnaires mailed to property owners. Also considered is rent, vacancy, and operating expense information in published reports (such as CMHC’s Rental Market Report, The Johnson Report, and reports published by various real estate firms). Additional information filed in connection with revisions/appeals is also used.

February 6, 2013 City of Winnipeg Assessment and Taxation Department 2
Model Description Income-producing properties are valued for assessment purposes using direct capitalization of net operating income (income approach). The basic equation for direct capitalization is as follows:
Market Value = Net Operating Income (NOI)
Capitalization Rate Net operating income is calculated as follows:
Net Operating Income = Potential Annual Income – Vacancy and collection loss – Non-recoverable Operating Expenses
February 6, 2013 City of Winnipeg Assessment and Taxation Department 3
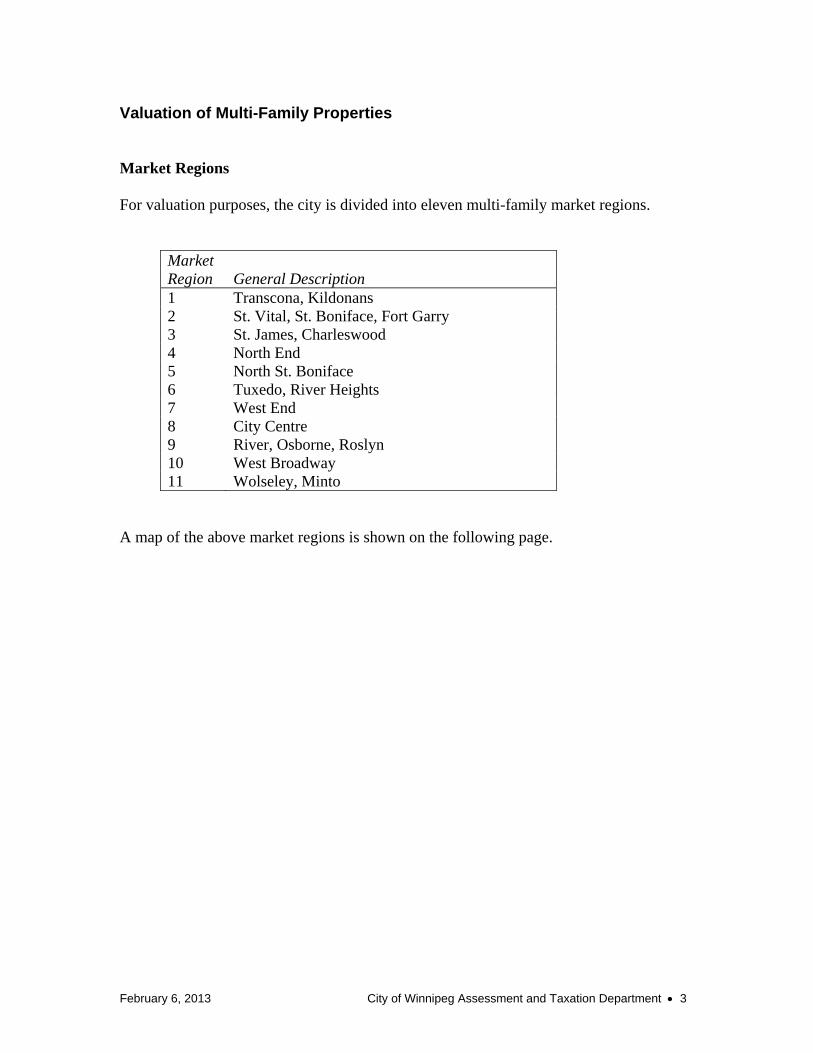
Valuation of Multi-Family Properties Market Regions For valuation purposes, the city is divided into eleven multi-family market regions.
Market Region General Description 1 Transcona, Kildonans 2 St. Vital, St. Boniface, Fort Garry 3 St. James, Charleswood 4 North End 5 North St. Boniface 6 Tuxedo, River Heights 7 West End 8 City Centre 9 River, Osborne, Roslyn 10 West Broadway 11 Wolseley, Minto
A map of the above market regions is shown on the following page.

Februa
ary 6, 2013 Cit
ty of Winnipeg Assessment aand Taxation Deepartment 44

February 6, 2013 City of Winnipeg Assessment and Taxation Department 5
Description of Multi-Family Inventory The following tables show the multi-family inventory profile by market region, age, unit count, and storey count. (All counts are approximate.)
Market Region Count1 3962 2463 1414 1205 1566 1557 2998 909 15510 11011 57Total 1,925
Effective Year Built CountBefore 1946 3331946 to 1959 4091960 to 1974 7191975 to 1997 3891998 or after 74Total 1,925
Unit Count Count12 or less 62613 to 30 60631 to 60 31561 or more 378Total 1,925
Storey Count Count5 or less 1,6936 or more 232Total 1,925

February 6, 2013 City of Winnipeg Assessment and Taxation Department 6
Independent Variables The variables that affect the estimated potential gross income (PGI)—which includes rent, parking, and other income—are as follows:
Market region Effective year built Quality Number of rental units Total gross floor area Average rental unit size Unit type mix Amount of parking Amenities Site influences
Calibration of the Sub-Models Potential Gross Income (PGI) The PGI estimates generated by the model range from $300 to $1,465 per unit per month; the median is $642. Most of the PGI estimates fall between $527 and $800 (20th and 80th percentiles). Vacancy and Collection Loss The two vacancy and collection loss rates in the model are 1.4% for market regions 4 and 7 and 1.1% for all other market regions. Operating Expenses The operating expenses generated by the model range from 38.9% to 63.5% of effective gross income (EGI); the median is 50.2%. (EGI is the potential gross income less vacancy and collection loss.) Capitalization Rates Capitalization rates for the sold properties are calculated by dividing the model-generated NOI estimates by sale prices that are time-adjusted to April 1, 2012. Analysis of these rates result in model capitalization rates ranging from 5.25% to 7.75%.

February 6, 2013 City of Winnipeg Assessment and Taxation Department 7
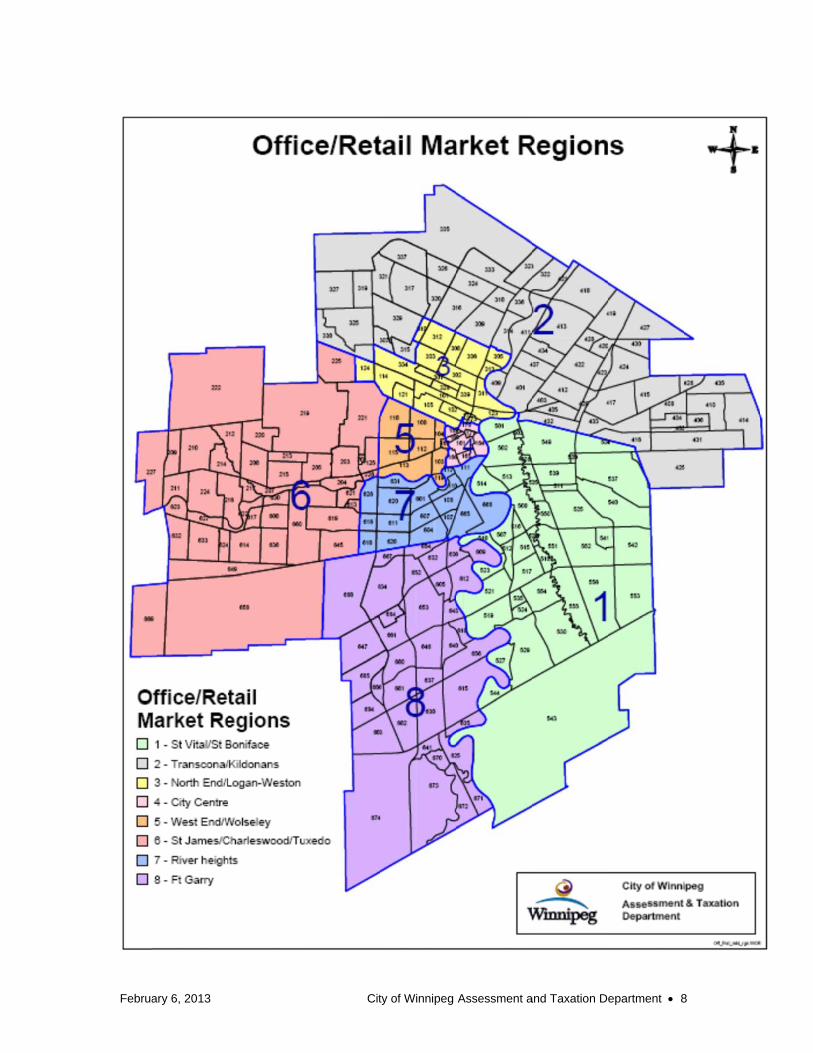
Valuation of Office and Retail Properties Market Regions For valuation purposes, the city is divided into eight office-retail market regions.
Market Region General Description 1 St. Vital, St Boniface 2 Transcona, Kildonans 3 North End, Logan, Weston 4 City Centre 5 West End, Wolseley 6 St. James, Charleswood, Tuxedo 7 River Heights 8 Fort Garry
A map of the above market regions is shown on the following page.
Februa
ary 6, 2013 Citty of Winnipeg Assessment aand Taxation Deepartment 88

February 6, 2013 City of Winnipeg Assessment and Taxation Department 9
Description of Office and Retail Inventory The following tables show the office and retail inventory profile by market region, age, and building size. (All counts are approximate.)
Market Region Count
Office Retail1 174 3002 123 3903 136 3874 231 1235 115 3066 104 2637 139 2628 81 122Total 1,103 2,153
Effective Year Built
Count Office Retail
Before 1926 61 1981926 to 1945 74 2511946 to 1974 438 7961975 to 1997 404 682After 1997 126 226Total 1,103 2,153
Size (sq. ft.) Count
Office Retail5,000 or less 485 1,3805,001 to 15,000 342 46915,001 to 30,000 105 12930,001 or more 171 175Total 1,103 2,153

February 6, 2013 City of Winnipeg Assessment and Taxation Department 10
Independent Variables The variables that affect the estimated potential rental income are as follows:
Market region Effective year built Quality Property type Leasable area Tenant class Premise location Amount of parking Site influences
Office Property Types OFA Office–Class A OFB Office–Class B OFC Office–Class C (3 storeys or more) OFD Office–Old–Downtown (3 storeys or more) OFS Office (1-2 storeys; 3 storey suburban) OFM Office–Medical/Dental OFR Office–Converted from residential BNK Banks & Credit Unions
Retail Property Types CSC Community Shopping Centre NSC Neighbourhood Shopping Centre RET Retail RRC Retail–Converted from residential RSC Regional Shopping Centre RST Restaurant RWC Retail Warehouse SKP Store/Kiosk with fuel pumps SUM Supermarket VCD Vehicle Dealership VCW Car Washes VSG Vehicle Service Garage (repair)
Parking Property Types PKL Parking Lot PST Parking Structure

February 6, 2013 City of Winnipeg Assessment and Taxation Department 11
Tenant class A1 High Quality Office/Retail Finish A2 High Quality Restaurant (including free-standing chains) C1 Retail Warehouse C2 Standard Office/Retail/Industrial Finish C3 Food Court C4 Standard Quality Restaurant (including non-free-standing chains) C5 Kiosks & Small Service C6 Storage or Mezzanine C7 Government C8 Cinema C9 Basement Leasable Space (Office or Retail) O8 Substandard Basement/Storage Finish
Calibration of the Sub-models Potential Rental Income Most of the net rents generated by the model fall between $9.41 and $16.18 per square foot (20th and 80th percentiles); the median is $12.51. Parking Income The net monthly incomes per stall for surface parking lots and parking structures are shown in the table below. These income rates are net of vacancy loss and operating expenses.
Parking Type Location Net income per stall ($)
Surface NCAs 161, 164, 168, 170, 171 (green area)
75.00
Surface NCAs 102, 105, 165, 166, 169, 172, 173, 502, 513 (yellow area)
50.00
Surface All other NCAs (blue area) 25.00 Structure (heated) All areas 110.00 Structure (unheated) All areas 85.00

February 6, 2013 City of Winnipeg Assessment and Taxation Department 12
Vacancy and Collection Loss
Property Type Rate(%)Office–Class A 5.0Office–Class B 8.0Office–Class C 7.0Office–Class D 15.0Office–Class S, M, and converted residence 9.5Bank/Credit Union 2.0Retail, including converted residence 5.0Store/Kiosk with fuel pumps 5.0Retail Warehouse/Supermarket 2.0Restaurant 4.0Community Shopping Centre 4.5Neighbourhood Shopping Centre 4.5Polo Park Shopping Centre 2.0St. Vital Shopping Centre 2.0Kildonan Place Shopping Centre 2.0Garden City Shopping Centre 4.5Portage Place Shopping Centre 4.5The Forks 4.5Vehicle Dealership 5.0Car Wash 2.0Vehicle Service Garage 5.0
CENTRALPARK
169
WESTALEXANDER
105
CENTENNIAL102
BROADWAY-ASSINIBOINE
165
LEGISLATURE166
THE FORKS164
NORWOOD EAST513
CENTRALST. BONIFACE
502
CIVICCENTRE
173
CHINATOWN
172
EXCHANGEDISTRICT
170
PORTAGE-ELLICE168
PORTAGE &MAIN171
SOUTH PORTAGE161
February 6, 2013 City of Winnipeg Assessment and Taxation Department 13
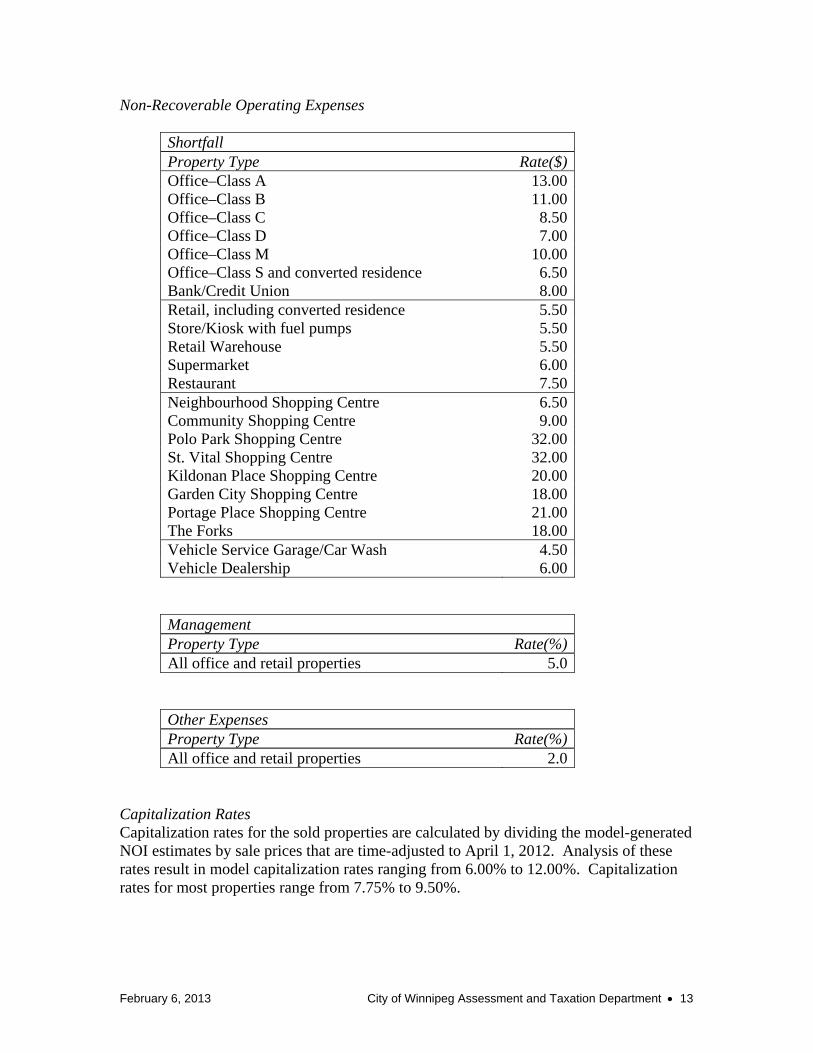
Non-Recoverable Operating Expenses
Shortfall Property Type Rate($)Office–Class A 13.00Office–Class B 11.00Office–Class C 8.50Office–Class D 7.00Office–Class M 10.00Office–Class S and converted residence 6.50Bank/Credit Union 8.00Retail, including converted residence 5.50Store/Kiosk with fuel pumps 5.50Retail Warehouse 5.50Supermarket 6.00Restaurant 7.50Neighbourhood Shopping Centre 6.50Community Shopping Centre 9.00Polo Park Shopping Centre 32.00St. Vital Shopping Centre 32.00Kildonan Place Shopping Centre 20.00Garden City Shopping Centre 18.00Portage Place Shopping Centre 21.00The Forks 18.00Vehicle Service Garage/Car Wash 4.50Vehicle Dealership 6.00
Management Property Type Rate(%)All office and retail properties 5.0
Other Expenses Property Type Rate(%)All office and retail properties 2.0
Capitalization Rates Capitalization rates for the sold properties are calculated by dividing the model-generated NOI estimates by sale prices that are time-adjusted to April 1, 2012. Analysis of these rates result in model capitalization rates ranging from 6.00% to 12.00%. Capitalization rates for most properties range from 7.75% to 9.50%.

February 6, 2013 City of Winnipeg Assessment and Taxation Department 14
Valuation of Industrial Properties Market Regions For valuation purposes, the city is divided into six industrial market regions.
Market Region General Description 1 Old and West Kildonan 2 North and East Kildonan, Transcona, New St.
Vital and New St. Boniface 3 Old St. Vital and Old St. Boniface 4 Fort Garry, Charleswood, Tuxedo, River
Heights, and St. James West 5 St. James East 6 City Centre, West End, North End, and Fort
Rouge A map of the above market regions is shown on the following page.

Februa
ary 6, 2013 Cit
ty of Winnipeg Assessment aand Taxation Deepartment 115

February 6, 2013 City of Winnipeg Assessment and Taxation Department 16
Description of Industrial Inventory The following tables show the industrial inventory profile by market region, age, and building size. (All counts are approximate.)
Market Region Count1 3372 2723 2164 2475 2806 680Total 2,032
Effective Year Built CountBefore 1955 3521955 to 1979 1,0441980 to 1994 4351995 or after 201Total 2,032
Size (sq. ft.) Count6,000 or less 4666,001 to 15,000 55815,001 to 40,000 54140,001 to 100,000 350Over 100,000 117Total 2,032

February 6, 2013 City of Winnipeg Assessment and Taxation Department 17
Independent Variables The variables that affect the estimated potential rental income are as follows:
Market region Effective year built Quality Property type Leasable area Tenant class Wall height Land area
Industrial Property Types DWH Distribution Warehouse FWF Flex Warehouse – minimum 20% finish FWS Flex Warehouse – standard LWH Loft Warehouse MWH Manufacturing – Heavy MWL Manufacturing – Light SWH Storage Warehouse TRW Transit Warehouse – Truck Terminal
Tenant class C2 Standard Office/Retail/Industrial Finish C6 Mezzanine O8 Substandard Basement/Storage Finish
Calibration of the Sub-models Potential Rental Income Most of the net rents generated by the model fall between $4.01 and $6.35 per square foot (20th and 80th percentiles); the median is $5.41. Vacancy and Collection Loss
Type/Location RateLoft Warehouse 12.0%Market region 5 5.0%Market region 6 6.0%All other regions 3.5%

February 6, 2013 City of Winnipeg Assessment and Taxation Department 18
Non-recoverable Operating Expenses
Shortfall Property Type Rate($)All industrial properties 3.50
Management Property Type RateAll industrial properties 5.0%
Other Expenses Property Type RateAll industrial properties 2.0%
Capitalization Rates Capitalization rates for the sold properties are calculated by dividing the model-generated NOI estimates by sale prices that are time-adjusted to April 1, 2012. Analysis of these rates result in model capitalization rates ranging from 5.75% to 11.00%. Capitalization rates for most properties range from 7.00% to 8.75%.
Testing and Evaluation of the Models The ratio statistics for the income-producing models meet the Standard on Ratio Studies published by the International Association of Assessing Officers (approved January 2010).
Mixed-Use Properties Properties with a combination of residential, office, retail, or industrial space are valued by applying the appropriate model to the income stream from each type of space. The total property value is the sum of the capitalized values of each income stream.