Embed Size (px)
Citation preview

National Environmental Research InstituteMinistry of the Environment . Denmark
Valuation of groundwater protection versus water treatment in Denmark by Choice Experiments and Contingent ValuationNERI Technical Report No. 543

[Blank page]

National Environmental Research InstituteMinistry of the Environment
Valuation of groundwater protection versus water treatment in Denmark by Choice Experiments and Contingent ValuationNERI Technical Report No. 5432005
Berit HaslerThomas LundhedeLouise MartinsenSune NeyeJesper S. Schou

Data sheet
Title: Valuation of groundwater protection versus water treatment in Denmark by ChoiceExperiments and Contingent Valuation
Authors: Berit Hasler, Thomas Lundhede, Louise Martinsen, Sune Neye and Jesper S. SchouDepartment: Department of Policy Analysis
Serial title and no.: NERI Technical Report No. 543
Publisher: National Environmental Research Institute Ministry of the Environment
URL: http://www.dmu.dk
Date of publication: June 2005Editing complete: May 2005
Referees: Thomas Bue Bjørner, Danish Economic Council and Wictor Adamowicz, Universityof Alberta, Canada.
Financial support: Danish Environmental Protection Agency, konto 14/54 (funding for research anddevelopment); Danish Environmental Protection Agency “Teknologiudviklingspro-gram” and National Environmental Research Institute, Denmark.
Please cite as: Hasler, B., Lundhede, T., Martinsen, L., Neye, S. & Schou J.S. 2005: Valuation ofgroundwater protection versus water treatment in Denmark by Choice Experimentsand Contingent Valuation. National Environmental Research Institute, Denmark. 176pp. - NERI Technical Report no. 543. http://technical-reports.dmu.dk.
Reproduction is permitted, provided the source is explicitly acknowledged.
Abstract: The benefits of groundwater protection are estimated to assess the non-marketedbenefits associated with increased protection of the groundwater resource, as com-pared to purification of groundwater for drinking water purposes. The study com-prises valuation of the effects on both drinking water quality and the quality of sur-face water recipients, expressed by the quality of the living conditions for wild ani-mals, fish and plants in lakes and waterways. The methods Discrete Choice Experi-ments method (CE) and Contingent valuation (CV) are used for the valuation. Theresults indicate that there is a significant positive willingness to pay for groundwaterprotection, where the willingness to pay for drinking water quality exceeds that forsurface water quality. The value of groundwater protection exceeds that from purifi-cation, and this result supports the current Danish groundwater policy and the aim ofthe Water Framework Directive that aims at a holistic management government ofthe aquatic environment.
Keywords: Groundwater protection, drinking water quality, surface water quality, purification,willingness to pay, valuation.
Layout: Ann-Katrine Holme Christoffersen
ISBN: 87-7772-877-7ISSN (electronic): 1600-0048
Number of pages: 176
Internet version: The report is available only in electronic format from NERI’s homepage http://www2.dmu.dk/1_viden/2_Publikationer/3_fagrapporter/rapporter/FR543.pdf
For sale at: Ministry of the EnvironmentFrontlinienRentemestervej 8DK-2400 Copenhagen NVDenmarkTel. +45 70 12 02 [email protected]

Contents
Preface 7
Dansk sammendrag 9
Summary and conclusions 11
1 Background and aim of the study 161.1 Background 161.2 Sources of groundwater pollution 171.3 Valuation by use of stated preferences: the Contingent Valuation and the Choice
Experiment methods 181.4 Prior valuation results on water quality with CV and CE 191.5 Objectives and hypotheses in the study 201.6 Content of the report 21
2 The valuation scenarios 232.1 Groundwater quality – status and indicators for valuation 23
2.1.1 Status for nitrate and pesticides in drinking water 232.1.2 Status for surface water quality 25
2.2 Indicators used in former groundwater valuation studies 282.3 The choice of indicators in the present study 29
2.3.1 The indicators in the CE and CV studies 312.4 The scenarios 33
2.4.1 The status quo-scenario - the current situation 332.4.2 Protection scenario: Improved protection in drinking water areas 342.4.3 Purification scenario - Groundwater treated for drinking water supply 35
3 The part of the CV and the CE studies common to both 363.1 The stages in a stated preference study 36
3.1.1 Basic assumptions 363.1.2 Hypothetical bias and scope 363.1.3 The design of a stated preference study 383.1.4 The introductory information and questions 38
3.2 The payment vehicle in the surveys 403.2.1 The WTP questions and choice of a reliable payment vehicle 403.2.2 The budget constraint and “cheap talk” 41
3.3 Additional questions 423.3.1 Starting questions - attitudes, opinions, knowledge and use 423.3.2 Debriefing and follow up-questions 433.3.3 Socio-demographic questions 453.3.4 Survey mode and sample size 45
3.4 Socio-economic characteristics, attitudes and habits: The responses to the commonpart of the questionnaires 46
3.4.1 Socio-economic comparison between the sample and the population 46

3.4.2 Comparison of habits in the sample and in the Danish population 49
4 Application of the Choice Experiment method 514.1 The CE method 514.2 Developing the CE part of the questionnaire 52
4.2.1 The Attributes Defining the Alternatives. 524.2.2 Composition of the Choice Sets 534.2.3 Sample Size for the CE blocks 554.2.4 The Experimental Design 56
5 Application of the Contingent Valuation Method 625.1 Elicitation of WTP in the CV survey 62
5.1.1 Questions formats 625.1.2 The payment card in the present CV- survey 635.1.3 The scenarios 645.1.4 Debriefing questions in CV : The opportunity to define protests and
confidence 64
6 Results of the CE survey 666.1 Response statistics 666.2 Non parametric relations 666.3 The conditional logit model 666.4 WTP: Main effects and cross effects. 67
6.4.1 Alternative Specific Constant 686.4.2 Consumption effect on WTP 686.4.3 Self-reported certainty 70
6.5 WTP including socio-economic variables 726.5.1 Sub-sample analysis- gender 726.5.2 Sub-sample analysis - area 736.5.3 Dummy coded variables 746.5.4 Test of dominant attributes 75
6.6 Summary and discussion of the CE - results 76
7 Results of the CV survey 777.1 Response statistics 777.2 Estimation of WTP for Naturally Clean Water 78
7.2.1 Identifying protest and genuine zero bids 787.2.2 Bid curves 797.2.3 Non parametric WTP 797.2.4 Econometric estimations 807.2.5 WTP Function 827.2.6 WTP influenced by self-reported certainty 837.2.7 Section summary of naturally clean water 84
7.3 Estimation of WTP for purified water 857.3.1 Identifying protest and genuine bids 857.3.2 Non parametric WTP and Bid curve 857.3.3 Econometric estimations of WTP 867.3.4 WTP Function 877.3.5 WTP influenced by self-reported certainty 887.3.6 Section summary purified water 89

8 Comparison of the two surveys 908.1 The results from the two studies 908.2 Discussion of results 92
8.2.1 Comparison to other studies 928.2.2 Discussion of the results compared to other comparative CV/CE studies 938.2.3 Discussion of explanations for the differences found 94
References 97
Annex 1 105
Annex 2 112
Annex 3 142
Annex 4 173

[Blank page]

7
Preface
This report covers a valuation study where Danish consumers’ wil-lingness to pay for groundwater protection and purification ofdrinking water is assessed. The project is initiated by the Danish En-vironmental Protection Agency (EPA), and co-financed by EPA andthe National Environmental Research Institute.
The work has been followed and commented by a steering group,which also followed and commented the pre-study for the presentproject (Miljøstyrelsen. - Miljøprojekt 969). The results of the mainvaluation study are described in the present report and in Danish in a”Miljøprojekt” report as part of the ”Teknologiudviklingsprogram”.
The members of the steering committee were:
Camilla K. Damgaard, Danish Environmental Protection Agency(EPA) (Miljøstyrelsen (MST))
Lisbeth Strandmark, Danish Environmental Protection Agency (EPA)(Miljøstyrelsen (MST))
Jørgen Schou, Danish Environmental Protection Agency (EPA) (Mil-jøstyrelsen (MST))
Kim Dahlstrøm, Danish Environmental Protection Agency (EPA)(Miljøstyrelsen (MST))
Bo Jellesmark Thorsen, Centre of Forest & Landscape Denmark, TheRoyal Veterinary and Agricultural University; Denmark (Skov ogLandskab, Den Kgl. Veterinær- og Landbohøjskole (KVL))
Jette Bredal Jacobsen, Centre of Forest & Landscape Denmark, TheRoyal Veterinary and Agricultural University; Denmark (Skov ogLandskab, Den Kgl. Veterinær- og Landbohøjskole (KVL))
Hans Jørgen Henriksen, The Geological Survey of Denmark andGreenland (Danmarks og Grønlands Geologiske Undersøgelse(GEUS))
Trine Bille, Institute of Local Government Studies – Denmark (Am-ternes og Kommunernes Forskningsinstitut (AKF))
Alex Dubgaard, Food and Resource Economics Institute, The RoyalVeterinary and Agricultural University; Denmark. (Fødevareøkono-misk Institut, KVL)
Jacob Ladenburg, Food and Resource Economics Institute, The RoyalVeterinary and Agricultural University; Denmark. (Fødevareøkono-misk Institut, KVL)
Claus Vangsgaard, Danish Water and Waste Water Association(DWWA) (Dansk Vand. og Spildevandsforening (DANVA))

8
Sven Jespersen, the Secretariat, the Danish Economic Council, (DetØkonomiske Råds Sekretariat (DØRS))
Thomas Bue Bjørner, the Secretariat, the Danish Economic Council,(Det Økonomiske Råds Sekretariat (DØRS))
Sven Erik Jepsen, Danish Environmental Protection Agency (EPA)(Miljøstyrelsen (MST))
Members until March 2004: Bente Villumsen, Danish EnvironmentalProtection Agency (EPA) (Miljøstyrelsen (MST)), Lars Trier, DanishForest and Nature Agency (Skov- og Naturstyrelsen (SNS)), SusanneJørgensen, Danish Forest and Nature Agency (Skov- og Naturstyrel-sen (SNS)).
The authors wish to acknowledge the comments from the steeringcommittee, and for the enjoyable and helpful discussions in thegroup. We would also like to thank for the comments from the tworeferees, as well as for good advice and comments from colleagues.The responsibility for the report, for any mistakes and for the conclu-sions are the authors.
Roskilde, May 2005.
Berit Hasler,Thomas Lundhede,Louise Martinsen,Sune Neye,Jesper S. Schou
9
Dansk sammendrag
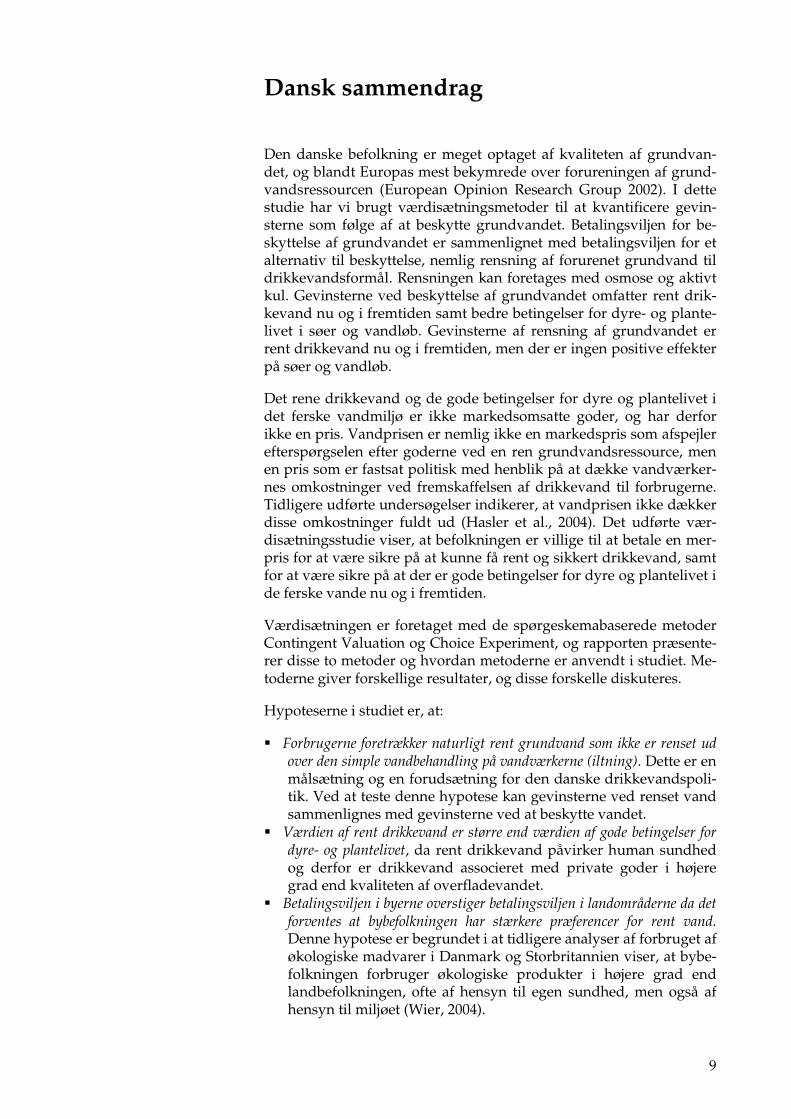
Den danske befolkning er meget optaget af kvaliteten af grundvan-det, og blandt Europas mest bekymrede over forureningen af grund-vandsressourcen (European Opinion Research Group 2002). I dettestudie har vi brugt værdisætningsmetoder til at kvantificere gevin-sterne som følge af at beskytte grundvandet. Betalingsviljen for be-skyttelse af grundvandet er sammenlignet med betalingsviljen for etalternativ til beskyttelse, nemlig rensning af forurenet grundvand tildrikkevandsformål. Rensningen kan foretages med osmose og aktivtkul. Gevinsterne ved beskyttelse af grundvandet omfatter rent drik-kevand nu og i fremtiden samt bedre betingelser for dyre- og plante-livet i søer og vandløb. Gevinsterne af rensning af grundvandet errent drikkevand nu og i fremtiden, men der er ingen positive effekterpå søer og vandløb.
Det rene drikkevand og de gode betingelser for dyre og plantelivet idet ferske vandmiljø er ikke markedsomsatte goder, og har derforikke en pris. Vandprisen er nemlig ikke en markedspris som afspejlerefterspørgselen efter goderne ved en ren grundvandsressource, menen pris som er fastsat politisk med henblik på at dække vandværker-nes omkostninger ved fremskaffelsen af drikkevand til forbrugerne.Tidligere udførte undersøgelser indikerer, at vandprisen ikke dækkerdisse omkostninger fuldt ud (Hasler et al., 2004). Det udførte vær-disætningsstudie viser, at befolkningen er villige til at betale en mer-pris for at være sikre på at kunne få rent og sikkert drikkevand, samtfor at være sikre på at der er gode betingelser for dyre og plantelivet ide ferske vande nu og i fremtiden.
Værdisætningen er foretaget med de spørgeskemabaserede metoderContingent Valuation og Choice Experiment, og rapporten præsente-rer disse to metoder og hvordan metoderne er anvendt i studiet. Me-toderne giver forskellige resultater, og disse forskelle diskuteres.
Hypoteserne i studiet er, at:
� Forbrugerne foretrækker naturligt rent grundvand som ikke er renset udover den simple vandbehandling på vandværkerne (iltning). Dette er enmålsætning og en forudsætning for den danske drikkevandspoli-tik. Ved at teste denne hypotese kan gevinsterne ved renset vandsammenlignes med gevinsterne ved at beskytte vandet.
� Værdien af rent drikkevand er større end værdien af gode betingelser fordyre- og plantelivet, da rent drikkevand påvirker human sundhedog derfor er drikkevand associeret med private goder i højeregrad end kvaliteten af overfladevandet.
� Betalingsviljen i byerne overstiger betalingsviljen i landområderne da detforventes at bybefolkningen har stærkere præferencer for rent vand.Denne hypotese er begrundet i at tidligere analyser af forbruget aføkologiske madvarer i Danmark og Storbritannien viser, at bybe-folkningen forbruger økologiske produkter i højere grad endlandbefolkningen, ofte af hensyn til egen sundhed, men også afhensyn til miljøet (Wier, 2004).
10
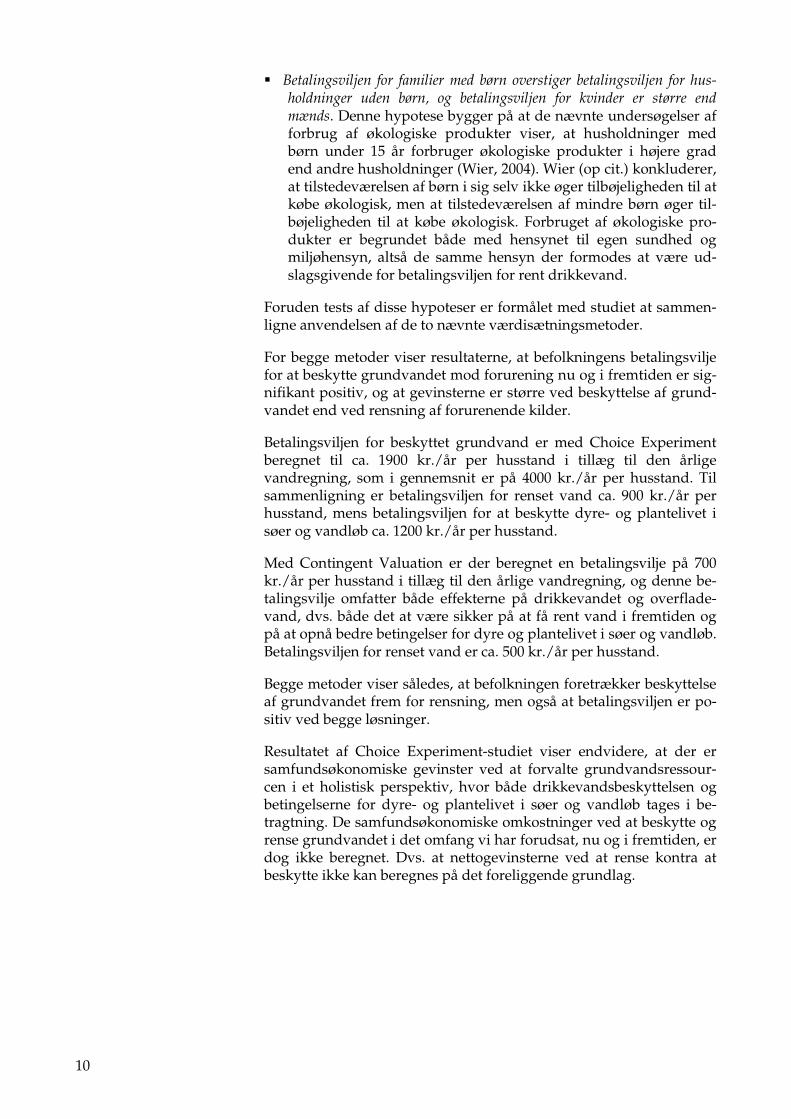
� Betalingsviljen for familier med børn overstiger betalingsviljen for hus-holdninger uden børn, og betalingsviljen for kvinder er større endmænds. Denne hypotese bygger på at de nævnte undersøgelser afforbrug af økologiske produkter viser, at husholdninger medbørn under 15 år forbruger økologiske produkter i højere gradend andre husholdninger (Wier, 2004). Wier (op cit.) konkluderer,at tilstedeværelsen af børn i sig selv ikke øger tilbøjeligheden til atkøbe økologisk, men at tilstedeværelsen af mindre børn øger til-bøjeligheden til at købe økologisk. Forbruget af økologiske pro-dukter er begrundet både med hensynet til egen sundhed ogmiljøhensyn, altså de samme hensyn der formodes at være ud-slagsgivende for betalingsviljen for rent drikkevand.
Foruden tests af disse hypoteser er formålet med studiet at sammen-ligne anvendelsen af de to nævnte værdisætningsmetoder.
For begge metoder viser resultaterne, at befolkningens betalingsviljefor at beskytte grundvandet mod forurening nu og i fremtiden er sig-nifikant positiv, og at gevinsterne er større ved beskyttelse af grund-vandet end ved rensning af forurenende kilder.
Betalingsviljen for beskyttet grundvand er med Choice Experimentberegnet til ca. 1900 kr./år per husstand i tillæg til den årligevandregning, som i gennemsnit er på 4000 kr./år per husstand. Tilsammenligning er betalingsviljen for renset vand ca. 900 kr./år perhusstand, mens betalingsviljen for at beskytte dyre- og plantelivet isøer og vandløb ca. 1200 kr./år per husstand.
Med Contingent Valuation er der beregnet en betalingsvilje på 700kr./år per husstand i tillæg til den årlige vandregning, og denne be-talingsvilje omfatter både effekterne på drikkevandet og overflade-vand, dvs. både det at være sikker på at få rent vand i fremtiden ogpå at opnå bedre betingelser for dyre og plantelivet i søer og vandløb.Betalingsviljen for renset vand er ca. 500 kr./år per husstand.
Begge metoder viser således, at befolkningen foretrækker beskyttelseaf grundvandet frem for rensning, men også at betalingsviljen er po-sitiv ved begge løsninger.
Resultatet af Choice Experiment-studiet viser endvidere, at der ersamfundsøkonomiske gevinster ved at forvalte grundvandsressour-cen i et holistisk perspektiv, hvor både drikkevandsbeskyttelsen ogbetingelserne for dyre- og plantelivet i søer og vandløb tages i be-tragtning. De samfundsøkonomiske omkostninger ved at beskytte ogrense grundvandet i det omfang vi har forudsat, nu og i fremtiden, erdog ikke beregnet. Dvs. at nettogevinsterne ved at rense kontra atbeskytte ikke kan beregnes på det foreliggende grundlag.

11
Summary and conclusions
Objectives of the studyThe benefits of groundwater protection are estimated in order tomeasure whether there are welfare gains associated with increasedprotection of the groundwater resource, as compared to the currentlevel of protection and to purification of groundwater for drinkingwater purposes. The term ”groundwater” refers to the groundwaterresource in Denmark and local groundwater pollution problems arenot considered. The study assesses only the benefits, and not thecosts, of achieving these benefits.
Danish drinking water policy is based on the assumption that thepublic prefers clean groundwater to water that has been treated.These preferences have never actually been explored by Danishvaluation studies.
The primary hypotheses in this study are that:
Consumers prefer naturally clean groundwater, which is not in need of pu-rification or other treatment, to water that has been polluted and treated toclean, thereafter. This is a premise underlying Danish drinking waterpolicy. By testing this hypothesis the benefits of groundwater protec-tion versus purification are measured.
The value associated with clean drinking water exceeds the value associatedwith good surface water quality. The rationale here is that clean drinkingwater influences human health and hence private goods more di-rectly than the quality of surface waters does.
The Willingness to Pay (WTP) in urban areas exceeds the WTP in ruralareas. This hypothesis is motivated by the results of former analysesof the demand for organic foods in Denmark and Great Britain (Wier,2004). These results show that urban residents consume organic foodsto a higher degree than residents living in rural areas. Human healthand environmental concern are the most commonly stated reasons forpreferring organic to conventional food, and we expect that thesereasons are also the drivers for the hypothesised preferences for cleangroundwater.
The WTP in households with children exceeds the WTP in households with-out children and the WTP of females exceeds that for males. This hypothe-sis is motivated by results from the above-mentioned study, whichalso concludes that households with children under 15 years of agehave a higher demand for organic foods than other households (Wier,2004). The presence of children, in itself, does not increase the de-mand, but the presence of children under 15 years of age does. Asmentioned above, human health and environmental concern are themost commonly stated reasons for preferring organic to conventionalfood, and we expect that these reasons are also the drivers for thehypothesised preferences for clean groundwater.

12
Besides elicitation of WTP for groundwater protection and purifiedwater, an additional objective of the study is to compare the resultsobtained with the two methods, choice experiments and contingentvaluation, and to analyse and assess the apparent differences.
The indicators and scenarios in the two surveysThe effects being valued comprise both changes in drinking waterquality and surface water quality, represented by the living condi-tions for flora and fauna in lakes and watercourses in Denmark. Theindicators for the quality of lakes, watercourses and drinking waterare expressed in general terms, and not specifically for a certain area,as valuation is based on a general description of Danish drinkingwater quality and the quality of surface waters, i.e. watercourses andlakes. As a consequence the results can be used at a general level, butnot to value changes in specific areas.
The use of qualitative indicators as opposed to quantitative indica-tors, such as limit values, has been selected because qualitative indi-cators are found to be more suitable when the aim is to assess thevalue of general protection of surface waters as opposed to more spe-cific cases, e.g. valuation of quality changes of a specific lake or wa-tercourse. Danish surface waters, e.g. lakes, differ widely from eachother because of variations in the prevailing natural conditions(depth, nutrient richness, size), making it impossible to characterisethem by using the same indicators. Furthermore, it was found, intesting the questionnaires, to be least demanding cognitively to usequalitative indicators. The indicators comprise choices between natu-rally clean drinking water of good quality resulting from protection,versus uncertain quality of drinking water. The uncertainty relates tofulfilment of the limit values of nitrate and pesticides in the future,although it is assumed that the present protection level is maintainedin the future. Protection is also valued in relation to water that is puri-fied and treated to remove pesticides and nitrates. The informationsupplied to the respondents explains that, under current conditions, arange of measures is carried out with regard to protection ofgroundwater against pollution from pesticides and nitrogen. They areinformed that when a groundwater borehole is found to be polluted,it is closed and a new one is established. Furthermore, it is explainedthat it is uncertain whether clean drinking water can be provided insufficient amounts at this protection level in the future. There is,therefore, a risk that tap water will exceed current limits for pesti-cides and nitrogen content in the future.
The respondents are also informed that by carrying out measures,primarily in agriculture, naturally clean drinking water can be se-cured both now and in the future. At the same time, good conditionscan be secured for animal and plant-life in watercourses and lakes.This means that animal and plant-life will be more natural, variedand balanced, and affected by human activity to only a slight to aver-age degree.
The respondents are, furthermore, informed that the general condi-tions for animal and plant-life in watercourses and lakes are not goodat the present and that, under the current level of protection, animal

13
and plant-life is in a state of imbalance many places, and differsmarkedly from how it would appear under natural conditions. Theprimary reason for changes in the condition of the aquatic environ-ment is human activity.
In the Contingent Valuation (CV) survey, the respondents are pro-vided with this information directly, and they are asked to choosehow much they would pay for groundwater protection from a pay-ment card listing 11 levels, ranging from 0 to 2400 DKK/year perhousehold, representing additions to their water bill. In the ChoiceExperiment (CE) survey the respondents are asked to choose betweenalternatives where the levels of drinking water quality, surface waterquality and price are varied systematically.
In the CE survey, the indicator levels are designed so as to approachthe descriptions in the CV survey. The quality levels “good drinkingwater quality now and in the future”, “uncertain quality now and inthe future” and “purified water” describe drinking water. Surfacewaters are described by “very good conditions for flora and fauna inwaterways and lakes”, by “slight imbalance, markedly different thanwould be so under natural conditions” and “bad conditions”. Theprice consists of six levels, ranging from 0 to 2,400 DKK/year perhousehold again representing additional payments to the water bill.In both of the surveys the respondents are informed that it is as-sumed that the Danish consumer should cover the costs of protectingthe groundwater, as well as those for purification. This would takeplace in the form of a fixed annual sum per household claimed once ayear via the water bill. In other words, a payment additional to theannual water bill is used as the payment vehicle in both surveys. Onaverage, Danish households pay 4,000 DKK/year in water serviceand supply bills.
ResultsThe Danish drinking water policy and the hypothesis of this studyare based on the assumption that the public prefers clean groundwa-ter to water that has been treated by purification methods to removenitrates and residues from pesticides. This policy assumption andhypothesis is supported by the results of the CE study, i.e. the esti-mated willingness to pay for groundwater protection is higher thanthe willingness to pay for purified water. The result cannot be sup-ported directly by the CV study as the WTP for effects of groundwa-ter protection comprise effects on both drinking and surface water.However, the WTP for protection also exceeds that for purification inthe CV study, although it has to be remembered that the WTP com-prises both the effects on drinking water and surface water quality.The results are apparent from Table 0.1.

14
Table 0.1. WTP-results from CE and CV, DKK/year
CE CV
Naturally clean groundwater 1,899
Very good conditions for plant and animal life 1,204 711
Total 3,104 711
Purified water 912 529
The WTP results represent water service payments in addition tohouseholds’ present annual water bills, and reflects the respondents’willingness to pay for the good, “good drinking water quality” – ob-tained by protection or purification, as well as good living conditionsfor flora and fauna in lakes and watercourses. The initial averagepayment of 4,000 DKK/year represents the present cost of water de-livery and wastewater disposal, as well as some of the costs for thepresent level of drinking water protection.
As apparent from Table 0.1., the CE has resulted in positive WTP es-timates for groundwater protection, split into WTP estimates for both“natural clean groundwater for drinking water supply“ and “verygood conditions for plant and animal life”. Using the CV method, thevalue of the total good “groundwater quality” is estimated, and thisWTP estimate cannot be split into different attributes.
As mentioned above, it is explained in the CV-valuation scenario thatboth drinking water quality and surface waters will be influencedpositively by an increase in groundwater protection over current lev-els of protection. As apparent from the results in Table 0.1., the CEresults for groundwater protection of both surface water (plant andanimal effects) and drinking water quality are more than four timesgreater than the CV WTP estimate.
The CE result for naturally clean water resulting from protection ofthe groundwater resource represents a marginal increase of almost50%; from 4,000 to 5,899 DKK/year. It is apparent that the WTP forgroundwater protection exceeds the WTP for purification. However,the WTP for purified water from the CE survey is only 30% of thetotal WTP for groundwater protection.
As mentioned, one of the hypotheses in this study is that consumersprefer clean groundwater to purified water, and this hypothesis issupported by the CE method. Another hypothesis is that the valueassociated with clean drinking water exceeds the value associatedwith good quality of surface waters. This hypothesis is once againsupported by the CE results, which indicate that the WTP for goodconditions in surface waters accounts for 63% of the WTP for gooddrinking water quality obtained by protection. One explanation forthis difference is that clean drinking water influences human healthand hence private goods more directly than the quality of surfacewaters does, both for present and future generations. Seen in relation

15
to foreign valuation studies, as well as Danish, the results are in ac-cordance with the assumptions.
Both the CV and the CE surveys find correlations between the house-hold WTP and household income, education level of the respondentand household water consumption, i.e. the WTP increases with in-come level, educational skills as well as water consumption. Fur-thermore, the WTP of females is higher than that for males. Both ageand children in the household are insignificant factors, i.e. the WTP isnot dependent on whether there are children in the household or theage of the members of the household. Furthermore, the results of theestimations indicate that WTP differs between households in urbanand rural areas, as the WTP is higher in urban than in rural areas.
Explanations for differences in results and advice for theirtreatmentStandard neo-classical assumptions support that open-ended CV re-sults, which the CV-payment card answers used in the present studycan be interpreted as, are lower than results from dichotomous choiceformats and other choice methods. In other words, the results are inaccordance with theory.
However, this conclusion does not suggest whether the CE results orthe CV results are the most reliable. The literature provides no con-clusive evidence on the reasons for the differences between the re-sults. However, empirical results can be used to shed light on thisand to support the results: In former water quality surveys, meanwater values obtained by CV were three to four times lower thanthose obtained from the contingent ranking method. Contingentranking is a choice modelling approach close to CE.
In the empirical literature, the differences are explained by a numberof reasons. One explanation for lower WTP estimates from CV com-pared with CE is that CV may create incentives for respondents tounderstate their true willingness to pay. In past empirical research,these differences are explained by the facts that substitutes are ex-pressed more explicitly in CE than in CV and, hereby, respondentsare encouraged to make trade-offs. As choices that include price at-tributes are different from direct elicitations of willingness to pay, theprices often carry more weight and are given more attention in CEsurveys. The last explanation is that it is easier to express indifferenceto choices in CE than in CV, and protest behaviour is a greater prob-lem in CV compared with CE.
It is, therefore, proposed in this report to use the results from the CEcompared with those from the CV method.

16
1� Background and aim of the study
1.1� Background
The quantity and quality of the groundwater resource are importantfor the provision of drinking water in Denmark, as 99% of the drink-ing water supply stems from groundwater. Consequently, protectionof the drinking water resource with the aim of using clean ground-water as drinking water is a priority task in Danish environmentalpolicy (cf. Andersen et al. 2003, Danish Environmental ProtectionAgency 2004). The objective is that groundwater should be usableafter simple processing (oxygenation). Further treatment of ground-water is not desirable with regard to both national and regional tar-gets for the existing and future drinking water supply (cf. Copenha-gen County/Roskilde County 2003, Danish Environmental ProtectionAgency 2004). Tap water is the main source of drinking water inDenmark as bottled water is mainly used as a substitute for e.g. lem-onade and soft drinks.
A Danish study from 1999 carried out by the “Institut for Konjunktur-Analyse” (IFKA) concluded that as much as 85% of the respondentsanswered that pollution of groundwater was the most important en-vironmental problem in Denmark. They also answered that they wereparticularly concerned for the quality of drinking water. A more re-cent European survey carried out for the Directorate-General Envi-ronment indicates that the Danish population, generally, are moreworried about pollution of waterbodies than the population in othercountries. The European Opinion Research Group (2002) has foundthat 52% of Danes are very worried1 about pollution of Danish tapwater, and 56% are very worried about pollution of groundwater. Incomparison, 43% of the average population in the EU countries arevery worried about these topics.
However, it has recently been proposed in Denmark that gooddrinking water quality, meeting the drinking water requirements ofthe drinking water directive, could be provided by treatment of pol-luted groundwater (IMV, 2003). It is possible to purify pollutedgroundwater for both nitrates and pesticide residues by osmosis andby active charcoal filters, and this practice can be less costly as com-pared to protection of the groundwater against pollution by e.g. agri-cultural measures. The costs of purification increase with increasingpollution (Juhl & Bjerg, 2004). As opposed to purification, which onlyimproves drinking water quality, protective measures improve boththe quality and quantity of drinking water, the groundwater, thequality of streams, watercourses and lakes and the living conditionsfor flora and fauna therein (cf. GEUS, 2004; Bach et al. 2002). In orderto be able to prioritise, both the costs and the benefits should be ac-
1 The notion “very worried” is used by The European Opinion Research Group(2002), as opposed to their notions “fairly worried”, “not very worried” and “not atall worried”, i.e. the notion “very worried” is the strongest indication of concern intheir survey.

17
counted for, but good drinking water quality and good conditions forthe living conditions of flora and fauna are mainly public, non-marketed goods. The provision of drinking water and other use-water from tap water has a price in Denmark, but this price is not amarket price as it is set by the municipalities with the aim to cover thecosts of drinking water sewerage and supply2. Consequently, thevalue of the goods created by groundwater protection has to be de-rived by valuation methods.
This non-marketed value of the effects of protection of the ground-water resource should be estimated comprising both the value ofdrinking water protection and the effects of protection of freshwatersand the flora and fauna therein. The value of protection of thegroundwater resource should also be compared to the value of othermeasures to obtain good water quality, e.g. the above-mentionedpossibility of purification of polluted groundwater.
1.2� Sources of groundwater pollution
Agriculture, industry, road traffic, landfill sites and sewerage systemsrepresent important sources of groundwater pollution. Pollutionprotection can take place by locating these activities an appropriatedistance from aquifers or by restricting the activity, itself. Nitratepollution stems mainly from agriculture, where pesticide-use is alsomost widespread. Sources of groundwater pollution with pesticidesare found both in urban areas and the wider countryside.
Measures in agriculture do, for example, include environmentalmanagement practices in the form of reductions in pesticide applica-tion and/or reductions in nitrogen/nitrate application, planting offorest areas and taking land out of production. However, the aim ofthis report is not to describe the sources of groundwater pollution indetail; such descriptions can be found in an extensive body of litera-ture, Danish as well as international (see e.g. Østergaard et al., 2004;Bach et al. 2002; Henriksen et al., 2004).
It is a premise of this study that initiatives to protect groundwateragainst pesticides and nitrate can be implemented so that current andfuture generations can drink untreated groundwater, which at thesame time is clean. Apart from measures to carry out defensivepumping and establish new boreholes, efforts to protect drinkingwater in sensitive areas include, for example, the planting of forestand restrictions on use of nitrogen and pesticides (environmentally-sensitive farming practices). These measures limit the loss of pesti-cides, nitrogen and phosphorous to both groundwater and surfacewaters in designated areas. Groundwater protection and the associ-ated costs depend on the scope of protection measures and how themeasures are put in place. The costs of such measures are not esti-mated in the present study, but can be estimated using other studyresults and models (see e.g. Schou 2004, Rasmussen 2004, Hasler &Schou 2004; Jacobsen et al. 2004).
2 On average Danish households pay 4,000 DKK annually for water sewerage andsupply.

18
1.3� Valuation by use of stated preferences: theContingent Valuation and the ChoiceExperiment methods
Stated preference methods consist of several methodological ap-proaches, with the common property that people are asked what eco-nomic value they attach on certain goods and services, e.g. servicesand goods connected to groundwater protection and drinking waterpurification. The contingent valuation (CV) method and the choiceexperiment (CE) method are both survey-based methodologies thatprovide respondents with the opportunity to state a hypotheticaleconomic decision concerning the relevant non-marketed good. Re-sponses are most commonly collected by personal interviews or mailsurveys. The value estimates are contingent on a hypothetical sce-nario that is presented to the respondents for valuation. In otherwords, it relies on the analyst to create a hypothetical market for thegood in question.
Another group of valuation methods is revealed methods, where theanalyst investigates how the public good influences a marketed goodwhich is connected to the public good. The advantage of revealedmethods is that the price is actually paid, and is not hypothetical.However, there are limitations as well, e.g. that there have to be exis-ting and connected private goods that reflect the price of the publicgood (cf. Adamowicz et al. 1994, Adamowicz 1995). Houses arecommonly used because house prices reflect characteristics of thehouse as well as its surroundings, including the environmental qual-ity of the area (landscape, but potentially also quality of lakes, fjordsetc).
However, no such marketed goods reflect the value of water qualityadequately, including all the categories of values connected togroundwater mentioned above. Furthermore, non-use values, in-cluding existence values and option values (values of potential futureuse- and non-use values) cannot be elicited by revealed methodswhereas with stated preference methods they can. Revealed methodsonly reflect the preferences of those who use the connected good, e.g.the house owners. Therefore, the total value of a public good cannotbe assessed, including the use and non-use values of both existingprojects as well as future development projects.
Valuation of groundwater protection, therefore, requires stated prefe-rence techniques, and in the present study it has been decided to usetwo methods and to compare them: Choice experiments (CE) andContingent Valuation (CV). While CV has frequently been used in theliterature, the CE-method has been developed more recently, and themethod has been used in many studies during the last few years.Both CV and CE use hypothetical questions and choices to assess andreveal consumers’ WTP.
With the CV method, the focus is on a description of the change inthe provision of the good, as such, and the respondents are presentedwith the changes in the environmental good. Hereby, the CV methodis a direct valuation method, as the respondents are asked directlywhat they would be willing to pay to achieve a given change in the

19
quality or quantity of the public good - e.g. drinking water qualityand/or surface water quality. In contrast to this, respondents areasked to make choices in CE. CE is built on discrete choices, and thegood and the changes in the provision of the good are described interms of its characteristics or attributes. The choices are used to revealthe respondents’ trade-offs between the alternatives presented forthem in the choice-sets.
In other words, respondents state their hypothetical WTP by an-swering hypothetical questions in CV studies, and make choices be-tween hypothetical alternatives in CE studies (see e.g. Nunes & vanden Bergh, 2001; Macmillan et al., 2001; Garrod & Willis, 1999, Bate-man et al. 2002).
According to Bateman et al. (2002) and Navrud (2000), CV ap-proaches should be chosen when the total environmental service orgood is being valued. CE is the appropriate choice if the relative va-lues of each attribute or characteristic of a public good are analysedand valued. The summing up (aggregation) of these results, however,can result in over-estimations of the value of the total environmentalservice or good (Foster & Mourato, 1999).
As mentioned, the present study comprises both CE and CV ques-tions in two questionnaires. Except from the valuation questions, allother questions have been kept the same in the CV and CE-questionnaires, and the surveys have been sent out to an equal num-ber of respondents (900 households, respectively). The valuation sce-narios are also framed and worded as similarly as possible, with theaim to facilitate comparisons of both results and the methodologicalpros and cons. Both methods are chosen because it is the aim of thestudy to compare the methods, and value the single effects ongroundwater protection for both drinking water and surface waterand, at the same time, to evaluate the value of the total environmentalservice. With respect to comparison of the methods, it is the aim toevaluate whether respondents are more confident with one of the twomethods, i.e. whether they answer with more certainty in one of thesurveys compared with the other. Furthermore, it is an aim to explorewhether the valuation questions can be framed and worded in equalterms in these two methods.
1.4� Prior valuation results on water quality withCV and CE
DØR (The Danish Economic Council, 2004), Görlach & Interwies(2003) and Hasler et al. (2004) comprise more extended descriptionsof valuation studies on changes in water quality. As Hasler et al.(2004) is a pre-study for the present valuation study, detailed de-scriptions of the studies and the results are not provided here, butexperiences from other studies are described briefly here, and otherrelevant studies are also commented upon throughout the report.
Bergstrom & Dorfman (1994) conducted two parallel CV studies inGeorgia and Maine, respectively, and the policy question was theWTP for “safe” drinking water, where the safety indicator was indi-

20
cated by the level of nitrate in the water. They found a WTP between242 and 691 DKK per year per household. The amount is convertedfrom dollars to DKK by a conversion rate of 605,87 (DØRS, 2004, p.210).
In a French CV study, Stenger & Willinger (1998) found WTP esti-mates between 701 and 1755 DKK per year for a household forgroundwater of good quality. The upper level refers to WTP ques-tions posed by open-ended format, and the lowest level to a close-ended format.
An Italian CV study conducted by Press & Söderquist (1996) esti-mated a WTP of 2483 DKK per year per household. The valuationquestion is the WTP for securing water quality in Milan so that pol-lution limit values are not exceeded.
The two former studies used qualitative indications for water qualitywhile the latter used pollution limit values. The three studies all fo-cused on drinking water, and no further studies have been foundfocusing on both drinking water and surface water quality as is thecase in this study. The results from the two first-mentioned studiescan be used in comparison with the results from the present study.
Only one Danish study has previously investigated WTP forgroundwater protection. Jensen et al., (1995) asked respondents tovalue several environmental problems. As part of this study the re-spondents were asked how much they were willing to pay for sub-stantially reduced groundwater pollution, but did not elucidate WTPfor purification versus protection. The indicator in that study wasalso qualitative, and the willingness to pay for groundwater protec-tion was 1000 DKK/year elicited by an open-ended payment format,while it was 2100 using the close-ended format.
With regard to CE, no valuation studies of changes in groundwaterquality have been found in the literature, although water qualitystudies have been conducted with focus on river basins (cf. Georgio etal., 2000). Adamowizc et al. are presently conducting a CE and CVstudy on tap water and drinking water quality in Canada, but resultsare not published yet.
1.5� Objectives and hypotheses in the study
The objective of this study is to estimate the benefits of groundwaterprotection to enable justification of whether there are welfare gainsassociated with increased protection of the groundwater resource, ascompared to the current level of protection and to purification ofgroundwater for drinking water purposes. In this context, when theterm “groundwater” is used, the groundwater resource in Denmarkas a whole is implied.
As mentioned, Danish drinking water policy is based on the assump-tion that the public prefers clean groundwater to water that has beentreated (Danish EPA, 1997). However, with the exception of the studyby Jensen et al. (1995), which valued the Danish population’s prefer-ences for decreases in pollution of groundwater, these preferences
21
have never actually been explored in valuation studies. The opinionsurveys by the Institut for Konjunkturanalyse (IFKA) (1999) and bythe European Opinion Research Group (2002) indicate that the Dan-ish population has strong attitudes towards the protection ofgroundwater. However, “asking questions about attitudes to publicgoods is not as powerful a predictor for underlying values as elicitingattitudes towards paying for public goods” (Bateman et al. 2002:115,referring to the work of Mitchell & Carson, 1989).
One of the hypotheses in this study is that consumers prefer cleangroundwater, which is not in need of purification or other treatment,to water that has been polluted and treated to clean, thereafter.Through valuation, we can analyse these preferences and also assesstheir strength.
Another hypothesis is that the value associated with clean drinkingwater exceeds the value associated with good quality of surface wa-ters. The rationale here is that clean drinking water influences humanhealth, and hence private goods, more directly than the quality ofsurface waters does. Differences in households’ WTP between urbanand rural areas, as well as in households with and without children,are also investigated.
Besides elicitation of WTP for groundwater protection and purifiedwater another objective in the study is to compare the results ob-tained by the two methods, choice experiments and contingentvaluation. The differences in willingness to pay for safe drinkingwater quality and improved conditions in surface waters are esti-mated, and differences in results between the methods are assessedand analysed as well. The differences are explained.
The aim of this report is to outline how these problems and hypothe-ses are treated in a valuation study of groundwater protection, com-prising the use of two methods: the Contingent Valuation methodand the Choice Experiment method.
1.6� Content of the report
In the following Chapter (2), the policy background for scenarios forgroundwater protection is outlined, together with a description ofenvironmental effects of groundwater protection. This forms thebackground for definition of the valuation scenarios in the study.
The study comprises application of both the Contingent Valuation(CV) method and the Choice experiment (CE) method, both methodsbeing used to analyse and assess the same hypotheses and problems.One of the objectives of the study is, as mentioned, to compare theresults of these two methods. Considerations of how the commonpart of the studies is designed are described in Section 3.
In Section 4, the application of the CE method is presented, docu-menting the CE design of this study. Similarly, the application of theCV method is described in Section 5 to document the CV design. Theresults of the CE survey are presented and discussed in Section 6,followed by description and discussion of the CV results in Section 7.

22
The surveys are compared and discussed in Section 8. The conclu-sions and perspectives are presented and discussed in the summaryof the report.
A description of important notions and methods to create an effectivedesign for a CE study is found in Annex 1. The questionnaires are tobe found in Annexes 2 and 3, as both Danish and English versions.

23
2� The valuation scenarios
2.1� Groundwater quality – status and indicators forvaluation
Scientific and monitoring results from the literature on groundwater,as well as from consultation of water experts, are used as a basis toestablish relevant scenarios and indicators for the valuation of effectsof groundwater protection and use of groundwater in the future.
A selection of the results from this research is presented in this sec-tion and is followed by a presentation of the information provided tothe respondents. However, in the design of the questionnaires the useof too much complex information has been avoided. Scenarios,choices and valuation questions are kept as simple as possible to re-duce the cognitive burden and to prevent information overload. Atthe same time, the design and the scenarios should not be so simplethat they cannot be connected to real policy implications and estima-tions of welfare costs, because the aim of the study is both methodo-logical and to guide policy development. This sounds simple, but iscomplicated as there are many interrelated aspects (goods and serv-ices) connected to groundwater quality.
One of the problems is that the quality of water can be characterisedboth by non-use and use values and by several indicators - clean wa-ter, swimming water, fishable water, drinkable water, visibility andsight depth. Furthermore, many of these characteristics might be cor-related.
It has been decided not to focus on the groundwater quality as such,because it is anticipated that the term “groundwater resource” is tooabstract for laymen to relate to. We have chosen to focus on twogoods connected to groundwater use and protection: Drinking waterquality and surface water quality, because use of groundwater and pro-tection of the resource affects the quality and quantity of drinkingwater and the quality of surface waters. Furthermore, the focus is onsurface freshwaters such as watercourses and lakes, and not e.g.wetlands and coastal areas.
2.1.1� Status for nitrate and pesticides in drinking waterDrinking water of good quality is, in Danish drinking water policy, de-fined as:
”Groundwater which has only undergone a simple processat the waterworks (oxygenation)” (cf. E.g. DANVA 2003,National Association of County Councils 2003, Danish Envi-ronmental Protection Agency 2004, GEUS 2004).
Drinking water of good quality is below the limit values for nitratesand pesticides in drinking water, which are 50 mg /l and 0,1 µg/l ofwater, respectively. The argument behind the limit values for pesti-

24
cides in groundwater (0,1 µg per litre of water) is that pesticides andpesticide residues are suspected to be carcinogenic, as well as ofcausing hormone disturbances (Vingaard et al., 2004). The actual limitvalue for pesticide residues reflects the minimum detectable level ofpesticides at the time when the limit value was agreed upon (the1970s). The monitoring technologies have since been improved, how-ever the limit value is still 0,1 µg/l.
The argument behind the limit value for nitrates in groundwater (at50 mg/l) is to prevent poisoning of small children via Methemoglo-binemia (”Blue Baby” Syndrome) (GEUS 2003), and to prevent can-cer. These effects are caused by conversion of nitrate to nitrite in thebody, and there is a risk that too high a nitrate/nitrite content canlead to cancer. The nitrate limit value is relatively low compared withthe nitrate content in many foodstuffs.
Pesticides and nitrates are the reason for waterworks boreholes to beclosed where pollution is the culprit (GEUS, 2003). Frequently, ex-traction of water from polluted boreholes is continued in order toavoid spreading of the contamination. The water from this type ofdefensive operation is often discharged to rivers, streams and lakes,or is used as drinking water after being mixed with water from otherwaterworks boreholes. By this means, water delivered to the con-sumer can conform to the limit values for drinking water.
New boreholes can lead to localised pressure on specific groundwatersources if the requirement for groundwater and, thereby, extractionof groundwater exceeds the regeneration level for the resource. Thetime horizon for the generation of groundwater is highly variable. Itcan take from just a few years to hundreds of years for an aquifer toregenerate. Exploitation at too high a level can lead to the water-tablesinking in a localised area and, thereby lead to that streams in thatarea can extraordinarily dry out in the summer period. Drying-out ofstreams impacts vital conditions for fish and other animals and plantsdrastically. It is for this reason that limits are applied for the rate atwhich the individual borehole can be exploited and for how manynew boreholes that can be established in a locality.
Nitrates in groundwaterHalf of the boreholes under countrywide groundwater surveillancecontain nitrates, and 16% of boreholes contains nitrate over the limitvalue for drinking water of 50 mg/l. GEUS assesses (GEUS, 2004, p.32) that, nationally, an indication of a fall in nitrate content is appar-ent in the youngest groundwater. This can potentially be ascribed tochanging cultivation practices since adoption of the Aquatic ActionPlan in 1987 (with later additions and amendments, cf. Jacobsen et al.2004). The average concentration of nitrates in the youngest ground-water, however, still exceeds the limit value for drinking water(GEUS, 2003). The most significant problems in relation to nitrate inwaterworks boreholes have been in North Jutland, West Zealand andAarhus County, in the so-termed “nitrate belts”, as well as in areaswhere aquifers are not deep-lying (GEUS, 2004). GEUS (2004) esti-mates, however, that nitrate concentrations in primary aquifers canalso be high in other parts of the country.

25
Countywide, an indication of falling nitrate concentrations in deepergroundwater has not yet been recorded (GEUS, 2003). Despite thetendency for concentrations to decrease in younger groundwater,GEUS (2004, p.32) comes to the conclusion that:
“the measures previously implemented are not likely to be ade-quate to reduce the nitrate content in groundwater sufficiently”.
Pesticides in groundwaterIn 2002 (GEUS 2004, p. 71), pesticides or pesticide residues werefound in 27% of the boreholes studied in connection with the coun-trywide surveillance programme. There is no evidence for a geo-graphical connection as in the case of nitrates. 9% of boreholes ex-ceeded the limit for drinking water. With regard to drinking water,33% of the waterworks boreholes under study in 2002 contained pes-ticides or pesticide breakdown products, and the limit value was ex-ceeded in 7%. The substance most typically recorded is the break-down product, BAM, found in 21% of waterworks boreholes in theperiod from 1992 - 2002. Next in frequency comes the group of pesti-cides called triazines (e.g. atrazine). Glyphosphate and its breakdownproduct, AMPA, were found in 1.5% and 1.0% of boreholes studied inthe 1992-2002 period, respectively.
2.1.2� Status for surface water qualityBoth the quality and quantity of groundwater have implications forthe physio-chemical, biological and hydrological conditions in water-courses and lakes. The contribution from groundwater to surfacewater takes place in several ways:
� The part of the upper groundwater discharged from land drainsand ditches contains high concentrations of both nitrates and pes-ticides in many locations around the country.
� Additions from the deeper-lying groundwater do not, for the mostpart, carry loads to the same high degree.
� Discharge of upper groundwater via land drains, etc. occursmostly in the winter period, or in transitory periods with heavyrainfall.
� Discharge from deeper-lying groundwater is relatively constantand, as such, dominates groundwater additions to watercoursesand lakes in the summer period (Henriksen and Sonnenborg,2003). This is because groundwater contributes both quantita-tively and with water of good quality, and in the summer period,the water in many watercourses consists solely of groundwater.
� The quantity of groundwater - i.e. the amount of groundwaterdischarged to the watercourse - holds great importance for the as-sociated flora and fauna. In winter months, additions from theupper layers via land drains play a decisive role in determiningthe quality of surface-waters.
The quality targets for surface waters, i.e. for the receiving environmentin watercourses and lakes, are set in consideration of the conditionsfor fish, invertebrates (monitored by the Danish watercourse faunaindex (DVFI)) and sight depth.

26
Effects of nutrient loads for the quality of water courses and lakesThe DVF-Index is the quality measure for watercourses. Based oninvertebrate sampling by this index 44% of Danish watercourses ischaracterised as clean and varied (Andersen et al., 2003, p. 32), 39% asdisplaying a moderate fauna and 17% as in a particularly poor state.Quality is generally better in larger rather than smaller watercourses,amongst other reasons due to more stable additions of water (Ander-sen et al., 2003, p. 32).
The water quality of watercourses is not affected by additions of nu-trients (nitrogen and phosphorous) from groundwater to any signifi-cant degree. Fish and other water organisms possess an optimal com-position and, thereby, good living conditions despite nutrient contenthigher than background levels (Refsgaard et al., 2002, p. 51, Andersenet al., 2003, p. 34.).
The quality of lakes can be characterised by several indicators de-pending of the natural character of the lake, e.g. the dominating fishspecies in the lake, the number of fish species and/or the sight depth.This is because the characteristics of lakes vary a great deal. The natu-ral conditions can, for instance, be both nutrient rich and nutrientpoor, and the lake can be small or large, deep or shallow. The numberof fish species (species total) in a lake is not much affected by the de-gree of eutrophication and other pollution-types, but is more de-pendent on lake size and other factors (Søndergaard et al., 2003, p.64.).
Even a small change in the addition of nutrients can be highly signifi-cant for water quality in nutrient-poor lakes (Refsgaard et al., 2002, s.43), where impact would be considerably less in one that is nutrient-rich. However, the nutrient content normally affects the quality ofwater in the lakes and fjords into which streams and rivers enter(Andersen et al., 2003, p. 34), and the same is true in the case of directgroundwater additions to lakes. Furthermore, Danish monitoringresults demonstrate that total fish-catch in lakes is affected by nutri-ent content even though the number of fish species is not much af-fected by the degree of eutrophication (Søndergaard et al. 2003). Bothnumber and biomass of fish caught increases with nutrient richness,for instance the biomass of pike rise with increased nutrient loading(Søndergaard et al., 2003, p. 62). The proportion of predatory fishmeasured in relation to weight, however, generally diminishes withincreasing nutrient load and biomass of fish such as perch decreaseswith increasing nutrient load (Søndergaard et al., 2003, p. 63). Fishbiomass can be particularly low in lakes where nutrient levels areespecially high, as too high a level of eutrophication can lead to fishmortality.
A predominant pollution problem arising from nutrient additions tolakes, however, is an elevated level of algae in the lake water. Thisaffects sight depth. In lakes, it is especially phosphorous which is toblame.
Effects of pesticide residues in lakes and watercoursesAdditions of pesticides can have great significance for the ecologicalconditions in watercourses and lakes. Just as in groundwater, the

27
breakdown product BAM is a considerable part of the pesticide con-tent, the substance stemming from pesticides that are no longer onthe market. However, traces of glyphosphate and its breakdownproduct AMPA are also found in watercourses, just as this substanceis found in groundwater and water at the waterworks (Andersen etal., 2003, p. 46).
Crustaceans and insects can be heavily impacted by pesticides, just asthe terrestrial flora alongside watercourses can. Consequently, thecurrent pesticide load in watercourses can influence or totally elimi-nate insects and crustaceans, however, the effects have not beenquantified. Pesticides can impact upon fish due to changes in foodavailability (insects and crustaceans), but quantitative studies relatingto current conditions have not been undertaken. Fish can also be poi-soned directly by pesticides (Refsgaard et al., 2002, p. 52).
Negative effects of pesticides in Danish lakes have not been demon-strated.
According to Andersen et al. (2003, p.47), few quality requirementsare set for pesticides in Danish watercourses. On the basis of the fewDanish requirements, as well as Dutch and Norwegian requirementswith regard to pesticides in watercourses, Andersen et al. (2003) con-clude that, for 9 pesticides, concentrations would breach the set ofrequirements in a number of the watercourses studied (Andersen etal., 2003).
Studies demonstrate, however, that the concentration of pesticidescurrently found in Danish watercourses is not affecting plant growth(Baattrup-Pedersen et al., 2004, p. 48). The macrophyte community is,thereby, likely not to be affected by pesticides. Pesticides can affectterrestrial plant communities along watercourses, however, but ac-cording to Battrup-Pedersen et al. (p. 48) no studies exist to confirmthis.
Danish indicators for the quality of lake and watercoursesTo sum up, lakes do not react in the same way with regard to nutrientadditions, the process of eutrophication and pesticide residues, be-cause natural conditions between Danish lakes vary greatly; depth,size, natural nutrient richness, etc. Therefore, it is difficult to chooseone or a few indicators to characterise the quality of lakes at a generallevel.
An alternative to these quantitative indicators for quality is to use theobjective set by the counties in their planning of the quality of water-bodies, as the counties have set more general objectives for lakes inthe water policy and regional planning. These objectives are commonfor watercourses and lakes, and require that, “waterbodies shall be ofa quality that secures conditions for a natural and varied animal andplant-life, being in balance and only slightly impacted from humanactivity “(Cf. Vejle County, 2001).
This objective is in harmony with the objectives of the Water Frame-work Directive (WFD) which requires, on a general level, that thestate of all water resources shall be protected and enhanced. Theoverall objective is to achieve good water status for all water bodies

28
by 2015, as compared to their natural characteristics. Quantitativemeasures for “good status” are not agreed upon and confirmed for allwater bodies, as pilot studies are pending. As mentioned above, thesemeasures will be very different for different lakes and other types ofsurface waters. The use of qualitative indicators, therefore, conformsto the policy objectives in the WFD, and valuation studies using thesetypes of indicators can be used in accordance with the implementa-tion of this directive.
2.2� Indicators used in former groundwatervaluation studies
Surface water studies, many of them conducted with revealed meth-ods (hedonic pricing and travel costs), have used some of the effectindicators mentioned above as indicators in Danish environmentalpolicy; i.e. visibility and sight depth. Boyle et al. (1999) valued thequality of lakes by hedonic pricing, using visibility in lakes as indi-cator3. Visibility was chosen as an indicator because the visibility is aphysical indicator for many other factors like algae and eutrophica-tion level. Boyle et al.’s (op cit) results indicate that the willingness topay (WTP) was influenced negatively with decreased visibility. Sand-ström (1996) and Soutukorva (2000) analyse the value of reducedeutrophication in coastal waters in Sweden by the travel cost method,and they also used visibility as an indicator. The WTP for reducedeutrophication is significantly positive and both authors concludethat the net welfare effect is positive. Legget & Bocksteal (2000) stud-ied the pollution of the Chesapeake Bay in the US, also with the he-donic price method on house prices adjacent to the bay. They usedthe content of the bacteria E Coli as an indicator because the residentswere well informed about the pollution with the bacteria, and thebacteria were monitored as a part of a monitoring programme. Theresults indicate that house prices are significantly influenced by thewater quality in the bay.
Many former studies on groundwater and drinking water have usedthe more qualitative indicator “safe drinking water” as indicator. Asmentioned in Chapter 1, Bergström & Dorfman (1994) and Stenger &Willinger (1998) also used qualitative indicators while Press & Söder-quist used limit values explained by quantitative indicators (cf.DØRS2004 and Hasler et al, 2004). Some of the questions asked in formerstudies were e.g. “Suppose your home tap water is contaminated bynitrates to a level that exceeds the EPA's minimum standard by 50%”and "How safe do you feel about your household drinking watersupply?". The critique of these approaches has, among other things,been that they are not directly amenable to water managers in theirconsideration of the variety of policy outcomes it is necessary forthem to consider (Poe & Bishop, 1999). Poe & Bishop (op cit), fur-thermore, propose reorientation of “future groundwater contingentvaluation research towards a focus on actual, objectively obtainable,exposure levels experienced at a study site”. This approach is alsoproposed by DØRS (2004). 3 Boyle et al. (op cit.) investigate how water visibility influences house prices adja-cent to 25 lakes in Maine, USA

29
It is agreed that this is a recommendable approach in case studies, butthe approach is (too) demanding when the value of groundwater isassessed and analysed at a general, national level, as in this study.This is because many indicators have to be used to characterise lakesand river basin systems, which are highly variable in nature due todifferences in their respective natural characteristics.
2.3� The choice of indicators in the present study
The basic purpose of the specifications of the indicators in the presentstudy is to emphasise general and overall perspectives of groundwa-ter protection. There are both advantages and disadvantages associ-ated with the adoption of this overall approach, however, as this per-spective has been chosen it is important to ensure that the indicatorsused relate to this approach. The respondent should not relate to, e.g.the specific conditions prevailing in their local area – which wouldrequire many local studies.
As apparent from the description above, quantitative indicators havesome a priori advantages. These indicators could be based on infor-mation on e.g:
1. Absolute or relative reductions of nitrate and pesticide addi-tions to the recipients
2. Absolute or relative numbers of plants and animals that wouldhave worse/better living conditions if nutrients and/or pesti-cides were reduced
Changes in numbers, expressed numerically or relatively, wouldserve policy purposes because it is possible to create policy measuresto obtain these reductions. Limit values can e.g. be used to character-ise drinking water quality. But, as seen from the description above,different recipients, and especially the lakes, react very differently toreductions in nutrient loads, and no general quantitative indicatorcan therefore be applied.
Even though numbers and dose-response functions can be attractivefor policy purposes, there is no evidence that numbers are perceivedmore uniformly by respondents than more qualitative descriptions onwater quality and improvements. One result obtained in focus groupinterviews in the present study was that the respondents relatedmore confidently to qualitative indicators than to quantitative.Among other reasons, this is because some of them did not trust thelimit values, as they considered these to have been arrived at politi-cally. Quantitative indications of pollution and effects on flora andfauna were found to be more demanding cognitively to relate to andto understand than qualitative indicators.
Based on this experience and on the description of the present qualityand pollution pressure described above, we have found it warrantedto chose qualitative indicators for the valuation in this study. Thisshould increase the likelihood that the respondents understand theconstructed scenario, and should reduce respondents’ possible confu-sion by potential differences between the actual situation in their lo-
30
cal area (or another specific area for that matter) and the hypotheticalscenarios presented to them.
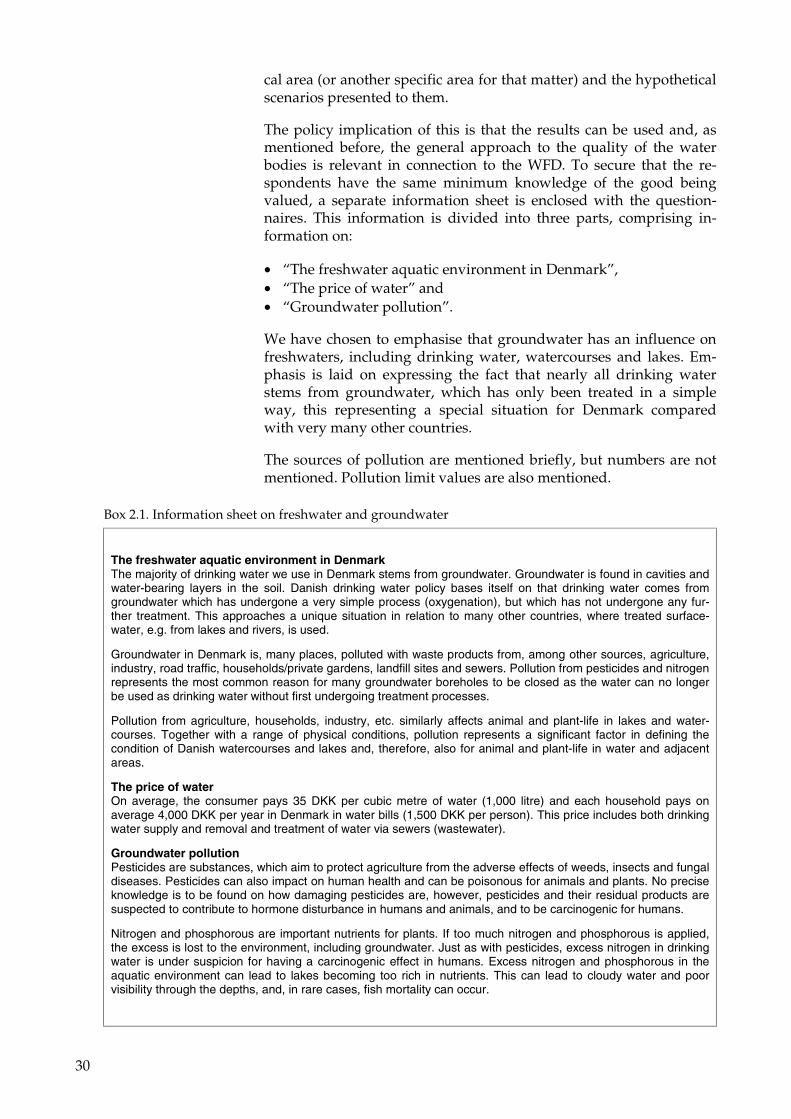
The policy implication of this is that the results can be used and, asmentioned before, the general approach to the quality of the waterbodies is relevant in connection to the WFD. To secure that the re-spondents have the same minimum knowledge of the good beingvalued, a separate information sheet is enclosed with the question-naires. This information is divided into three parts, comprising in-formation on:
• “The freshwater aquatic environment in Denmark”,• “The price of water” and• “Groundwater pollution”.
We have chosen to emphasise that groundwater has an influence onfreshwaters, including drinking water, watercourses and lakes. Em-phasis is laid on expressing the fact that nearly all drinking waterstems from groundwater, which has only been treated in a simpleway, this representing a special situation for Denmark comparedwith very many other countries.
The sources of pollution are mentioned briefly, but numbers are notmentioned. Pollution limit values are also mentioned.
Box 2.1. Information sheet on freshwater and groundwater
The freshwater aquatic environment in DenmarkThe majority of drinking water we use in Denmark stems from groundwater. Groundwater is found in cavities andwater-bearing layers in the soil. Danish drinking water policy bases itself on that drinking water comes fromgroundwater which has undergone a very simple process (oxygenation), but which has not undergone any fur-ther treatment. This approaches a unique situation in relation to many other countries, where treated surface-water, e.g. from lakes and rivers, is used.
Groundwater in Denmark is, many places, polluted with waste products from, among other sources, agriculture,industry, road traffic, households/private gardens, landfill sites and sewers. Pollution from pesticides and nitrogenrepresents the most common reason for many groundwater boreholes to be closed as the water can no longerbe used as drinking water without first undergoing treatment processes.
Pollution from agriculture, households, industry, etc. similarly affects animal and plant-life in lakes and water-courses. Together with a range of physical conditions, pollution represents a significant factor in defining thecondition of Danish watercourses and lakes and, therefore, also for animal and plant-life in water and adjacentareas.
The price of waterOn average, the consumer pays 35 DKK per cubic metre of water (1,000 litre) and each household pays onaverage 4,000 DKK per year in Denmark in water bills (1,500 DKK per person). This price includes both drinkingwater supply and removal and treatment of water via sewers (wastewater).
Groundwater pollutionPesticides are substances, which aim to protect agriculture from the adverse effects of weeds, insects and fungaldiseases. Pesticides can also impact on human health and can be poisonous for animals and plants. No preciseknowledge is to be found on how damaging pesticides are, however, pesticides and their residual products aresuspected to contribute to hormone disturbance in humans and animals, and to be carcinogenic for humans.
Nitrogen and phosphorous are important nutrients for plants. If too much nitrogen and phosphorous is applied,the excess is lost to the environment, including groundwater. Just as with pesticides, excess nitrogen in drinkingwater is under suspicion for having a carcinogenic effect in humans. Excess nitrogen and phosphorous in theaquatic environment can lead to lakes becoming too rich in nutrients. This can lead to cloudy water and poorvisibility through the depths, and, in rare cases, fish mortality can occur.

31
The information sheet is placed separately in the questionnaire toallow the respondents to use this information when answering thequestions.
The qualitative indicators used in the study are presented below inthe same wording as presented for the respondents.
2.3.1� The indicators in the CE and CV studiesAll of the indicators are presented in Table 2.1.
Table 2.1 The indicators and their descriptions
Indicator /
attribute
Levels Description of levels
Naturally clean Measures aimed primarily at agricultural practices prevent ground-water pollution from pesticides and nitrogen. In this way, clean drink-ing water is secured both now and in the future.
Uncertain The current situation, i.e. groundwater is protected as it is at the mo-ment, however, no further measures to prevent pollution are intro-duced. When a groundwater borehole is found to be polluted it isclosed and a new borehole is established. It is in this way that waterauthorities ensure a supply of clean drinking water for consumerstoday. It is uncertain whether sufficient supplies of clean drinkingwater can be provided in this way in future. There is, therefore, a riskthat in future water from our taps will exceed current limit values forpesticides and nitrogen.
Drinking waterquality
Treated By cleaning polluted groundwater for pesticide and nitrogen residues,supplies of clean drinking water can be ensured both now and in thefuture.
Very good Animal and plant-life is natural, varied and in balance. Slight to me-dium impact from human activity.
Less good Animal and plant-life is markedly different than would be the caseunder natural conditions and is, to a degree, in a state of imbalance.Representative of the current situation.
Conditions foranimal and plant-life in watercourseand lakes
Poor Animal and plant-life is significantly different that would be the caseunder natural conditions and is in a state of serious imbalance. Oftencompletely changed due to human activity.
The quality levels are derived from the scientific and monitoring re-sults referred to in Section 2.1.
In the CE survey, it is expressed that the following three quality lev-els can describe the general quality of Danish drinking water:
Naturally clean: Measures aimed primarily at agricultural practicesprevent groundwater pollution from pesticides and nitrogen. In thisway, clean drinking water is secured, both now and in the future.
Uncertain: The current situation, i.e. groundwater is protected as it isat the moment, however, no further measures to prevent pollutionare introduced. When a groundwater borehole is found to be pollutedit is closed and a new borehole is established. It is in this way thatwater authorities ensure a supply of clean drinking water for con-sumers today. It is uncertain whether sufficient supplies of cleandrinking water can be provided in this way in future. There is, there-

32
fore, a risk that in future water from our taps will exceed current limitvalues for pesticides and nitrogen.
Treated/purified: By cleaning polluted groundwater for pesticide andnitrogen residues, clean drinking water supplies can be ensured bothnow and in the future.
As already mentioned, the conditions for animal and plant-life in theaquatic environment are affected both by the prevailing natural con-ditions and the degree of pollution. In consideration of that the con-ditions for animal and plant-life vary noticeably from place to place,the following three quality levels are used to characterise the condi-tions in Danish watercourses and lakes:
Very good: Animal and plant-life is natural, varied and in balance.Slight to medium impact from human activity.
Less good: Animal and plant-life is markedly different than would bethe case under natural conditions and is, to a degree, in a state of im-balance. This represents the current situation.
Poor: Animal and plant-life is significantly different than would bethe case under natural conditions and is in a state of serious imbal-ance. Animal and plant-life is often completely changed due to hu-man activity.
In the CV study, the information provided prior to the valuationquestion is formulated in two separate scenarios.
The first scenario is: “By carrying out measures, primarily in agri-culture, naturally clean drinking water can be secured both now andin the future.
At the same time, very good conditions can be secured for animal andplant-life in watercourses and lakes. This means that animal andplant-life will be more natural, varied and balanced, and affected byhuman activity to only a slight to average degree.”
The second scenario is: “Via treatment of polluted groundwater, pes-ticide and nitrogen residue can be removed, so that the treated watercan be used as water for drinking and other purposes. In this way,clean drinking water can be provided both now and in the future. Incontrast with the previous proposal, however, groundwater is notprotected from pollution with pesticides and nitrogen. Implementa-tion of the treatment proposal will not involve improvements in con-ditions for animal and plant-life in watercourses and lakes, therefore,conditions will remain less than good. This means that animal andplant-life in watercourses and lakes will be markedly different thanwould be so under natural conditions and will be in slight imbal-ance”.
By using these definitions we have made an effort to make thewordings of the scenarios resemble each other as closely as possiblein the CE and CV-surveys to improve the possibility of comparing theresults.
33
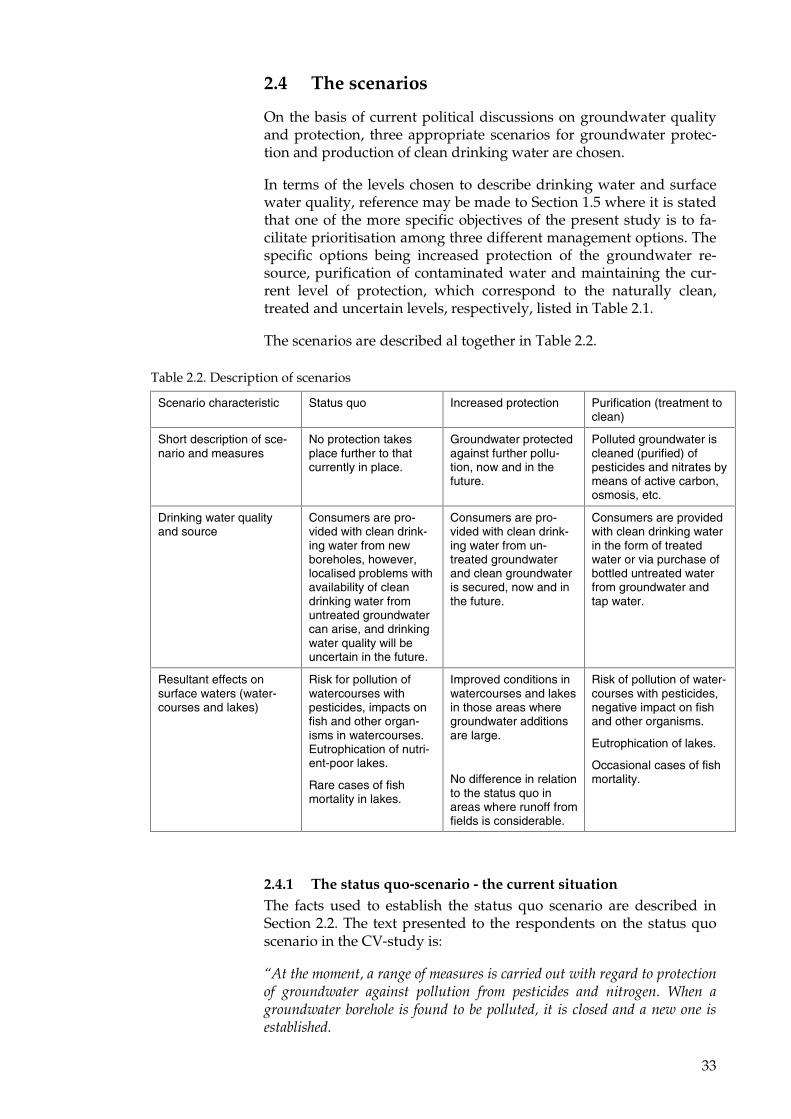
2.4� The scenarios
On the basis of current political discussions on groundwater qualityand protection, three appropriate scenarios for groundwater protec-tion and production of clean drinking water are chosen.
In terms of the levels chosen to describe drinking water and surfacewater quality, reference may be made to Section 1.5 where it is statedthat one of the more specific objectives of the present study is to fa-cilitate prioritisation among three different management options. Thespecific options being increased protection of the groundwater re-source, purification of contaminated water and maintaining the cur-rent level of protection, which correspond to the naturally clean,treated and uncertain levels, respectively, listed in Table 2.1.
The scenarios are described al together in Table 2.2.
Table 2.2. Description of scenarios
Scenario characteristic Status quo Increased protection Purification (treatment toclean)
Short description of sce-nario and measures
No protection takesplace further to thatcurrently in place.
Groundwater protectedagainst further pollu-tion, now and in thefuture.
Polluted groundwater iscleaned (purified) ofpesticides and nitrates bymeans of active carbon,osmosis, etc.
Drinking water qualityand source
Consumers are pro-vided with clean drink-ing water from newboreholes, however,localised problems withavailability of cleandrinking water fromuntreated groundwatercan arise, and drinkingwater quality will beuncertain in the future.
Consumers are pro-vided with clean drink-ing water from un-treated groundwaterand clean groundwateris secured, now and inthe future.
Consumers are providedwith clean drinking waterin the form of treatedwater or via purchase ofbottled untreated waterfrom groundwater andtap water.
Resultant effects onsurface waters (water-courses and lakes)
Risk for pollution ofwatercourses withpesticides, impacts onfish and other organ-isms in watercourses.Eutrophication of nutri-ent-poor lakes.
Rare cases of fishmortality in lakes.
Improved conditions inwatercourses and lakesin those areas wheregroundwater additionsare large.
No difference in relationto the status quo inareas where runoff fromfields is considerable.
Risk of pollution of water-courses with pesticides,negative impact on fishand other organisms.
Eutrophication of lakes.
Occasional cases of fishmortality.
2.4.1� The status quo-scenario - the current situationThe facts used to establish the status quo scenario are described inSection 2.2. The text presented to the respondents on the status quoscenario in the CV-study is:
“At the moment, a range of measures is carried out with regard to protectionof groundwater against pollution from pesticides and nitrogen. When agroundwater borehole is found to be polluted, it is closed and a new one isestablished.

34
It is uncertain whether clean drinking water can be provided in sufficientamounts by this method in the future. There is, therefore, a risk that tap wa-ter will exceed current limits for pesticides and nitrogen content in the fu-ture.
Conditions for animal and plant-life in watercourses and lakes are not sogood. Animal and plant-life is in a state of imbalance many places and ismarkedly different than would be so if conditions were natural. The primaryreason for changes in the condition of the aquatic environment is humanactivity. “
In the CE study this text is the same as the definitions of the statusquo-levels, cf. Section 2.3.1. above:
“The current situation is characterised as “uncertain”: The current situa-tion, i.e. groundwater is protected as it is at the moment, however, no furthermeasures to prevent pollution are introduced. When a groundwater boreholeis found to be polluted it is closed and a new borehole is established. It is inthis way that water authorities ensure a supply of clean drinking water forconsumers today. It is uncertain whether sufficient supplies of clean drink-ing water can be provided in this way in future. There is, therefore, a riskthat in future water from our taps will exceed current limit values for pesti-cides and nitrogen.
Animal and plant-life is less good and markedly different than would be thecase under natural conditions and is, to a degree, in a state of imbalance.This represents the current situation”.
2.4.2� Protection scenario: Improved protection in drinking waterareas
The information provided to the respondents on the protection sce-nario in the CV-survey is that:
“By carrying out measures, primarily in agriculture, naturally clean drink-ing water can be secured both now and in the future. At the same time, verygood conditions can be secured for animal and plant-life in watercourses andlakes. This means that animal and plant-life will be more natural, varied andbalanced, and affected by human activity to only a slight to average degree. “
In the CE study the scenario is formulated in the definitions of theattributes: Naturally clean groundwater: Measures aimed primarily at agri-cultural practices prevent groundwater pollution from pesticides and nitro-gen. In this way, clean drinking water is secured both now and in the future.Animal and plant-life in watercourses and lakes (ed.) is natural, varied andin balance. Slight to medium impact from human activity.
An assumption behind this text and scenario is that the use of pesti-cides and nitrogen is reduced by agricultural measures, i.e. environ-mentally sensitive farming practices and reduced nutrient applica-tions, set-aside, forestation and ceasing cultivation altogether.
An effort sufficient to prevent groundwater pollution, defined asbreaching limit values, is implemented. Under this scenario, therewould be no need to close boreholes in future. There would, how-

35
ever, be potential for borehole closure as a result of previous pesticideuse.
2.4.3� Purification scenario - Groundwater treated for drinkingwater supply
The information provided to the respondents in the CV study is:
“ Via treatment of polluted groundwater, pesticide and nitrogen residue canbe removed, so that the treated water can be used as water for drinking andother purposes. In this way, clean drinking water can be provided both nowand in the future. In contrast with the previous proposal (The protectionscenario, ed.), however, groundwater is not protected from pollution withpesticides and nitrogen. Implementation of the treatment proposal will notinvolve improvements in conditions for animal and plant-life in water-courses and lakes, therefore, conditions will remain less than good. Thismeans that animal and plant-life in watercourses and lakes will be markedlydifferent than would be so under natural conditions and will be in slightimbalance. “
In the CE study, this description refers to the alternative, purification,which is described by the following indicators:
By cleaning polluted groundwater for pesticide and nitrogen residues, cleandrinking water supplies can be ensured both now and in the future. Animaland plant-life will be markedly different than would be the case under natu-ral conditions and is, to a degree, in a state of imbalance (as the currentsituation): Animal and plant-life is significantly different that would be thecase under natural conditions and is in a state of serious imbalance. Animaland plant-life is often completely changed due to human activity.
The assumption behind this, is that groundwater can be treated withactive carbon, osmosis or other treatment techniques. Almost allgroundwater can, therefore, be used as drinking water, and thedrinking water will conform to limit values for nitrates and pesti-cides. As protection measures are no higher than in the status quoscenario, nitrates and pesticides will be added to watercourses andlakes to the present or to a greater extent. There is, therefore, a riskthat animal and plants associated with watercourses and lakes areimpacted negatively by pesticides. This is particularly the case foranimal-life, however, terrestrial plant communities along water-courses can also be affected. There is an increased risk for eutrophi-cation of lakes, with more frequent cases of fish mortality as a result.
In all these three scenarios there would be continued need for defen-sive pumping and drilling to limit the pollution that has alreadytaken place.
Further information of the wording of the scenarios in the CE and CVquestionnaires, respectively, are found in the Annexes 2 and 3.

36
3� The part of the CV and the CEstudies common to both
The CV and the CE surveys are aimed at estimating WTP for thesame scenarios and problems regarding groundwater protection. Asfar as possible, the same wording and framing has been used in thetwo surveys. In this section, the common parts of the surveys are pre-sented, comprising the scenarios and indicators as well as the com-mon questions in the surveys – introduction and “warm up” as wellas debriefing questions.
Detailed descriptions of the methods CV and CE are not providedhere, but can be found in textbooks on environmental economics (seee.g. Bateman et al. 2002; Hanley et al. 1997; Mitchell & Carson 1989).A range of recommendations on how to perform reliable, realistic andcredible valuation surveys can be found in these textbooks as well asin the recommendations from the NOAA panel (the National Oceanicand Atmospheric Administration, Arrow et al., 1993), and in the ex-tensive literature in this field.
3.1� The stages in a stated preference study
3.1.1� Basic assumptionsThe basic requirement for applying valuation is that it is possible andreasonable to assign a value to the environmental goods and that thisvalue reflects the individual consumer’s WTP for the good in relationto other goods. Some important assumptions behind this principleare that;
• it is assumed that the consumer holds a preference for more overless, i.e. that two units of a good will be preferred over oneunit (scale).
• the consumer is able to carry out a complete ranking of the valueof different goods. This means that the individual actor haswell-defined preferences in relation to all goods, includingthose not necessarily consumed.
• it is assumed that the consumer has full information of his/herchoices and the substitutes, and the consumer has what arecalled transitive preferences. This involves that the individualdisplays consistency in consumer choices: If good A is pre-ferred over good B, and good B is preferred over good C, thengood A will be preferred over good C (cf.Bateman et al., 2002).
3.1.2� Hypothetical bias and scopeIf these basic assumptions fail there is a risk of hypothetical bias, thisbeing an often-mentioned problem associated with stated preferencemethods, especially the CV method. One of the reasons is that re-spondents might be induced to behave strategically. This is a potentialweakness of the hypothetical methods. Strategic behaviour can be

37
explained by the fact that respondents do not always have the incen-tive to answer truthfully, as they are not going to pay the statedamount in reality. In other words, the respondent reduces his/hersbid in the belief that someone else will pay for providing the good.On the contrary, respondents who are very much pro-environmentmay potentially overbid or ”yeah-say”’ in order to influence the pol-icy outcome. This risk is particularly the case when the valuation isabout a public good that gives the respondents scope to ”free-ride”.However, the right kind of information, making the valuation sce-nario as realistic as possible, stressing that everyone must participateand using realistic payment vehicles can all help to tune down thehypothetical nature of the scenario and impede strategic answers (cf.Morrison, 2002) Furthermore, such bids can be identified by debrief-ing questions.
Other sources of bias are embedding and part-whole bias. Embed-ding refers to bias when WTP for a particular good vary “over a widerange depending on whether the good is assessed on its own or em-bedded as part of a more inclusive package“ (Kahneman & Knetch1992:58, here from Christie, 2001:256).
According to Christie and several CV practicians (Desvousges et al.1993 and Arrow et al. 1993) embedding poses a threat to CV-validity.However, Hanemann (1994) identified three notions related to theembedding effects;
• scope effects appear when WTP does not change when scale orscope of the valuation problem changes;
• sequencing effects appear when WTP change according to whenthe WTP question on a good is asked in a sequence:
• sub-additivity appears when the WTP for a change in a compos-ite of goods differs from the sum of individual valuation ofthese goods.
According to Hanemann (op cit.) scope effects can be avoided by sur-vey design, while sequencing effects and sub-additivity can be ex-plained by economic theory, i.e. from substitution effects and dimin-ishing marginal rates of substitution (Christie 2001:257). The conclu-sion is that the two latter, i.e. sequencing and sub-additivity, do notpose a threat to CV-studies, and that scope effects can be avoided.Bateman et al. (2001) have tested scope sensitivity in an extensivepaper on visible choice sets and scope sensitivity and conclude thatscope sensitivity is not observed when applying advanced disclosuredesigns. For further elaboration of these results, see Bateman et al.(2001).
In this survey the goods are nested – i.e. there are several effectsstemming from changes in the management of the groundwater re-source – both effects for drinking water quality and quality of surfacewaters. This can create problems with the perception of scale, andattention has to be paid to how these goods are presented to the re-spondents in the two surveys.
38
3.1.3� The design of a stated preference studyNormally the design of a stated preference survey consists of threefundamental steps:
1. Introductory and detailed description of the environmentalchange, including the institutional setting which will provide thechange and the scale.
2. Elicitation of willingness to pay. CV and CE represents two possi-bilities:
o Description of the payment vehicle and a method to elicitthe respondents’ preferences with respect to the environ-mental change (CV), or
o Description of the payment vehicle and presentation ofchoice-alternatives characterised with different levels ofthe environmental change and the price (CE)
3. Debriefing questions and socio-demographic information.
Evidently, all parts except from the payment elicitation questionsshould be held the same in a CE and CV survey to allow for compari-sons.
Testing the questionnaireEvery part of the survey should be tested before submission. The pre-sent surveys are tested by several methods: focus group-testing, indi-vidual interviews and pre-testing of questionnaires. One focus grouptest was held and ten individual interviews were conducted. Subse-quently, the questionnaires were revised and sent out to pilot re-spondents recruited at two research institutes, comprising serviceemployees with short educations as well as administrators and re-searchers, both economists, sociologists, biologists and engineers.
3.1.4� The introductory information and questionsMost surveys start with an introductory text and introductory ques-tions to “warm up” the respondents. Hereby, they are encouraged tothink seriously about the topic of interest, the scale, etc. This is doneboth to provide the necessary information and to impede strategicanswers (Bateman et al. 2002).
Information is of course of particular importance if it is a risk that therespondent is unfamiliar with the good in question. This would im-ply that the respondent is unlikely to provide an accurate responseleading to hypothetical bias and poor estimates for the consumer sur-plus measure. Lack of familiarity is, however, less likely to be aproblem for valuing services provided by e.g. water utilities becauseconsumers are already accustomed to paying for a base level in serv-ice (CIE 2001). Goods connected to surface water and biodiversity aremore likely to be unfamiliar to respondents, and proper informationand introduction to the respondents are, therefore, important. How-ever, too much information can affect the response unfavourably be-cause of boredom and because the act of responding become tootime-consuming.
It is it, however, necessary to keep in mind that survey respondentsbring their own knowledge of the quality of the goods to valuation

39
exercises. If information on the quality is not explicitly described andthe respondents at the same time have different levels of prior infor-mation about the environmental quality of the good to be valued, theWTP estimates will vary due to differences in quality perception, notonly preferences. In relation to the wording used in the description ofthe different alternatives and indicator levels it has been attempted touse as neutral a wording as possible.
The solution is, therefore, to make an understandable and unambigu-ous description of the good to be valued and describe the qualitychange or improvement in such detail that the respondents have thesame level of basic information. It is also of importance to give suffi-cient information about the provision of the good so the respondentwill be convinced that the good will be delivered. In addition, ques-tions of knowledge and perceived quality of the good and change inthis quality can be incorporated in the survey, and used as determi-nants of WTP.
The background information is, as mentioned, equal in the CE andCV questionnaires, and the wording is apparent from Box 2.1., pre-sented and commented upon in Chapter 2.
In both the CV and the CE survey, this background information isfollowed by additional information of the scenarios connected to thevaluation questions. This information deals with explanations of thescenarios and indicators (attributes), presented and described inChapter 2. In connection with this information, the respondents arealso informed that the issue relates to changes on a national scale, andthat specific regional problems are not referred to in this study.
Determining the level of detail and amount of information necessaryto describe the alternatives, including their attributes and levels, andthe scenario has been afforded a great deal of attention in the study,even though the information presented is not very comprehensive.
The pre-tests conducted have provided interesting insights into dif-ferent individuals demand for, and use of, information. With regardto the amount of information and level of detail provided in the pres-ent study, it was found that most “experts” – i.e. people employedwithin the environmental policy/management arena – felt that theyneeded more, and more detailed/subtle, information if they were tofeel comfortable making a choice. Thus, they found it hard to acceptthe general perspective adopted in the study. Most non-experts, onthe other hand, found the level of information and detail satisfactory;hence, they acknowledged that increasing the amount of informa-tion/level of detail would be likely to result in information overload.As it is important to ensure that all respondents receive the same in-formation prior to completing the CE, it will evidently be impossibleto satisfy everyone. Accordingly, the amount and detail of the infor-mation provided in the present study will no doubt be considered tooextensive by some and too limited by others. For most, however, theamount and detail of the information is believed to be sufficient,while also being fairly easy to read and grasp.
The information provided intends to increase the likelihood that re-spondents understand the constructed scenario. The intention is also

40
to ensure that respondents are not confused too much by potentialdifferences between the actual situation in their local area (or anotherspecific area for that matter) and the hypothetical scenarios presentedto them, at the national, general level. At the same time, we have at-tempted to avoid information overload and, hereby, tiring the re-spondents. The information is submitted to the respondents on aseparate sheet and they can read the information whenever theywant. The information–sheet is introduced in the foreword (intro-ductory text) to the questionnaire.
Suitable information and making people think of their present budg-ets are potential “preventive” measures in relation to mitigate prob-lems related to the risk for hypothetical bias, mentioned earlier.
3.2� The payment vehicle in the surveys
3.2.1� The WTP questions and choice of a reliable payment vehiclePeople are asked directly to state their WTP (or WTA) in CV. Differ-ent questions can be asked, e.g. open-ended questions (how much areyou willing to pay?), close-ended questions in payment cards or di-chotomous choices. In CE, respondents are supposed to state theirWTP indirectly by making trade-offs between alternative choices. Thealternatives are characterised by different levels of attributes. Theattributes comprise a price attribute and, hereby, WTP can be elicited.
The welfare implications are expressed in terms of a change in themonetary amount which would be taken from the individual (WTP)to keep the individual’s overall level of utility constant. The appro-priate measure depends upon the relevant property right to the envi-ronmental good. The measure is often referred to as Hicksian con-sumer surplus measures (Carson et al. 2001).
When the environmental change is an improvement in quality, themeasure is WTP. This implies that the researcher has to describe amethod of payment in the scenario, commonly referred to as thepayment vehicle.
The choice of payment vehicle forms a substantive part of the surveydesign and should have a plausible connection with the good it isbeing used to value (Garrod & Willis 1999). The payment vehicle canbe coercive, e.g. taxes, fees or annual sums such as the water bills.
Alternatively, it can be voluntary in the form of donations to an envi-ronmental foundation. However, voluntary payments and donationshave proved to overstate WTP more than coercive payments. It isimportant to choose a payment vehicle that will be perceived as real-istic, fair and equitable for all respondents. If this can be the case, itmay lead to fewer non-responses or fewer protest responses andavoid giving the respondent an opportunity for free-riding. Otheraspects of payment are the timing of payment by the individual orthe household, and the choice of format to elicit the payment bid.
An amount which represents an additional payment to the annualwater bill was chosen as payment vehicle, as it is our assumption that

41
this payment is credible, relevant, acceptable and coercive (Batemanet al., 2002), because consumers are accustomed to pay for the house-holds’ water in this way. An increase in the water tax would poten-tially not be credible as the present government intends to stop fortax increases in Denmark. Annual payments are chosen as opposed tomonthly payments. It is not expected that the WTP will be higher ifmonthly payments were introduced, so an alternative would be topresent both annual and monthly payments. It has been concluded,however, that information on both monthly and annual paymentswould be too information demanding for the respondents, and theyearly payment is most relevant because the water bill is paid annu-ally. Household payment is chosen because the water bill is paid perhousehold and not individually.
Using increases in the price of water, expressed as DKK/m3, as pay-ment vehicle was also considered, expecting that the water pricewould be an intuitively understandable and uncontroversial paymentvehicle for the respondents due to its dependence on consumption. Inrelation to the subsequent interpretation of results and aggregation ofWTP-estimates, however, it would require information on house-holds’ annual water consumption. According to the results of ourpre-tests, this information is difficult to obtain as most people do notknow how much water they consume. Based on this, the original ideaof using the price of water as payment vehicle was abandoned in fa-vour of using a fixed annual increase in the water bill per household,which – though probably being more controversial to the respon-dents – will significantly ease interpretation of the results.
3.2.2� The budget constraint and “cheap talk”The information on the payment in both the CV and the CE is speci-fied so that the respondents should be aware about the payment ve-hicle and constraints on the households’ budget. In both of the sur-veys, the assumptions are that the costs of implementing the policyalternatives are covered by the Danish consumers, and that all con-sumers will contribute equally to implementation of the scenarios bymeans of a fixed annual sum per household. This sum is paid once ayear via the water bill. The respondents are told that their statedamount (WTP) represents a sum over and above their present waterbill. In addition so-called “cheap talk” is added. This text is added tothe budget reminder (cf. the CV and CE questionnaires in the appen-dices):
“Results from similar studies have shown that people have a tendency toover-estimate how much they are actually willing to pay for implementationof the various policy measures. Before you mark your selection, therefore, wewould ask you to be totally sure that you are willing and able to pay thestated sum associated with an alternative.”
This text is intended to induce respondents to provide as valid andreliable responses as possible and to discourage the exhibition ofstrategic behaviour. Highlighting that all consumers must contribute,and that they must do so equally, is intended to discourage respon-dents from free-riding. Likewise, stipulating that the stated amountsare additional to the current water bill is considered relevant as it
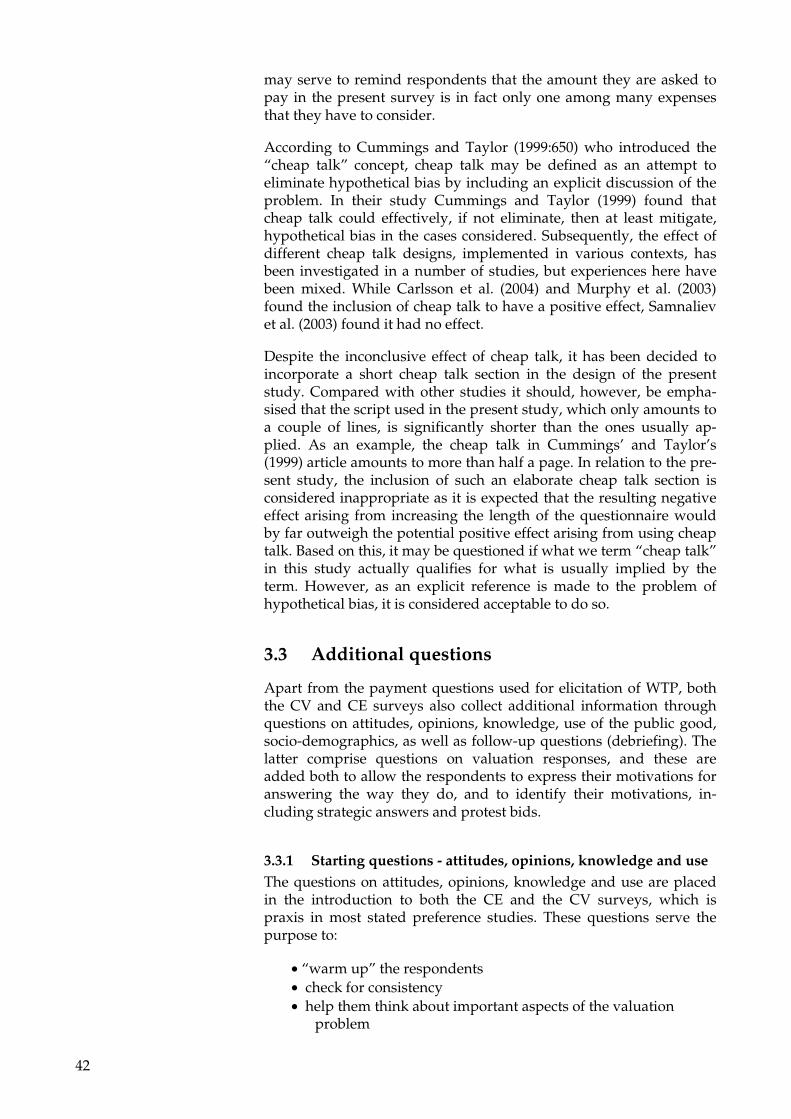
42
may serve to remind respondents that the amount they are asked topay in the present survey is in fact only one among many expensesthat they have to consider.
According to Cummings and Taylor (1999:650) who introduced the“cheap talk” concept, cheap talk may be defined as an attempt toeliminate hypothetical bias by including an explicit discussion of theproblem. In their study Cummings and Taylor (1999) found thatcheap talk could effectively, if not eliminate, then at least mitigate,hypothetical bias in the cases considered. Subsequently, the effect ofdifferent cheap talk designs, implemented in various contexts, hasbeen investigated in a number of studies, but experiences here havebeen mixed. While Carlsson et al. (2004) and Murphy et al. (2003)found the inclusion of cheap talk to have a positive effect, Samnalievet al. (2003) found it had no effect.
Despite the inconclusive effect of cheap talk, it has been decided toincorporate a short cheap talk section in the design of the presentstudy. Compared with other studies it should, however, be empha-sised that the script used in the present study, which only amounts toa couple of lines, is significantly shorter than the ones usually ap-plied. As an example, the cheap talk in Cummings’ and Taylor’s(1999) article amounts to more than half a page. In relation to the pre-sent study, the inclusion of such an elaborate cheap talk section isconsidered inappropriate as it is expected that the resulting negativeeffect arising from increasing the length of the questionnaire wouldby far outweigh the potential positive effect arising from using cheaptalk. Based on this, it may be questioned if what we term “cheap talk”in this study actually qualifies for what is usually implied by theterm. However, as an explicit reference is made to the problem ofhypothetical bias, it is considered acceptable to do so.
3.3� Additional questions
Apart from the payment questions used for elicitation of WTP, boththe CV and CE surveys also collect additional information throughquestions on attitudes, opinions, knowledge, use of the public good,socio-demographics, as well as follow-up questions (debriefing). Thelatter comprise questions on valuation responses, and these areadded both to allow the respondents to express their motivations foranswering the way they do, and to identify their motivations, in-cluding strategic answers and protest bids.
3.3.1� Starting questions - attitudes, opinions, knowledge and useThe questions on attitudes, opinions, knowledge and use are placedin the introduction to both the CE and the CV surveys, which ispraxis in most stated preference studies. These questions serve thepurpose to:
• “warm up” the respondents• check for consistency• help them think about important aspects of the valuation
problem

43
• provide information that can help to validate the valuations• be used as predictors of WTP
Consequently, some of the questions are asked to facilitate tests ofconsistency between the respondents’ statements, preferences andwillingness to pay, e.g. about the respondents’ general view on envi-ronmental problems and whether the current budgets for water pro-tection are sufficient in relation to other environmental problems andother public services. By “warming up” the respondents, these ques-tions also induce the respondents to think about the trade-offs be-tween environmental policies and programmes as well as betweenpublic projects in general.
Questions asked in this section of the questionnaires comprise ques-tions on attitudes to the environmental problems, which are regardedmost important, and how is water quality positioned in relation toother environmental problems? The answers to these questions canbe compared to the results of the studies referred to in Section 1.1. onthe Danish population’s concern for water quality problems (Cf.IFKA 1999; the European Opinion Research Group, 2002).
Furthermore, questions on consumption are asked. The questions ofconsumption of bottled water as a substitute for tap water serves thepurpose of making the respondents think of these substitutes. Ques-tions on water-savings and water consumption in quantitative (litre)and monetary terms (the annual water bill) make the respondentsthink about their own water consumption and relate to their presentexpenses for water, and hereby to their household budget. The water-saving questions are, furthermore, worded in the same terms as thequestions in a survey done by the Statistics Denmark, and hereby theresponses are comparable. By comparing the answers, we can also seewhether the respondents of the CV and CE surveys are representativewith regard to water-saving practices.
There are also questions on the use of surface waters for fishing andbathing, and questions on which qualities they prefer most, how of-ten they bathe, fish, etc., cf. Annex 2 and 3.
3.3.2� Debriefing and follow up-questionsInclusion of a set of follow-up questions upon completion of thevaluation question(s) is recommended, and additional questions areasked in most surveys.
Follow-up and debriefing questions are used to control for biased andillegitimate answers. With such follow-up and debriefing questions, itis possible to check respondents’ understanding and acceptance ofthe constructed scenarios and to identify their motives for answeringas they did to the valuation question (Arrow et al., 1993; Bateman etal., 2002:145). Thereby, an assessment of the rationality and validityof the expressed preferences is facilitated.
Ideally, follow-up questions should be asked in relation to both CEand CV-surveys, but the formulation of questions that may serve toreveal irrational and/or invalid answers is less straightforward in CE

44
than in CV-surveys due to the more indirect nature of the valuationexercise in the former.
In the present study, 6 questions regarding respondents’ experienceof the choice exercise and how they made their choices are asked im-mediately after both the CV and the CE exercise.
In the first of these questions (Question 6.1), respondents are askedwhether or not they found it difficult to make the choices. One of themotives for asking the question is that respondents’ answers mayindicate something about the reliability of the choices. If choices areconsidered difficult, it may indicate that choice complexity was high– and perhaps too high – for the given respondent. A supplementarymethod when addressing and correcting hypothetical bias is, there-fore, to use certainty calibration (Samnaliev et al., 2003:1). In both thepresent CV and the CE surveys, this certainty calibration approach isadopted. Respondents are – upon completion of the valuation task –asked on a scale ranging from 1 to 10 (with 0 denoting a low degreeof certainty and 10 denoting a high degree of certainty) to state howcertain they are about the answer they just stated.
It is then possible to treat the answers provided by respondents stat-ing a level of uncertainty below the determined threshold level (e.g.8) by subsequently “re-coding” them, so that positive answers to theWTP question for these respondents no longer are treated as a “yes”(Samnaliev et al., 2003:2).
Due to the survey format (i.e. mail administered), it has been consid-ered inappropriate to ask explicit questions concerning respondents’understanding and acceptance of the scenario, while it has provedimpossible to identify questions suitable for disclosing the underlyingreasons for the implicitly stated WTPs.
Instead, the focus of the included follow-up questions is on assessingthe extent to which respondents’ decision strategies conform to theassumptions underlying the CV and the CE approach, and on shed-ding light on the level of certainty by which the WTP bids and thechoices can be interpreted.
One example: In Question 6.6, respondents are asked whether or notthey, if the water coming out of their tap was water that was cleanedof nitrogen and pesticides, would use it as drinking water. This ques-tion has been asked in order to prevent a potential shortcoming of theconstructed scenario. More specifically, we do not know which con-sequences people associate with the “treated” and “uncertain” waterquality levels. That is, we do not know if they still will perceive thewater coming out of their tap as drinking water, albeit of a lowerquality than “naturally clean” water, or if they will find it necessaryto buy water for drinking purposes if we do not ask. This informationmight, therefore, prevent problems in relation to the interpretation ofresults, as the value estimates derived from peoples’ choices are likelyto reflect peoples’ perception of these consequences. More specifi-cally, people finding it necessary to buy drinking water are expectedto state a relatively low value compared to others, as the value theyassociate with a given scenario needs to be adjusted with their ex-pected expenses on buying water. Prior to making their choices, these

45
respondents should, therefore, ideally make calculations regardingthe more specific magnitude of their expected expenses on buyingwater in the situations described by the “uncertain” and “treated”water quality levels, otherwise their choices would not be completelyrational. However, imposing such strict requirements on respon-dents’ decision strategies is considered unreasonable. Thus, a morerealistic expectation may be that respondents answering “no” to thisquestion will exhibit a lower WTP than others for the “uncertain” and“treated” water quality levels. In this context, the basic purpose ofQuestion 6.5 is to clarify if respondents perceive “treated” water asdrinking water, while Question 2.3 serves to provide clarification onthe issue in relation to the “uncertain” water quality level.
For respondents providing a negative answer to the question, a fol-low-up concerning their expected expenses on buying water shouldideally be included. However, this was not considered appropriate inthe present context due to the very general and hypothetical nature ofthe scenario, which does not invite people to engage in such veryspecific calculations. Thus, as indicated above, it is not only consid-ered sufficient, but also highly satisfactory, if respondents take theissue into consideration. An interesting (though very weak) validitytest may, therefore, be to investigate if respondents providing anegative answer to the question conform to the expectation by at-taching a lower value to the “treated” water quality level than others.And if they do, how much does the WTP differ?
For further introduction to the follow-up questions, see the question-naires in Annex 2 and 3.
3.3.3� Socio-demographic questionsThese questions are asked in the final part of the questionnaires be-cause respondents can be sensitive answering this type of question,e.g. questions of income. The questions asked in this section of thequestionnaire relate to age, gender, household and personal income,household size and number of children, house-type and communitynumber (location of residence). The answers to these questions can beused for the tests of differences in WTP between households with andwithout children, between regions, between income groups as well asdifferences explained by gender.
3.3.4� Survey mode and sample sizeA professional survey institute has been used in the pre-tests and thesubmission of the surveys. The institute has been chosen in order tosecure a good response rate, using a panel of respondents which isrepresentative of the Danish population. The institute GfK-Denmark(Growth from Knowledge) has been used. They have sent the ques-tionnaires to 1,800 households, 900 for the CV and 900 for the CE.
Based on statistical considerations, sample sizes between 250 and1.000 (depending on the format) respondents are recommended foreach subgroup of the population in CV surveys. Extending the rec-ommendation from the CV case, the required sample sizes are proba-bly smaller due to the increased amount of information collected

46
from each respondent through the multiple choice tasks (Bateman etal., 2002:111). However, potential correlation between observationsmade by the same individual may imply that the scope for reducingsample sizes in the CE survey with reference to increased extractionper respondent is limited.
3.4� Socio-economic characteristics, attitudes andhabits: The responses to the common part ofthe questionnaires
3.4.1� Socio-economic comparison between the sample and thepopulation
This section describes the data collected from the responses from thefirst and the last section of the questionnaires. The responses from thetwo questionnaires (CE and CV) are pooled, or aggregated, to obtainan overview of the quality of the total sample. To find out whetherthe responses are representative they are compared to populationdata from Statistics Denmark (DST) by graphical comparison andtesting of resemblance. The control of a discrete distribution is madeby means of a Q-test. The responses are hereafter referred to as the”sample”.
Figure 3.1. Household size
Figure 3.1 shows the distribution of the size of family in the sample. Itappears that the sample contains a larger fraction of two-personfamilies than the mean Danish population, and vice versa for ”sin-gles”, i.e. households consisting of only one person. On the whole,the sample reflects the population well. Additionally, it is an impor-tant fact that the sample has been collected on an individual basis –not on a household basis. I.e. the individuals are representative of thepopulation, but the households do not need to be so. The over-representation of 2-person households in the sample can be explained
���������������� ������� ����� �������������� ������
0
10
20
30
40
50
1 person
2 personer
3 personer
4 personer
5 personer
6- personer
��������������
��������
�
DST Sample
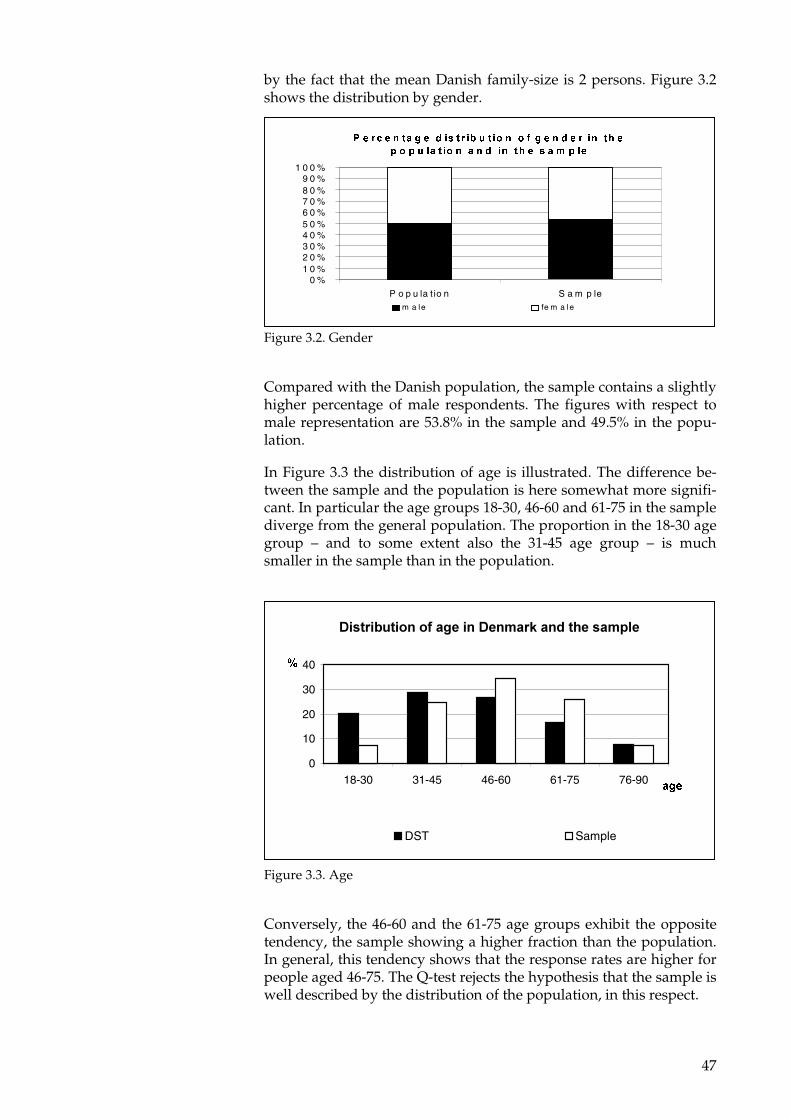
47
by the fact that the mean Danish family-size is 2 persons. Figure 3.2shows the distribution by gender.
Figure 3.2. Gender
Compared with the Danish population, the sample contains a slightlyhigher percentage of male respondents. The figures with respect tomale representation are 53.8% in the sample and 49.5% in the popu-lation.
In Figure 3.3 the distribution of age is illustrated. The difference be-tween the sample and the population is here somewhat more signifi-cant. In particular the age groups 18-30, 46-60 and 61-75 in the samplediverge from the general population. The proportion in the 18-30 agegroup – and to some extent also the 31-45 age group – is muchsmaller in the sample than in the population.
Figure 3.3. Age
Conversely, the 46-60 and the 61-75 age groups exhibit the oppositetendency, the sample showing a higher fraction than the population.In general, this tendency shows that the response rates are higher forpeople aged 46-75. The Q-test rejects the hypothesis that the sample iswell described by the distribution of the population, in this respect.
� � �� � � �� � � � � � � � � � � �� � �� � � � � �� ��� � �
� � � �� � � � �� � �� ��� � �� � � � ��
0 %1 0 %2 0 %3 0 %4 0 %5 0 %6 0 %7 0 %8 0 %9 0 %
1 0 0 %
P o p u la t io n S a m p lem a le fe m a le
��������������� ���� ���������� ������
0
10
20
30
40
18-30 31-45 46-60 61-75 76-90���
�
DST Sample

48
The distribution of household income in the sample shows a betterresemblance to the population. Two income intervals exhibit somedifference though; namely “100,000-149,999 DKK” and “400,000 DKKand above”. According to Statistics Denmark, 40% of Danish house-holds has an income higher than 400,000, which is reasonable to ex-pect. The sample, however, exhibits a much higher frequency of oc-currence for that particular income group. Approximately 53% of thesample is in the high-income section. Again this might be caused bythe problem of collecting data on an individual basis. After all, largerhouseholds have a higher yearly income. The above is illustrated inFigure 3.4.
Figure 3.4. Income distribution
There are also apparent differences regarding households and fami-lies with and without children. From Figure 3.5, it is apparent that alarge proportion of Danish families has no children. Approximately77% of households have no children while, in the sample, householdswithout children account for 55% of the response.
�������������������� ���������������� ����������
������� �
0
10
20
30
40
50
60
-99999 kr
100000-149999 kr
150000-199999 kr
200000-299999 kr
300000-399999 kr
400000- kr
�
DST Sample
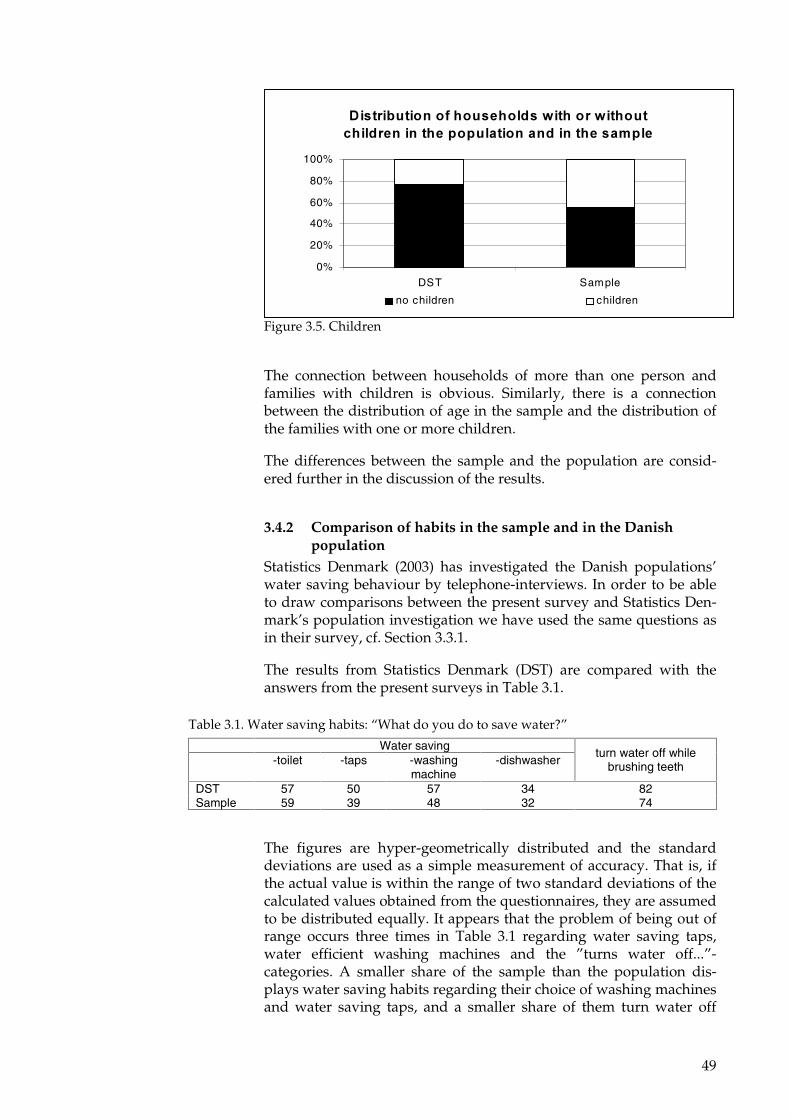
49
Figure 3.5. Children
The connection between households of more than one person andfamilies with children is obvious. Similarly, there is a connectionbetween the distribution of age in the sample and the distribution ofthe families with one or more children.
The differences between the sample and the population are consid-ered further in the discussion of the results.
3.4.2� Comparison of habits in the sample and in the Danishpopulation
Statistics Denmark (2003) has investigated the Danish populations’water saving behaviour by telephone-interviews. In order to be ableto draw comparisons between the present survey and Statistics Den-mark’s population investigation we have used the same questions asin their survey, cf. Section 3.3.1.
The results from Statistics Denmark (DST) are compared with theanswers from the present surveys in Table 3.1.
Table 3.1. Water saving habits: “What do you do to save water?”
Water saving-toilet -taps -washing
machine-dishwasher
turn water off whilebrushing teeth
DST 57 50 57 34 82Sample 59 39 48 32 74
The figures are hyper-geometrically distributed and the standarddeviations are used as a simple measurement of accuracy. That is, ifthe actual value is within the range of two standard deviations of thecalculated values obtained from the questionnaires, they are assumedto be distributed equally. It appears that the problem of being out ofrange occurs three times in Table 3.1 regarding water saving taps,water efficient washing machines and the ”turns water off...”-categories. A smaller share of the sample than the population dis-plays water saving habits regarding their choice of washing machinesand water saving taps, and a smaller share of them turn water off
���������������� ������������������������� ����� ���������������� ������
0%
20%
40%
60%
80%
100%
DST Sample
no children children

50
when they brush teeth. Regarding water efficient toilets and dish-washers, a good resemblance is exhibited.
However, no clear conclusions can be made as to how these differ-ences influence the willingness to protect or purify groundwater.
Table 3.2 compares the respondents’ reasons for water saving behav-iour compared with the reasons stated in Statistics Denmark’s survey.
Table 3.2. Reasons for water saving: “Why do you save water?”
Very highimportance
Highimportance
Someimportance
Noimportance
Do notknow
Do not savewater
The price as reason for water saving behaviourDST 19 29 20 25 1 6Sample 23 25 28 9 3 12
The environment as reason for water saving behaviourDST 31 33 19 10 1 6Sample 29 37 15 3 4 12
The share of the sample that finds that price is of very high or highimportance, when these two response categories are pooled together,is equal to that in the population - even though the sample is some-what more price-aware. Only 9% of the sample finds that price has noimportance, compared with 25% of the population. Conversely, thesample pays somewhat less attention to environmental reasons forsaving water. Only 3% of the sample find that the environment hasno importance for their water saving behaviour, while 10% of thepopulation responds in this category. These differences can be inter-preted to point to a lower willingness to pay for environmental im-provements among the sample as compared to the population, butthe differences are not large.
These results regarding water saving habits and the respondents’attitudes are interesting in themselves, but the answers are also usedin the econometric analyses of the CV and CE responses in Section 6and 7. The differences between the sample and the population are,furthermore, used in the comparison of the results in Section 8.

51
4� Application of the ChoiceExperiment method
4.1� The CE method
The CE method was, like the other Choice Modelling (CM) tech-niques, developed for market analysis (Batsell & Louviere 1992; Lou-viere 1988), but the methods have been increasingly used and furtherdeveloped for the valuation of non-marketed goods (Adamowicz,1995, Boxall et al. 1996, Hanley et al. 1998a,, Hanley et al. 1998b,Hanley et al. 2001).
In a CE study, respondents are requested to choose between pre-defined alternatives which each are connected with different imple-mentation costs, drinking water quality, other environmental im-pacts, etc. Use of the approach on Danish environmental problemscan be found in:
• Schou et al. (2003), who used CE in valuation of the impacts ofpesticides on nature,
• Aakerlund (2000), who used contingent ranking for valuation offorest characteristics;
• Boiesen et al. (under preparation), who used CE for valuation ofthe management of heather moorland;
• Olsen & Lundhede (2005), who used CE for valuation of forestcharacteristics.
Furthermore, projects are underway using CE for assessment of thesignificance of information for consumer choice with regard to food,and assessments of windmill location.
In CE, respondents are requested to select their preferred alternativeand, in contrast to the CV method, the term ”indirect method” is usedas consumer preferences are estimated on the basis of preferredsituations and not on the basis of actual expressed WTP. Respondentsare, hereby, provided with an explicit basis for assessing costs in re-lation to effects and, therefore, the method is recommended in com-plex situations where the good has several characteristics, referred toas ‘attributes’. The method is also suitable if the nature of the envi-ronmental good is relatively removed from characteristics possessedby traditional consumer goods, because the choice situation placesthe valuation in a situation more reflective of real market conditionsthan with other forms of valuation exercise - all things being equal.
The CE-method presents respondents with several choice sets, andthe choice situation is created to resemble the market situations thatrespondents are used to in everyday life. To approach the valuationas a market choice the CE-method describes public goods in terms ofthe attributes, defining the goods and attribute levels.

52
Consequently, the power of the CE method is that it is split into at-tributes and choice sets, and can avoid response difficulties, reduceproblems of multi-collinearity and measure the marginal value ofchanges.
The method can be described formally by the following utility func-tion. An individual i’s utility from a good j (Uij ) can be described as afunction of a deterministic part (V) and a stochastic element (• ) asfollows:
Uij = V(Zij , Si ) + •
where Z represents characteristics of the good, e.g. water quality, andS characteristics of the individual, e.g. gender, income etc. (See e.g.Adamowicz et al. 1994; Bateman et al. 2002)
The probability of a choice between alternative options for changes inwater quality is described as a function of the attributes, and theprobability for choice between the alternatives can be analysed byrandom utility models. Examples of attributes are drinking waterquality, surface water quality and costs, but other attributes could bementioned as well; groundwater exposure to pesticides and nitrates,human exposure as well as landscape changes. In the present studythe costs are expressed as a fixed amount reflecting an increase in theyearly payment per household for water supply services.
The probability of an alternative being chosen can be expressed interms of the logistic distribution (see Hanley et al., 2001), and de-pending on the nature of the data different logit models can be ap-plied (Train, 2003). WTP for non-monetary attributes can, hereafter,be estimated as the marginal rate of substitution between the attrib-ute and the monetary attribute.
4.2� Developing the CE part of the questionnaire
In the present section, different aspects related to the specific designof the choice experiment (CE) survey are presented.
4.2.1� The Attributes Defining the AlternativesAs mentioned in Chapter 2, the alternatives which respondents areasked to choose between in the CE each represent different policyproposals concerning future groundwater resource management op-tions. The alternatives are defined by three attributes; two qualitativeattributes related to the effects of different management options inrelation to the quality of drinking water and the aquatic environment,respectively, and one quantitative attribute specifying the cost/priceof the option. The inclusion of the monetary attribute is necessary inorder to facilitate the derivation of monetary estimates of the valuethat respondents attach to the qualitative effects of different man-agement options.
Choice of Attribute LevelsIn relation to the amount of information provided to respondents,and the more specific way in which the information is provided, em-phasis has been on securing correspondence between the CE and the

53
CV scenarios. Thus, the development of the CE scenario, includingthe choice of the more specific attribute levels, has occurred parallelwith development of the CV scenario, cf. Section 2.2. in which theindicators are presented. The attributes, including descriptions oftheir more specific levels, which define the alternatives are presentedin Table 2.1., where it appears that each of the two qualitative attrib-utes can assume three different levels.
The cost/price attribute is expressed by six levels in the CE, com-pared with 10 closed levels and one additional open bid in the CV.
Thus, the levels of the drinking water attribute have been set to fa-cilitate the assessment of the potential welfare economic gain associ-ated with choosing one of the options over the others, thereby con-tributing to the fulfilment of the above-mentioned objective.
With reference to the CV part of the study, it is noted that the “un-certain” level corresponds to the water quality characterising the basecase in both CV questions. Similarly, the “naturally clean” level cor-responds to the water quality pertaining to the proposition advancedin Question 5.1 of the questionnaire, while the “treated” level corre-sponds to the water quality pertaining to the proposition advanced inQuestion 5.2., see Annex 3. As mentioned in Chapter 3, the wordingused in the description of the different levels is as “neutral” as possi-ble to take into consideration that choices should be a matter oftaste/preferences, and value-laden words and phrases that can influ-ence preferences should be avoided.
With respect to the attribute relating to the quality of the aquatic en-vironment, the three levels have been chosen so that the associatedvalue changes, both those for the better and for the worse, can be es-timated. In relation to the correspondence between the CV and theCE surveys, the “less good” level reflects the quality characterisingthe base case in both CV questions, and the quality pertaining to theproposition advanced in Question 5.2. The “very good” level, on theother hand, reflects the quality pertaining to the proposition ad-vanced in Question 5.1, whereas the “poor” level is unique to the CEpart of the survey. Identification of the more specific wording used todescribe the different levels has been quite troublesome, as the attrib-ute incorporates complexities which are difficult to represent in briefand general terms, cf. Section 2.
As in the CV, the cost is stated in the form of an annual increase inwater bill per household. The levels assumed by the cost attributecover the same range as those covered in the CV, though with theexception that the payment card used in the CV provides respon-dents with the opportunity to state a higher WTP than the 2,400DKK/Household/year.
4.2.2� Composition of the Choice Sets
Status quo and opt-outIn consulting the literature on how to conduct CE-studies, it is oftenrecommended, sometimes even required, that a status quo alterna-tive, or an “opt-out” option, is included in the design. The reason

54
being that failure to do so may imply that respondents are forced tochoose alternatives, which they do not desire. If this is the case, theobserved choices should not be interpreted as expressions of respon-dents’ true preferences, implying that they should not (or perhapsrather cannot) be used as the basis for deriving valid estimates of wel-fare changes (Bateman et al., 2002). It should, however, be noted thatthe inclusion of a status quo alternative, or an “opt-out”-option, is notnecessarily unproblematic. Thus, while serving to eliminate biascaused by inducing respondents to make forced choices, it may si-multaneously serve to create a new bias as respondents may system-atically exhibit different preferences for the status quo alternative andnon-status quo alternatives (Scarpa et al., 2004). Moreover, it mayprove difficult to identify an appropriate way of present-ing/including the status quo/opt-out (Adamowicz and Boxall,2001:20).
Despite this, it is decided to include a status quo option in the presentstudy. The main reason being that the results of the CE are to becompared with the results of a CV study, where respondents aregiven the option of stating a zero WTP. By doing so, they indicatethat they prefer the status quo to the other alternatives, which in CEterms is equivalent to “opting-out” of choosing between the non-status quo alternatives. Thus, in order to ensure the greatest possibledegree of similarity between the CE and CV scenarios, it is consid-ered most appropriate to make sure that all respondents are providedwith the opportunity to “opt-out”, i.e. to choose the status quo. Thestatus quo alternative is designed so that it corresponds to the basecase in both CV questions, implying that it is characterised by an“uncertain” water quality level, a “not so good” quality of the aquaticenvironment and zero additional costs. Accordingly, it defines thebaseline situation that will prevail if current initiatives are main-tained while no further actions are taken.
The number of alternativesApart from the status quo alternative, which is constant across allchoice sets, each choice set contains 2 alternatives. This is in line withthe approach adopted in other environmental valuation studies,where 2-3 alternatives per choice set appears to be the standard(Adamowicz & Boxall, 2001:20). Along with a number of other factors– such as the number of attributes and their respective number oflevels, and the extent to which respondents are familiar with the goodprior to the choice exercise – the number of alternatives per choice setaffects the complexity of the CE exercise (Swait & Adamowicz, 1997).According to Bateman et al. (2002:265), it is important to ensure thatrespondents are not asked to perform tasks, which are too complex,as this may induce respondents to provide unreliable answers or re-sort to using simplified decision strategies instead of the compensa-tory decision strategies, which are assumed to be used in CE.
In the present context, it is considered appropriate to operate with achoice set size of 3 alternatives per set. Thus, less than 3 alternativesper set would provide too little information per choice observation,while more than 3 alternatives per set might be difficult for respon-dents to grasp simultaneously, especially when considering respon-dents’ unfamiliarity with the good subjected to valuation. In the pre-

55
tests, respondents’ perception of the difficulty of the choice task wasinvestigated, and in this connection none of the respondents ex-pressed any concern in terms of the size of the choice sets.
Number of Choice Sets per RespondentThere exist no exact rules regarding the number of choice sets to pre-sent to each respondent. In general, the number of choice sets thateach respondent can be expected to evaluate is inversely proportionalto the number of attributes and attribute levels, i.e. to the complexityof the task (Bateman et al., 2002:265). Compared with other studies,the number of attributes and their associated levels in the presentstudy are fairly low, suggesting that respondents may be able to han-dle a relatively high number of choice sets. Apart from choice com-plexity, expectations regarding potential learning and fatigue effectsalso play a role in relation to determining the appropriate number ofchoice sets per respondent. Thus, just as choice complexity may influ-ence the obtained parameter estimates, so may learning and fatigueeffects (Adamowicz & Boxall, 2001:17), implying that these factorsneed to be considered carefully and balanced against each other priorto deciding on a specific number of choice sets per respondent.
The complexity and unfamiliarity of the issue needs to be seen incombination with the fact that the risk of a fatigue and/or boredomeffect occurring increases with the number of choice sets. Therefore,each respondent is presented with 6 choice sets. In this context sev-eral of the pre-test respondents noted that it would be unproblematicto increase the number of choice sets per respondent; i.e. once theyhad understood the task it was straightforward to complete thechoices. This comment may be taken to suggest either of two things,which both are treated by Bateman et al. (2002). One, that some re-spondents may develop and adopt a simplifying strategy alreadyfrom the outset of the exercise, or two, that there is an importantlearning effect associated with multiple choice tasks. If either of thesephenomena turns out to be present, it may imply that the number ofchoice sets, due to its impact in relation to decision strategy andlearning effects, is no longer neutral in relation to respondents’ statedpreferences. The extent to which the chosen number of choice setswill affect the results of the present study cannot be assessed here;however, as 6 sets per respondent is within the range applied in moststudies, the choice should be fairly uncontroversial.
4.2.3� Sample Size for the CE blocksGiven the lack of more specific statistical guidelines concerning howto determinate the appropriate sample size for a CE study in a givencontext, a rule-of-thumb is that the sample size should be chosen toensure that each alternative is represented at least 30 times in the ef-fective sample. An alternative rule of thumb is that each choice setshould be answered by a minimum of 50 respondents (Bennet &Adamowicz, 2001:59). Finally, Bateman et al. (2002:268) mention thatrecent CE studies conducted in the UK on environmental issues haveincluded between 250 and 500 respondents per survey.
As the total sample will need to be divided into sub-samples reflect-ing the number of blocks used in the experimental design (Bennet &

56
Adamowicz, 2001:59), it is decided that the adopted design shouldcontain no more than three blocks. Thus, with a total effective samplesize for the CE in the vicinity of 600 respondents, this would result ineffective sub-sample sizes of around 200. Compared to the two rulesof thumb, sample sizes of this magnitude should be more than suffi-cient.
In terms of the size of an experimental design, which will satisfy therequirements of 6 choice sets of 2 alternatives per respondent (ex-cluding the constant status quo alternative, which is added to thechoice sets once the final design has been identified) and no morethan 3 different blocks of choice sets, it is found that it should consistof 36 alternatives. That is, (6 choice sets/block) * (2 alterna-tives/choice set) *(3 blocks) = 36 alternatives.
4.2.4� The Experimental DesignThe basic principles underlying the design of the CE study are de-scribed in Annex 1, while the present section describes what has beencarried out in this survey.
The extent to which the candidate set should be restricted only tocontain realistic and non-dominated alternatives depends on the spe-cific situation. There seems to be a consensus that obviously unrealis-tic or implausible alternatives should be eliminated (Bateman et al.,2002:264) as they may only serve to annoy or confuse respondents.Likewise, there seems to be a consensus that choice sets containingclearly dominated alternatives should be avoided, unless they are tobe used as a test of respondent rationality. Hence, they will providebasically no information, assuming that the respondents answer ra-tionally, while at the same time they may serve to increase the riskthat respondents will find the exercise ridiculous and, therefore, losepatience or decide not to participate.
However, when eliminating certain alternatives/attribute combina-tions, the statistical efficiency of the design drops and correlationbetween attributes may be introduced (Kuhfeld et al., 2004). Deter-mining the extent to which unrealistic/implausible and dominatedalternatives should be excluded from the design, therefore, requires atrade-off to be made. That is, concerns for the statistical efficiencyproperties of the design have to be balanced against concerns relatedto choice tasks realism and relevance, where the latter affect the effi-ciency of the design in terms of its ability to extract information fromthe choices (Adamowicz & Boxall, 2001:15). As an example, Terawakiet al. (2003:11), who investigate the effects of excluding unrealisticalternatives from a design, find that a theoretically efficient designneed not be efficient in practice. A likely reason is that respondentswho are faced with unrealistic alternatives respond on the basis ofutilities with large errors. Thus, the exclusion of unrealistic alterna-tives is found to improve the actual efficiency of designs significantly(Terawaki et al. 2003). Extending this result to the case of dominatedalternatives, it appears likely that actual efficiency of a design mayalso be improved by the exclusion of choice sets containing domi-nated alternatives, as respondents are likely to perceive them to beeither unrealistic or misrepresented.

57
As is often the case when working with issues involving ecologicalsystems (Adamowicz & Boxall, 2001:15) – or the natural environment– it can turn out to be impossible to present the valuation task in“orthogonal terms”, while maintaining an acceptable degree of taskrealism and relevance. Bennet & Adamowicz (2001:59) suggest thatproblems related to implausibility can be avoided by explaining torespondents why some alternatives may appear counterintuitive.Significant effort was devoted to an attempt to pursue this strategy,but unfortunately, it was found to be impossible. Subsequently, itwas decided to delete some, though not all, of the unrealis-tic/implausible alternatives from the full factorial design prior to thecreation of the final experimental design. The reason for only ex-cluding some was that too many, seen from a statistical and meth-odological point of view, would need to be excluded if all alternativeswere required to reflect situations likely to prevail in reality. Attempthas been made to deal with the presence of the remaining implausi-ble/unrealistic alternatives through emphasising some, and throughnot paying emphasis to others.
The results of the pre-tests provide no unambiguous answer to thequestion as to whether or not this attempt has been successful. Thus,when presented with the choice sets, experts – exemplified by a sig-nificant proportion of those participating in an expert test – are trou-bled by the apparent implausibility of several of the alternatives.This, however, has not caused significant concern as “experts” areexpected to be more critical and to scrutinise the set up more thor-oughly than others. Non-experts, on the other hand, did not expressthe same level of concern and, therefore, it is not expected that im-plausibility/counter-intuitive related problems would cause signifi-cant problems in relation to the survey.
In relation to the exclusion of dominated alternatives, the definitionof the constant status quo alternative turned out to have significantimplications in relation to how many restrictions need to be imposedon the design in order to avoid the presence of dominating alterna-tives in the choice sets. Thus, with reference to the attribute levelscharacterising the status quo (i.e. not assuming the worst levels of thequalitative attributes), it becomes evident that the status quo clearlydominates quite a few of the other alternatives in the full factorialdesign. This implies that quite a few alternatives need to be excludedfrom the candidate set (initially comprised of the full-factorial design)prior to the identification of the final experimental design if the pres-ence of alternatives dominated by the status quo in the choice sets isto be avoided.
Based on this, it was decided to exclude alternatives clearly domi-nated by the status quo alternative, while other potentially domi-nated alternatives have been kept in the design. In this connection, itmay be noted that the results from the questionnaire pre-tests sug-gested that there are no choice sets for which all respondents havemade identical choices. This suggests that there are no choice sets inthe final design containing clearly dominant alternatives, although,the presence of fairly dominant alternatives cannot be dismissed.

58
With 3 attributes with 3, 3 and 6 levels, respectively, the full factorialdesign consists of 54 alternatives. Following the strategies just men-tioned in relation to the exclusion of implausible/unrealistic anddominated alternatives, 6 are excluded on account of being implausi-ble or unrealistic whereas 11 are excluded on account of being clearlydominated by the status quo alternative. Finally, the status quo alter-native is deleted from the full factorial design, as this constant alter-native is added to each choice set subsequent to the identification ofthe final design. Following the exclusion of these 18 alternatives, thecandidate set consists of 36 alternatives, which – with reference toSection 5.3.3 – corresponds to the size of the experimental designwhich will satisfy the requirements in terms of desired number ofchoice sets and number of alternatives per choice set4.
As already mentioned, the size of the candidate set corresponds tothe maximum size of the desired design. Running the SAS %ChoiceEffmacro, the resulting final design contains the required 36 alternatives;however, as some of the alternatives appear several times it does notconsist of 36 different alternatives. Normally, there should be no du-plicate alternatives in an efficient design, therefore, at first glance theobservation of duplicates led to dismissal of the design, as it appar-ently possessed inefficient properties. On closer consideration, how-ever, it was decided to keep the design, as the repetition of alterna-tives is believed to be a consequence of the large number of alterna-tives that have been excluded from the candidate set. That is, withoutdoing so, it would probably not have been possible to attain a reason-able confounding structure and level of correlation among attributes.
On account of the large number of excluded alternatives, there hasbeen some concern regarding the effect of the exclusions in relation tothe correlations between attributes and the statistical efficiency of thedesign. In order to check that the efficiency of the design has not beenaffected to the extent that estimation of the desired effects has beenhampered, data from 29 respondents participating in the above men-tioned pre-test was used to estimate a very preliminary main effectsmodel. All except one of the main effects/attributes turned out to besignificant in the model, the signs on all parameters were as expectedand the model fit was good. Based on this, it was decided that no
4 In terms of constructing the final experimental design it was originally the plan to
adopt the cyclical design approach. Thus, given the lack of the information requiredin order to pursue a utility balanced design by using the choice design approach, acyclical design was considered appropriate as it would ensure level balance, or-thogonality and minimal overlap. Using the cyclical approach the exclusion of alter-natives would, in practice, have to be undertaken after the construction of the finaldesign, including the creation of choice sets and blocks. However, considering thesignificant number of exclusions entailed by the adopted strategy it was consideredmost appropriate to exclude alternatives from the full factorial design (i.e. the candi-date set) prior to the construction of the final design. Thus, given the significantnumber of restrictions imposed on the design, it was expected that this particularorder of events would increase the chance that the most efficient design would befound. The cyclical approach was, therefore, abandoned in favour of the choice de-sign approach assuming that all parameters are zero. Considering the lack of priorinformation on the parameters, this choice may seem odd. However, the reason forchoosing the choice design approach rather than the linear design approach is that itonly is the SAS macro %ChoicEff macro that allows for alternatives to be excludedfrom the full factorial prior to the construction of the final design.

59
changes were necessary, implying that the design used in the pre-tests is identical to the design used in the full-scale survey.
Follow-Up QuestionsAs mentioned in Section 3, it is recommended to ask a set of follow-up questions upon completion of the valuation question(s). In thepresent study, 6 questions regarding respondents’ experience of thechoice exercise and how they made their choices are asked immedi-ately after the payment exercise.
In the first of the questions (Question 6.1), respondents are askedwhether or not they found it difficult to make the choices. One of themotives for asking the question is that respondents’ answers mayindicate something about the reliability of the choices. If choices areconsidered difficult it may indicate that choice complexity was high –and perhaps too high – for the given respondent.
The consequence hereof may either be that the respondent has beeninduced to provide less reliable answers or adopt a simplified deci-sion strategy, or that completion of the task has been time-consumingfor the respondent. Seen from another perspective, it may be moreproblematic if respondents have found the choices easy. Hence, in astudy by Watson et al. (2004) it is found that people who find a CEtask easy are more likely to pursue potentially non-compensatorydecision-making strategies. Based on these considerations, it maytherefore be relevant to investigate if there are scale and/or prefer-ence differences between those respondents providing a positive, andthose providing a negative, response to the question.
Question 6.2, which focuses on disclosing why respondents havefound the choice exercise difficult, is only relevant for those who an-swered yes to the previous question. Respondents’ answers to thisquestion are not intended to play a role in relation to the modelling ofdata. Instead, they may be used as input to future surveys, as theymay serve to shed light on how respondents perceive different ele-ments of a CE. In relation to the different answer-options provided inthe question, it may be noted that one of them may actually serve toestablish the validity of respondents’ answers/choices. Hence, an-swering, “it was difficult to choose as several factors were important”stresses the fact that a compensatory decision-making strategy hasbeen applied.
The follow-up questions on the CE exercise also include a certaintyscale question (cf. Chapter 3), where respondents are asked to statehow certain they are of the choices that they have made in the CE.
Apparently, a general framework for how certainty calibrationshould be applied in a CE context does not exist, however, the inten-tion in the present study is to investigate the effect of excluding ob-servations pertaining to respondents with a self-reported level ofcertainty below a certain threshold. In this connection it could – andprobably can convincingly – be argued that a certainty scale shouldideally have followed each choice.
Thus, as advanced by the participants in the focus group interview,some choices are more straightforward than others, implying that

60
different degrees of certainty pertain to different choice sets. In orderto take advantage of the full potential offered by the certainty cali-bration approach, such certainty heterogeneity across choice setsshould probably be incorporated in the model. However, consideringthe length of the questionnaire, it was not considered wise to includemore than one common certainty scale question. In terms of deter-mining the threshold certainty level specifying which respondentsshould be excluded, it may be noted that respondents may have usedthe scale quite differently. This cardinal property of individuals’ self-reported level of certainty implies that excluding observations associ-ated with a level of certainty below the threshold does not corre-spond to excluding observations associated with an actual level ofuncertainty below some specific level. Prior to interpreting the re-sults, therefore, it should be acknowledged that if respondents with areported level of certainty below a certain level are excluded, thensome of the excluded observations are likely to be associated withless uncertainty than some of the observations remaining in the re-duced data set.
In Question 6.4, respondents are asked to specify which of the threeattributes they put greatest weight on when choosing between thedifferent alternatives. In case there were none of the attributes that, ingeneral, were considered more important than the others, respon-dents were also provided with the opportunity to answer that it var-ied across choices. Respondents’ answer to this question cannot serveas a reliability or validity test, as such, but it may be used to identifywhich attributes are considered most important and are most likely tobe the focus of non-compensatory decision strategies. Also, if respon-dents’ answers to this question interact with the attributes in theanalysis, the significance of the interaction variables may be used as atest of internal consistency. That is, it may indicate the degree of cor-respondence between what people state is most important to themand what they attach most weight to in their observed choices.
An assumption underlying the use of the CE approach as a valuationtool is that individuals apply compensatory decision-making strate-gies. That is, individuals are assumed to consider all attributes, andmake trade-offs between all attributes within the choice sets com-prised in the design (Watson et al., 2004:3). In this context the basicpurpose of Question 6.5 is to, if not assess, then at least shed somelight on whether or not respondents have applied choice strategiesthat potentially conflict with the assumption of compensatory deci-sion-making.
With reference to the CE questionnaire in Annex 2, respondents areasked to specify if they only considered one of the attributes whenmaking their choices, or if they took all attributes into consideration.
If respondents answer that they took all attributes into consideration,nothing suggests that the compensatory requirement be violated. If,on the other hand, respondents answer that they based their choicessolely on considerations of one attribute, it is indicated that theymight have pursued non-compensatory decision-making strategies.That is, it is suggested that the respondents concerned have exhibited

61
lexicographic/dominant preferences, which are in conflict with theaxioms underlying welfare economic theory.
It should, however, be emphasised that answering that choices havebeen based solely on consideration of one attribute is by no meansproof of non-compensatory decision-making; it only indicates thepresence of potentially non-compensatory decision-making. An im-portant element in designing CE surveys is to assign attribute levelsso that it is ensured that respondents actually make trade-offs(Carlsson & Martinsson, 2003:290). Hence, seen from this perspective,another explanation for only having focused on one attribute may bethat the selected attribute ranges have simply been set too narrow toinduce respondents to make trade-offs (Watson et al., 2004:12). If thisturns out to be the case, the problem is not related to the behaviourexhibited by respondents, but to the design of the instrument used toelicit respondents’ preferences. While care should therefore be takennot to declare respondents’ choices invalid based just on respondents’answer to Question 6.5, it nevertheless may be interesting/relevant totest for differences between the two segments of the sample provid-ing different answers to Question 6.5.

62
5� Application of the ContingentValuation Method
The CV method is the most commonly used non-market valuationtechnique for environmental goods, internationally as well as inDenmark (Mitchell & Carsson 1989; Carson et al. 2001; Dubgaard1996, 1998; Bjørner et al. 2000). Throughout the years it has been sub-ject to many methodological discussions, which have elaborated thetheoretical foundation underlying CV.
The aim of a CV-study is to elicit individuals’ preferences for achange in a particular environmental good (Bateman et al. 2002). TheCV method’s foundation in utility theory makes it possible to trans-late these preferences into monetary terms. Thus, it allows measuresof consumer welfare to be estimated for changes in the supply of theenvironmental good in question (CIE 2001).
5.1� Elicitation of WTP in the CV survey
5.1.1� Questions formatsBasically, CV involves asking a sample of individuals for the highestamount of money they are willing to pay to obtain an improvementin their environment.
There are three primary question formats in CV: open-ended ques-tions, dichotomous choice and payment cards.
The first formats used to elicit payment bids were open-ended ques-tions. With this type of questions the respondent is asked to statehis/her WTP for a specified environmental improvement. However,respondents are not accustomed to such market behaviour, and theformat has gradually become used more rarely due to problemsarising from respondents stating a higher WTP than their real WTP –i.e. warm glow and moral satisfaction. That respondents act in thisway can be due to problems with assessing how much one wouldactually pay for a good that is not otherwise marketed in monetaryterms, and to an individual’s desire to act in a ”morally correct”manner. Under these circumstances, an estimate of the real WTP isnot achieved.
Methods incorporating closed responses have now been more widelyused, i.e. the payment cards and dichotomous choice methods. Inusing the payment card method, respondents are presented with arange of WTP values, or bids. The respondents can either be asked topay directly or be asked whether they would vote for on the envi-ronmental change a referendum while at the same time being in-formed of the costs of this policy to an individual or a household.Their maximum WTP to cover the costs can be chosen from the pay-ment card. The values on the payment card can progress in differentways, either by uniform increments or more or less exponentially,
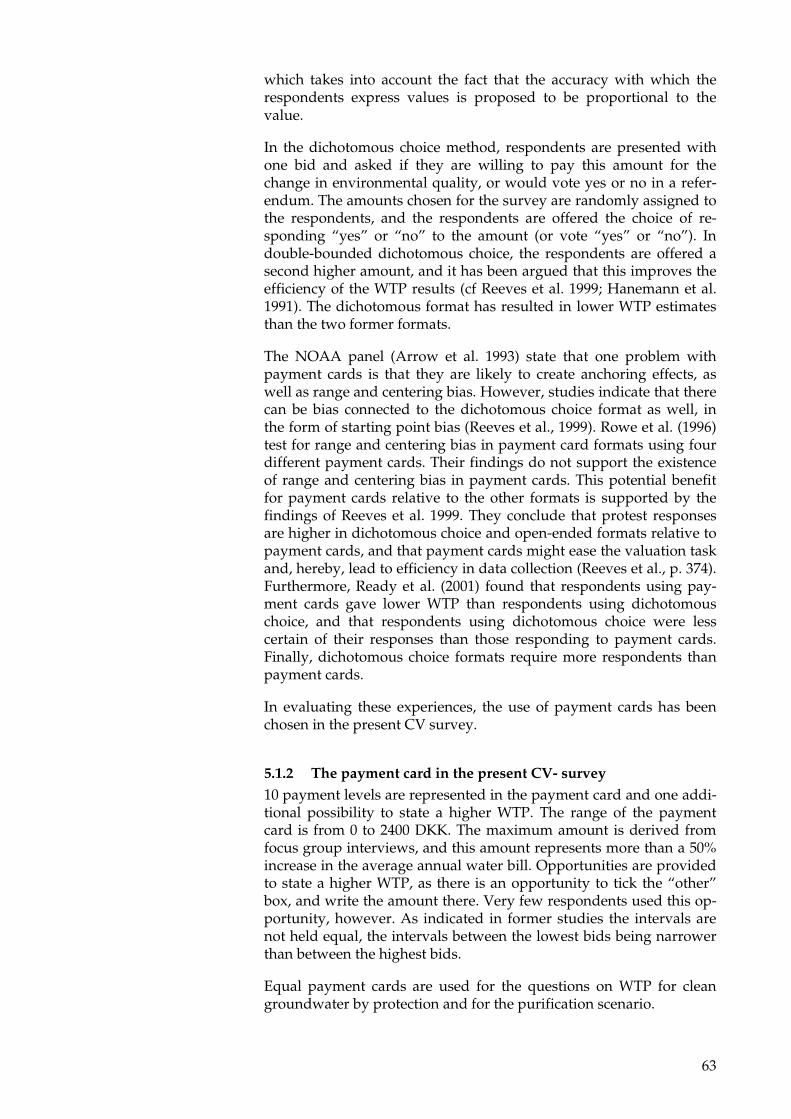
63
which takes into account the fact that the accuracy with which therespondents express values is proposed to be proportional to thevalue.
In the dichotomous choice method, respondents are presented withone bid and asked if they are willing to pay this amount for thechange in environmental quality, or would vote yes or no in a refer-endum. The amounts chosen for the survey are randomly assigned tothe respondents, and the respondents are offered the choice of re-sponding “yes” or “no” to the amount (or vote “yes” or “no”). Indouble-bounded dichotomous choice, the respondents are offered asecond higher amount, and it has been argued that this improves theefficiency of the WTP results (cf Reeves et al. 1999; Hanemann et al.1991). The dichotomous format has resulted in lower WTP estimatesthan the two former formats.
The NOAA panel (Arrow et al. 1993) state that one problem withpayment cards is that they are likely to create anchoring effects, aswell as range and centering bias. However, studies indicate that therecan be bias connected to the dichotomous choice format as well, inthe form of starting point bias (Reeves et al., 1999). Rowe et al. (1996)test for range and centering bias in payment card formats using fourdifferent payment cards. Their findings do not support the existenceof range and centering bias in payment cards. This potential benefitfor payment cards relative to the other formats is supported by thefindings of Reeves et al. 1999. They conclude that protest responsesare higher in dichotomous choice and open-ended formats relative topayment cards, and that payment cards might ease the valuation taskand, hereby, lead to efficiency in data collection (Reeves et al., p. 374).Furthermore, Ready et al. (2001) found that respondents using pay-ment cards gave lower WTP than respondents using dichotomouschoice, and that respondents using dichotomous choice were lesscertain of their responses than those responding to payment cards.Finally, dichotomous choice formats require more respondents thanpayment cards.
In evaluating these experiences, the use of payment cards has beenchosen in the present CV survey.
5.1.2� The payment card in the present CV- survey10 payment levels are represented in the payment card and one addi-tional possibility to state a higher WTP. The range of the paymentcard is from 0 to 2400 DKK. The maximum amount is derived fromfocus group interviews, and this amount represents more than a 50%increase in the average annual water bill. Opportunities are providedto state a higher WTP, as there is an opportunity to tick the “other”box, and write the amount there. Very few respondents used this op-portunity, however. As indicated in former studies the intervals arenot held equal, the intervals between the lowest bids being narrowerthan between the highest bids.
Equal payment cards are used for the questions on WTP for cleangroundwater by protection and for the purification scenario.

64
5.1.3� The scenariosThe scenario text is briefly described in Section 2.2 and is also appar-ent from Annex 2.
The treatment of the multidimensional effects of groundwater pro-tection on surface water quality and drinking water quality has beenincluded in the information provided in the valuation question. Inthis question the scenario is worded as closely to the wording of thescenario in the CE survey as possible. However, in comparison of thetwo questionnaires (cf. Annex 2 and 3), it is apparent that this is noteasy because the CE includes trade-offs between the attributes (indi-cators) while the CV scenario text expresses how the effects on sur-face water and drinking water are achieved concurrently by en-hanced protection. Furthermore, valuation of the protection ofgroundwater versus purification is carried out subsequently by twoseparate questions in the CV survey, while it is carried out by trade-offs between the two attributes in the CE. In other words, methodo-logical differences provide different ways to express the valuationquestions. It has, however, been attempted to describe the effects inthe protection scenario as nested goods, i.e. that the protection sce-nario resulting in good drinking water quality from “natural”groundwater comprises both good A and B, A being good drinkingwater quality and B being good surface water quality.
The two subsequent CV questions on protection and purification areasked by first asking the question concerning WTP for protectedgroundwater where clean drinking water is guaranteed now and inthe future, and thereafter by posing the valuation question on re-spondents’ WTP for purified water. The sequence of these two sce-narios is not tested by split samples because it was judged that therewere not enough respondents to carry out split sample tests and thatsuch tests are beyond the scope of this project. However, a test forordering effects could evidently be of interest here, as it is assumedthat the WTP for both the protection scenario and for clean drinkingwater from purified water would be higher than when the opposingsequence is chosen.
5.1.4� Debriefing questions in CV: The opportunity to defineprotests and confidence
Debriefing questions are especially important and commonly used inCV surveys to control for biased and illegitimate answers. Illegitimateresponses are bids that do not reflect the respondents’ actual or“true” WTP, which occur when the respondent is performing strate-gic bidding or free-riding, as mentioned above. Other kinds of ille-gitimate responses arise when the respondent exercises protest be-haviour (Garrod & Willis 1999). This is when the respondent states azero bid despite having a positive WTP for the good. Such protestanswers will bias the grand mean downwards and should, therefore,be removed from the sample. Asking for the respondent’s argumentsfor zero bids is the most common method to identify protest answers.
A frequent claim is that familiarity with the good is a prerequisite toensure that the respondent will have well-defined preferences for thegood in an economic sense; otherwise the respondent will not be able

65
to provide meaningful responses to the valuation question. A recentdevelopment in trying to deal with this unfamiliarity is to take ex-plicit account of the respondents’ uncertainty in making the response(CIE 200I). This is done by asking respondents how certain (measuredon a confidence rating scale) they were in making the bid. The infor-mation can be used to adjust estimated WTP from the sample andreduce a potential upward bias (Li & Mattsson 1995).
The debriefing questions are commented upon in Section 3.3, andthey are apparent from Annex 2 and 3.
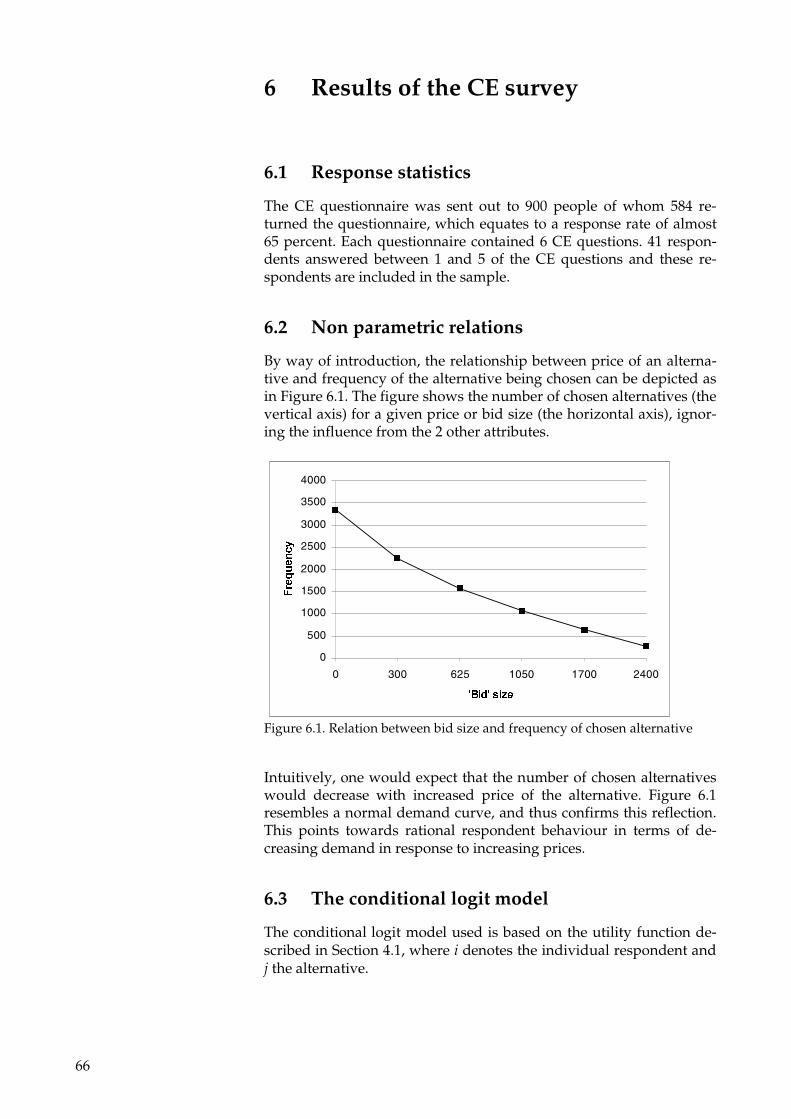
66
6� Results of the CE survey
6.1� Response statistics
The CE questionnaire was sent out to 900 people of whom 584 re-turned the questionnaire, which equates to a response rate of almost65 percent. Each questionnaire contained 6 CE questions. 41 respon-dents answered between 1 and 5 of the CE questions and these re-spondents are included in the sample.
6.2� Non parametric relations
By way of introduction, the relationship between price of an alterna-tive and frequency of the alternative being chosen can be depicted asin Figure 6.1. The figure shows the number of chosen alternatives (thevertical axis) for a given price or bid size (the horizontal axis), ignor-ing the influence from the 2 other attributes.
Figure 6.1. Relation between bid size and frequency of chosen alternative
Intuitively, one would expect that the number of chosen alternativeswould decrease with increased price of the alternative. Figure 6.1resembles a normal demand curve, and thus confirms this reflection.This points towards rational respondent behaviour in terms of de-creasing demand in response to increasing prices.
6.3� The conditional logit model
The conditional logit model used is based on the utility function de-scribed in Section 4.1, where i denotes the individual respondent andj the alternative.
0
500
1000
1500
2000
2500
3000
3500
4000
0 300 625 1050 1700 2400
����������
���������

67
If the error terms ε are independently and identically distributed(IID) and follow the Gumbel distribution, the probability that alter-native k is selected out of K alternatives is calculated as:
)exp(
)exp()Pr(
1∑
=
=�
�
��
��
�
�����������������
(6.1)
where V is the vector representing both attributes of the alternative,i.e. drinking water quality, living conditions for animal and plantsand the price and characteristics of the respondent.
6.4� WTP: Main effects and cross effects
At first, a conditional logit model based only on the main effects hasbeen carried out. The dependent variable is the probability that therespondent chooses an alternative. The results are presented in Table7.1. The estimates in this model and all the subsequent models arebased on a change from the status quo situation, which equates to anuncertain quality of drinking water and less good conditions for ani-mal and plant-life in watercourses and lakes.
Table 6.1. Main effect model
Parameter Std. error WTP(DKK)
Price -0.00059 *** 0.0000Alternative specific constant -0.7285 *** 0.1018 -Naturally clean groundwater 1.1205 *** 0.0882 1,899Purified groundwater 0.5381 *** 0.0852 912Very good conditions 0.7105 *** 0.0661 1,204Bad conditions -1.0379 *** 0.0737 -1,759N 3,074Log L -2,723.97χ2 1,306.33Adjusted pseudo R2 0.193Significance levels at 1%, 5% and 10% are denoted by three, two and oneasterisk(s), respectively.
All the parameters are statistically significant at a 1 percent level andoperate as expected. The cost parameter is negative whereas bothnaturally clean and purified groundwater suggests positive utility. Achange to very good conditions for animal and plants contributespositively to utility whereas a change to poor conditions contributesnegatively.
The model’s adjusted pseudo R2 is 0.193. This measure is statisticallyanalogous to the R2 used in OLS regression models. The adjustedpseudo R2 should be above 0.1 to accept the model whereas a valuebetween 0.2 and 0.4, according to Louviere et al. (2000), is consideredan extremely good fit. Another way to evaluate the model is bylooking at its ability to predict the right outcome for the used sample.The prediction result is shown in Table 6.2.

68
Table 6.2 Prediction table
Predicted
Observed Not chosen (0) Chosen (1) Total
Not chosen (0) 5,421 727 6,148
Chosen (1) 1,613 1,461 3,074
Total 7,034 2,188 9,222
The prediction rate achieved of 74,6 percent (calculated as(5,421+1,461)/9,222) should be compared to a naive rule, wherechoice 0 (not chosen) for all alternatives would predict 68 percent ofthe choices correctly. If the predictions were carried out randomly,the prediction rate would only be 33 percent. On this basis, the rate of74.6 percent obtained is satisfactory.
6.4.1� Alternative Specific ConstantThe model also includes an alternative specific constant, representingthe status quo alternative, which in this model appears to be associ-ated with disutility. The parameter should be interpreted as the disu-tility connected to the status quo alternative, i.e. the present situation,which is not described by the attributes drinking water quality andplant and animal life. It is hard to tell why the status quo alternativeis connected to disutility, but one explanation might be a precedingpublic discussion about the quality of the water distribution systemand related health issues. The result of estimation of the parameterswithout an alternative specific constant is shown below in Table 6.3.
Table 6.3. Comparison of model with/without alternative specific constant
Includingalternative specific constant
Excludingalternative specific constant
Parameter stderror
WTP(DKK)
Parameter std.Error
WTP(DKK)
Price -0.00059 *** 0.0000 -0.00055 *** 0.0000Alternative specific constant -0.7285 *** 0.1018 - n/a *** n/a -Naturally clean groundwater 1.1205 *** 0.0882 1,899 1.5705 *** 0.0646 2,855Purified groundwater 0.5381 *** 0.0852 912 0.9775 *** 0.0607 1,777Very good conditions 0.7105 *** 0.0661 1,204 1.0001 *** 0.0534 1,818Bad conditions -1.0379 *** 0.0737 -1,759 -0.8958 *** 0.0714 -1,627N 3,074 3,074Log L -2,723.97 -2,749.55χ2 1,306.33 1,255.16Adjusted pseudo R2 0.193 0.186
Significance levels at 1%, 5% and 10% are denoted by three, two and one asterisk(s), respectively
Omission of the alternative specific constant causes an increase in theWTP for most of the parameters, except for the bad conditions pa-rameter which seems to be not much affected.
6.4.2� Consumption effect on WTPThe payment vehicle in this questionnaire is an annual lump sumpaid for the household’s consumption of water. Hence, it could beexpected that high consumption of water would imply high WTP.The consumption of water is stated in two different ways; by a yearly
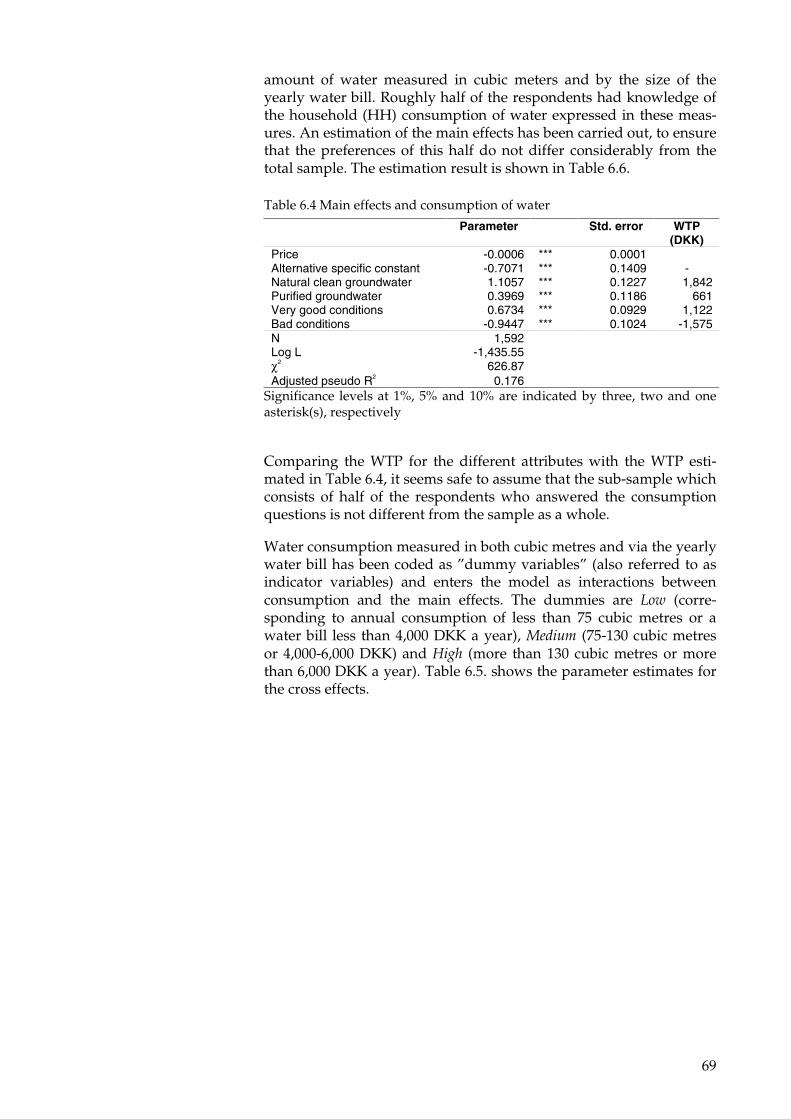
69
amount of water measured in cubic meters and by the size of theyearly water bill. Roughly half of the respondents had knowledge ofthe household (HH) consumption of water expressed in these meas-ures. An estimation of the main effects has been carried out, to ensurethat the preferences of this half do not differ considerably from thetotal sample. The estimation result is shown in Table 6.6.
Table 6.4 Main effects and consumption of water
Parameter Std. error WTP(DKK)
Price -0.0006 *** 0.0001Alternative specific constant -0.7071 *** 0.1409 -Natural clean groundwater 1.1057 *** 0.1227 1,842Purified groundwater 0.3969 *** 0.1186 661Very good conditions 0.6734 *** 0.0929 1,122Bad conditions -0.9447 *** 0.1024 -1,575N 1,592Log L -1,435.55χ2 626.87Adjusted pseudo R2 0.176
Significance levels at 1%, 5% and 10% are indicated by three, two and oneasterisk(s), respectively
Comparing the WTP for the different attributes with the WTP esti-mated in Table 6.4, it seems safe to assume that the sub-sample whichconsists of half of the respondents who answered the consumptionquestions is not different from the sample as a whole.
Water consumption measured in both cubic metres and via the yearlywater bill has been coded as ”dummy variables” (also referred to asindicator variables) and enters the model as interactions betweenconsumption and the main effects. The dummies are Low (corre-sponding to annual consumption of less than 75 cubic metres or awater bill less than 4,000 DKK a year), Medium (75-130 cubic metresor 4,000-6,000 DKK) and High (more than 130 cubic metres or morethan 6,000 DKK a year). Table 6.5. shows the parameter estimates forthe cross effects.

70
Table 6.5. Consumption divided in groups
Consumption in cubic metres Size of water bill
Consumptiongroup
Parameter WTP(DKK)
Parameter WTP(DKK)
Price -0.0006 *** -0.0006 ***Alternative specific constant -0.7036 *** - -0.6514 *** -
Naturally clean groundwater Low 0.9926 *** 1,586 1.0641 *** 1,860Medium 1.1331 *** 1,811 1.1786 *** 2,060
High 1.1752 *** 1,878 1.4129 *** 2,470Purified groundwater Low 0.1817 *** 290 0.4899 *** 856
Medium 0.4707 *** 752 0.5088 889High 0.4411 705 -0.6371 -1,114
Very good conditions Low 0.6676 *** 1,067 0.7073 *** 1,236Medium 0.6574 *** 1,051 0.7747 *** 1,354
High 0.7320 *** 1,170 0.3994 698Bad conditions Low -0.7799 *** -1,247 -1.0403 *** -1,818
Medium -0.9081 *** -1,451 -1.0149 *** -1,774High -1.1870 *** -651 -1.9145 *** -3,346
N 1,592 1,898Log L -1,432.9 -1,707.66χ2 632.17 755.01Adjusted pseudo R2 0.181 0.181
Significance levels at 1%, 5% and 10% are denoted by three, two and one asterisk(s), respectively
The first column in Table 6.5 is the attribute whereas the second col-umn shows the 3 consumption groups.
Most of the parameters are statistically significant and it would seemthat a link exists between the increase of consumption with an in-crease in parameters and WTP.
6.4.3� Self-reported certaintyThe WTP has been analysed in connection with self-reported(un)certainty. Figure 6.2 shows the distribution of certainty.
Figure 6.2. Self-reported uncertainty
The question of uncertainty was presented as a choice of 7 levels ar-ranged on a line, and the depicted distribution could be a symptom
0
5
10
15
20
25
30
����������
��������
� ��
��� �����������

71
of respondents’ anchoring to the middle answer in the range. Divid-ing the sample into 7 sub-samples according to the certainty levelmakes it possible to estimate parameters for each certainty level. Ag-gregated WTP is illustrated in Figure 6.3 and implies that WTP in-creases with increasing level of certainty. Note that the WTP for theattribute bad conditions are shown as absolute numbers as the WTPare negative.
Figure 6.3. WTP and certainty on choices
As described in Chapter 4, the certainty adjustment can be used toexclude observations pertaining to respondents with a self-reportedlevel of certainty below a certain threshold.
Table 6.6. Certainty adjusted estimates
Parameter Std. error WTP (DKK)Price -0.0005 *** 0.0000Alternative specific constant -0.7748 *** 0.1192 -Naturally clean groundwater 1.1442 *** 0.1027 2,120Purified groundwater 0.5521 *** 0.0989 1,023Very good conditions 0.7030 *** 0.0766 1,303Bad conditions -1.0627 *** 0.0853 -1,969N 2,256Log L -1,975.42χ2 1,006,09Adjusted pseudo R2 0.200
Significance levels at 1%, 5% and 10% are denoted by three, two and one asterisk(s),respectively
Excluding the approximately 25% of the sample that had stated acertainty level below 3 results in the parameter estimates is shown inTable 6.6. In line with the conclusions from Figure 6.3, it appears thathigher certainty is connected to higher WTP.
Experienced bad water qualityAn a priori hypothesis was that respondents who had previouslyexperienced problems with the quality of drinking water would havea different WTP for purified and/or naturally clean water. About 18percent of the respondents stated that they experienced these kinds ofproblems, but parameters for the interactions did not appear as sta-tistically significant.
0
500
1000
1500
2000
2500
3000
3500
4000
4500
5000
0 2 4 6 8
Natural
Cleaned
Verygood
Bad

72
As mentioned earlier, it is a prerequisite of the survey that respon-dents consider the trade-offs between the attributes and the price ofthe good. The questionnaire collected information of whether therespondent exclusively put weight on a single attribute, which inSection 4.2.4 is referred to as non-compensatory decision-making.With this information, it is possible to estimate the effect of excludingthe respondents who apparently have not been willing to trade. Table6.7 shows the WTP of those who have stated that they took all factorsinto consideration (traders) compared to those who put weight ononly a single attribute (non-traders).
Table 6.7 Comparison of WTP for traders and non-traders
WTP (DKK)Parameter Traders Non traders
Naturally clean groundwater 1,776 2,399Purified groundwater 920 740Very good conditions 1,158 1,417Bad conditions -1,951 -1,025
Table 6.7 shows that the WTP of those who have not been willing totrade increases for naturally clean water, but decreases for purifiedwater. This suggests that the WTP for naturally clean water mightrepresent an overestimate in relation to the theoretical assumptions oftrading among the attributes. Equally, it suggests an underestimate ofthe WTP for purified water.
6.5� WTP including socio-economic variables
In this section the effects of interactions with attitudinal and socio-economic characteristics of the respondents are analysed. Becausethese characteristics do not vary across the alternatives, such ananalysis has to be carried out by dividing and comparing sub-samples or by including dummy variables. The dummy variables areindicators for interactions with the main effects. At first a comparisonof sub-samples will be carried out.
6.5.1� Sub-sample analysis- genderBy dividing the sample with respect to gender, it would appear thereis generally a higher WTP in the group of women compared with thegroup of men for both attributes. The result of the estimation can bedepicted as follows:

73
Table 6.8. Comparison of females and males
Parameter Std. error WTP(DKK)
Price -0.0006 *** 0.0000Alternative specific constant -0.7292 *** 0.1019 -Naturally clean groundwater Female 1.1338 *** 0.1057 1,905
Male 1.1124 *** 0.1042 1,870Purified groundwater Female 0.6169 *** 0.1039 1,037
Male 0.4623 *** 0.1013 777Very good conditions Female 0.7556 *** 0.0835 1,270
Male 0.6748 *** 0.0822 1,134Bad conditions Female -1.2393 *** 0.1070 -2,083
Male -0.8625 *** 0.0984 -1,450N 3,074Log L -2,717.06χ2 1,320.14Adjusted pseudo R2 0.190
Significance levels at 1%, 5% and 10% are denoted by three, two and one asterisk(s), respectively
The reason for this difference is uncertain, but higher femaleWTP has been observed in several valuation studies.
6.5.2� Sub-sample analysis - areaIn accordance with Hasler et al. (2002), the sample has been dividedwith respect to region of residence in order to estimate WTP for ruraland urban areas.
Table 6.9 WTP for urban and rural areas
Area Parameter Std. error WTP (DKK)
Price -0.00059 *** 0.00003
Alternative specific constant -0.72757 *** 0.10191 -
Naturally clean groundwater Urban 1.17037 *** 0.09230 1,976
Rural 0.89333 *** 0.14942 1,508
Purified groundwater Urban 0.59154 *** 0.08927 999
Rural 0.28570 * 0.15050 482
Very good conditions Urban 0.71361 *** 0.06982 1,205
Rural 0.71098 *** 0.12701 1,200
Bad conditions Urban -1.09399 *** 0.08079 -1,847
Rural -0.76865 *** 0.16845 -1,298
N 3,074
Log L -2,720.57
χ2 1,313.13
Adjusted pseudo R2 0.191
Significance levels at 1%, 5% and 10% are denoted by three, two and one asterisk(s),respectively
Table 6.9 shows that respondents in urban areas have higher WTP fornaturally clean water as well as purified water compared with re-spondents living in rural areas.

74
In same manner as above it has been analysed whether householdswith children under the age of 18 have different WTP compared withthe mean population. This resulted in no significant interactions forthis subgroup.
6.5.3� Dummy coded variablesDummy variables are, as mentioned, indicators for interactions be-tween main effects and characteristics of the respondent. The charac-teristics include socio-economic variables and attitudinal variablesand, as such, represent a large number of dummy variables to includein the interaction model. Hosmer and Lemeshow (2000), who rec-ommend only taking interactions with a priori relevance into consid-eration, describe the approach used in this analysis.
Furthermore, a stepwise maximum likelihood estimation is carriedout in order to estimate interaction effects. The method used is a so-called “forward selection” which starts out by estimating an emptymodel, finds the most significant variable and adds it to the modelbefore starting the loop again by re-estimating the model includingthe variable.
Applying this method with a significance threshold level at 0.15 re-sults in the model shown in Table 6.10.
Table 6.10 Main effects and interactions
Parameter Std. error WTP(DKK)
Price -0.0006 *** 0.0000Alternative specific constant -0.7407 *** 0.1034 -Naturally clean groundwater 0.8062 *** 0.1347 1,319The authorities should use more resources to protect 0.6198 *** 0.1013 1,014Saves water due to concern for environment -0.2302 ** 0.1008 -377Tap water may be purified in substitute for natural -0.2177 ** 0.1100 -356High income group 0.3544 *** 0.1143 580High education group 0.2295 * 0.1377 376Purified groundwater 0.6011 *** 0.1103 984Knowledge of annual water consumption -0.3564 *** 0.0949 -583Drinking water in Denmark is not clean -0.5825 *** 0.1979 -953Group of blue collar worker 0.3106 ** 0.1217 508Group of high income 0.2987 ** 0.1163 489Very good conditions 0.4444 *** 0.1130 727The authorities should use more resources to protect 0.3143 *** 0.1065 514Pollution of aquatic environment is exaggerated -0.4087 *** 0.1360 -669Does fish very often 0.9886 ** 0.4239 1,618Saves water due to future generations 0.1721 * 0.0988 282High education group 0.2149 0.1386 352Bad conditions -0.6614 *** 0.1232 -1,082The authorities should use more resources to protect -0.3955 *** 0.1418 -647Group of white collar workers -0.4659 *** 0.1606 -763Group of supervisors -0.3641 ** 0.1787 -596N 3,074Log L -2,657.7χ2 1,448,86Adjusted pseudo R2 0.208
Significance levels at 1%, 5% and 10% are denoted by three, two and one asterisk(s), respectively
The main effects are marked in bold and the respective interactioneffects are listed below and represent an addition/deduction to themain effect, WTP. Respondents who believe the authorities should

75
use additional resources to protect the aquatic environment also tendto have a higher WTP for naturally clean water and for conditions forplant and animal life compared with the average respondent. On thecontrary, respondents who think that the problems of pollution of theaquatic environment are exaggerated exhibit a lower WTP for verygood conditions for plant and animal life. Not surprisingly, respon-dents who regard purified water as just as good as non-purifiedgroundwater have a lower WTP for naturally clean (non-purified)groundwater compared with the average respondent.
Respondents who disagree with drinking water in Denmark as beingclean have a lower WTP for purified water compared to the sample.This is also the case for respondents who have knowledge of theirhousehold’s annual water consumption.
6.5.4� Test of dominant attributesThe CE model is based on the idea that respondents make a trade-offbetween the price of the good and the different attributes. However,as mentioned in Chapter 4, one can not always be sure that the re-spondent has been considering the trade-offs as this can be due to avariety of circumstances. A proportion of the respondents might tryto influence the results by answering strategically instead of answer-ing the questionnaire according to their preferences.
By comparing the individual parameter estimates from the full modelwith those of a model with only 1 variable, it is possible to determinewhether any of the attributes have dominated the choice of the re-spondents. The H0-hypothesis is that parameter estimates from themain effect model (with 6 parameter estimates) equal those of the lessrestricted model (with only one parameter estimate), implying thatthe variable in this case is dominating the other variables in themodel. By mean of a pseudo T-test, the H0-hypotesis has been re-jected for all the attributes meaning that none of the attributes hasbeen dominating other attributes.
45 of the 584 respondents have been identified as choosing alternativenumber 1, i.e. the status quo situation, in all 6 choice sets. This couldsuggest use of a rule-of-thumb rather than a reflection of the trade-offs between the alternatives. This is supported by the fact that morealternatives offer a better quality of water or environment than thestatus quo alternative, at no expense for the respondent. These 45respondents were removed prior to the estimations carried out in thischapter. However, the effect of not removing respondents for whomthe status quo alternative has been dominant is shown in Table 6.11.

76
Table 6.11. Dominant choice of status quo not removed from sample
Parameter Std.error
WTP(DKK)
Price -0.00056 *** 0.0000Alternative specific constant -0.3504 *** 0.0958 -Naturally clean groundwater 1.0288 *** 0.0834 1,837Purified groundwater 0.4791 *** 0.0815 856Very good conditions 0.6380 *** 0.0634 1,139Bad conditions -1.0298 *** 0.0724 -1,839N 3,350Log L -3,186.46χ2 987.78Adjusted pseudo R2 0.133
Significance levels at 1%, 5% and 10% are denoted by three, two and oneasterisk(s), respectively
A comparison of the WTP estimates in Table 6.12 shows that only thealternative specific constant is highly influenced by the omission ofthese respondents. At the same time, the adjusted pseudo R2 changesfrom 0.19 to 0.13, indicating a poorer model-fit. On this basis, the re-spondents were permanently omitted from the estimations. Likewise,1 respondent, who chose the most expensive alternative in eachchoice set, has been removed.
Table 6.12. Comparison of WTP with and without dominant choices
Parameter WTP (DKK)3,350 obs. 3,074 obs. 3,350 obs. 3,074
obsPrice -0.00056 -0.00059Alternative specific constant -0.35 -0.73 - -Naturally clean groundwater 1.03 1.12 1,837 1,899Purified groundwater 0.48 0.54 856 912Very good conditions 0.64 0.71 1,139 1,204Bad conditions -1.03 -1.04 -1,839 -1,759
6.6� Summary and discussion of the CE results
Estimations of WTP have been conducted with a model based on3,074 observations. All the four main effects are estimated with sig-nificant parameters, and show strong preferences for naturally cleanwater followed by very good conditions for plant and animal life, andsubsequently preferences for purified water.
Furthermore, the analysis indicates that there seems to be a disutilityconnected with the present situation expressed by a negative WTP forthe alternative specific constant describing the status quo situation.
The WTP seems to be correlated with a number of characteristics ofthe respondents. These include correlation with water consumption,gender and urban residence. There also seems to be a correlationbetween the respondents’ self-reported certainty and the respon-dents’ WTP, i.e. an increased WTP with increased certainty.
A number of socio-economic characteristics as well as a number ofattitudes have, furthermore, been used to examine the WTP to revealinfluencing factors.
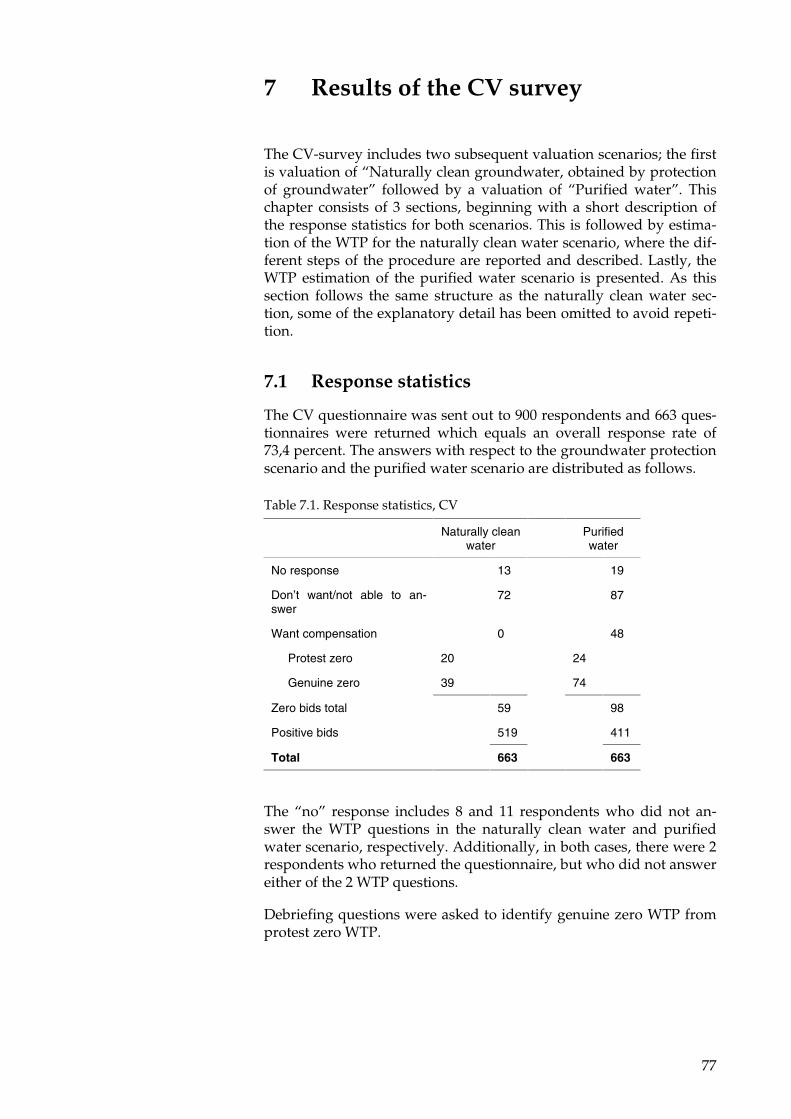
77
7� Results of the CV survey
The CV-survey includes two subsequent valuation scenarios; the firstis valuation of “Naturally clean groundwater, obtained by protectionof groundwater” followed by a valuation of “Purified water”. Thischapter consists of 3 sections, beginning with a short description ofthe response statistics for both scenarios. This is followed by estima-tion of the WTP for the naturally clean water scenario, where the dif-ferent steps of the procedure are reported and described. Lastly, theWTP estimation of the purified water scenario is presented. As thissection follows the same structure as the naturally clean water sec-tion, some of the explanatory detail has been omitted to avoid repeti-tion.
7.1� Response statistics
The CV questionnaire was sent out to 900 respondents and 663 ques-tionnaires were returned which equals an overall response rate of73,4 percent. The answers with respect to the groundwater protectionscenario and the purified water scenario are distributed as follows.
Table 7.1. Response statistics, CV
Naturally cleanwater
Purifiedwater
No response 13 19
Don’t want/not able to an-swer
72 87
Want compensation 0 48
Protest zero 20 24
Genuine zero 39 74
Zero bids total 59 98
Positive bids 519 411
Total 663 663
The “no” response includes 8 and 11 respondents who did not an-swer the WTP questions in the naturally clean water and purifiedwater scenario, respectively. Additionally, in both cases, there were 2respondents who returned the questionnaire, but who did not answereither of the 2 WTP questions.
Debriefing questions were asked to identify genuine zero WTP fromprotest zero WTP.

78
7.2� Estimation of WTP for Naturally Clean Water
7.2.1� Identifying protest and genuine zero bidsZero bids were conceived as protest zeros if the respondent statedthat;
• it is not my responsibility to pay for clean water• it is a public matter to ensure clean water• the polluter of ground water should pay to ensure clean
water.
Table 7.2 shows the distribution of genuine and protest zero
Table 7.2 Genuine and protest zeros
Number of re-sponses
Distribution inpercent
At the moment I cannot afford to pay more for waterthan I already do
14 30
It is of no significance to me if limit values for pesti-cides and/or nitrogen content in drinking water areexceeded
4 9
It is of no significance to me if limit values for pesti-cides and/or nitrogen content in groundwater areexceeded
4 9
It is of no significance to me whether conditions foranimal and plant-life in watercourses and lakes areimproved or not
0 0
I need more information to be able to respond toquestions such as these
11 23
I did not know how I should respond 2 4
Other 7 15
Do not know 5 10
Total non-protest answers 47 100
It is not my responsibility to pay for clean water 8 13
The public sector or the water companies should payto secure clean water
14 22
Those, who pollute the water should pay to secureclean water in future
38 59
What I would pay to secure clean water is not a con-cern for others
4 6
Total protest answers 64 100
Note that the total number of responses of zero bids amounts to morethan 59, as reported in Table 7.1, as the respondents were permittedto give several responses to the debriefing question. In cases where arespondent gave both a protest and a non-protest answer, the bid wasregarded as a genuine zero. One can argue that the zero bids fromrespondents who are in need of more information or who did notknow how to respond are not real zero bids. It is, however, consid-

79
ered as a conservative strategy to include these 13 respondents asgenuine zeros.
7.2.2� Bid curvesIn Figure 7.1 the cumulative distribution of the responses to the WTPquestion regarding groundwater protection is shown. The distribu-tion is based on 578 observations including genuine and protest zerobids. It appears from the figure that 5 percent of the sample has cho-sen the “choke price” of 2,400 DKK.
Figure 7.1. Bid curve for protected water
The figure confirms the expectation that the proportion of bids de-creases with increased bid size.
7.2.3� Non parametric WTPFigure 7.1 is based on bids chosen from the payment card with 10payment options. The bid can be viewed as a lower bound for therespondents’ WTP, and should ideally be treated as interval data,where the respondents’ “true” WTP is between the bid and the nextpayment option. In the following econometric estimations, the effecton WTP of regarding the data as either interval or bids will be stud-ied.
In Table 7.3, the mean, median and standard deviation of the WTPare described with and without zero bids and with different treat-ment of the interval data.
Table 7.3 Willingness to pay for clean water obtained by protection - bid estimates
Bid type Mean Median Std.dev
N
Positive and all zero bids Lower bound 687 625 572 578
Positive and genuine zero Lower bound 711 625 567 558
Positive and genuine zero Upper bound 926 800 615 558
Positive and genuine zero Interval average 819 713 587 558
0
100
200
300
400
500
600
700
0 500 1000 1500 2000 2500
�������
���
������

80
A conservative estimate of WTP is chosen, i.e. the lower bound meanof 711 DKK/year. Table 7.3 also shows an upper bound WTP at 926DKK/year, which is the mean of the bid just above the actual, statedbid. Furthermore, an average of these two bids is shown as the inter-val average at 819 DKK/year.5
7.2.4� Econometric estimationsIn this section the estimation results for the naturally clean ground-water scenario is presented. All the estimations are based on thesample of positive and genuine zero bids. The estimations are madein an iterative process, where potential significant variables are testedin the model. For reasons of comparison with the estimation results ofChapter 6, some variables are shown in the table, even though theyare not below the significance threshold of 10 percent. Table 7.4shows, at first, 3 simple OLS regressions using the average bid, thelower bound bid (corresponding to the stated bid) and the upperbound bid, respectively. However, these models may be biased for 2reasons:
1) The simple OLS regression does not take into account that theWTP cannot be less then zero. This is solved by using a Tobitmodel, which censors the WTP at zero. The average bid betweenthe lower bound and the upper bound is used as dependent vari-able.
2) The used bids are stated via a payment card and should ideally betreated as interval data and not as open-ended bids. Therefore,the last estimation in Table 7.4 is an interval regression where theinterval ranges from the actual stated bid to the bid that follows inthe payment card.
5 Some respondents chose the option “� ��� among the payment options. Thisinvolves 25 respondents with the naturally clean water scenario and 13 respondentswith the treated water scenario. These are included using the maximum bid as upperbound bid.
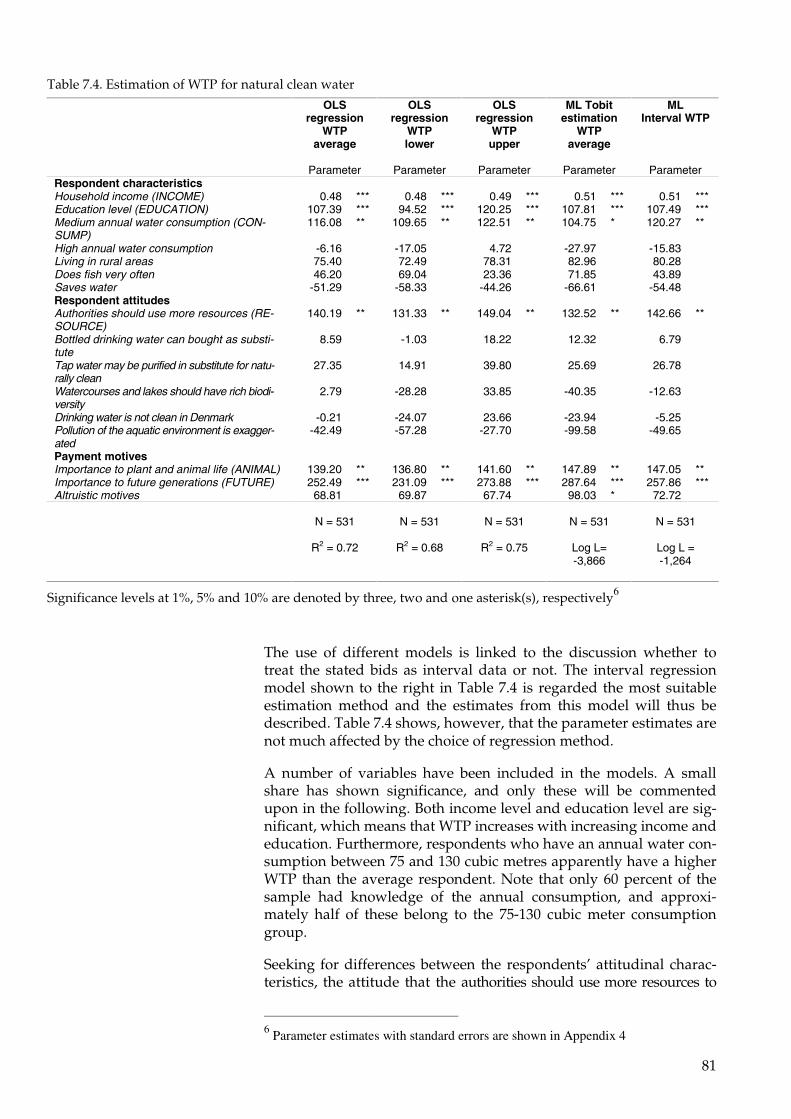
81
Table 7.4. Estimation of WTP for natural clean water
OLSregression
WTPaverage
OLSregression
WTPlower
OLSregression
WTPupper
ML Tobitestimation
WTPaverage
MLInterval WTP
Parameter Parameter Parameter Parameter ParameterRespondent characteristicsHousehold income (INCOME) 0.48 *** 0.48 *** 0.49 *** 0.51 *** 0.51 ***Education level (EDUCATION) 107.39 *** 94.52 *** 120.25 *** 107.81 *** 107.49 ***Medium annual water consumption (CON-SUMP)
116.08 ** 109.65 ** 122.51 ** 104.75 * 120.27 **
High annual water consumption -6.16 -17.05 4.72 -27.97 -15.83Living in rural areas 75.40 72.49 78.31 82.96 80.28Does fish very often 46.20 69.04 23.36 71.85 43.89Saves water -51.29 -58.33 -44.26 -66.61 -54.48Respondent attitudesAuthorities should use more resources (RE-SOURCE)
140.19 ** 131.33 ** 149.04 ** 132.52 ** 142.66 **
Bottled drinking water can bought as substi-tute
8.59 -1.03 18.22 12.32 6.79
Tap water may be purified in substitute for natu-rally clean
27.35 14.91 39.80 25.69 26.78
Watercourses and lakes should have rich biodi-versity
2.79 -28.28 33.85 -40.35 -12.63
Drinking water is not clean in Denmark -0.21 -24.07 23.66 -23.94 -5.25Pollution of the aquatic environment is exagger-ated
-42.49 -57.28 -27.70 -99.58 -49.65
Payment motivesImportance to plant and animal life (ANIMAL) 139.20 ** 136.80 ** 141.60 ** 147.89 ** 147.05 **Importance to future generations (FUTURE) 252.49 *** 231.09 *** 273.88 *** 287.64 *** 257.86 ***Altruistic motives 68.81 69.87 67.74 98.03 * 72.72
N = 531 N = 531 N = 531 N = 531 N = 531
R2 = 0.72 R2 = 0.68 R2 = 0.75 Log L=-3,866
Log L =-1,264
Significance levels at 1%, 5% and 10% are denoted by three, two and one asterisk(s), respectively6
The use of different models is linked to the discussion whether totreat the stated bids as interval data or not. The interval regressionmodel shown to the right in Table 7.4 is regarded the most suitableestimation method and the estimates from this model will thus bedescribed. Table 7.4 shows, however, that the parameter estimates arenot much affected by the choice of regression method.
A number of variables have been included in the models. A smallshare has shown significance, and only these will be commentedupon in the following. Both income level and education level are sig-nificant, which means that WTP increases with increasing income andeducation. Furthermore, respondents who have an annual water con-sumption between 75 and 130 cubic metres apparently have a higherWTP than the average respondent. Note that only 60 percent of thesample had knowledge of the annual consumption, and approxi-mately half of these belong to the 75-130 cubic meter consumptiongroup.
Seeking for differences between the respondents’ attitudinal charac-teristics, the attitude that the authorities should use more resources to
6 Parameter estimates with standard errors are shown in Appendix 4

82
protect the aquatic environment than they do now turned out to be sig-nificant. The positive parameter estimate suggests that those who agreewith this (63 percent of the sample) also are willing to spend morethemselves.
The respondents’ motives for stating a positive bid has been intro-duced to the model as well. These motives have been elicited from adebriefing question in the questionnaire and the answers are distrib-uted as shown in Table 7.5.
Table 7.5 Motives for positive WTP
Reasons to state a positive bid Number ofresponses
Distribution in per-cent (519 positiveanswers)
1) It was the highest sum I could afford 122 242) Clean drinking water is important to me and, therefore, I would willinglypay to ensure clean drinking water supplies
375 72
3) Clean groundwater is important to me and, therefore, I would will-ingly pay to secure clean groundwater
307 59
4) Clean groundwater is important to plant and animal-life andtherefore, I would willingly pay to secure clean groundwater
263 51
5) Clean groundwater is important to future generations and there-fore, I would willingly pay to secure clean groundwater
326 63
6) I wanted to express my interest in ensuring a healthy and cleanenvironment
184 35
7) Securing clean water is an important task and, by indicating a highsum, I hope to contribute to that soon something might be done about thisissue
134 26
8) I indicated the sum I would wish I had at my disposal to pay tosecure clean drinking water
42 8
9) I did not know how else I should respond 10 210) I set a sum taking into consideration what I pay for other things 128 2511) Other 24 512) Do not know 27 5
Reasons no. 6 and 7 from Table 7.5 have been regarded as altruisticmotives. However, in the Tobit estimation it appears that the 38 per-cent of the respondents who stated one of these reasons (or both)have a significantly higher WTP than the rest of the sample. It can bedebated whether inclusion of altruistic motives is reasonable in con-nection with economic valuation as the benefits can potentially bedouble-counted in this way. For a further discussion see Bjørner et al.(2000).
Respondents who stated a positive bid due to conditions for plantand animal life (40 percent) or due to future generations (50 percent)also have a significantly higher WTP (147 DKK/HH/year and 258DKK/HH/year respectively). These parameter estimates indicate thenon-use value connected to the scenario. Further description of valuetypes connected to groundwater can be found in Hasler et al. (2004).
7.2.5� WTP FunctionThe significant parameters make up the WTP function for naturallyclean groundwater. Based on the interval regression, the function is:

83
�����������������������
��������������������������� �!"��
86.25705.14766.142
27.12049.10751.0
++
+++=
( 7-1 )
The variable names corresponds to the names in brackets in the esti-mation Table 7.4
Based on the average sample, the WTP equals:
5086.25740.005.14763.066.14228.027.12048.249.10743051.0 �������� �!"�� +++++==
797 DKK / HH / YEAR
The estimated yearly WTP per household at 797 DKK seems reason-able compared with the grand mean and the median of the averageinterval at 819 and 713, respectively.
7.2.6� WTP influenced by self-reported certaintyParallel to examination of the influence of self-reported certainty onWTP in the chapter on CE, the influence of this on WTP for the natu-rally clean water scenario has been examined. The distribution of self-reported certainty on the 7-level scale is illustrated in Figure 7.1.
Figure 7.2 Distribution of certainty levels
Comparing the certainty level of the CE survey (Figure 6.2) with thepresent certainty level from the CV survey (Figure 7.2) indicates thatanswering the CV questionnaire was less demanding than answeringthe CE questionnaire. By using the same threshold level (3) to reducethe sample size as in the CE estimations, a certainty influenced WTPcan be estimated. This is shown in Table 7.6.
0
5
10
15
20
25
30
35
����
������
����
����
��������������� ���

84
Table 7.6 WTP for naturally clean water influenced by certainty
OLSregression
WTPaverage
ML Tobit esti-mation
WTP average
MLInterval WTP
Parameter Parameter ParameterRespondent characteristicsHousehold income, DKK (INCOME) 0.49 *** 0.51 *** 0.51 ***Education level (EDUCATION) 107.55 *** 106.80 *** 108.60 ***Medium annual water consumption (CONSUMP-TION)
132.16 ** 120.07 * 138.53 **
High annual water consumption -24.02 -52.58 -33.46Living in rural areas 82.67 95.98 87.49Does fish very often 43.80 68.91 40.83Saves water -66.40 -82.00 -66.38Respondent attitudesThe authorities should use more resources (RE-SOURCES)
112.45 * 105.30 * 113.59 *
Bottled drinking water can bought as substitute 38.62 46.23 37.72Tap water may be treated in substitute for naturallyclean
3.05 0.70 3.09
Watercourses and lakes should have rich biodiversity 4.89 -39.68 -11.66Drinking water is not clean in Denmark -10.52 -26.66 -16.31Pollution of the aquatic environment is exaggerated -25.60 -87.41 -34.61Payment motivesImportance to plant and animal life (ANIMAL) 177.15 *** 186.54 *** 183.77 ***Importance to future generations (FUTURE) 239.62 *** 276.15 *** 245.58 ***Altruistic motives 59.51 86.57 63.66
N = 452 N = 452 N = 452
R2 = 0.73 Log L=-3,277.77
Log L =-1,070.70
Significance levels at 1%, 5% and 10% are denoted by three, two and one asterisk(s), respectively
By using the parameter estimates from the interval regression in Ta-ble 7.6, a WTP for naturally clean water can be estimated at 795 DKKper year per household. This is in contrast to the CE results, whereincreasing level of certainty was connected to increasing WTP. In theCV estimation, the certainty level seems to have no effect on the WTP.This is, however, probably also related to the fact that only a smallnumber of observations is removed in order to make the certaintyadjustment in the CV estimation. This approach does not accord withthe way in which certainty questions are typically used in CV analy-sis, where respondents who are uncertain, but still state a positiveWTP, are changed to a zero WTP. The approach used, however, hasbeen chosen in order to be able to compare how certainty affects boththe CE and CV estimates.
7.2.7� Section summary of naturally clean waterThe WTP for naturally clean groundwater has been estimated at 797DKK per household per year. The estimation has been carried out byuse of interval regression based on 531 observations.
The WTP is correlated with annual household income, educationlevel of the respondent and the consumption of water. Furthermore,respondents in this sample who believe that the authorities shoulduse more resources to protect the environment are willing to pay anadditional 140 DKK per year. A significant part of the WTP is moti-
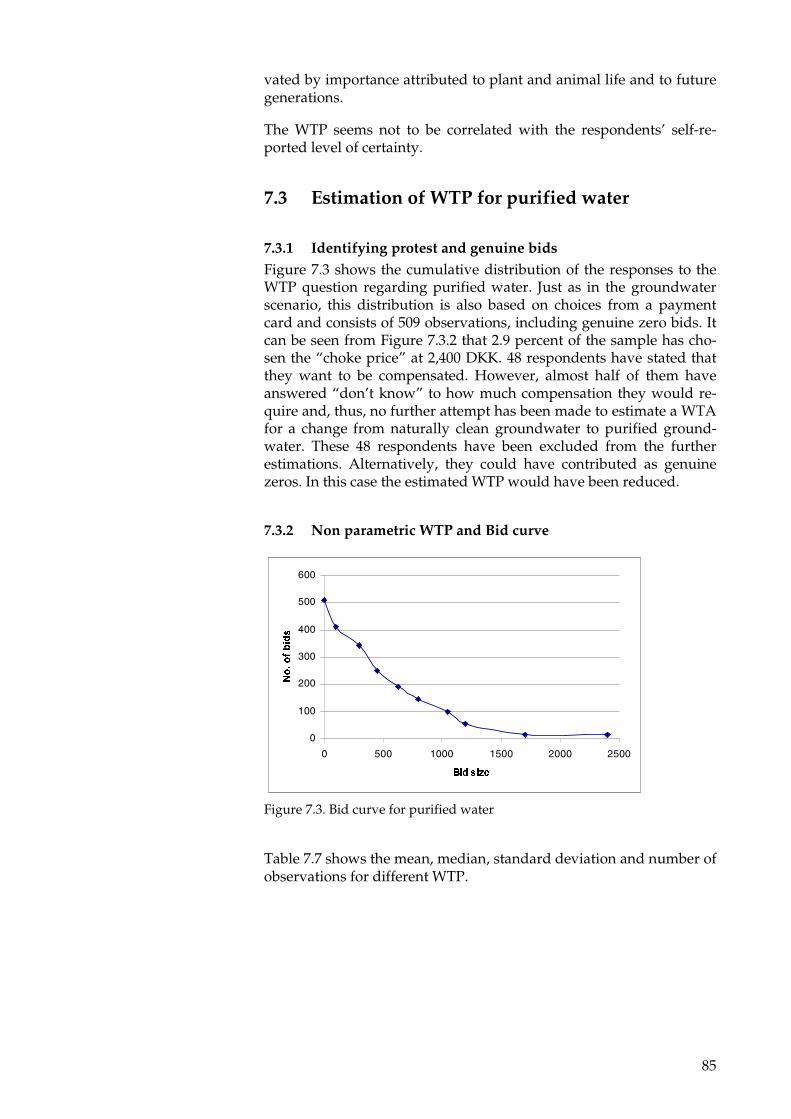
85
vated by importance attributed to plant and animal life and to futuregenerations.
The WTP seems not to be correlated with the respondents’ self-re-ported level of certainty.
7.3� Estimation of WTP for purified water
7.3.1� Identifying protest and genuine bidsFigure 7.3 shows the cumulative distribution of the responses to theWTP question regarding purified water. Just as in the groundwaterscenario, this distribution is also based on choices from a paymentcard and consists of 509 observations, including genuine zero bids. Itcan be seen from Figure 7.3.2 that 2.9 percent of the sample has cho-sen the “choke price” at 2,400 DKK. 48 respondents have stated thatthey want to be compensated. However, almost half of them haveanswered “don’t know” to how much compensation they would re-quire and, thus, no further attempt has been made to estimate a WTAfor a change from naturally clean groundwater to purified ground-water. These 48 respondents have been excluded from the furtherestimations. Alternatively, they could have contributed as genuinezeros. In this case the estimated WTP would have been reduced.
7.3.2� Non parametric WTP and Bid curve
Figure 7.3. Bid curve for purified water
Table 7.7 shows the mean, median, standard deviation and number ofobservations for different WTP.
0
100
200
300
400
500
600
0 500 1000 1500 2000 2500
��������
�����������
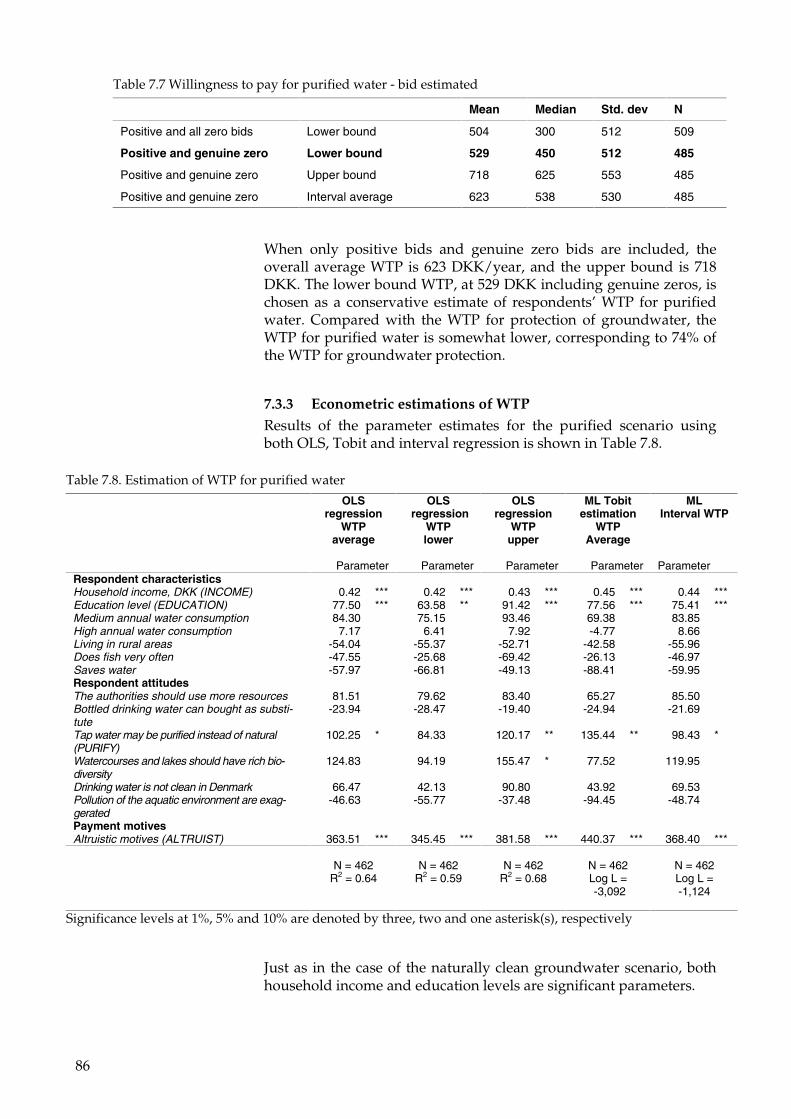
86
Table 7.7 Willingness to pay for purified water - bid estimated
Mean Median Std. dev N
Positive and all zero bids Lower bound 504 300 512 509
Positive and genuine zero Lower bound 529 450 512 485
Positive and genuine zero Upper bound 718 625 553 485
Positive and genuine zero Interval average 623 538 530 485
When only positive bids and genuine zero bids are included, theoverall average WTP is 623 DKK/year, and the upper bound is 718DKK. The lower bound WTP, at 529 DKK including genuine zeros, ischosen as a conservative estimate of respondents’ WTP for purifiedwater. Compared with the WTP for protection of groundwater, theWTP for purified water is somewhat lower, corresponding to 74% ofthe WTP for groundwater protection.
7.3.3� Econometric estimations of WTPResults of the parameter estimates for the purified scenario usingboth OLS, Tobit and interval regression is shown in Table 7.8.
Table 7.8. Estimation of WTP for purified water
OLSregression
WTPaverage
OLS regression
WTPlower
OLSregression
WTPupper
ML Tobitestimation
WTPAverage
MLInterval WTP
Parameter Parameter Parameter Parameter ParameterRespondent characteristicsHousehold income, DKK (INCOME) 0.42 *** 0.42 *** 0.43 *** 0.45 *** 0.44 ***Education level (EDUCATION) 77.50 *** 63.58 ** 91.42 *** 77.56 *** 75.41 ***Medium annual water consumption 84.30 75.15 93.46 69.38 83.85High annual water consumption 7.17 6.41 7.92 -4.77 8.66Living in rural areas -54.04 -55.37 -52.71 -42.58 -55.96Does fish very often -47.55 -25.68 -69.42 -26.13 -46.97Saves water -57.97 -66.81 -49.13 -88.41 -59.95Respondent attitudesThe authorities should use more resources 81.51 79.62 83.40 65.27 85.50Bottled drinking water can bought as substi-tute
-23.94 -28.47 -19.40 -24.94 -21.69
Tap water may be purified instead of natural(PURIFY)
102.25 * 84.33 120.17 ** 135.44 ** 98.43 *
Watercourses and lakes should have rich bio-diversity
124.83 94.19 155.47 * 77.52 119.95
Drinking water is not clean in Denmark 66.47 42.13 90.80 43.92 69.53Pollution of the aquatic environment are exag-gerated
-46.63 -55.77 -37.48 -94.45 -48.74
Payment motivesAltruistic motives (ALTRUIST) 363.51 *** 345.45 *** 381.58 *** 440.37 *** 368.40 ***
N = 462 N = 462 N = 462 N = 462 N = 462R2 = 0.64 R2 = 0.59 R2 = 0.68 Log L =
-3,092Log L =-1,124
Significance levels at 1%, 5% and 10% are denoted by three, two and one asterisk(s), respectively
Just as in the case of the naturally clean groundwater scenario, bothhousehold income and education levels are significant parameters.

87
Unlike the estimations for naturally clean water, there is no reason toestimate parameters for motives related to the non-use values for thepurified water scenario, as there are no such values connected to thisscenario.
An interesting point is that WTP for purified water is connected tothe respondent’s attitude towards treatment of water. Respondentswho, to a certain degree, have agreed that drinking water does nothave to come from non-purified groundwater and that purified wateris just as good (23 percent), have a significant WTP ranging from 98-135 DKK/HH/year depending on the estimation method used.
Also, in this case the motives to state a positive bid are examined andthe associated distribution can be seen in Table 7.9.
Table 7.9 Reasons to state a positive bid
Number ofresponses
Distribution inpercent
(411 positiveanswers)
1) It was the highest sum I could afford 94 232) Clean drinking water is important to me and, therefore, I wouldwillingly pay to ensure clean drinking water supplies
287 70
3) Securing clean water is an important task and by indicating a highsum, I hope to contribute to that soon something might be done about thisissue
124 30
4) I indicated the sum I would wish I had at my disposal to pay tosecure clean drinking water
41 10
5) I did not know how else I should respond 21 56) I set a sum taking into consideration what I pay for other things 106 267) I chose a lower sum than in Question 5.1, as I do not think asmuch of the proposed alternative inQuestion 5.5 as of that in Question 5.
76 18
8) Other 13 39) Do not know 2 0
Just as in Section 2.2.4, reasons no. 3 and 4 in Table 7.9 are regardedas being altruistic.
When this motive is incorporated in the model, it turns out that anoteworthy proportion of the WTP is related to the respondents’ de-sire to contribute to a good cause.
7.3.4� WTP Function
���������������#������������������ �$���"�� 40.36843.9841.7544.0 +++= ( 7-2 )
The variable names correspond to the names in brackets in the esti-mation Table 7.8.
Based on the average sample, the WTP equals:
23.040.36823.043.9848.241.7502.43044.0 ����� �$���"�� +++=
=461 DKK / HH / YEAR

88
The estimated yearly WTP per household at 461 DKK is somewhatlower than the grand mean and the median of the average interval at623 and 538, respectively.
7.3.5� WTP influenced by self-reported certaintyThe distribution of the self-reported certainty connected to the puri-fied water scenario is illustrated in Figure 7.4. The certainty scale goesfrom level 1 (very unsure) to level 7 (very sure).
Figure 7.4. Distribution of certainty, purified water
Table 7.10, below, shows the estimation results after reducing thesample with respondents who stated a certainty below level 3.
Table 7.10 WTP for Purified water influenced by certainty
OLS regres-sion
WTP max
ML Tobitestimation
WTP average
MLInterval WTPmin & max
Parameter Parameter ParameterRespondent characteristicsHousehold income, DKK 0.47 *** 0.51 *** 0.49 ***Education level 59.32 ** 52.93 57.93 *Medium annual water consumption 80.58 60.11 80.94High annual water consumption -12.45 -32.03 -13.32Living in rural areas -46.95 -31.00 -50.25Does fish very often -38.12 -6.70 -37.31Saves water -35.22 -69.34 -38.40Respondent attitudesThe authorities should use more resources 93.55 73.64 97.00Bottled drinking water can bought as substitute -54.72 -67.77 -52.36Tap water may be treated instead of natural 83.79 118.35 78.20Watercourses and lakes should have rich biodiversity 147.92 115.08 144.39Drinking water is not clean in Denmark 66.76 60.54 70.43Pollution of the aquatic environment are exaggerated -25.94 -86.77 -29.15Payment motivesAltruistic motives 385.62 *** 476.09 *** 391.23 ***
N = 374 N = 374 N = 374R2 = 0.63 Log L =
-2,464.91Log L =-921.47
Significance levels at 1%, 5% and 10% are denoted by three, two and one asterisk(s), respectively
0
5
10
15
20
25
30
����
������
����
����
��������������� ���

89
By using the parameter estimates from Table 7.10, the certainty cali-brated WTP is calculated at 427 DKK per year per household. Just asis the case for naturally clean water, it does not seem as if certaintyinfluences the WTP for purified water.
7.3.6� Section summary purified waterThe WTP for purified water has been estimated at 461 DKK perhousehold per year. This number is correlated with the annualhousehold income as well as the respondents’ educational level. I.e.high-income levels and long education influence the WTP positively,and result in higher WTP. Respondents who trust the use of purifiedwater as a substitute for naturally clean water have a higher WTPthan those who do not put their trust in this. Furthermore, a signifi-cant part of the WTP can be assigned to the respondents’ urge to dosomething for a good cause, i.e. altruism. Just as in the case of natu-rally clean water, there is no correlation between the respondents’WTP and self-reported level of certainty.

90
8� Comparison of the two surveys
8.1� The results from the two studies
Table 8.1 below compares and presents the WTP estimates from theCE and CV surveys.
Table 8.1 Estimated WTP-results
CE CV
Naturally clean groundwater 1,899
Very good conditions for plant and animal life 1,204 711
Total 3,104 711
Purified water 912 529
All sums are household WTP in DKK per year.
In the CV survey, WTP has been elicited for an aggregate of bothgroundwater and environment. Thus, it is necessary to add the CEWTP from ”naturally clean groundwater” with the CE WTP from”very good conditions for plant and animal life” in order to comparethe CE results with the CV result. In general, this study shows thatthe WTP from the CE survey is approximately 2 to 4 times higherthan the WTP from the CV survey. This is supported by a largeamount of experimental evidence, which demonstrates that CE tendsto produce much higher valuation estimates than CV (see e.g. Boyleet al., 2004). The issue is discussed further in Section 8.2.3 below.
In addition to the actual magnitude of the WTP sums, the CE estima-tions also provide information on the relative importance of the re-spondents’ preferences for the attributes in question. The CE surveyconfirms that naturally clean water management is preferred to puri-fication of water and that there is a positive WTP for improved con-ditions for animal and plant life.
The CE result for naturally clean water resulting from protection ofthe groundwater resource represents a marginal increase of almost 50%; from 4,000 to 5,899 DKK/year. It is evident that the WTP forgroundwater protection exceeds the WTP for purification. However,the WTP for purified water from the CE survey represents only 30%of the total WTP for groundwater protection.
As mentioned earlier, one of the hypotheses in this study is that con-sumers prefer naturally clean groundwater, which is not in need of purifica-tion or other treatment, to water that has been polluted and treated to clean,thereafter. This is a premise underlying Danish drinking water policy.By testing this hypothesis, the benefits of groundwater protection

91
versus purification are measured and this hypothesis cannot be re-jected by the results obtained from either of the two methods. The CEresults support this hypothesis, as well as the hypothesis that theWTP for groundwater protection exceeds the WTP for purified water.The CV results confirm that there is a positive WTP for the aggregatescenario of naturally clean groundwater and very good conditions forplant and animal life.
The second hypothesis is that the value associated with clean drinkingwater exceeds the value associated with good quality of surface waters. Therationale here is that clean drinking water influences human health,and hence private goods, more directly than the quality of surfacewaters does. This hypothesis cannot be rejected either, as the CE re-sults indicate that the WTP for good conditions in surface waterscomprises 63% of the WTP for good drinking water quality obtainedby protection. The explanation for this difference being that cleandrinking water influences human health and hence private goodsmore directly than the quality of surface waters does, both for presentand future generations, is therefore supported by the results. Com-pared with foreign valuation results, as well as Danish, the results arein agreement with the assumptions. The results can be explained byconsiderations for future generations, by altruistic motives and use-values, because clean drinking water influences human health andhence private goods more directly than the quality of surface watersdoes.
The third and fourth hypotheses are that the WTP in urban areas exceeds theWTP in rural areas, and that the WTP in households with children exceedsthe WTP in households without children. Furthermore, we hypothesise thatWTP of females exceeds WTP for males. These hypotheses are motivatedby the results of former analyses of the demand for organic foods inDenmark and Great Britain (Wier, 2004). These results show that ur-ban residents consume organic foods to a higher degree than resi-dents living in rural areas. This study also concludes that householdswith children under 15 years of age have a higher demand for organicfoods than other households (Wier, 2004). Therefore, it is not thepresence of children, in itself, which increases the demand, but thepresence of children under 15 years of age. Human health and envi-ronmental concern are the most stated reasons for preferring organicfood to conventional, and we expect that these reasons are also thedrivers for the hypothesised preferences for clean groundwater.
The results of the estimations indicate that there are differences inhouseholds’ WTP between urban and rural areas, as the WTP ishigher in urban than in rural areas. The hypothesis, therefore, cannotbe rejected. Furthermore, the results show that the WTP of femalesare higher than those for males, but that the effect of age and thepresence of children in the household are insignificant, i.e. the WTP isnot dependent on whether there are children in the household or onthe age of the members of the household.
In both surveys, a correlation between household income, educationlevel of the respondent, household water consumption and thehousehold WTP has been demonstrated. In Section 3.4.1, it wasshown that, in a number of ways, the sample of respondents did not

92
match the population of Denmark. This applies for example in thecase of household income. Therefore, as the WTP estimates are cor-related with income, the findings cannot be generalised without cau-tion.
8.2� Discussion of results
8.2.1� Comparison to other studiesAs mentioned in Section 1, no studies have been found focusing onboth drinking water and surface water quality as in this study, andno studies have been found focusing on purification versus protec-tion. The results from the two studies mentioned below can, there-fore, be compared to the results from the present study, but only withrespect to drinking water quality.
In their CV-study Bergstrom et al. (1994) on “safe” drinking water, aWTP between 242 and 691 DKK7 per year per household was arrivedat.
Stenger & Willinger (1998) found WTP estimates between 701 and1,755 DKK8 per year for a household for groundwater of good qualityfor drinking water. The upper level refers to WTP questions posed inan open-ended format, and the lowest level in a close-ended format.
Press & Söderquist (1996) estimated a WTP of 2,483 DKK9 per yearper household to secure water quality in Milan for pollution limitvalues for drinking water not to be exceeded.
Jensen et al. (1995) valued measures which secure substantial reduc-tions in groundwater pollution, and reported WTP of 1,000DKK/year elicited by an open-ended payment format, and 2,100 us-ing the close-ended format.
It is apparent that the results from the present study are in the samerange as these studies; the CV results for drinking water are compa-rable to Bergstrom’s results and the lower bound from Stenger &Willinger. The results from Press & Söderquist and Jensen et al.’s up-per bound are comparable with the results from the CE, but aresomewhat higher. On analysis of the results of these previous studies,DØR (2004) concludes that a mean value for Danish water protectionis approximately 900 DKK/year. If this benefit approximation is perhousehold it can be considered to represent an underestimate com-pared with the results of the present study.
Georgiou et al., (2000) analysed WTP for water quality river basins,and they found a WTP of £2.76 per annum in the CV study and £5.08
7 The amount is converted from USD to DKK by a conversion rate on 605,87(DØRS, 2004, p. 210)8 Conversion made by DØRS(2004), p.2109 Conversion made by DØRS(2004), p.210

93
per annum in a contingent ranking (CR) study, i.e. 61 and 33 DKK10
per household per year, respectively. However, these valuationscomprise the WTP for protection of one single river (the River Tame)and it should, therefore, be expected that the WTP estimates aremuch lower than the WTP for good quality in all Danish water-courses and lakes, which is the focus of the present study.
8.2.2� Discussion of the results compared to other comparativeCV/CE studies
As mentioned in Section 8.1, the CE results are higher than those inthe CV for all goods valued in the present study, and these results aresupported by empirical results comparing choice methods with CV,cf. Georgiou et al. 2000, Stevens et al. (2000), Desvousges & Smith(1983), Hanley (1998a) and Foster & Mourato (2000).
Georgiou et al.’s study (2000) analysed the value of river water qual-ity improvements with CV and CR, and they tested scope sensitivityand ordering effects with the two methods besides comparisons ofthe methods. They found that the CR results were larger than the CVresults, which is consistent with the previous findings mentionedabove.
Stevens et al. (op cit) found that WTP from choice modelling tech-niques, more specifically CR, are generally larger than those from CV.Desvousges & Smith (op cit) was one of the first studies comparingCV and choice modelling techniques (CM), i.e. CR, and was con-ducted in a study of water quality in a river. They found WTP thatwere three to four times lower than that obtained from CR.
Hanley (1998a) finds that the value of an environmental change ob-tained by dichotomous choice CV is more or less equal to the valueobtained by CE. He also found, however, that CE results are threetimes as high as those obtained by open-ended CV, CE being morecomparable to payment cards than to dichotomous choice.
In a comparative study, Foster & Mourato (1999) compare CV (di-chotomous format, cf. Section 2) and CR in a study on two nestedpublic goods:
1) An inclusive good: All charities operating in the housing andhomelessness sector as well as the counselling and support servicesector, the social services charities, health and medical charities andcharities for culture, environment and overseas aid.
2) A less inclusive good: All charities operating in the housing andhomelessness sector.
Their results indicate that the CR values exhibit greater sensitivity toscope, i.e. they are more sensitive to the framing of the questions andthe scale than the CV values are. They find that the CR results pro-duce significantly higher results than CV for the inclusive good (1),and significantly lower for the less inclusive good (2). When using the
10 The amount is converted from English pounds to DKK by a conversion rate of1206 (the conversion rate 18.01.2000)
94
most preferred alternative (MPA) method on the CR data, the resultsare comparable to a choice experiment study. In using this method,Foster & Mourato (op cit) find that divergences are even greaterwhen applying MPA compared with full ranking, indicating that di-vergences can be greater employing CE.
However, in a study on moose hunting, Boxall et al. (1996) compareCV (referendum format, cf. Section 2) and CE, and find opposing re-sults. They estimate values derived from the two methods and usethe choice experiment model to explain the differences between thevalues and to illustrate problems with the CV method. The empiricalstudy of moose hunting yielded higher WTP estimates from the CVthan from the CE. Boxall et al. (op cit) conclude that WTP estimatesfrom CE are more comparable to estimates elicited by revealed me-thods than CV results are - and hereby lie closer to the “true” value.
8.2.3� Discussion of explanations for the differences foundAs mentioned in Section 3, elicitation of WTP by both CV and CEmethods is dependent on;
� the description of the hypothetical market� what respondents know about the good and the information level� the preferences of the respondents� the availability of substitutes –and the information on substitutes� the budget constraints of the respondents
Some of the differences in results between different hypotheticalmethods can, therefore, be explained by the fact that the perception ofthe public good can differ due to different descriptions of the hypo-thetical market and the good – i.e. the respondents do not value thesame good. This can be a risk if the methods present the problem andthe good in different ways – especially if it is a nested good.
Although the wording and framing is more or less equal in the twosurveys in the present study this could still represent a problem andone of the explanations for the different results from the two me-thods. This can especially be the case when analysing the effects ofaggregate policies and multiple effects versus partial effects fromdifferent components of the policy.
Hoehn & Randall (1987) prove theoretically that under standard neo-classical assumptions open-ended CV–results are lower than resultsfrom dichotomous choice. Dichotomous choice is more similar to dis-crete choice methods than to open-ended formats.
Steven et al. (op cit) and Georgiou et al. (2000) explain the differencesbetween CV and CE results with the following explanations:
1. Substitutes are expressed more explicitly in CM than in CV andencourage respondents to make trade-offs
2. Choices and rankings will result in a larger emphasis on pricecompared to the direct decisions on WTP in CV
95
3. It is easier to express indifference to choices in CE than in CV, andprotest behaviour is a less serious problem in CE compared withCV
Georgiou et al. (2000) conclude that they believe that “CV may createincentives for respondents to understate their true WTP” as a resultof the four factors above. Ordering effects found by Georgiou et al.(op cit) might also influence the CV results in the present study, asthere might be a risk of bias in asking the same respondent two sub-sequent WTP questions, i.e. first relating to the naturally clean waterscenario then the purified water scenario.
Besides the above-mentioned explanations, Georgiou et al. (2000)found that 23% of the respondents in the CV survey did not respondto the valuation questions, while only 2% of the respondents in theContingent Ranking (CR) survey did not respond. In the presentstudy, no such differences have occurred, as the re-sponse is more or less equal in the two surveys.
Boxall et al. (1996) stated that information inefficiencies, supposed toaffect the results of CV, are reduced by using the CE-method becauseof the repeated sampling method and the systematically variedchoice situations employed in CE. Another important explanation ofthe difference in results from the two methods is, therefore, that WTPestimations in CV rely more on the accuracy of the information andon formulation of the precise changes in environmental services andgoods than in CE. Rather than a specific change in the good or ser-vice, CE reveals WTP by representation of an array of choices. There-fore, the accuracy of the CE method relies on the characteristics used todescribe the choice alternatives while the accuracy of the CV methodrelies on the precise description of the changes (cf. Boxall et al, op cit).
Boxall et al. (op cit) found three plausible explanations, where sub-stitution and compliance bias are important (cf. the explanationsabove):
1. The respondents in the CV survey did not understand the ques-tions and scenarios
2. Compliance bias; the respondents in the CV are “yeah-sayers”11.3. The respondents in the CV survey ignored substitution possibili-
ties.
In the present study, respondents are asked how certain they were intheir choices and to indicate their certainty level on a Likert scalefrom 1 to 7. Comparison of the results in Figures 6.2 and 7.2. indicatesthat the respondents were actually more certain of their answers inthe CV survey compared with in the CE. Consequently, explanation 1does not prove to be plausible for the present study. Furthermore, thedebriefing questions in the CV indicate that 2 is not plausible eitheras the respondents are not “yeah-sayers”11, but rather, altruistic mo-tives are somewhat dominant among the CV respondents. It is, how-ever, not known whether altruistic motives are dominant in the CE
11 “Yeah-saying” means that the respondent has not really thought carefully aboutthe stated WTP.

96
survey, as this debriefing question is not asked. It is more difficult toask these questions in a CE survey than in a CV questionnaire.
Boxall et al. (op cit) conclude that explanation no. 3 is the most plau-sible explanation. In the present CV study, substitution effects are notaccounted for in the same way as in the present CE survey, causinghypothetical bias, which most likely, is an explanation for the lowerCV results as well. I.e. the respondents are not asked to make trade-offs between an uncertain delivery of pure water in the future, puri-fied water or protected water. In the present study, we can judge ifthe CV respondents were less or more confident in their answers thanthe CE respondents were, from answers to the certainty question inboth questionnaires. The respondents’ self-reported certainty influ-enced the WTP in the CE survey, whereas there was no effect in anyof the scenarios in the CV. By looking only at the levels of the self-reported certainty, it seems as though the CV survey has been aneasier task to complete than the CE survey as, in general, the respon-dents state a higher level of certainty in the CV survey.
Boyle et al. (2004) list a number of studies where CM produces highervaluation estimates than CV and explain the divergence by the lack ofincentive compatibility in CM. This includes respondents’ choosingbetween more than two alternatives and repeated choices.
In their conclusion, Georgiou et al. (2000) presented an interval withthe CV results as a lower bound and the CR result as the upperbound, but most emphasis was expressed on the CR results. Georgiouet al. (2000) conclude, however, that no conclusive evidence could begiven for the reasons for the differences in CV and CE.
However, on the basis of the above-mentioned findings on the diffe-rences between CE and CV results, the results from the CE survey arerecommended as an estimate of WTP for the different scenarios ofgroundwater management, but with the CV results used as a lowerbound.

97
References
Adamovicz, V. & Boxall, P. 2001: Future Directions of Stated ChoiceMethods for Environment Valuation, Paper Prepared for “ChoiceExperiments: A New Approach to Environmental Valuation”, Lon-don, April 10th 2001.
Adamowicz, W., Louviere, J. & Williams, M. 1994: Combining re-vealed and stated preference methods for valuing environmentalamenities. Journal of Environmental Economics and Management.26(3), 271-92
Adamowicz, W. 1995: Alternative Valuation Techniques: A Compari-son and Movement to a Synthesis. In Willis, K.G. & J.T. Corkindale(eds.): Environmental Valuation, Cab International.
Andersen, J.M., Boutrup, S., Svendsen, L.M., Bøgestrand, J., Grant, R.,Jensen, J.P., Ellermann, T., Rasmussen, M.B., Jørgensen, L.F. & Laur-sen, K.D. 2003: Vandmiljø 2003. Tilstand og udvikling - faglig sam-menfatning. Danmarks Miljøundersøgelser. Faglig rapport fra DMU471: 50 s.
Arrow, K.J., Solow, R., Portney, P.R., Leamer, E.E., Radner, R. &Schuman, H. 1993: Report of the National Oceanic and AtmosphericAdministration (NOAA) Panel on Contingent Valuation, FederalRegister, 58(10):4601-4614.
Bach, H., Christensen, N. & Kristensen, P. (eds) 2002: The State of theEnvironment in Denmark, 2001. National Environmental ResearchInstitute, Roskilde, Denmark. 368 pp. NERI technical report No. 409.
Bateman, I.J., Cooper, P., Gergiou, S. & Poe, G.L. 2001: Visible choicesets and scope sensitivity: an experimental and field test on studydesign effects upon nested contingent values. CSERGE Global Envi-ronmental Change Working paper EDM 01-01, Centre for Social andEconomic Research on The Global Environment, University of EastAnglia.
Bateman, I.J., Carson, R.T., Day, B., Hanemann, M., Hanley, N., Hett,T., Jones-Lee, M., Loomes, G., Mourato, S., Özdemiroglu, E., Pearce,D.W., Sugden, R. & Swanson, J. 2002: Economic Valuation with Stat-ted Preference Techniques. A Manual, Edward Elgar Publishing,Cheltenham.
Battrup-Pedersen, A., Friberg, N., Pedersen, M.L., Skriver, J., Kron-vang, B. & Larsen, S.E. 2004: Anvendelse af vandrammedirektivet idanske vandløb. Danmarks Miljøundersøgelser. Faglig rapport fraDMU 499:145 ss.
Batsell, R.R. & Louviere, J.J. 1992: Experimental Choice Analysis.Marketing Letters 2, pp. 199-214.
Bennet, J. & Adamowicz, V. 2001: Some Fundamentals of Environ-mental Choice Modelling. In: Bennet, J. & R. K. Blamey (eds.): The

98
Choice Modelling Approach to Environmental Valuation. EdwardElgar Publishing Limited, UK. pp. 37-69.
Bergstrom, J.C. & Dorfman, J.F. 1994: Commodity Information andWillingness-to-Pay for Groundwater Quality Protection, Review ofAgricultural Economics 16(3), 413-425.
Bjørner, T.B.B., Russel, C.F., Dubgaard, A., Damgaard, C. & Ander-sen, L.M. 2000: Public and Private Preferences for EnvironmentalQuality in Denmark. SØM publication no 39. AKF forlaget. Køben-havn
Boiesen, J., Jacobsen, J.B., Thorsen, B.J., Strange, N. & Dubgaard, A.(under preparation). Værdisætning af de danske lyngheder. WorkingPaper, KVL, Frederiksberg.
Boyle, K., Poor, J.P. & Taylor, L.O. 1999: Estimating the demand froProtection of Freshwater Lakes from Euthrophication”, AmericanJournal of Agricultural Economics 81(5), 1118-1122.
Boyle, K., Morrison, M. & Taylor, L. 2004: Why Value Estimates Gen-erated Using Choice Modelling Exceed Contingent Valuation: FurtherExperimental Evidence. Paper presented at the Australian Agricul-tural and Resource Economics Society Conference, Melbourne.
Boxall P.C., Adamowizc, V., Swait, J., Williams, M. & Louivere, J.1996: A comparison of stated preference methods for Environmentalvaluation. Ecological Economics 18, 243-253.
Carlsson, F. & Martinsson, P. 2003: Design Techniques for StatedPreference Methods in Health Economics, Health Economics, 12:281-294.
Carlsson, F., Frykblom, P. & Lagerkvist, C.-J. 2004: Using Cheap-Talkas a Test of Validity in Choice Experiments, Working Papers in Eco-nomics no. 128, Department of Economics, Gothenburg University.
Carson, R.T., Flores, N.E. & Meade, N.F. 2001: Contingent valuation:Controversies and evidence. Environmental and Resource economics19, 173-210.
Christie, M. 2001: A comparison of alternative contingent valuationelicitation treatments for the evaluation of complex environmentalpolicy. Journal of Environmental Managment, 62, 255-269
Copenhagen County/Roskilde County: Omkostningsanalyse og kon-sekvensbeskrivelse. Bilagsrapport til indsatsplan for grundvandsbe-skyttelse i oplandet til Solhøj Kildeplads. Udarbejdet af NIRASrådgivende ingeniører. 54 ss.
Cummings, R.G. & Taylor, L.O. 1999: Unbiased Value Estimates forEnvironmental Goods: A cheap Talk Design for the ContingentValuation Method, American Economic Review, 89(3):649-665.
Centre for International Economics (CIE) 2001: review of willingnessto pay methodologies, CIE, Canberra, AU.www.ipart.nsw.giv.au/PDF/CIE.pdf

99
Danish Economic Council (Det Økonomiske Råd (DØR)) 2004: DanskØkonomi 2004. København. Available at www.dors.dk.
Danish Environmental Protection Agency (EPA) 1997: Drikkevands-udvalgets betænkning af 17. december 1997.
Danish Environmental Protection Agency (EPA) 2004: More aboutdrinking water. www.mst.dk.
DANVA 2003: Vand - effektivt og godt! Benchmarking 2003 – Danskvand og spildevandsforening. 15 ss.
Daily, G.C., Söderqvist, T., Arrow, K., Dasgupta, P., Ehrlich, P., Folke,A-M., Jansson, C., Jansson, B., Levin, O., Lubchenco, J., Mäler, K-G.,Starrett, D., Tilman, D., & Walker, B. 2000: The value of nature andthe nature of value. Science 289: pp. 395-396.
Desvousges, W.H. & Smith, V.K. 1983: Option price Estimates forWater Quality Improvements: A Contingent Valuation Study for theMonogahela river. Journal of Environmental Economics and Man-agement, 14, 248-267.
Desvousges, W.H., Johnson, F.R., Dunford, R.W., Boyle, K.J., Hudson,S.P. & Wilson, K.N. 1993: Measuring natural resource damages withcontingent valuation: tests of validity and reliability. In ContingentValuation: A critical Assessment, edited by J.A. Hausman. Amster-dam, North-Holland.
Dubgaard, A. 1996: Economic Valuation of Recreation in Mols Bjerge.AKF Forlaget SØM publikation, 11,1-230.
European Opinion Research Group 2002: Eurobarometer 58.0 Theattitudes of Europeans towards the environment. Directorate-GeneralEnvironment.
Foster, V. & Mourato, S. 1999: Elicitation format and part-whole bias:Do contingent valuation and contingent ranking give the same result?CSERGE Working paper GEC 99-17.
Foster, V. & Mourato, S. 2000: Valuing the Multiple Impacts of Pesti-cide Use in the UK: A Contingent Ranking Approach. Journal of Ag-ricultural Economics; 51(1).
Garrod, G. & Willis, K.G. 1998: Using Contingent Ranking to Estimatethe Loss of Amenity Value for Inland Waterways from Public UtilityService Structures. Environmental and Resource Economics, vol. 12(2), pp. 241-247
Garrod, G. & K.G. Willis 1999: Economic Valuation of the Environ-ment. Methods and Case Studies. Edward Elgar.
Geological Survey of Denmark and Greenland (GEUS) 2004:Groundwater monitoring 2003. www.geus.dk
Geological Survey of Denmark and Greenland (GEUS) 2003: Grund-vandsovervågning 2003. København. Danmarks og Grønlands Geo-logiske Undersøgelse.
100
http://www.geus.dk/publications/grundvandsovervaagning/g-o-2003.htm
Georgiou, S., Bateman, I., Cole, M. & Hadley, D. 2000: Contingentranking and valuation of river water quality improvements:testingfor scope sensitivity, ordering and distance decay effects. CSERGEworking paper GEC 2000-18.
Görlach, B. & Interwies, E.: 2003: Economic assessment of ground-water protection. A survey of the literature. Final report. EuropeanCommission. ENV.A.1/2002/0019, April 2003.
Hanemann, W.J. 1994: Valuing the Environment through Contingentvaluation. Journal of Economic Perspectives, 8(4), 19-43.
Hanemann, W.J., Loomis, J. & Kanninen, B. 1991: Statistical efficiencyof Double bounded Dichotomous Choice Contingent valuation.American Journal of Agricultural Economics, 73, 1255-1263.
Hanley, N., Shogren, J., White, B. 1997: Environmental Economics inTheory and Practice. Great Britain: TJ press.
Hanley, N., Macmillan, D., Wright, R., Bullock, C., Simpson, I., Parri-son, D. & Crabtree, B. 1998a: Contingent Valuation versus ChoiceExperiments: Estimating the benefits of Environmentally SensitiveAreas in Scotland. Journal of Agricultural Economics 1(15).
Hanley, N., Wright, R.E. & Adamowicz, V., 1998b: Using Choice Ex-periments to Value the Environment: Design Issues, Current Experi-ence and Future Prospects. Environmental and Resource Economics11(3-4), pp. 413-28.
Hanley, N.D., Mourato, S. & Wright, R.E. 2001: Choice ModellingApproaches: A Superior Alternative for Environmental Valuation?Journal of Economic Surveys 15(3), pp. 435-62.
Hasler, B., Jensen, J.D., Madsen, B., Andersen, M., Huusom, H. & Ja-cobsen, L.B. 2002: Scenarios for Rural Areas’ Development – an Inte-grated Modelling Approach. AKF forlaget, København.
Hasler, B. & Schou, J.S. 2004: Samfundsøkonomisk analyse af sikrin-gen af naturvenlig drift på pa. 3-arealer og naturskovarealer. Dan-marks Miljøundersøgelser. - Arbejdsrapport fra DMU 197: 90 s.(elektronisk). Available at :http://www2.dmu.dk/1_viden/2_Publikationer/3_arbrapporter/rapporter/AR197.pdf
Hasler, B., Schou, J.S. & Andersen, M.S. 2004: Forprojekt til værdisæt-ning af grundvand. Miljøstyrelsen. - Miljøprojekt 969: 67 s. (elektro-nisk). Available at:http://www.mst.dk/udgiv/publikationer/2004/87-7614-465-8/pdf/87-7614-466-6.pdf
Henriksen, H.J. & Sonnenborg, A. 2003: Ferskvandets Kredsløb. NO-VA temarapport. Available at: www.vandmodel.dk .

101
Henriksen, H.J., Rasmussen, P., Brandt, G., von Bülow, D., Nyegaard,P. & Jørgensen, F.L. 2004: Test of Bayesian belief network and stake-holder involvement. Danish MERIT case study. Danmark og Grøn-lands Geologiske Undersøgelse og Københavns Energi. Available at:http://www.geus.dk/program-areas/water/denmark/rapporter/merit_aug_04-dk.htm
Hoehn, J.P. & Randall, A. 1987: “A Satisfactory Benefit Cost Indicatorfrom Contingent Valuation”, Journal of Environment, Economics andManagement, 14, 226-47.
Hosmer, D.W. & Lemeshow, S. 2000: Applied Logistic Regression.2nd. edition. John Wiley & Sons Inc., New York.
Huber, J. & Zwerina, K. 1996: The Importance of Utility Balance inEfficient Choice Designs, Journal of Marketing Research, 33(3): 307-317.
Institut for Konjunkturanalyse (IFKA) 1999: Danskerne 2000. Rap-port, København.
Environmental Assessment Institute (IMV) 2003: BAM forurening afdrikkevandet (Pollution with BAM in the drinking water) (In Danish,abstract in English). Copenhagen.
Jacobsen, B.H., Abildtrup, J., Andersen, M., Christensen, T., Hasler,B., Hussain, Z.B., Huusom, H., Jensen, J.D., Schou, J.S. & Ørum, J.E.(2004) Omkostninger ved reduktion af landbrugets næringsstoftab tilvandmiljøet - Forarbejde til Vandmiljøplan III = Costs of ReducingNutrient Losses from Agriculture - Analyses prior to the DanishAquatic Programme III. Fødevareøkonomisk Institut. - Rapport 167:299 pp. Available at:http://www.foi.dk/Publikationer/Rapporter/rap167.pdf
Jensen, P.R., Hallam, A.B., Hauch, J., Møllgaard, E. & Petersen, O.G.,1995: En velfærdsindikator for Danmark 1970-1990. Arbejdsnotat nr.8. Rockwool Fondens Forskningsenhed, København.
Juhl, M. M. & Bjerg, B. 2004: Økonomisk vurdering af forskelligestrategier til at imødegå BAM problemer på vandværker. Rambøll.Miljøprojekt fra Miljøstyrelsen nr. 915. København, 77 ss.
Kahneman, D. & Knetsch, J.L. 1992: Valuing Public Goods: The Pur-chase of Moral Satisfaction, Journal of Environmental Economics andManagement, vol. 22, no. 1, January 1992, pp. 57-70.
Kuhfeld, W.F., Tobias, R.D. & Garratt, M. 2004: Efficient ExperimentalDesign with Marketing Research Applications. In: Kuhfeld, W. F.(2004): Marketing Research Methods in SAS. Experimental Design,Choice, Conjoint, and Graphical Techniques. January 1, 2004 edition,TS-694, SAS Institute Inc., Cary. pp. 69-90.
Københavns Amt 2003: Vejledning til indsatsplaner for beskyttelse aggrundvandet. 21 ss.
Københavns Amt/Roskilde Amt 2003: Omkostningsanalyse og kon-sekvensbeskrivelse. Bilagsrapport til indsatsplan for grundvandsbe-

102
skyttelse i oplandet til Solhøj Kildeplads. Udarbejdet af NIRASrådgivende ingeniører. 54 ss.
Legget, C. & Bocksteal, N. 2000: Evidence on the Effects of WaterQuality on Residential Land Prices”, Journal of Environmental Eco-nomics and Management, 39, 121-144.
Li, C.Z. & Mattsson, L. 1995: Discrete Choice under Preference Un-certainty: An Improved Structural Model for Contingent Valuation.Journal of Environmental Economics and Management, 28, 256-269.
Louviere, J.J. 1988: Conjoint Analysis Modelling of Stated Preferences:A review of theory, methods, recent developments and external va-lidity. Journal of Transport Economics and Policy 10, pp. 93-119.
Louviere, J.J., Hensher, D.A. & Swait, J.D. 2000: Stated Choice Meth-ods. Analysis and Application. First edition, Cambridge UniversityPress, Cambridge.
Macmillan, D.G., Duff, E. & Elston, D.A. 2001: Modelling the Non-market Environmental Costs and Benefits of Biodiversity ProjectsUsing Contingent Valuation Data. Environmental and Resource Eco-nomics 18(4), 391-410.
Miljøstyrelsen 2004: Mere om drikkevand. Miljøstyrelsens hjemmesi-de www.mst.dk/vand
Mitchell, R.C. & Carson, R.T. 1989: Using Surveys to Value PublicGoods. The Contingent valuation Method. Resources for the Future,Washington D.C.
Morrison, M. 2002: Rethinking contingent valuation: ethics versusdefensibility? International Journal of Agricultural Resources, Gov-ernance and Ecology (IJARGE), 2(1).
Murphy, J.J., Stevens, T. & Weatherhead, D. 2003: An Empirical Studyof Hypothetical Bias in Voluntary Contribution Contingent Valua-tion: Does Cheap Talk Matter? Working Paper No. 2003-2, Depart-ment of Resource Economics, University of Massachusetts Amherst.
Navrud, S. 2000: Strengths, weaknesses and policy utility of valuationtechniques and benefit transfer methods. In OECD (2001): "ValuingRural Amenities". Available at:http://www.oecd.org/tds/Rural_Amenities/
Nunes, P.A.L.D. & van den Bergh, J.C.J.M. 2001: Economic valuationof biodiversity: sense or nonsense? Ecological Economics 39, 203-22.
Olsen, S.B. & Lundhede, T. 2005: Rekreative værdier ved konverter-ing til naturnær skovdrift. En værdisætningsundersøgelse udført vha.metoden Discrete Choice Experiments. Specialerapport, AKF-forlaget.
Poe, G.L. & Bishop, R.C. 1999: Valuing the incremental benefits ofGroundwater Protection when exposure levels are known. Environ-mental and Resource Economics 13, 341-367.
103
Press, J. & Söderquist, T. 1996: On estimating the benefits of Ground-water Protection: A Contingent Valuation Study in Milan. WorkingPaper 1996/53. Fondazione Eni Enrico Mattei, Milano.
Rasmussen, S. 2004: Driftsøkonomiske tab ved pesticidfri dyrkning aflandbrugsafgrøder evd havelse kildeplads. Bilag i rapporten : Hen-riksen (ed): Test of Bayesian belief Network and stakeholder in-volvement. GEUS og Københavns E. 177 ss. + annex.
Ready, R., Navrud, S. & Dubourg, R. 2001: How do Respondents withUncertain Willingness to Pay Answer Contingent Valuation Ques-tions? External Publication #S-01/2001, NLH. [email protected]
Refsgaard, J.C., Henriksen, H.J., Nilsson, B. & Rasmussen, P. 2002:Vidensstatus for sammenhængen mellem tilstanden i grundvand ogoverfladevand. Arbejdsrapport fra Miljøstyrelsen nr. 21.110 ss.
Rowe, R.D., Schulze, W.D. & Breefle, W.S. 1996: A test for paymentcard biases. Jorunal of environmental economics and management 31,178-185.
Samnaliev, M., Stevens, T. & More, T. 2003: A Comparison of CheapTalk and Alternative Certainty Calibration Techniques in ContingentValuation, Working Paper No. 2003-11, Department of Resource Eco-nomics, University of Massachusetts Amherst.
Sandstrøm, F.M. 1996: Recreational benefits from improved waterquality. A ramdom untility Model of Swedish seaside recreation.Working paper no 121. Stockholm School of Economics.
Scarpa, R., Willis, K.G., Acutt, M. & Ferrini, S. 2004: Monte CarloSimulation Evidence on the Effect of the Status-Quo in Choice Ex-periment Models for Water Supply, Paper Presented at the ThirteenthAnnual European Association of Environmental and ResourceEconomists Conference, Budapest, June 25-28th 2004.
Schou, J.S. 2004: Samfundsøkonomisk analyse af indvindingsstrategi-er for grundvand i oplandet til Havelse å. Bilag i rapporten : Henrik-sen (ed): Test of Bayesian belief Network and stakeholder involve-ment. GEUS og Københavns E. 177 ss. + annex.
Schou, J.S., Hasler, B. & Kaltoft, P. 2002: What does perception of un-certainty mean for survey design? Paper for the Conference on Riskand Uncertainty in Environmental and Resource Economics. Topic g.environmental valuation problems and risk assessment. June 5-6,Wageningen University, The Netherlands.
Statistics Denmark 2003: Miljø og Energi, 2003:14
Stevens, T.H., Belkner, R., Dennis, D., Kittredge, D. & Willis, C. 2000:Comparisons of Contingent valuation and Conjoint Analysis in Eco-system Management. Ecological Economics, 32, 63-74.
Stenger, A. & Willinger, M. 1998: Preservation value for groundwaterquality in a large aquifer: a contingent valuation study of the Alsatianaquifer. Journal of Environmental Management, 53,99. 177-193.
104
Swait, J. & Adamowicz, W. 1997: Choice Task Complexity and Deci-sion Strategy Selection, Staff Paper, Department of Rural Economy,University of Alberta.
Soutokorva, Å. 2000: The value of improved water quality – a randomutility model of recreation in the Stockholm Archipelago. BeijerDiscussion paper series no 135.Stockholm.
Søndergaard, M., Jeppesen, E., Jensen, J.P., Bradschaw, E., Skovgaard,H. & Grünfeld, S. 2003: Vandrammedirektivet og danske søer – søty-per, referencetilstand og økologiske kvalitetsklasser. faglig rapportfra DMU nr. 475, Danmarks Miljøundersøgelser. 140 ss.
Terawaki, T., Kuriyama, K. & Yoshida, K. 2003: The Importance ofExcluding Unrealistic Alternatives in Choice Experiment Designs,Discussion Paper No. 03002, College of Economics, Ritsumeikan Uni-versity.
Train, K.E. 2003: Discrete Choice methods with Simulation.Cambridge. 334 pp.
Vejle County 2001: Regionplan 2001-2013, Vejle Amt.
Vinggaard, A.M., Bonefeld-Jørgensen, E., Andersen, H.R., Hass, U.,Nellemann, C., Birkhøj, M., Jarfelt, K., Dalgaard, M., Lam, H.R. &Jacobsen, H. 2004: Hormonforstyrrende effekter af kombinationer afpesticider Bekæmpelsesmiddelforskning fra Miljøstyrelsen.
Watson, V., Phimister, E. & Ryan, M. 2004: Testing the Assumption ofCompensatory Decision-Making in Discrete Choice Experiments: AnApplication to the Decommissioning of Off-Shore Oil Installations,Paper Prepared for the Thirteenth Annual European Association ofEnvironmental and Resource Economists Conference, Budapest, June25-28th 2004.
Wier, M. 2004: Moderne økologi er afhængig af stærke ø-mærker.Føjo Nyt, Nyhedsbrev fra Forskningscenter for Økologisk Jordbrug ·Oktober 2004 nr. 5
Østergaard, H.S., Jensen, J.E., Jensen, N.B. & Pedersen, L.V. 2004: Re-duceret brug af kvælstof og pesticider. Økonomisk og miljømæssigeffekt. Arbejdsrapport fra Miljøstyrelsen nr. 3. 22 ss.
Aakerlund, N.F. 2000: Contingent Ranking studie af danskernes præ-ferencer for skovkarakteristika. AKF-forlaget, København, 36.

105
Annex 1
Experimental design – general introduction toexperimental design theory and concepts
As experimental design is very important to produce good resultsfrom Choice experiment surveys, an annex is included here explain-ing important features of the design of these surveys.
An important element of conducting a CE study is to identify an ap-propriate experimental design for the study. Thus, the extent towhich the desired effects can be estimated, along with the degree ofaccuracy of the obtained estimated, is contingent upon the propertiesof the experimental design used to elicit respondents preferences forthe good subjected to valuation.
Full vs. fractional factorial designsIn terms of design terminology, a basic distinction can be made be-tween full factorial designs and fractional factorial designs, where theformer refers to designs consisting of all possible alternatives that canbe constructed from different combinations of attribute levels(Carlsson and Martinsson, 2003:283). The product of the levels of theattributes gives the size of the factorial design. Using a design with 2attributes with 3 levels each and 2 attributes with 4 levels as an ex-ample, the resulting full factorial design will consist of (3*3*4*4=144)144 alternatives (Louviere et al., 2000). A fractional factorial design,on the other hand, only contains a subset – i.e. a fraction – of the al-ternatives comprising the full factorial, and the specific subset is se-lected so that the effects of interest can be estimated with reasonablestatistical efficiency (Louviere et al., 2000:90).
In relation to determining which sort of design to use, it may be use-ful to distinguish between main and interaction effects, where theformer specifies the isolated effect of an attribute on utility/the prob-ability of choice and the latter refers to effects caused by interactionsbetween two or more attributes (Kuhfeld, 2004). To illustrate the dif-ference, the effect of e.g. price in a main effects model is constantacross alternatives, whereas the effect of price in a model with inter-actions, e.g. between price and quality, will vary across alternativescharacterised by different quality levels.
Using a full factorial design, all main and interaction effects are un-correlated and therefore estimable (Kuhfeld et al., 2004). Despite thisdesirable property, the size of full factorial designs imply that it, ex-cept in relation to very simple experiments (i.e. experiments with fewattributes with few levels), will often be impractical to use full facto-rial designs. In practice, it is therefore common to use fractional facto-
12 A more formal definition of a main effect is: “a main effect is the difference in themeans of each level of a particular attribute and the overall or “grand mean”, suchthat the difference sum to zero” (Louviere et al., 2000:86).

106
rial designs which are smaller in size (Kuhfeld, 2004:46). Movingfrom a full to a fractional design is associated with loss of statisticalinformation and implies that different effects may become con-founded (Kuhfeld et al., 2004; Louviere et al., 2000). When effects areconfounded it implies that they cannot be distinguished from eachother anymore. For the purpose of illustration, assume that the effectof e.g. the price attribute has become confounded with the effectarising from a two-way interaction between e.g. a quality attributeand a colour attribute. Assume also that the interaction effect is, infact, significant. In this case, using a fractional factorial design, thatdoes not allow the interaction effect between quality and colour to beestimated, entails that the parameter estimate for the price attributewill be biased due to its being confounded with the omitted, thoughsignificant, effect of the quality-colour interaction.
It is important to acknowledge that all fractional designs are based onassumptions of non-significance of some interactions (either two-wayor higher-order interactions) (Louviere et al., 2000:90). That is, whenusing fractional factorial designs to estimate lower order effects, suchas main effects or two-way interactions, higher order effects are im-plicitly assumed to be either zero or negligible (Kuhfeld, 2004:46).However, the more specific degree and structure of confounding de-pend on the size of the fractional design relative to that of the fulldesign and the applied reduction strategy. The goal, therefore, is tofind a design that has a manageable size, while it also ensures that theeffects to be estimated are either non-confounded or only confoundedwith effects assumed to be insignificant.
Results from previous studies working with linear models suggestthat main effects typically account for 70 to 90 per cent of explainedvariances, whereas two-way interactions typically account for 5 to 15per cent, and higher-order interactions account for the remaining ex-plained variance (Louviere et al., 2000:94). This may be taken to indi-cate that experimental designs should ideally encompass at least two-way interactions, as they may account for a significant proportion ofthe explained variance. However, it also suggests that a viable designstrategy, which will make further reductions in design size possible,may be to use a main effect design, where main effects either are non-confounded or only confounded with three-way or higher order in-teractions. In practice, it may often be the case that the choice of de-sign size is only partly based on considerations related to estimabilityand confounding considerations. Thus, in practice, concerns relatedto sample size and the number of alternatives/choice sets that eachrespondent can be expected to handle are likely to play an equallyimportant role (Kuhfeld et al., 2004:80).
Efficiency criteriaAs it is peoples’ choices between the alternatives included in differentchoice sets that creates the basis for deriving value estimates, it is im-portant to combine attribute levels into alternatives and choice sets ina way that maximises the efficiency of the design, i.e. maximises theamount of extractable information (Carlsson and Martinsson,2003:290). One of the most commonly used measures of design effi-ciency is that of D-efficiency (Kuhfeld et al., 2004: 49). The relativestatistical efficiency of different experimental designs depends on the

107
extent to which the following four criteria are satisfied; level balance,orthogonality, minimal overlap and utility balance. The former twocriteria refer to the design as such – i.e. to the composition of the sub-set of the full factorial comprising the fractional factorial design – andthe latter two criteria refer to the way that alternatives are combinedinto choice sets. If all four criteria are satisfied for a given design, thedesign has a maximum D-efficiency (Carlsson and Martinsson,,2003:284). Below, each of the four criteria is defined and their poten-tial implications in relation to which design to choose are discussed.
Level balanceThe level balance criterion requires that the levels of each attributeoccur with equal frequency in the design (Carlsson and Martinsson,2003:284). For e.g. a 4 level attribute level balance implies that each ofthe four levels should be represented in precisely one fourth of thealternatives (Huber and Zwerina, 1996:309). If this criterion is meet itis ensured that the intercept is orthogonal to each effect (Kuhfeld,2004:46).
OrthogonalityIn an orthogonal design the levels of each attribute varies independ-ently of the levels of all other attributes. Using a linear design thisproperty ensures that the estimated effects are uncorrelated (Carlssonand Martinsson, 2004:284), and that the obtained parameter estimatesare not influenced by the properties of the design. More specifically,the criterion of orthogonality specifies that every pair of levels eithershould occur equally often across all pairs of attributes or with pro-portional frequencies (Kuhfeld, 2004:46). That is, combinations ofdifferent levels across attributes should occur with equal or propor-tional frequencies. If the criteria of level balance and orthogonalityare to be met simultaneously, the frequencies have to be equal.
In relation to the practical application of the orthogonality criterion, itmay be noted that the criteria of level balance and orthogonality areoften conflicting, implying that trade-offs between level balance andorthogonality have to be made (Huber and Zwerina, 1996:309). An-other potential problem with orthogonal designs is that they arelikely to contain implausible/unrealistic alternatives – i.e. alternativeswhere the levels of the attributes move in directions that would becounterintuitive to most respondents (Bennet and Adamowicz, 2001).The presence of such alternatives may negatively affect efficiency ofthe study as they may either serve to discourage people from partici-pating or to provide “silly answers to silly questions”. Based on this,it is often recommended that implausible/unrealistic alternatives beremoved from the design . Doing so, however, may just introducenew inefficiencies since the exclusion of alternatives will change theconfounding structure of the design and is likely to introduce corre-lation between attributes (Bennet and Adamowicz, 2001; Kuhfeld etal., 2004). In practice, it will therefore often be necessary to make a 13 Bennet and Adamowicz (2001) also advances the possibility that explaining torespondents why alternatives can appear counterintuitive may mitigate problemscaused by the presence of implausible/unrealistic alternatives. At first glance, thissuggestion sounds quite appealing, but its actual operability appears questionableonce the presumably lengthy argumentation necessary for providing acceptableexplanations is considered.

108
trade-off between the degree of orthogonality and the degree of real-ism. In this context, Kuhfeld et al., 2004:70) note that: “Orthogonalityis not the primary goal in design creation. It is a secondary goal asso-ciated with the primary goal of minimising the variances of the pa-rameter estimates”. Thus, it is emphasised that care should be takennot to put undue emphasis on orthogonality even though it repre-sents a much more tangible efficiency criteria than that related to en-suring the plausibility/realism of the alternatives.
Minimal overlapThe criterion of minimal overlap specifies that the probability that anattribute level repeats itself in a choice set should be, if not zero, thenat least as small as possible (Carlsson and Martinsson, 2003:284;Huber and Zwerina, 1996:309). Thus, if the alternatives in each choiceset have non-overlapping attribute levels for all attributes the amountof information to be extracted from each choice set is maximised.
Utility balanceUtility balance serves to ensure that the choice sets actually inducerespondents to make trade-offs, and it requires that the utility of al-ternatives within a choice set is equal (Carlsson and Martinsson,2003:284). That is, the more similar the alternatives in a choice set arein terms of the level of utility that they give rise to, the greater theamount of information to be extracted from observations of respon-dents’ choices.
In contrast to the criteria of level balance, orthogonality and minimaloverlap, which are fairly simple, if not to achieve, than at least to as-sess, then the criterion of utility balance is difficult to satisfy.Achieving utility balance requires prior information on the parame-ters of the choice model (Carlsson and Martinsson, 2003; Huber andZwerina, 1996). Such prior information may be obtained either fromthe literature, focus groups, pilot studies or the study itself, if a se-quential design approach is adopted (Carlsson and Martinsson,2003:290).
When combining alternatives into choice sets, some alternatives mayturn out to be dominated while others will be dominant. Dominatedalternatives are alternatives that are combined with other alternativesthat are universally superior in their experimental design-driven at-tribute levels (Bennet and Adamowicz, 2001:58), and vice versa fordominant alternatives. Choice sets containing dominated/dominantalternatives basically provide no information, while they increase therisk that respondents will find the exercise ridiculous and, therefore,lose patience or decide not to participate. Designs containing choicesets with either dominated or dominant alternatives will clearly failto satisfy the utility balance criterion. Hence, obtaining a utility bal-anced design requires that all dominated/dominant alternatives beexcluded from the design. However, deciding which alternativesshould be excluded may prove difficult since the question of whatconstitutes a dominated/dominant alternative often turns out to befar from clear-cut (Bennet and Adamowicz, 2001:58). That is, espe-cially when dealing with qualitative attributes, the utility associatedwith different attributes/attribute levels is likely to be a matter of

109
taste, implying that it is difficult – if not impossible – to determine ona more general level what is good and what is bad.
Utility balanced designs may be problematic in two respects. Thus, asdiscussed in relation to the exclusion of implausible/unrealistic alter-natives, the elimination of certain alternatives/attribute combinations(in this case dominated/dominant alternatives) implies that the effi-ciency of the design may drop and that correlation between attributesmay be introduced (Kuhfeld et al., 2004). Moreover, utility balancemay cause problems due to the inherent increase in task complexityassociated with choosing between more or less utility balanced alter-natives as opposed to non-balanced alternatives. It is expected that acertain degree of utility balance will be beneficial, as it may increasetask realism, make completion of the task seem worthwhile and pro-vide an incentive for providing valid and reliable answers. However,a situation could also arise where the resulting task complexity is sogreat that it causes an increase in the variance of the error component,which surpasses the actual gain in terms of increased information. Inthis context, it may be noted that if minimal overlap is ensured si-multaneously with utility balance, the complexity of the choice taskmay indeed be significant as several changes, which jointly are moreor less utility neutral, need to be considered simultaneously.
In terms of how the utility balance criterion should be applied inpractice, a study by Carlsson and Martinsson (2003) along with a pa-per by Huber and Zwerina (1996) recommend that the utility balancecriterion be applied, as it is found to have the potential to signifi-cantly increase design efficiency. However, it should be recognisedthat, in many cases, it may not be possible to apply the criterion inpractice due to lack of prior information on the relevant parameters.A less systematic approach is, therefore, likely to be more operational,and in this context it may be noted that there seems to be consensusthroughout the literature that choice sets containing clearly domi-nated/dominant alternatives should be avoided. Following this ap-proach will no doubt increase the utility balance of the design, whileprobably not increasing task complexity and correlation between at-tributes unduly.
Constructing an experimental design –different design optionsIn practice, experimental designs are usually created by using soft-ware programmes containing different procedures for constructingexperimental designs. In this section, three different design options,and the procedures in the software programme SAS by which theymay be implemented, will briefly be introduced. It may be noted thatthe different options vary in relation to the emphasis put on the dif-ferent efficiency criteria set out in the previous section.
The linear design approachThe linear design approach is based on the assumption that a design,which is efficient for a linear model, also will be a good design for themodels used in discrete choice studies, where it is aimed to measure
14 In this context it may also be noted that the criteria of orthogonality and utilitybalance are likely to be conflicting.

110
the utility of each alternative and the contributions of each attributeto that utility (Kuhfeld, 2004:57). By doing so, independence andnormality, which are unlikely to apply in a discrete choice setting, areimplicitly assumed Kuhfeld, 2004:57). Linear design efficiency em-phasises level balance and orthogonality whereas the criteria ofminimal overlap and utility balance are left unattended. Therefore,the efficiency value pertaining to the linear design does not corre-spond to the efficiency of the design when used in a choice experi-mental context. Despite these shortcomings, the linear design ap-proach has been used quite successfully for many years Kuhfeld,2004:57), and may be regarded as a both good and safe strategy. Thus,the resulting design is orthogonal or nearly orthogonal, and containsenough choice sets and collects the right information so that verycomplex models can be estimated (Kuhfeld, 2004:58).
In practice, the linear design approach can be implemented by usingthe %MktEx macro in SAS, which creates the fractional factorial de-sign and the choice sets simultaneously. Unrealistic and or domi-nant/dominated alternatives cannot be excluded from the candidateset (i.e. the full factorial design) prior to the creation of the design,implying that such alternatives have to be removed from the designoutputted by the %MktEx macro. If the design contains too manychoice sets for each respondent to evaluate, the %MktBlock macro canbe used to divide the choice sets into blocks containing the desirednumber of choice sets.
The cyclical design approachAn orthogonal design, consisting of a number of alternatives equal tothe desired number of choice sets in the final design, is used as thebasis for the creation of a cyclical design. The alternatives containedin this initial design will represent the first alternative in each choiceset of the final cyclical design. Subsequent alternatives are con-structed by adding cyclically generated alternatives to each choice set(Huber and Zwerina, 1996:310). That is, the attribute levels of the newalternatives are constructed by adding one level to the level of theprevious alternative; if the level of one of the attributes of the firstalternative is at its highest level, the cycle starts all over from the low-est level. In terms of efficiency, designs created through application ofthe cyclical design approach have desirable properties as they satisfythe criteria of level balance, orthogonality and minimal overlap(Carlsson and Martinsson, 2003:285). The utility balance criterion,however, is not met.
Using SAS, cyclical designs can be generated by using “proc plan” tocreate the full factorial design and “proc optex” to create the frac-tional factorial design from which the cyclical design is created. Procoptex can also be used to divide the design into blocks of choice setsif it is considered necessary to do so. Subsequently, the cyclical as-signment of attribute levels to the new alternatives in each choice setis conducted in a data step.
The choice design approach - utility balanced designsThe dual of maximising the statistical efficiency of a choice design isthat of minimising the variances of the parameter estimates (Kuhfeld,2004:53). Thus, the goal of experimental design is to find a fractional

111
factorial design that is composed of design points, i.e. alternatives,which minimise the variance of the parameter estimates. In linearmodels where the variances of parameter estimates are proportionalto the information matrix, this strategy can be pursued without priorknowledge about the size and sign of the parameter estimates. Forchoice models, however, where the variances of parameter estimatesis a function of the parameter estimates themselves, the strategy can-not be pursued unless the parameter estimates are known (in whichcase, it could be argued that the experiment is redundant). Conse-quently, designs for choice experiment are most often created usingefficiency criteria pertaining to linear models (Kuhfeld, 2004:57).However, procedures do exist for constructing choice designs basedon efficiency criteria pertaining specifically to choice models.
Using the choice design approach, it becomes possible explicitly toincorporate the utility balance criterion in the design process. Morespecifically, this happens through the role played by the parametersof the model in relation to minimising variance, and in turn, maxi-mising efficiency. However, two factors, which have already beendiscussed, may limit the number of cases where the approach will berelevant. One, it requires prior knowledge on the parameters of themodel, which may be missing in many cases. Two, emphasising util-ity balance may negatively affect the design as it may conflict withthe criteria of level balance and orthogonality, just as it may implythat task complexity becomes too high. In terms of the former, astudy by Carlsson and Martinsson (2003), where simulation experi-ments are used to evaluate different design strategies, it is found thatthere may be significant efficiency gains associated with adopting achoice design approach, when information on parameters are avail-able. Moreover, it is found that the approach may remain superioreven if the available information on parameters is biased; whetherthis will apply to a given case, however, depends among other thingson the extent of the bias. Thus, the study also finds that adopting thechoice design approach and assuming that all parameters are zero –as might be the most reasonable assumption in cases where no spe-cific prior information is available – may result in designs that per-form worse in terms of efficiency than orthogonal or cyclical designs.Prior to favouring the choice design approach over other approaches,the potential benefits arising from introducing the utility balance cri-terion in the design process should, therefore, be weighed carefullyagainst the potential cost.
In SAS, the %ChoicEff macro, which creates the fractional factorialand assign the alternatives into choice sets in the same step, may beused to generate utility balanced designs. Prior to the creation of thefinal design, unrealistic and or dominant/dominated alternatives canbe excluded if a candidate set different from the full factorial (i.e. onlycontaining the desired alternatives) is created in a data step and sub-sequently inputted to the %ChoicEff macro. Subsequently, if the de-sign contains too many choice sets for each respondent to evaluate,the %MktBlock macro can be used to divide the choice sets intoblocks containing the desired number of choice sets.

112
Annex 2
Danish Questionnaire
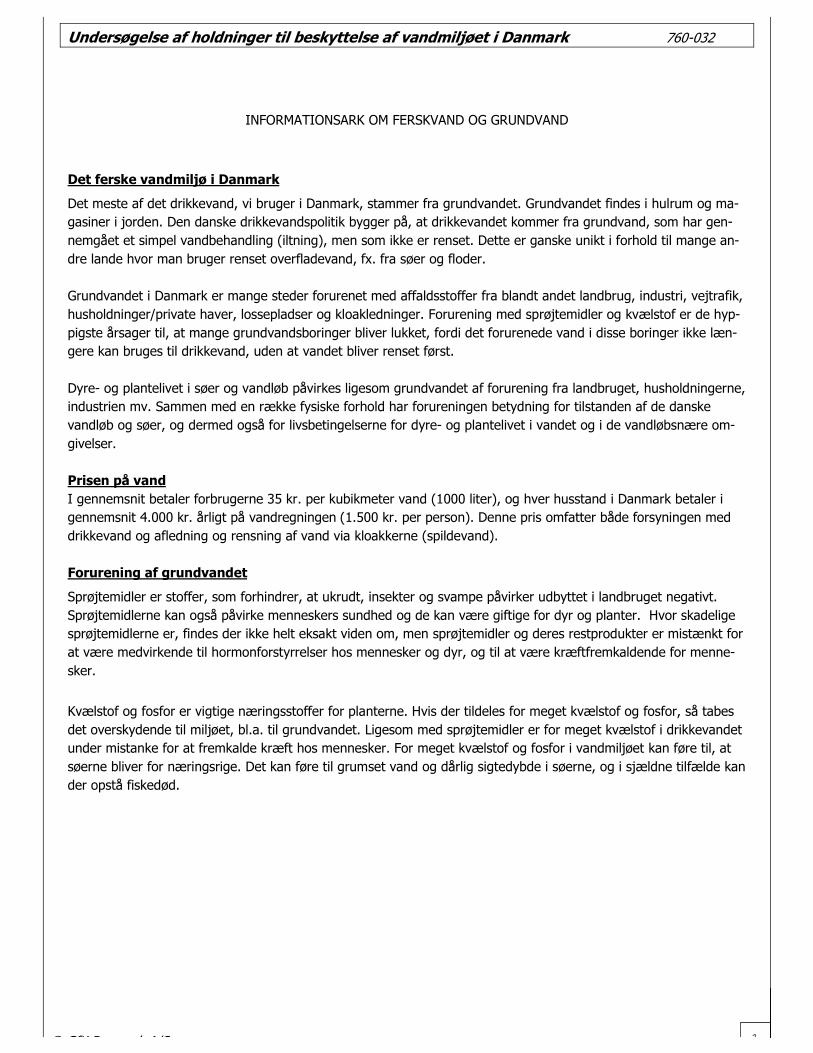
© GfK D k A/S 1
Undersøgelse af holdninger til beskyttelse af vandmiljøet i Danmark 760-032
INFORMATIONSARK OM FERSKVAND OG GRUNDVAND
Det ferske vandmiljø i Danmark
Det meste af det drikkevand, vi bruger i Danmark, stammer fra grundvandet. Grundvandet findes i hulrum og ma-gasiner i jorden. Den danske drikkevandspolitik bygger på, at drikkevandet kommer fra grundvand, som har gen-nemgået et simpel vandbehandling (iltning), men som ikke er renset. Dette er ganske unikt i forhold til mange an-dre lande hvor man bruger renset overfladevand, fx. fra søer og floder.
Grundvandet i Danmark er mange steder forurenet med affaldsstoffer fra blandt andet landbrug, industri, vejtrafik,husholdninger/private haver, lossepladser og kloakledninger. Forurening med sprøjtemidler og kvælstof er de hyp-pigste årsager til, at mange grundvandsboringer bliver lukket, fordi det forurenede vand i disse boringer ikke læn-gere kan bruges til drikkevand, uden at vandet bliver renset først.
Dyre- og plantelivet i søer og vandløb påvirkes ligesom grundvandet af forurening fra landbruget, husholdningerne,industrien mv. Sammen med en række fysiske forhold har forureningen betydning for tilstanden af de danskevandløb og søer, og dermed også for livsbetingelserne for dyre- og plantelivet i vandet og i de vandløbsnære om-givelser.
Prisen på vandI gennemsnit betaler forbrugerne 35 kr. per kubikmeter vand (1000 liter), og hver husstand i Danmark betaler igennemsnit 4.000 kr. årligt på vandregningen (1.500 kr. per person). Denne pris omfatter både forsyningen meddrikkevand og afledning og rensning af vand via kloakkerne (spildevand).
Forurening af grundvandet
Sprøjtemidler er stoffer, som forhindrer, at ukrudt, insekter og svampe påvirker udbyttet i landbruget negativt.Sprøjtemidlerne kan også påvirke menneskers sundhed og de kan være giftige for dyr og planter. Hvor skadeligesprøjtemidlerne er, findes der ikke helt eksakt viden om, men sprøjtemidler og deres restprodukter er mistænkt forat være medvirkende til hormonforstyrrelser hos mennesker og dyr, og til at være kræftfremkaldende for menne-sker.
Kvælstof og fosfor er vigtige næringsstoffer for planterne. Hvis der tildeles for meget kvælstof og fosfor, så tabesdet overskydende til miljøet, bl.a. til grundvandet. Ligesom med sprøjtemidler er for meget kvælstof i drikkevandetunder mistanke for at fremkalde kræft hos mennesker. For meget kvælstof og fosfor i vandmiljøet kan føre til, atsøerne bliver for næringsrige. Det kan føre til grumset vand og dårlig sigtedybde i søerne, og i sjældne tilfælde kander opstå fiskedød.

© GfK D k A/S 2
Skemaversion: CVM ........! 4 (10)
Undersøgelse af holdninger til beskyttelse af vandmiljøet i Danmark 760-032
Det medfølgende spørgeskema udgør en del af et forskningsprojekt vedrørende den fremtidige forvaltning af detferske vandmiljø i Danmark. Projektet udføres af forskere fra Danmarks Miljøundersøgelser.
Det ferske vandmiljø består af grundvandet, søer og vandløb. Vandmiljøet kan beskyttes og forvaltes på forskelligemåder, der har forskellig betydning for kvaliteten af grundvandet og drikkevandet, og for vilkårene for dyre- ogplanteliv i vandløb og søer. Formålet med dette spørgeskema er, at høre dine holdninger til, hvordan det ferskevandmiljø bør forvaltes fremover.
Vi vil bede dig om at svare i overensstemmelse med dine personlige synspunkter. Ingen svar er således mere rigti-ge end andre - vi er interesserede i din mening. Dine svar vil blive behandlet fortroligt og vil udelukkende blivebrugt til videnskabeligt formål. Spørgeskemaet er i alt udsendt til 1.500 personer, og det er vigtigt for undersøgel-sens resultater, at så mange som muligt svarer.
Vi har vedlagt et informationsark om ferskvand og grundvand, og vi vil bede dig om at læse dette inden besvarel-sen af spørgeskemaet.
På forhånd tak for hjælpen og god fornøjelse med besvarelsen.

© GfK D k A/S 3
.Spørgsmål 1: Holdninger til miljøet .
1.1 Nedenfor er en række udsagn om det danske vandmiljø. På en skala fra 1-5 bedes du angive, hvor enig elleruenig du er i udsagnene. Du kan benytte tallene imellem til at graduere dit svar- Sæt kun ét kryds i hver linie
Helt uenig Hverken/eller Helt enig Ved ikke .K01.
Beskyttelsen af vandmiljøeter en af de vigtigste opgaverindenfor miljøpolitikken...............� 1 � 2 � 3 � 4 � 5 � 6 (11)
Vandet i vandhanen behøverikke at være drikkevand.Drikkevand kan købes på flaske......� 1 � 2 � 3 � 4 � 5 � 6 (12)
Forurening med sprøjtemidlerer en væsentlig trussel modkvaliteten af drikkevandet iDanmark.....................................� 1 � 2 � 3 � 4 � 5 � 6 (13)
Forurening med kvælstof er envæsentlig trussel mod kvali-teten af drikkevandet i Danmark.....� 1 � 2 � 3 � 4 � 5 � 6 (14)
Drikkevand behøver ikkekomme fra urenset grundvand;renset vand er lige så godt ............� 1 � 2 � 3 � 4 � 5 � 6 (15)
Vandløb og søer bør have et rigtog naturligt dyre- og planteliv.........� 1 � 2 � 3 � 4 � 5 � 6 (16)
Drikkevandet er rent i Danmark......� 1 � 2 � 3 � 4 � 5 � 6 (17)
Problemerne med forurening afvandmiljøet er overdrevne .............� 1 � 2 � 3 � 4 � 5 � 6 (18)
Myndighederne bør brugeflere ressourcer på beskyttelseaf vandmiljøet end de gør nu .........� 1 � 2 � 3 � 4 � 5 � 6 (19)
. Spørgsmål 2: Dit vandforbrug .
2.1 Køber du eller nogen i din husholdning nogensinde flaskevand (kildevand mv. uden kulsyre) som alternativ tildrikkevand fra vandhanen?- Kun et svar
Altid.....................................................................................................................................� 1 (20)
Ofte.....................................................................................................................................� 2
Sjældent .............................................................................................................................� 3
Aldrig..........................................................................................→ Gå til spm. 2.3............� 4
Ved ikke...................................................................................... → Gå til spm. 2.3............� 5
2.2 Hvis/når du eller nogen i din husstand køber flaskevand, hvad er årsagen/årsagerne så?- Gerne flere svar
Det smager bedre.................................................................................................................� 1 (21-27)
Det er ikke forurenet ............................................................................................................� 2
Det er sundere på grund af mineraler mv...............................................................................� 3
At det er i en praktisk emballage ...........................................................................................� 4
At jeg ikke har adgang til postevand (fx. når jeg er ude at handle) ..........................................� 5
Andet...................................................................................................................................� 6
Ved ikke...............................................................................................................................� 7
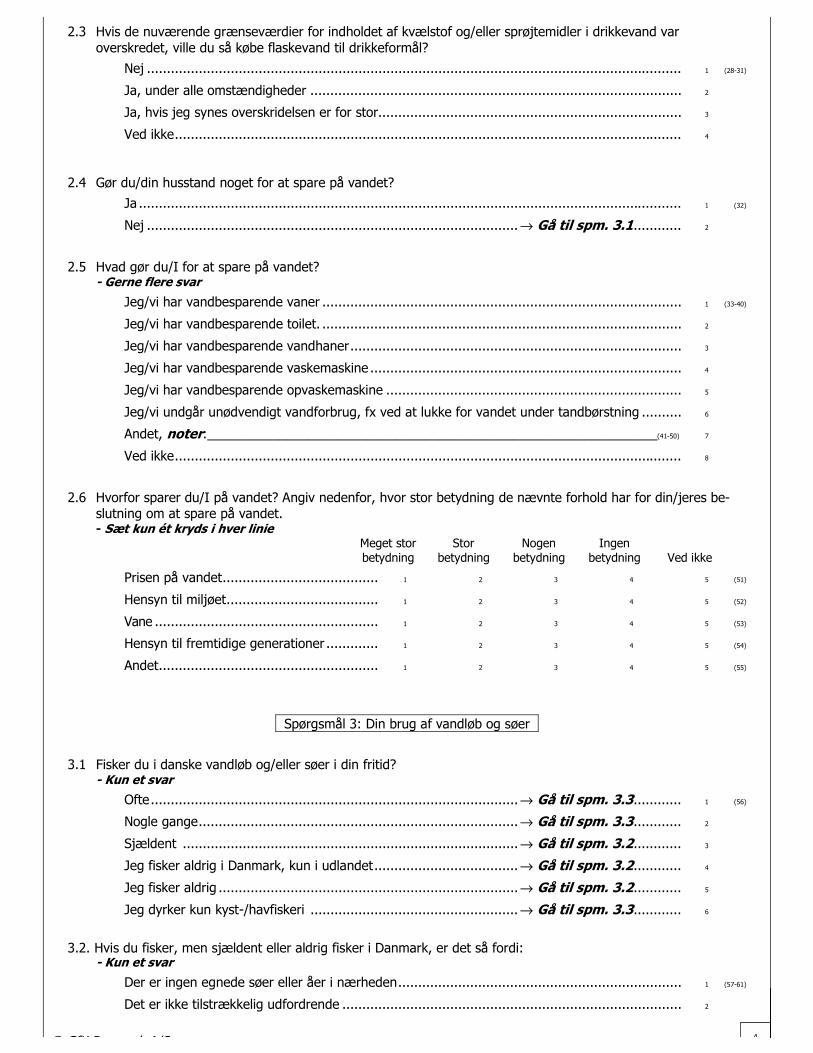
© GfK D k A/S 4
2.3 Hvis de nuværende grænseværdier for indholdet af kvælstof og/eller sprøjtemidler i drikkevand varoverskredet, ville du så købe flaskevand til drikkeformål?
Nej ......................................................................................................................................� 1 (28-31)
Ja, under alle omstændigheder .............................................................................................� 2
Ja, hvis jeg synes overskridelsen er for stor............................................................................� 3
Ved ikke...............................................................................................................................� 4
2.4 Gør du/din husstand noget for at spare på vandet?
Ja ........................................................................................................................................� 1 (32)
Nej ............................................................................................. → Gå til spm. 3.1............� 2
2.5 Hvad gør du/I for at spare på vandet?- Gerne flere svar
Jeg/vi har vandbesparende vaner ..........................................................................................� 1 (33-40)
Jeg/vi har vandbesparende toilet. ..........................................................................................� 2
Jeg/vi har vandbesparende vandhaner...................................................................................� 3
Jeg/vi har vandbesparende vaskemaskine ..............................................................................� 4
Jeg/vi har vandbesparende opvaskemaskine ..........................................................................� 5
Jeg/vi undgår unødvendigt vandforbrug, fx ved at lukke for vandet under tandbørstning ..........� 6
Andet, noter:______________________________________________________________(41-50)� 7
Ved ikke...............................................................................................................................� 8
2.6 Hvorfor sparer du/I på vandet? Angiv nedenfor, hvor stor betydning de nævnte forhold har for din/jeres be-slutning om at spare på vandet.- Sæt kun ét kryds i hver linie
Meget stor Stor Nogen Ingenbetydning betydning betydning betydning Ved ikke
Prisen på vandet.......................................� 1 � 2 � 3 � 4 � 5 (51)
Hensyn til miljøet......................................� 1 � 2 � 3 � 4 � 5 (52)
Vane ........................................................� 1 � 2 � 3 � 4 � 5 (53)
Hensyn til fremtidige generationer .............� 1 � 2 � 3 � 4 � 5 (54)
Andet.......................................................� 1 � 2 � 3 � 4 � 5 (55)
. Spørgsmål 3: Din brug af vandløb og søer .
3.1 Fisker du i danske vandløb og/eller søer i din fritid?- Kun et svar
Ofte............................................................................................→ Gå til spm. 3.3............� 1 (56)
Nogle gange................................................................................→ Gå til spm. 3.3............� 2
Sjældent ....................................................................................→ Gå til spm. 3.2............� 3
Jeg fisker aldrig i Danmark, kun i udlandet.................................... → Gå til spm. 3.2............� 4
Jeg fisker aldrig ...........................................................................→ Gå til spm. 3.2............� 5
Jeg dyrker kun kyst-/havfiskeri .................................................... → Gå til spm. 3.3............� 6
3.2. Hvis du fisker, men sjældent eller aldrig fisker i Danmark, er det så fordi:- Kun et svar
Der er ingen egnede søer eller åer i nærheden.......................................................................� 1 (57-61)
Det er ikke tilstrækkelig udfordrende .....................................................................................� 2

© GfK D k A/S 5
Jeg har ikke tid til at fiske så ofte ..........................................................................................� 3
Jeg interesserer mig ikke for at fiske......................................................................................� 4
Andet ..................................................................................................................................� 5

© GfK D k A/S 6
3.3 Bader du i danske vandløb og/eller søer?- Kun et svar
Ofte............................................................................................→ Gå til spm. 4.1............� 1 (62)
Nogle gange................................................................................→ Gå til spm. 4.1............� 2
Sjældent ....................................................................................→ Gå til spm. 3.4............� 3
Jeg bader aldrig i ferskvand ......................................................... → Gå til spm. 3.4............� 4
Jeg bader ikke.............................................................................→ Gå til spm. 3.4............� 5
3.4. Hvis du sjældent eller aldrig bader i ferskvand, er det så fordi:- Kun et svar
Der er ingen egnede søer eller åer i nærheden.......................................................................� 1 (63-67)
Vandkvaliteten er for dårlig ...................................................................................................� 2
Bundforholdene er dårlige .....................................................................................................� 3
Jeg har ikke tid til at bade oftere ...........................................................................................� 4
Andet ..................................................................................................................................� 5
. Spørgsmål 4: Din vandforsyning .
4.1 Hvor kommer husstandens drikkevand fra?- Kun et svar
Kommunalt vandforsyningsanlæg ..........................................................................................� 1 (68)
Privat, alment anlæg.............................................................................................................� 2
Privat boring .......................................................................................................................� 3
Andet...................................................................................................................................� 4
Ved ikke...............................................................................................................................� 5
4.2 Ved du ca., hvor mange kubikmeter (1.000 liter) vand din husholdning bruger årligt?
Ja .......................................................................................................................................� 1 (69)
Nej ......................................................................................................................................� 2
4.3 Hvis ja, angiv da det årlige forbrug i kubikmeter her:............................................... (70-73)
4.4 Ved du, hvor stor din husstands årlige vandregning er?- Kun et svar
Ja, den er mindre end 1500 kr...............................................................................................� 1 (74)
Ja, den er mellem 1500 og 4000 kr........................................................................................� 2
Ja, den er mellem 4000 og 6000 kr........................................................................................� 3
Ja, den er over 6000 kr.........................................................................................................� 4
Nej, jeg ved det ikke/jeg kan ikke huske det ..........................................................................� 5
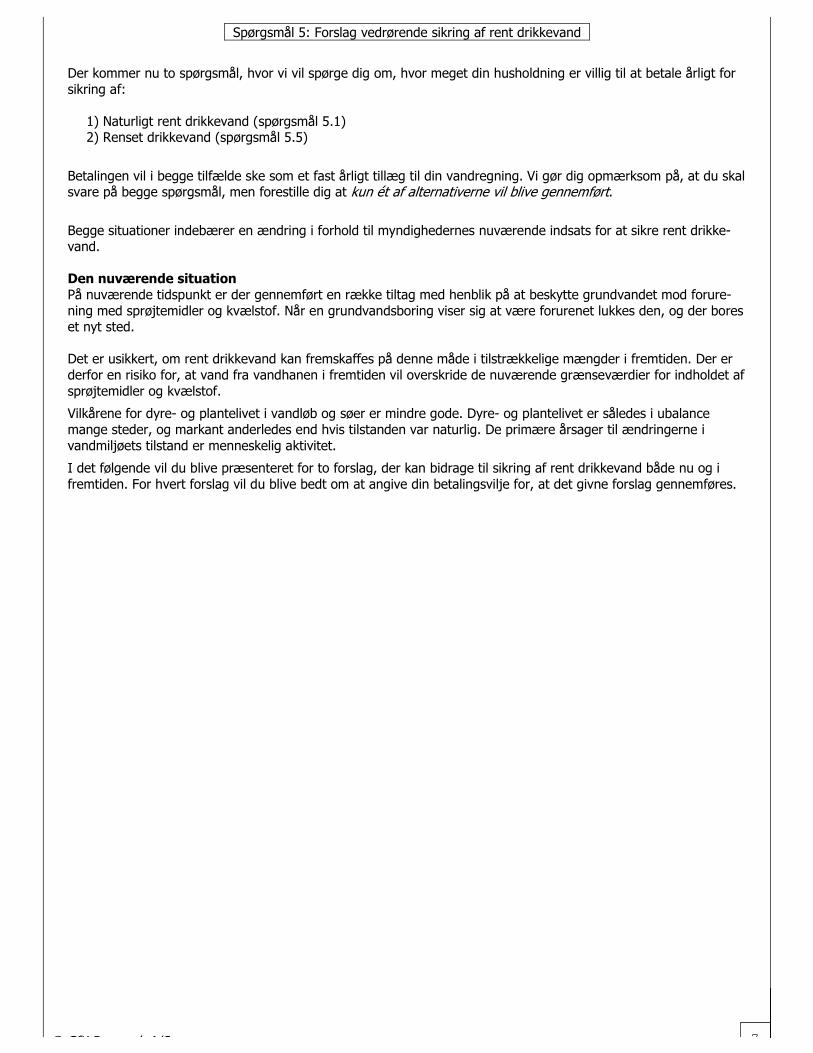
© GfK D k A/S 7
. Spørgsmål 5: Forslag vedrørende sikring af rent drikkevand .
Der kommer nu to spørgsmål, hvor vi vil spørge dig om, hvor meget din husholdning er villig til at betale årligt forsikring af:
1) Naturligt rent drikkevand (spørgsmål 5.1)2) Renset drikkevand (spørgsmål 5.5)
Betalingen vil i begge tilfælde ske som et fast årligt tillæg til din vandregning. Vi gør dig opmærksom på, at du skalsvare på begge spørgsmål, men forestille dig at kun ét af alternativerne vil blive gennemført.
Begge situationer indebærer en ændring i forhold til myndighedernes nuværende indsats for at sikre rent drikke-vand.
Den nuværende situationPå nuværende tidspunkt er der gennemført en række tiltag med henblik på at beskytte grundvandet mod forure-ning med sprøjtemidler og kvælstof. Når en grundvandsboring viser sig at være forurenet lukkes den, og der boreset nyt sted.
Det er usikkert, om rent drikkevand kan fremskaffes på denne måde i tilstrækkelige mængder i fremtiden. Der erderfor en risiko for, at vand fra vandhanen i fremtiden vil overskride de nuværende grænseværdier for indholdet afsprøjtemidler og kvælstof.
Vilkårene for dyre- og plantelivet i vandløb og søer er mindre gode. Dyre- og plantelivet er således i ubalancemange steder, og markant anderledes end hvis tilstanden var naturlig. De primære årsager til ændringerne ivandmiljøets tilstand er menneskelig aktivitet.
I det følgende vil du blive præsenteret for to forslag, der kan bidrage til sikring af rent drikkevand både nu og ifremtiden. For hvert forslag vil du blive bedt om at angive din betalingsvilje for, at det givne forslag gennemføres.
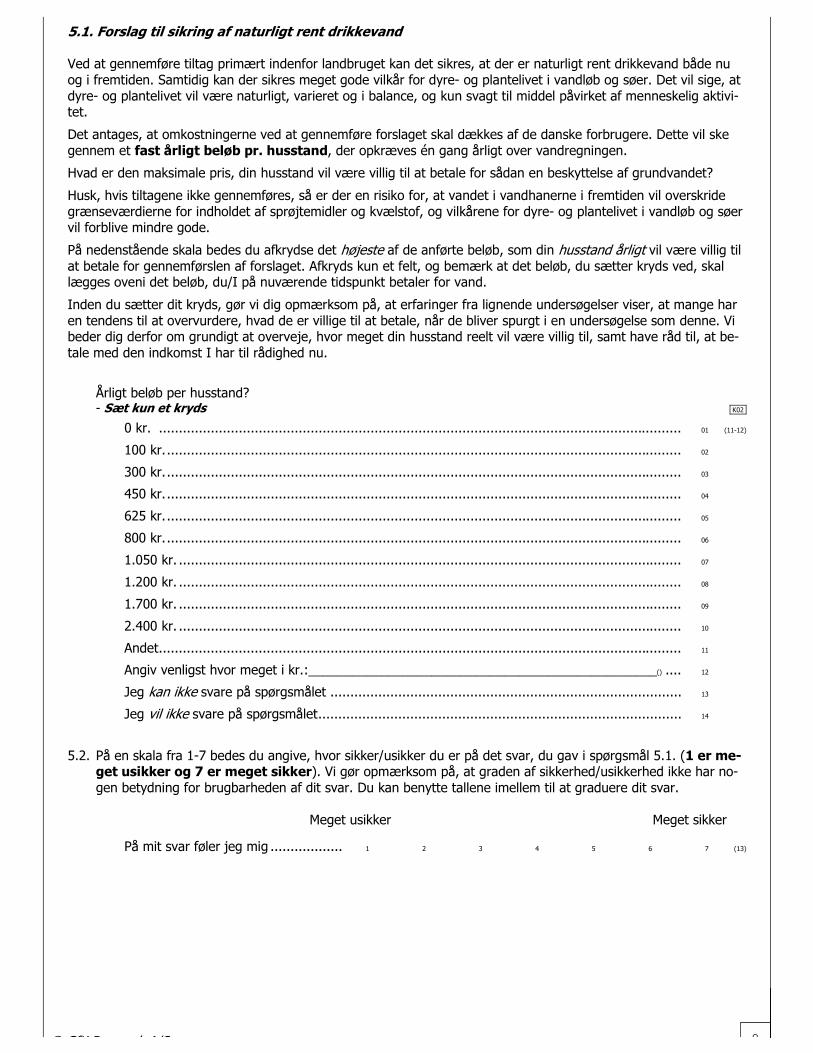
© GfK D k A/S 8
5.1. Forslag til sikring af naturligt rent drikkevand
Ved at gennemføre tiltag primært indenfor landbruget kan det sikres, at der er naturligt rent drikkevand både nuog i fremtiden. Samtidig kan der sikres meget gode vilkår for dyre- og plantelivet i vandløb og søer. Det vil sige, atdyre- og plantelivet vil være naturligt, varieret og i balance, og kun svagt til middel påvirket af menneskelig aktivi-tet.
Det antages, at omkostningerne ved at gennemføre forslaget skal dækkes af de danske forbrugere. Dette vil skegennem et fast årligt beløb pr. husstand, der opkræves én gang årligt over vandregningen.
Hvad er den maksimale pris, din husstand vil være villig til at betale for sådan en beskyttelse af grundvandet?
Husk, hvis tiltagene ikke gennemføres, så er der en risiko for, at vandet i vandhanerne i fremtiden vil overskridegrænseværdierne for indholdet af sprøjtemidler og kvælstof, og vilkårene for dyre- og plantelivet i vandløb og søervil forblive mindre gode.
På nedenstående skala bedes du afkrydse det højeste af de anførte beløb, som din husstand årligt vil være villig tilat betale for gennemførslen af forslaget. Afkryds kun et felt, og bemærk at det beløb, du sætter kryds ved, skallægges oveni det beløb, du/I på nuværende tidspunkt betaler for vand.
Inden du sætter dit kryds, gør vi dig opmærksom på, at erfaringer fra lignende undersøgelser viser, at mange haren tendens til at overvurdere, hvad de er villige til at betale, når de bliver spurgt i en undersøgelse som denne. Vibeder dig derfor om grundigt at overveje, hvor meget din husstand reelt vil være villig til, samt have råd til, at be-tale med den indkomst I har til rådighed nu.
Årligt beløb per husstand?- Sæt kun et kryds .K02.
0 kr. ...................................................................................................................................� 01 (11-12)
100 kr..................................................................................................................................� 02
300 kr..................................................................................................................................� 03
450 kr..................................................................................................................................� 04
625 kr..................................................................................................................................� 05
800 kr..................................................................................................................................� 06
1.050 kr. ..............................................................................................................................� 07
1.200 kr. ..............................................................................................................................� 08
1.700 kr. ..............................................................................................................................� 09
2.400 kr. ..............................................................................................................................� 10
Andet...................................................................................................................................� 11
Angiv venligst hvor meget i kr.:________________________________________________() ....� 12
Jeg kan ikke svare på spørgsmålet ........................................................................................� 13
Jeg vil ikke svare på spørgsmålet...........................................................................................� 14
5.2. På en skala fra 1-7 bedes du angive, hvor sikker/usikker du er på det svar, du gav i spørgsmål 5.1. (1 er me-get usikker og 7 er meget sikker). Vi gør opmærksom på, at graden af sikkerhed/usikkerhed ikke har no-gen betydning for brugbarheden af dit svar. Du kan benytte tallene imellem til at graduere dit svar.
Meget usikker Meget sikker
På mit svar føler jeg mig ..................� 1 � 2 � 3 � 4 � 5 � 6 � 7 (13)

© GfK D k A/S 9
Hvis du svarede 100 kr. eller mere i spørgsmål 5.1 � ellers gå til spm. 5.45.3 Angiv venligst baggrunden for, hvilket beløb du satte kryds ved i spørgsmål 5.1 omhandlende sikring af na-
turligt rent drikkevand- Sæt gerne flere krydser
Det var det højeste beløb, jeg havde råd til............................................................................� 01 (14-37)
Rent drikkevand er vigtigt for mig, og derfor betaler jeg gerne for sikring af rent drikkevand..............� 02
Rent grundvand er vigtigt for mig, og derfor betaler jeg gerne for sikring af rent grundvand.....� 03
Rent grundvand er vigtigt for plante- og dyrelivet, og derfor betaler jeg gerne for sikring afrent grundvand ....................................................................................................................� 04
Rent grundvand er vigtigt for fremtidige generationer, og derfor betaler jeg gerne for sikringaf rent grundvand. .................................................................................................................� 05
Jeg ønskede at give udtryk for min interesse for sikring af et sundt og rent miljø .....................� 06
Sikring af rent vand er en vigtig opgave, og ved at afkrydse et højt beløb håber jeg at havebidraget til, at der snart bliver gjort noget ved sagen...............................................................� 07
Jeg afkrydsede det beløb, jeg ville ønske, jeg havde råd til at betale for sikring af rentdrikkevand ...........................................................................................................................� 08
Jeg vidste ikke, hvad jeg ellers skulle svare. ...........................................................................� 09
Jeg fastsatte beløbet udfra, hvad jeg betaler til for andre ting. ................................................� 10
Andet ..................................................................................................................................� 11
Ved ikke...............................................................................................................................� 12
Hvis du svarede 0 kr. eller ikke kunne/ville svare i spørgsmål 5.1 � ellers gå til spm. 5.55.4 Angiv venligst årsagen/årsagerne til, at du svarede, som du gjorde i spørgsmål 5.1 omhandlende sikring af
naturligt rent drikkevand- Sæt gerne flere krydser
På nuværende tidspunkt har jeg ikke råd til at betale mere for vand, end jeg gør nu ................� 01 (38-61)
Det betyder ikke noget for mig, hvis grænseværdierne for sprøjtemidler og/ellerkvælstofindhold i drikkevand overskrides ...............................................................................� 02
Det betyder ikke noget for mig, hvis grænseværdierne for sprøjtemidler og/ellerkvælstofindhold i grundvand overskrides................................................................................� 03
Det betyder ikke noget for mig, hvorvidt vilkårene for dyre- og planteliv i vandløb og søerforbedres eller ej ..................................................................................................................� 04
Det er ikke mit ansvar at betale for rent vand.........................................................................� 05
Det er det offentlige eller vandværkerne, der bør betale for sikring af rent vand.......................� 06
Det er dem, der forurener vandet, der bør betale for sikring af rent vand i fremtiden................� 07
Jeg har behov for mere information for at kunne svare på sådanne spørgsmål .........................� 08
Jeg vidste ikke, hvad jeg skulle svare.....................................................................................� 09
Det kommer ikke andre ved, hvad jeg vil betale for sikring af rent vand...................................� 10
Andet ..................................................................................................................................� 11
Ved ikke...............................................................................................................................� 12

© GfK D k A/S 10
5.5 Forslag om rensning af vandVed rensning af forurenet grundvand kan rester af sprøjtemidler og kvælstof fjernes, således at det rensede vandkan bruges som drikkevand og andet brugsvand. Herved kan der fremskaffes rent drikkevand både nu og i fremti-den. I modsætning til det foregående forslag sikres grundvandet dog ikke mod forurening med sprøjtemidler ogkvælstof. Gennemførelse af rensningsforslaget vil altså ikke indebære forbedrede vilkår for dyre- og plantelivet ivandløb og søer, hvilket betyder, at disse vil forblive mindre gode. Det vil sige, at dyre- og plantelivet i vandløb ogsøer vil være markant anderledes end naturlig tilstand og i lettere ubalance.
Som før antages det, at omkostningerne forbundet med gennemførslen af forslaget skal dækkes af de danske for-brugere via et fast årligt beløb pr. husstand, der opkræves over vandregningen.
Hvad er den maksimale pris, din husstand vil være villig til at betale for rensning af grundvand, så det kan anven-des til drikkevand?
Husk, hvis rensning ikke gennemføres, så er der en risiko for, at vandet i vandhanerne i fremtiden vil overskride denuværende grænseværdier for indholdet af sprøjtemidler og kvælstof.
På nedenstående skala bedes du afkrydse det højeste af de anførte beløb, som din husstand årligt vil være villig tilat betale for gennemførslen af forslaget. Afkryds kun et felt, og husk at beløbet bliver lagt oveni din nuværendevandregning. Inden du sætter dit kryds, bedes du ligesom før grundigt overveje, hvor meget din husstand reelt vilvære villig til, samt have råd til, at betale med den indkomst I har til rådighed nu.
Hvor meget vil du være villig til at betale for, at drikkevandet fra forurenet grundvand renses og anvendes somdrikkevand?
Årligt beløb per husstand- Sæt kun et kryds
0 kr. ....................................................................................................................................� 01 (62-63)
100 kr..................................................................................................................................� 02
300 kr..................................................................................................................................� 03
450 kr..................................................................................................................................� 04
625 kr..................................................................................................................................� 05
800 kr..................................................................................................................................� 06
1.050 kr. ..............................................................................................................................� 07
1.200 kr. ..............................................................................................................................� 08
1.700 kr. ..............................................................................................................................� 09
2.400 kr. ..............................................................................................................................� 10
Andet ..................................................................................................................................� 11
Angiv venligst hvor meget i kr.:________________________________________________(64-78)� 12
Jeg kan ikke svare på spørgsmålet.........................................................................................� 13
Jeg vil ikke svare på spørgsmålet...........................................................................................� 14
Hvis jeg skal gå med til renset drikkevand, vil jeg kompenseres med et årligt beløb i form afbilligere vand........................................................................................................................� 15
5.6. På en skala fra 1-7 bedes du angive, hvor sikker/usikker du er på det svar, du gav i spørgsmål 5.5.(1 er me-get usikker og 7 er meget sikker). Vi gør opmærksom på, at graden af sikkerhed/usikkerhed ikke har no-gen betydning for brugbarheden af dit svar. Du kan benytte tallene imellem til at graduere dit svar.
Meget usikker Meget sikker
På mit svar føler jeg mig ..................� 1 � 2 � 3 � 4 � 5 � 6 � 7 (79)
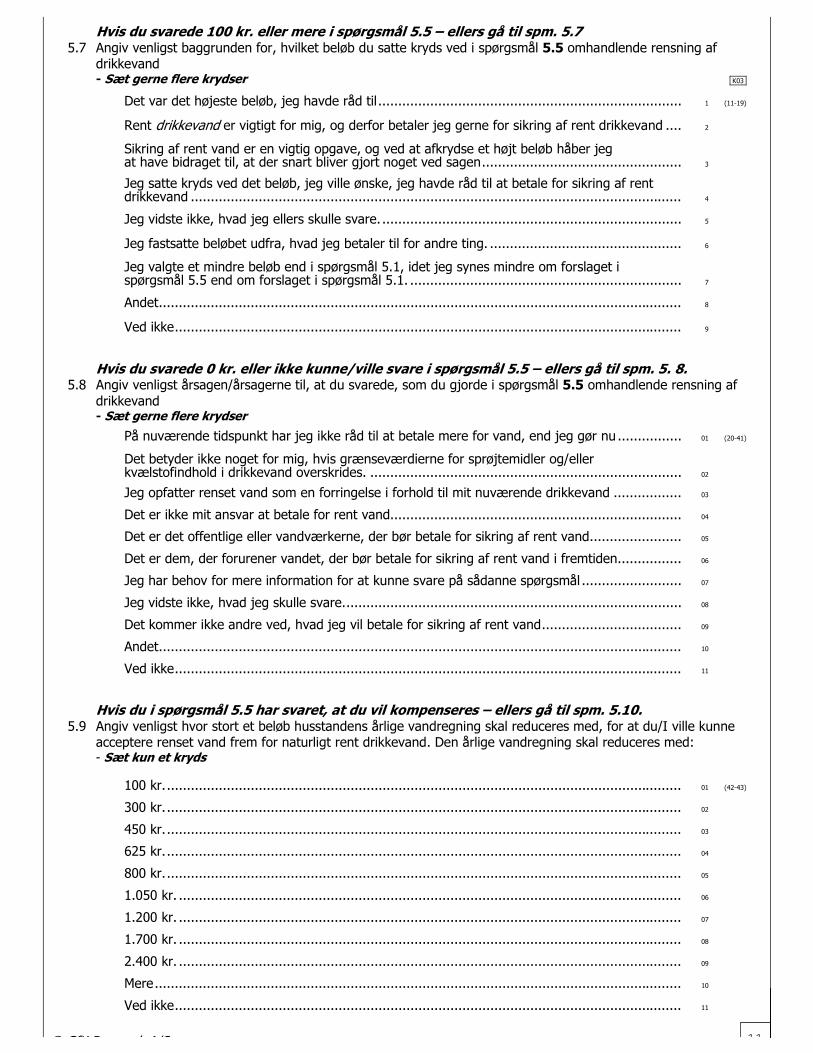
© GfK D k A/S 11
Hvis du svarede 100 kr. eller mere i spørgsmål 5.5 � ellers gå til spm. 5.75.7 Angiv venligst baggrunden for, hvilket beløb du satte kryds ved i spørgsmål 5.5 omhandlende rensning af
drikkevand- Sæt gerne flere krydser .K03.
Det var det højeste beløb, jeg havde råd til............................................................................� 1 (11-19)
Rent drikkevand er vigtigt for mig, og derfor betaler jeg gerne for sikring af rent drikkevand ....� 2
Sikring af rent vand er en vigtig opgave, og ved at afkrydse et højt beløb håber jegat have bidraget til, at der snart bliver gjort noget ved sagen..................................................� 3
Jeg satte kryds ved det beløb, jeg ville ønske, jeg havde råd til at betale for sikring af rentdrikkevand ...........................................................................................................................� 4
Jeg vidste ikke, hvad jeg ellers skulle svare. ...........................................................................� 5
Jeg fastsatte beløbet udfra, hvad jeg betaler til for andre ting. ................................................� 6
Jeg valgte et mindre beløb end i spørgsmål 5.1, idet jeg synes mindre om forslaget ispørgsmål 5.5 end om forslaget i spørgsmål 5.1. ....................................................................� 7
Andet...................................................................................................................................� 8
Ved ikke...............................................................................................................................� 9
Hvis du svarede 0 kr. eller ikke kunne/ville svare i spørgsmål 5.5 � ellers gå til spm. 5. 8.5.8 Angiv venligst årsagen/årsagerne til, at du svarede, som du gjorde i spørgsmål 5.5 omhandlende rensning af
drikkevand- Sæt gerne flere krydser
På nuværende tidspunkt har jeg ikke råd til at betale mere for vand, end jeg gør nu ................� 01 (20-41)
Det betyder ikke noget for mig, hvis grænseværdierne for sprøjtemidler og/ellerkvælstofindhold i drikkevand overskrides. ..............................................................................� 02
Jeg opfatter renset vand som en forringelse i forhold til mit nuværende drikkevand .................� 03
Det er ikke mit ansvar at betale for rent vand.........................................................................� 04
Det er det offentlige eller vandværkerne, der bør betale for sikring af rent vand.......................� 05
Det er dem, der forurener vandet, der bør betale for sikring af rent vand i fremtiden................� 06
Jeg har behov for mere information for at kunne svare på sådanne spørgsmål .........................� 07
Jeg vidste ikke, hvad jeg skulle svare.....................................................................................� 08
Det kommer ikke andre ved, hvad jeg vil betale for sikring af rent vand...................................� 09
Andet...................................................................................................................................� 10
Ved ikke...............................................................................................................................� 11
Hvis du i spørgsmål 5.5 har svaret, at du vil kompenseres � ellers gå til spm. 5.10.5.9 Angiv venligst hvor stort et beløb husstandens årlige vandregning skal reduceres med, for at du/I ville kunne
acceptere renset vand frem for naturligt rent drikkevand. Den årlige vandregning skal reduceres med:- Sæt kun et kryds
100 kr..................................................................................................................................� 01 (42-43)
300 kr..................................................................................................................................� 02
450 kr..................................................................................................................................� 03
625 kr..................................................................................................................................� 04
800 kr..................................................................................................................................� 05
1.050 kr. ..............................................................................................................................� 06
1.200 kr. ..............................................................................................................................� 07
1.700 kr. ..............................................................................................................................� 08
2.400 kr. ..............................................................................................................................� 09
Mere....................................................................................................................................� 10
Ved ikke...............................................................................................................................� 11

© GfK D k A/S 12
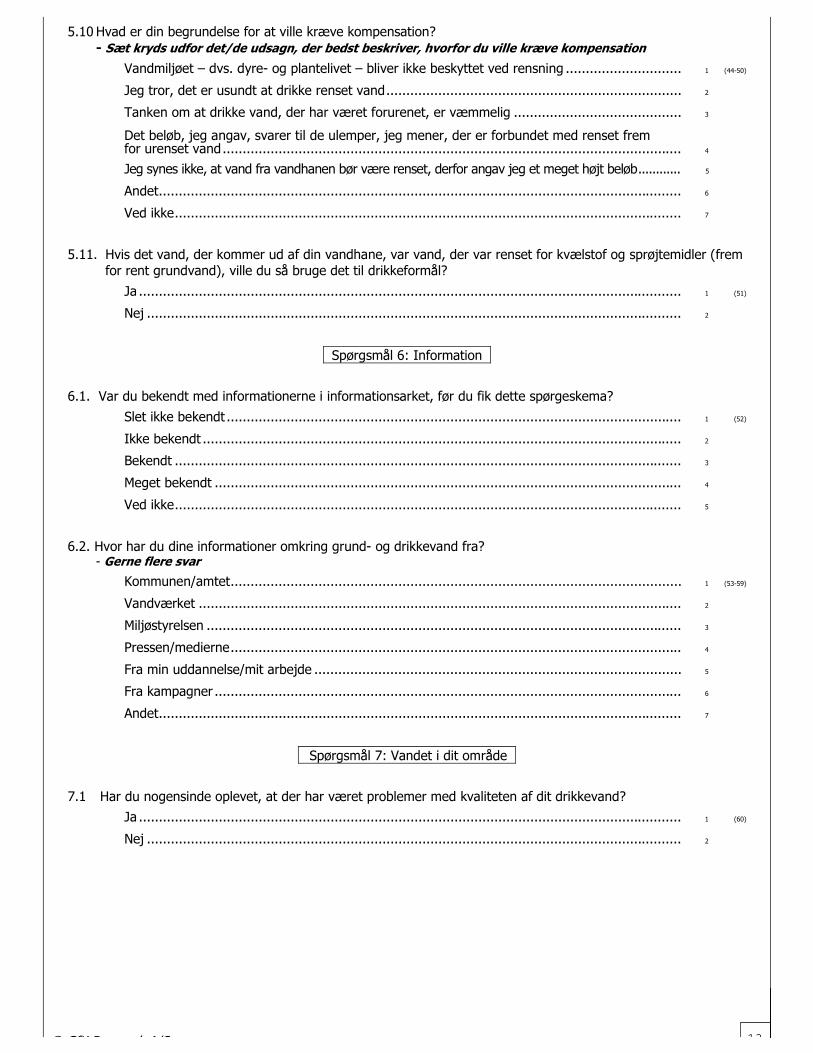
© GfK D k A/S 13
5.10 Hvad er din begrundelse for at ville kræve kompensation?- Sæt kryds udfor det/de udsagn, der bedst beskriver, hvorfor du ville kræve kompensation
Vandmiljøet � dvs. dyre- og plantelivet � bliver ikke beskyttet ved rensning .............................� 1 (44-50)
Jeg tror, det er usundt at drikke renset vand..........................................................................� 2
Tanken om at drikke vand, der har været forurenet, er væmmelig ..........................................� 3
Det beløb, jeg angav, svarer til de ulemper, jeg mener, der er forbundet med renset fremfor urenset vand...................................................................................................................� 4
Jeg synes ikke, at vand fra vandhanen bør være renset, derfor angav jeg et meget højt beløb............� 5
Andet...................................................................................................................................� 6
Ved ikke...............................................................................................................................� 7
5.11. Hvis det vand, der kommer ud af din vandhane, var vand, der var renset for kvælstof og sprøjtemidler (fremfor rent grundvand), ville du så bruge det til drikkeformål?
Ja ........................................................................................................................................� 1 (51)
Nej ......................................................................................................................................� 2
. Spørgsmål 6: Information .
6.1. Var du bekendt med informationerne i informationsarket, før du fik dette spørgeskema?
Slet ikke bekendt ..................................................................................................................� 1 (52)
Ikke bekendt ........................................................................................................................� 2
Bekendt ...............................................................................................................................� 3
Meget bekendt .....................................................................................................................� 4
Ved ikke...............................................................................................................................� 5
6.2. Hvor har du dine informationer omkring grund- og drikkevand fra?- Gerne flere svar
Kommunen/amtet.................................................................................................................� 1 (53-59)
Vandværket .........................................................................................................................� 2
Miljøstyrelsen .......................................................................................................................� 3
Pressen/medierne.................................................................................................................� 4
Fra min uddannelse/mit arbejde ............................................................................................� 5
Fra kampagner .....................................................................................................................� 6
Andet...................................................................................................................................� 7
�Spørgsmål 7: Vandet i dit område .
7.1 Har du nogensinde oplevet, at der har været problemer med kvaliteten af dit drikkevand?Ja ........................................................................................................................................� 1 (60)
Nej ......................................................................................................................................� 2

© GfK D k A/S 14
�Baggrundsspørgsmål .
Køn .K04.
Mand ...................................................................................................................................� 1 (11)
Kvinde .................................................................................................................................� 2
AlderHvornår er du født?
Måned ....................................................................................................................... (12-13)
- Notér f.eks. , hvis respondenten er født i marts
Årstal............................................................................................................. (14-17)
BopælHvilken kommune bor du i? - Notér kommunenavn:______________________________________
HusstandsstørrelseHvor mange voksne, dvs. 18 år eller derover bor der i husstanden i alt ........................................ (26)
Er der barn eller børn i husstanden?- Hvis ja: Hvad er barnets/børnenes alder? Dreng Pige Alder
1. barn..............................................................� 1 � 2 (71) _________ år (72-73)
2. barn..............................................................� 1 � 2 (74) _________ år (75-76)
3. barn..............................................................� 1 � 2 (77) _________ år (78-79)
4. barn..............................................................� 1 � 2 (80) _________ år (81-82)
Nej, der er ingen børn i husstanden.......................................................................................� 1 (83)
Hvor mange personer, dvs. såvel voksne som børn, bor der i husstanden alt i alt .................... (30-31)
BoligHvilken type bolig bor du i?
Række-/kæde-/klyngehus .....................................................................................................� 1 (37)
Lejlighed/etageejendom........................................................................................................� 2
Fritliggende enfamilieshus .....................................................................................................� 3
Landbrugsejendom/gård .......................................................................................................� 4
Andet...................................................................................................................................� 5
IndkomstHvor stor er familiens samlede årlige bruttoindkomst? - Det skal være indkomst før eventuelle fradrag iskat
Under kr. 50.000 ..................................................................................................................� 01 (40-41)
Kr. 50.000 - 99.999 ..............................................................................................................� 02
Kr. 100.000 - 149.999...........................................................................................................� 03
Kr. 150.000 - 199.999...........................................................................................................� 04
Kr. 200.000 - 249.999...........................................................................................................� 05
Kr. 250.000 - 299.999...........................................................................................................� 06
Kr. 300.000 - 349.999...........................................................................................................� 07
Kr. 350.000 - 399.999...........................................................................................................� 08
Kr. 400.000 - 449.999...........................................................................................................� 09
Kr. 450.000 - 499.999...........................................................................................................� 10
Kr. 500.000 - 749.999...........................................................................................................� 11
Kr. 750.000 - 999.999...........................................................................................................� 13
91
0 3

© GfK D k A/S 15
Kr. 1.000.000 eller derover....................................................................................................� 14

© GfK D k A/S 16
Hvad er din egen årlige bruttoindkomst? - Det skal være indkomst før eventuelle fradrag i skat
Under kr. 50.000 ..................................................................................................................� 01 (57-58)
Kr. 50.000 - 99.999 ..............................................................................................................� 02
Kr. 100.000 - 149.999...........................................................................................................� 03
Kr. 150.000 - 199.999...........................................................................................................� 04
Kr. 200.000 - 249.999...........................................................................................................� 05
Kr. 250.000 - 299.999...........................................................................................................� 06
Kr. 300.000 - 349.999...........................................................................................................� 07
Kr. 350.000 - 399.999...........................................................................................................� 08
Kr. 400.000 - 449.999...........................................................................................................� 09
Kr. 450.000 - 499.999...........................................................................................................� 10
Kr. 500.000 - 749.999...........................................................................................................� 11
Kr. 750.000 - 999.999...........................................................................................................� 13
Kr. 1.000.000 eller derover....................................................................................................� 14
UddannelseHvad er din senest afsluttede uddannelse?
Afsluttet uddannelse ved 14-15 års alderen og ingen yderligere uddannelse(f.eks. 7., 8. eller 9. klasse)...................................................................................................� 1 (42)
Afsluttet uddannelse ved 16-19 års alderen og ingen yderligere uddannelse(f.eks. 10. kl., realeksamen, studenter-eksamen/HF/HH/lærlingeuddannelse m.v.) ...................� 2
Mellemlang videregående uddannelse (f.eks. seminarium/teknikum/EG/HA-eksamen) ..............� 3
Lang uddannelse på højere læreanstalt(f.eks. universitet, teknisk højskole, tandlægehøjskole, handelshøjskole m.v.)..........................� 4
Er under uddannelse.............................................................................................................� 5
StillingHvad er din stilling?
Arbejder, ufaglært ................................................................................................................� 01 (48-49)
Arbejder, faglært ..................................................................................................................� 02
Funktion uden ledelsesansvar/tjenestemand ..........................................................................� 11
Højere funktionær/tjenestemand (ledende medarbejder) ........................................................� 12
Selvstændig landbruger ........................................................................................................� 04
Selvstændig detailhandlende/håndværksmester .....................................................................� 05
Selvstændig i liberalt erhverv ................................................................................................� 06
Lærling/studerende/elev .......................................................................................................� 07
Husmor/medhjælpende ægtefælle.........................................................................................� 08
Pensionist/efterløn (ude af arbejde).......................................................................................� 09
Arbejdsløs ............................................................................................................................� 10
Spørgeskemaet er slut � tak for hjælpen!

© GfK D k A/S 17
Skemaversion: CE-Blok 1!1 (10)
Undersøgelse af holdninger til beskyttelse af vandmiljøet i Danmark 760-032
Det medfølgende spørgeskema udgør en del af et forskningsprojekt vedrørende den fremtidige forvaltning af detferske vandmiljø i Danmark. Projektet udføres af forskere fra Danmarks Miljøundersøgelser.
Det ferske vandmiljø består af grundvandet, søer og vandløb. Vandmiljøet kan beskyttes og forvaltes på forskelligemåder, der har forskellig betydning for kvaliteten af grundvandet og drikkevandet, og for vilkårene for dyre- ogplantelivet i vandløb og søer. Formålet med dette spørgeskema er, at høre dine holdninger til, hvordan det ferskevandmiljø bør forvaltes fremover.
Vi vil bede dig om at svare i overensstemmelse med dine personlige synspunkter. Ingen svar er således mere rigti-ge end andre - vi er interesserede i din mening. Dine svar vil blive behandlet fortroligt og vil udelukkende blivebrugt til videnskabeligt formål. Spørgeskemaet er i alt udsendt til 1.500 personer, og det er vigtigt for undersøgel-sens resultater, at så mange som muligt svarer.
Vi har vedlagt et informationsark om ferskvand og grundvand, og vi vil bede dig om at læse dette inden besvarel-sen af spørgeskemaet.
På forhånd tak for hjælpen og god fornøjelse med besvarelsen.

© GfK D k A/S 18
.Spørgsmål 1: Holdninger til miljøet .
1.1 Nedenfor er en række udsagn om det danske vandmiljø. På en skala fra 1-5 bedes du angive, hvor enig elleruenig du er i udsagnene. Du kan benytte tallene imellem til at graduere dit svar- Sæt kun ét kryds i hver linie
Helt uenig Hverken/eller Helt enig Ved ikke .K01.
Beskyttelsen af vandmiljøeter en af de vigtigste opgaverindenfor miljøpolitikken...............� 1 � 2 � 3 � 4 � 5 � 6 (11)
Vandet i vandhanen behøverikke at være drikkevand.Drikkevand kan købes på flaske......� 1 � 2 � 3 � 4 � 5 � 6 (12)
Forurening med sprøjtemidlerer en væsentlig trussel modkvaliteten af drikkevandet iDanmark.....................................� 1 � 2 � 3 � 4 � 5 � 6 (13)
Forurening med kvælstof er envæsentlig trussel mod kvali-teten af drikkevandet i Danmark.....� 1 � 2 � 3 � 4 � 5 � 6 (14)
Drikkevand behøver ikkekomme fra urenset grundvand;renset vand er lige så godt ............� 1 � 2 � 3 � 4 � 5 � 6 (15)
Vandløb og søer bør have et rigtog naturligt dyre- og planteliv.........� 1 � 2 � 3 � 4 � 5 � 6 (16)
Drikkevandet er rent i Danmark......� 1 � 2 � 3 � 4 � 5 � 6 (17)
Problemerne med forurening afvandmiljøet er overdrevne .............� 1 � 2 � 3 � 4 � 5 � 6 (18)
Myndighederne bør brugeflere ressourcer på beskyttelseaf vandmiljøet end de gør nu .........� 1 � 2 � 3 � 4 � 5 � 6 (19)
. Spørgsmål 2: Dit vandforbrug.
2.1 Køber du eller nogen i din husholdning nogensinde flaskevand (kildevand mv. uden kulsyre) som alternativ tildrikkevand fra vandhanen?- Kun et svar
Altid.....................................................................................................................................� 1 (20)
Ofte.....................................................................................................................................� 2
Sjældent .............................................................................................................................� 3
Aldrig..........................................................................................→ Gå til spm. 2.3............� 4
Ved ikke...................................................................................... → Gå til spm. 2.3............� 5
2.2 Hvis/når du eller nogen i din husstand køber flaskevand, hvad er årsagen/årsagerne så?- Gerne flere svar
Det smager bedre.................................................................................................................� 1 (21-27)
Det er ikke forurenet ............................................................................................................� 2
Det er sundere på grund af mineraler mv...............................................................................� 3
At det er i en praktisk emballage ...........................................................................................� 4
At jeg ikke har adgang til postevand (fx. når jeg er ude at handle) ..........................................� 5
Andet...................................................................................................................................� 6
Ved ikke...............................................................................................................................� 7

© GfK D k A/S 19
2.3 Hvis de nuværende grænseværdier for indholdet af kvælstof og/eller sprøjtemidler i drikkevand varoverskredet, ville du så købe flaskevand til drikkeformål?
Nej ......................................................................................................................................� 1 (28-31)
Ja, under alle omstændigheder .............................................................................................� 2
Ja, hvis jeg synes overskridelsen er for stor............................................................................� 3
Ved ikke...............................................................................................................................� 4
2.4 Gør du/din husstand noget for at spare på vandet?
Ja ........................................................................................................................................� 1 (32)
Nej ............................................................................................. → Gå til spm. 3.1............� 2
2.5 Hvad gør du/I for at spare på vandet?- Gerne flere svar
Jeg/vi har vandbesparende vaner ..........................................................................................� 1 (33-40)
Jeg/vi har vandbesparende toilet. ..........................................................................................� 2
Jeg/vi har vandbesparende vandhaner...................................................................................� 3
Jeg/vi har vandbesparende vaskemaskine ..............................................................................� 4
Jeg/vi har vandbesparende opvaskemaskine ..........................................................................� 5
Jeg/vi undgår unødvendigt vandforbrug, fx ved at lukke for vandet under tandbørstning ..........� 6
Andet, noter:______________________________________________________________(41-50)� 7
Ved ikke...............................................................................................................................� 8
2.6 Hvorfor sparer du/I på vandet? Angiv nedenfor, hvor stor betydning de nævnte forhold har for din/jeres be-slutning om at spare på vandet.- Sæt kun ét kryds i hver linie
Meget stor Stor Nogen Ingenbetydning betydning betydning betydning Ved ikke
Prisen på vandet.......................................� 1 � 2 � 3 � 4 � 5 (51)
Hensyn til miljøet......................................� 1 � 2 � 3 � 4 � 5 (52)
Vane ........................................................� 1 � 2 � 3 � 4 � 5 (53)
Hensyn til fremtidige generationer .............� 1 � 2 � 3 � 4 � 5 (54)
Andet.......................................................� 1 � 2 � 3 � 4 � 5 (55)
. Spørgsmål 3: Din brug af vandløb og søer .
3.1 Fisker du i danske vandløb og/eller søer i din fritid?- Kun et svar
Ofte............................................................................................→ Gå til spm. 3.3............� 1 (56)
Nogle gange................................................................................→ Gå til spm. 3.3............� 2
Sjældent ....................................................................................→ Gå til spm. 3.2............� 3
Jeg fisker aldrig i Danmark, kun i udlandet.................................... → Gå til spm. 3.2............� 4
Jeg fisker aldrig ...........................................................................→ Gå til spm. 3.2............� 5
Jeg dyrker kun kyst-/havfiskeri .................................................... → Gå til spm. 3.3............� 6
3.2. Hvis du fisker, men sjældent eller aldrig fisker i Danmark, er det så fordi:- Kun et svar
Der er ingen egnede søer eller åer i nærheden.......................................................................� 1 (57-61)
Det er ikke tilstrækkelig udfordrende .....................................................................................� 2

© GfK D k A/S 20
Jeg har ikke tid til at fiske så ofte ..........................................................................................� 3
Jeg interesserer mig ikke for at fiske......................................................................................� 4
Andet ..................................................................................................................................� 5

© GfK D k A/S 21
3.3 Bader du i danske vandløb og/eller søer?- Kun et svar
Ofte............................................................................................→ Gå til spm. 4.1............� 1 (62)
Nogle gange................................................................................→ Gå til spm. 4.1............� 2
Sjældent ....................................................................................→ Gå til spm. 3.4............� 3
Jeg bader aldrig i ferskvand ......................................................... → Gå til spm. 3.4............� 4
Jeg bader ikke.............................................................................→ Gå til spm. 3.4............� 5
3.4. Hvis du sjældent eller aldrig bader i ferskvand, er det så fordi:- Kun et svar
Der er ingen egnede søer eller åer i nærheden.......................................................................� 1 (63-67)
Vandkvaliteten er for dårlig ...................................................................................................� 2
Bundforholdene er dårlige .....................................................................................................� 3
Jeg har ikke tid til at bade oftere ...........................................................................................� 4
Andet ..................................................................................................................................� 5
. Spørgsmål 4: Din vandforsyning .
4.1 Hvor kommer husstandens drikkevand fra?- Kun et svar
Kommunalt vandforsyningsanlæg ..........................................................................................� 1 (68)
Privat, alment anlæg.............................................................................................................� 2
Privat boring .......................................................................................................................� 3
Andet...................................................................................................................................� 4
Ved ikke...............................................................................................................................� 5
4.2 Ved du ca., hvor mange kubikmeter (1.000 liter) vand din husholdning bruger årligt?
Ja .......................................................................................................................................� 1 (69)
Nej ......................................................................................................................................� 2
4.3 Hvis ja, angiv da det årlige forbrug i kubikmeter her:............................................... (70-73)
4.4 Ved du, hvor stor din husstands årlige vandregning er?- Kun et svar
Ja, den er mindre end 1500 kr...............................................................................................� 1 (74)
Ja, den er mellem 1500 og 4000 kr........................................................................................� 2
Ja, den er mellem 4000 og 6000 kr........................................................................................� 3
Ja, den er over 6000 kr.........................................................................................................� 4
Nej, jeg ved det ikke/jeg kan ikke huske det ..........................................................................� 5

© GfK D k A/S 22
. Spørgsmål 5: Undersøgelse af politikforslag .
Du vil nu blive bedt om at vælge mellem en række forskellige politikforslag vedrørende den fremtidige forvaltningaf vandmiljøet. Forslagene varierer med hensyn til deres konsekvenser for:
1. Kvaliteten af drikkevand2. Vilkårene for dyre- og plantelivet i vandløb og søer3. Størrelsen af din husstands vandregning
1. Kvaliteten af drikkevand:Kvaliteten af drikkevandet i et givent område vil selvfølgelig afhænge af de mere specifikke lokale forhold, menfølgende tre kvalitetsniveauer kan beskrive den generelle kvalitet af det danske drikkevand.
! Naturligt rent: Tiltag primært i landbruget forebygger at grundvandet forurenes med sprøjtemidler og kvæl-stof. Herved sikres det, at der er naturligt rent drikkevand både nu og i fremtiden.
! Usikker: Nuværende situation, dvs. grundvandet beskyttes som nu, men der indføres ikke yderligere tiltag forat forebygge forurening. Når en grundvandsboring viser sig at være forurenet lukkes den, og der bores et nytsted. Det er det, vandmyndighederne gør i dag for at sikre rent drikkevand til forbrugerne. Det er usikkert, omrent drikkevand kan fremskaffes på denne måde i tilstrækkelige mængder i fremtiden. Der er derfor en risikofor, at vandet i vandhanerne i fremtiden vil overskride de nuværende grænseværdier for indholdet af sprøjte-midler og kvælstof.
! Renset: Ved at rense det forurenede grundvand for rester af sprøjtemidler og kvælstof sikres det, at der errent drikkevand både nu og i fremtiden.
2. Vilkårene for dyre- og planteliv i vandløb og søer:Vilkårene for planter og dyr i vandmiljøet påvirkes både af de naturlige fysiske forhold og af graden af forurening.Vilkårene for dyr og planter vil derfor variere fra sted til sted. De følgende tre kvalitetsniveauer karakteriserer til-standen for de danske vandløb og søer.
! Meget gode: Dyre- og plantelivet er naturligt, varieret og i balance. Kun svagt til middel påvirket af menne-skelig aktivitet.
! Mindre gode: Dyre- og plantelivet er markant anderledes end naturlig tilstand og i lettere ubalance. Betyde-ligt påvirket af menneskelig aktivitet. Svarer til den nuværende situation.
! Dårlige: Dyre- og plantelivet er væsentlig anderledes end naturlig tilstand og i alvorlig ubalance. Ofte fuld-stændig ændret på grund af menneskelig aktivitet.
3. Størrelsen af husstandens vandregning:Det antages, at omkostningerne ved at gennemføre forslagene dækkes af de danske forbrugere. Vi beder dig omat forestille dig, at alle forbrugere skal bidrage på lige fod til gennemførsel af forslagene gennem et fast årligt be-løb pr. husstand, der opkræves én gang årligt over vandregningen.
Du vil blive bedt om at foretage i alt 6 valg. I hver enkel valgsituation skal du vælge mellem 3 alternative politikfor-slag, der varierer med hensyn til kvaliteten af drikkevandet, vilkårene for dyre- og planteliv i søer og vandløb samtprisen. Prisen for hvert enkelt forslag er anført i form af et fast årligt beløb, der skal betales over vandregningen.
Bemærk, at det anførte beløb skal lægges oveni det beløb, du/I på nuværende tidspunkt betaler for vand. Bemærkdesuden, at Alternativ 1 i hver valgsituation svarer til en videreførelse af den nuværende politik.
Inden du foretager et valg, bedes du nøje studere alle 3 alternativer. Resultater fra lignende undersøgelser harvist, at folk har en tendens til at overvurdere, hvor meget de rent faktisk er villige til at betale for gennemførslen afforskellige tiltag. Inden du sætter kryds ved dit foretrukne forslag, bedes du derfor være helt sikker på, at du rentfaktisk er villig til, og i stand til, at betale det beløb, der står anført ved alternativet.
Du bedes nu foretage dine valg � god fornøjelse.
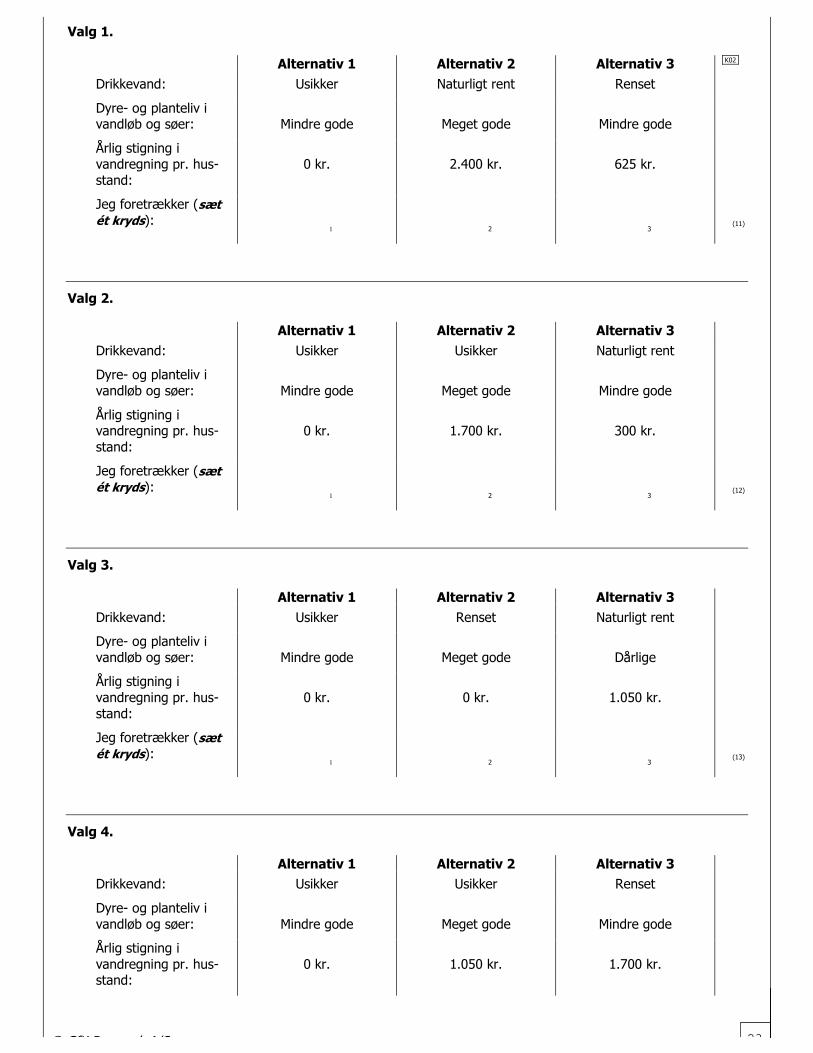
© GfK D k A/S 23
Valg 1.
Alternativ 1 Alternativ 2 Alternativ 3 .K02.
Drikkevand: Usikker Naturligt rent Renset
Dyre- og planteliv ivandløb og søer: Mindre gode Meget gode Mindre gode
Årlig stigning ivandregning pr. hus-stand:
0 kr. 2.400 kr. 625 kr.
Jeg foretrækker (sætét kryds): � 1 � 2 � 3
(11)
Valg 2.
Alternativ 1 Alternativ 2 Alternativ 3Drikkevand: Usikker Usikker Naturligt rent
Dyre- og planteliv ivandløb og søer: Mindre gode Meget gode Mindre gode
Årlig stigning ivandregning pr. hus-stand:
0 kr. 1.700 kr. 300 kr.
Jeg foretrækker (sætét kryds): � 1 � 2 � 3
(12)
Valg 3.
Alternativ 1 Alternativ 2 Alternativ 3Drikkevand: Usikker Renset Naturligt rent
Dyre- og planteliv ivandløb og søer: Mindre gode Meget gode Dårlige
Årlig stigning ivandregning pr. hus-stand:
0 kr. 0 kr. 1.050 kr.
Jeg foretrækker (sætét kryds): � 1 � 2 � 3
(13)
Valg 4.
Alternativ 1 Alternativ 2 Alternativ 3Drikkevand: Usikker Usikker Renset
Dyre- og planteliv ivandløb og søer: Mindre gode Meget gode Mindre gode
Årlig stigning ivandregning pr. hus-stand:
0 kr. 1.050 kr. 1.700 kr.

© GfK D k A/S 24
Jeg foretrækker (sætét kryds): � 1 � 2 � 3
(14)
Valg 5.
Alternativ 1 Alternativ 2 Alternativ 3Drikkevand: Usikker Renset Naturligt rent
Dyre- og planteliv ivandløb og søer: Mindre gode Mindre gode Dårlige
Årlig stigning ivandregning pr. hus-stand:
0 kr. 1.050 kr. 300 kr.
Jeg foretrækker (sætét kryds): � 1 � 2 � 3
(15)
Valg 6.
Alternativ 1 Alternativ 2 Alternativ 3Drikkevand: Usikker Renset Naturligt rent
Dyre- og planteliv ivandløb og søer: Mindre gode Meget gode Mindre gode
Årlig stigning ivandregning pr. hus-stand:
0 kr. 300 kr. 2.400 kr.
Jeg foretrækker (sætét kryds): � 1 � 2 � 3
(16)
.S Spørgsmål 6: Opfølgning på spørgsmål 5 .
6.1. Fandt du det svært at foretage valgene i spørgsmål 5?
Ja ........................................................................................................................................� 1 (17)
Nej ......................................................................................................................................� 2
6.2. Hvis ja, hvad var det så der gjorde det svært?- Sæt ét eller flere kryds
Jeg kunne ikke forholde mig til oplysningerne ........................................................................� 1 (18-25)
Jeg syntes, der var for meget information at tage stilling til.....................................................� 2
Jeg forstod ikke spørgsmålene...............................................................................................� 3
Jeg syntes, alternativerne var for dyre ...................................................................................� 4
Det var svært at vælge, idet flere egenskaber var vigtige........................................................� 5
Principielt mener jeg ikke, at forbrugerne skal betale for at sikre et rent vand og godt vandmiljø ........� 6
Andet...................................................................................................................................� 7
Ved ikke...............................................................................................................................� 8
6.3. På en skala fra 1-7 bedes du angive, hvor sikker/usikker du er på de valg, du foretog i spørgsmål 5 (1 er me-get usikker og 7 er meget sikker). Vi gør opmærksom på, at graden af sikkerhed/usikkerhed ikke har no-gen betydning for brugbarheden af dine svar. Du kan benytte tallene imellem til at graduere dit svar.

© GfK D k A/S 25
Meget usikker Meget sikker
På mine svar føler jeg mig................� 1 � 2 � 3 � 4 � 5 � 6 � 7 (26)
6.4. Nedenfor bedes du sætte kryds ud for den egenskab, som du lagde størst vægt på i dine valg i spørgsmål 5.- Sæt kun ét kryds
Drikkevand...........................................................................................................................� 1 (27)
Dyre- og planteliv i vandløb og søer.......................................................................................� 2
Størrelsen af den årlige stigning i vandregning .......................................................................� 3
Det varierede fra valg til valg ................................................................................................� 4
Ved ikke...............................................................................................................................� 5
6.5. Var det udelukkende den egenskab, du satte kryds ved i spørgsmål 6.5, du kiggede på, da du foretog dinevalg i spørgsmål 5, eller tog du alle egenskaber i betragtning?
Ja NejUdelukkende den egenskab jeg lagde vægt på ....................................................� 1 � 1 (28)
Tog alle egenskaber i betragtning.......................................................................� 2 � 2 (29)
6.6. Hvis det vand, der kommer ud af din vandhane, var vand, der var renset for kvælstof og sprøjtemidler (fremfor rent grundvand), ville du så bruge det til drikkeformål?
Ja ........................................................................................................................................� 1 (30)
Nej ......................................................................................................................................� 2
. Spørgsmål 7: Information .
7.1. Var du bekendt med informationerne i informationsarket før du fik dette spørgeskema?Slet ikke bekendt ..................................................................................................................� 1 (31)
Ikke bekendt ........................................................................................................................� 2
Bekendt ...............................................................................................................................� 3
Meget bekendt .....................................................................................................................� 4
Ved ikke...............................................................................................................................� 5
7.2. Hvor har du dine informationer omkring grund - og drikkevand fra?- Gerne flere svar
Kommunen/amtet.................................................................................................................� 1 (32-38)
Vandværket .........................................................................................................................� 2
Miljøstyrelsen .......................................................................................................................� 3
Presse0n/medierne ...............................................................................................................� 4
Fra min uddannelse/mit arbejde ............................................................................................� 5
Fra kampagner .....................................................................................................................� 6
Andet...................................................................................................................................� 7
�Spørgsmål 8: Vandet i dit område .
8.1 Har du nogensinde oplevet, at der har været problemer med kvaliteten af dit drikkevand?
Ja ........................................................................................................................................� 1 (39)

© GfK D k A/S 26
Nej ......................................................................................................................................� 2

© GfK D k A/S 27
�Baggrundsspørgsmål .
Køn .K04.
Mand ...................................................................................................................................� 1 (11)
Kvinde .................................................................................................................................� 2
AlderHvornår er du født?
Måned ....................................................................................................................... (12-13)
- Notér f.eks. , hvis respondenten er født i marts
Årstal............................................................................................................. (14-17)
BopælHvilken kommune bor du i? - Notér kommunenavn:______________________________________
HusstandsstørrelseHvor mange voksne, dvs. 18 år eller derover bor der i husstanden i alt ........................................ (26)
Er der barn eller børn i husstanden?- Hvis ja: Hvad er barnets/børnenes alder? Dreng Pige Alder
1. barn..............................................................� 1 � 2 (71) _________ år (72-73)
2. barn..............................................................� 1 � 2 (74) _________ år (75-76)
3. barn..............................................................� 1 � 2 (77) _________ år (78-79)
4. barn..............................................................� 1 � 2 (80) _________ år (81-82)
Nej, der er ingen børn i husstanden.......................................................................................� 1 (83)
Hvor mange personer, dvs. såvel voksne som børn, bor der i husstanden alt i alt .................... (30-31)
BoligHvilken type bolig bor du i?
Række-/kæde-/klyngehus .....................................................................................................� 1 (37)
Lejlighed/etageejendom........................................................................................................� 2
Fritliggende enfamilieshus .....................................................................................................� 3
Landbrugsejendom/gård .......................................................................................................� 4
Andet...................................................................................................................................� 5
IndkomstHvor stor er familiens samlede årlige bruttoindkomst? - Det skal være indkomst før eventuelle fradrag iskat
Under kr. 50.000 ..................................................................................................................� 01 (40-41)
Kr. 50.000 - 99.999 ..............................................................................................................� 02
Kr. 100.000 - 149.999...........................................................................................................� 03
Kr. 150.000 - 199.999...........................................................................................................� 04
Kr. 200.000 - 249.999...........................................................................................................� 05
Kr. 250.000 - 299.999...........................................................................................................� 06
Kr. 300.000 - 349.999...........................................................................................................� 07
Kr. 350.000 - 399.999...........................................................................................................� 08
Kr. 400.000 - 449.999...........................................................................................................� 09
Kr. 450.000 - 499.999...........................................................................................................� 10
Kr. 500.000 - 749.999...........................................................................................................� 11
Kr. 750.000 - 999.999...........................................................................................................� 13
91
0 3

© GfK D k A/S 28
Kr. 1.000.000 eller derover....................................................................................................� 14
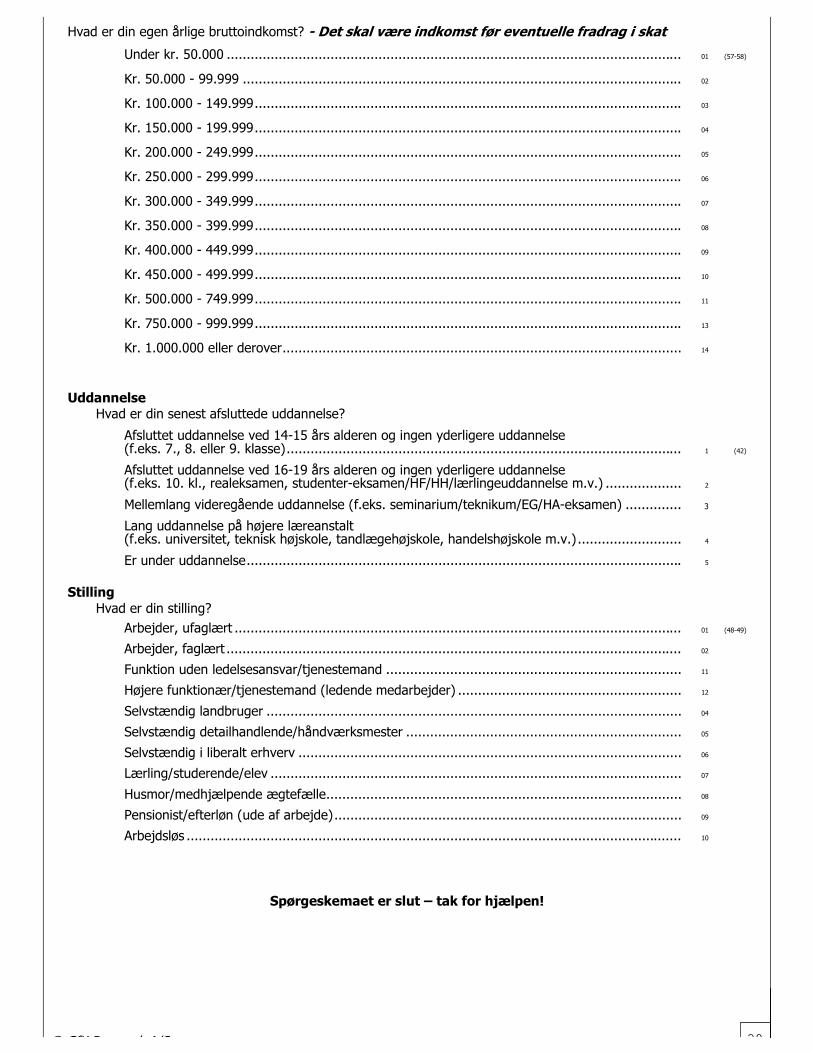
© GfK D k A/S 29
Hvad er din egen årlige bruttoindkomst? - Det skal være indkomst før eventuelle fradrag i skat
Under kr. 50.000 ..................................................................................................................� 01 (57-58)
Kr. 50.000 - 99.999 ..............................................................................................................� 02
Kr. 100.000 - 149.999...........................................................................................................� 03
Kr. 150.000 - 199.999...........................................................................................................� 04
Kr. 200.000 - 249.999...........................................................................................................� 05
Kr. 250.000 - 299.999...........................................................................................................� 06
Kr. 300.000 - 349.999...........................................................................................................� 07
Kr. 350.000 - 399.999...........................................................................................................� 08
Kr. 400.000 - 449.999...........................................................................................................� 09
Kr. 450.000 - 499.999...........................................................................................................� 10
Kr. 500.000 - 749.999...........................................................................................................� 11
Kr. 750.000 - 999.999...........................................................................................................� 13
Kr. 1.000.000 eller derover....................................................................................................� 14
UddannelseHvad er din senest afsluttede uddannelse?
Afsluttet uddannelse ved 14-15 års alderen og ingen yderligere uddannelse(f.eks. 7., 8. eller 9. klasse)...................................................................................................� 1 (42)
Afsluttet uddannelse ved 16-19 års alderen og ingen yderligere uddannelse(f.eks. 10. kl., realeksamen, studenter-eksamen/HF/HH/lærlingeuddannelse m.v.) ...................� 2
Mellemlang videregående uddannelse (f.eks. seminarium/teknikum/EG/HA-eksamen) ..............� 3
Lang uddannelse på højere læreanstalt(f.eks. universitet, teknisk højskole, tandlægehøjskole, handelshøjskole m.v.)..........................� 4
Er under uddannelse.............................................................................................................� 5
StillingHvad er din stilling?
Arbejder, ufaglært ................................................................................................................� 01 (48-49)
Arbejder, faglært ..................................................................................................................� 02
Funktion uden ledelsesansvar/tjenestemand ..........................................................................� 11
Højere funktionær/tjenestemand (ledende medarbejder) ........................................................� 12
Selvstændig landbruger ........................................................................................................� 04
Selvstændig detailhandlende/håndværksmester .....................................................................� 05
Selvstændig i liberalt erhverv ................................................................................................� 06
Lærling/studerende/elev .......................................................................................................� 07
Husmor/medhjælpende ægtefælle.........................................................................................� 08
Pensionist/efterløn (ude af arbejde).......................................................................................� 09
Arbejdsløs ............................................................................................................................� 10
Spørgeskemaet er slut � tak for hjælpen!

Annex 3
English Questionnaire

© GfK D k A/S 1
Study of attitudes to the protection of the aquatic environment in Denmark 760-032
INFORMATION SHEET ON FRESHWATER AND GROUNDWATER
The freshwater aquatic environment in Denmark
The majority of drinking water we use in Denmark stems from groundwater. Groundwater is found in cavities andwater-bearing layers in the earth. Danish drinking water policy bases itself on that drinking water comes fromgroundwater which has undergone a very simple process (oxygenation), but which has not undergone any furthertreatment. This approaches a unique situation in relation to many other countries, where treated surface-water,e.g. from lakes and rivers, is used.
Groundwater in Denmark is, many places, polluted with waste products from, among other sources, agriculture,industry, road traffic, households/private gardens, landfill sites and sewers. Pollution from pesticides and nitrogenrepresents the most common reason for many groundwater boreholes to be closed as the water can no longer beused as drinking water without first undergoing treatment processes.
Pollution from agriculture, households, industry, etc. similarly affects animal and plant-life in lakes and water-courses. Together with a range of physical conditions, pollution represents a significant factor in defining the con-dition of Danish watercourses and lakes and, therefore, also for animal and plant-life in water and adjacent areas.
The price of water
On average, the consumer pays 35 krone per cubic metre of water (1000 litre) and each household pays on aver-age 4.000 krone per year in Denmark in water bills (1.500 krone per person). This price includes both drinkingwater supply and removal and treatment of water via sewers (wastewater).
Groundwater pollution
Pesticides are substances which aim to protect agriculture from the adverse effects of weeds, insects and fungaldiseases. Pesticides can also impact on human health and can be poisonous for animals and plants. No preciseknowledge is to be found on how damaging pesticides are, however, pesticides and their residual products aresuspected to contribute to hormone disturbance in humans and animals, and to be carcinogenic for humans.
Nitrogen and phosphorous are important nutrients for plants. If too much nitrogen and phosphorous is applied, theexcess is lost to the environment, including groundwater. Just as with pesticides, excess nitrogen in drinking wateris under suspicion for having a carcinogenic effect in humans. Excess nitrogen and phosphorous in the aquatic en-vironment can lead to lakes becoming too rich in nutrients. This can lead to cloudy water and poor visibilitythrough the depths, and, in rare cases, fish mortality can occur.
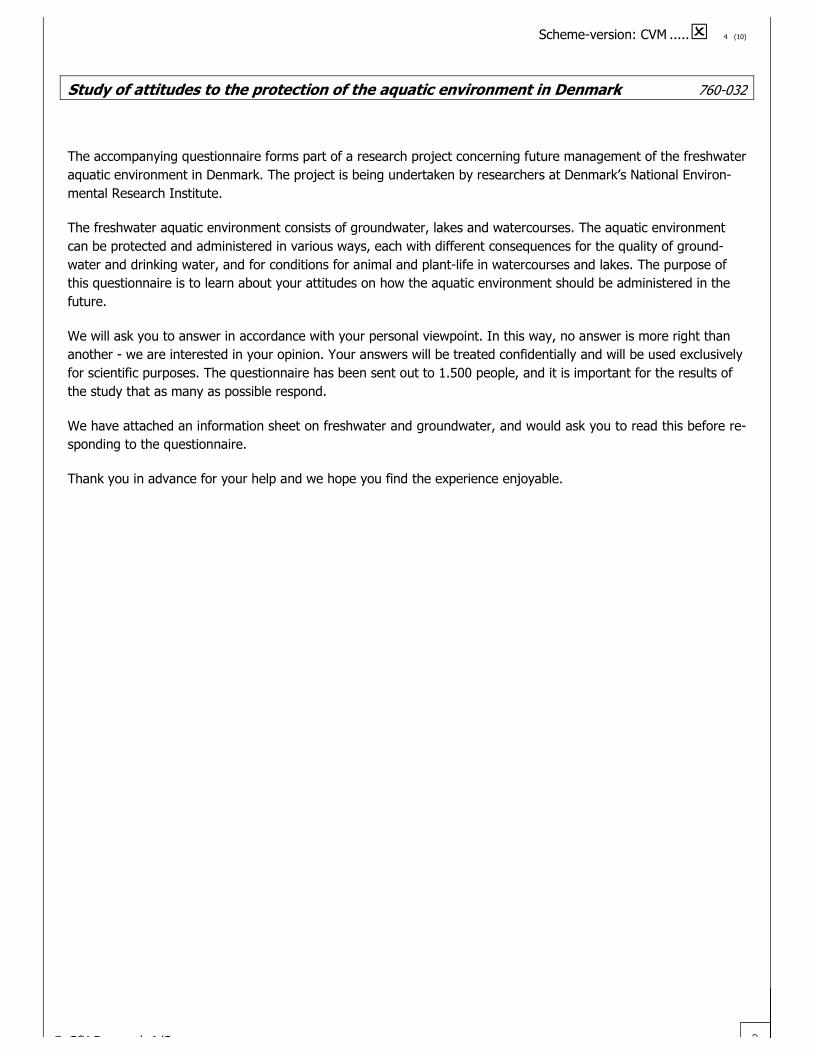
© GfK D k A/S 2
Scheme-version: CVM .....! 4 (10)
Study of attitudes to the protection of the aquatic environment in Denmark 760-032
The accompanying questionnaire forms part of a research project concerning future management of the freshwateraquatic environment in Denmark. The project is being undertaken by researchers at Denmark�s National Environ-mental Research Institute.
The freshwater aquatic environment consists of groundwater, lakes and watercourses. The aquatic environmentcan be protected and administered in various ways, each with different consequences for the quality of ground-water and drinking water, and for conditions for animal and plant-life in watercourses and lakes. The purpose ofthis questionnaire is to learn about your attitudes on how the aquatic environment should be administered in thefuture.
We will ask you to answer in accordance with your personal viewpoint. In this way, no answer is more right thananother - we are interested in your opinion. Your answers will be treated confidentially and will be used exclusivelyfor scientific purposes. The questionnaire has been sent out to 1.500 people, and it is important for the results ofthe study that as many as possible respond.
We have attached an information sheet on freshwater and groundwater, and would ask you to read this before re-sponding to the questionnaire.
Thank you in advance for your help and we hope you find the experience enjoyable.

© GfK D k A/S 3
.Question 1: Attitudes to the environment .
1.1 Below is a range of statements on the aquatic environment in Denmark. On a scale of 1-6, please reveal howfar you are in agreement or disagreement with the statement. You can use the figures in between to gradateyour response- Please mark with just one cross in each line
Completely disagree Neither/nor Agree completely Do not know .K01.
Protection of the aquatic environmentis one of the most importanttasks in environmental policy.......� 1 � 2 � 3 � 4 � 5 � 6 (11)
Tap water does not have to bedrinking water. Bottled drinkingwater can be bought ....................� 1 � 2 � 3 � 4 � 5 � 6 (12)
Pesticide pollution is a significantthreat against the quality ofdrinking water in Denmark.............� 1 � 2 � 3 � 4 � 5 � 6 (13)
Nitrogen pollution is a significantthreat against the quality ofdrinking water in Denmark.............� 1 � 2 � 3 � 4 � 5 � 6 (14)
Drinking water does not have tocome from non-treatedgroundwater; treated wateris just as good ............................� 1 � 2 � 3 � 4 � 5 � 6 (15)
Watercourses and lakes shouldhave a rich and natural animal andplant-life ....................................� 1 � 2 � 3 � 4 � 5 � 6 (16)
Drinking water is clean in Denmark.� 1 � 2 � 3 � 4 � 5 � 6 (17)
Problems of pollution of the aquaticenvironment are exaggerated ........� 1 � 2 � 3 � 4 � 5 � 6 (18)
The authorities should use moreresources to protect the aquaticenvironment than they do now.......� 1 � 2 � 3 � 4 � 5 � 6 (19)
. Question 2: Your water consumption .
2.1 Do you/does anyone in your household buy bottled water (spring-water or the like (not sparkling)) as an al-ternative to drinking water from the tap?- Only one response, please
Always .................................................................................................................................� 1 (20)
Often ...................................................................................................................................� 2
Rarely .................................................................................................................................� 3
Never.............................................................................................. → Go to Q. 2.3............� 4
Do not know ................................................................................... → Go to Q. 2.3............� 5
2.2 If/when you/anyone in your household buy(s) bottled water, why is this?- You may give more than one response
It tastes better .....................................................................................................................� 1 (21-27)
It is not polluted...................................................................................................................� 2
It is healthier due to the mineral content, etc. ........................................................................� 3
It comes in handy packaging.................................................................................................� 4
I do not have access to tap water (e.g. when I am out shopping) ...........................................� 5
Other...................................................................................................................................� 6
Do not know ........................................................................................................................� 7

© GfK D k A/S 4
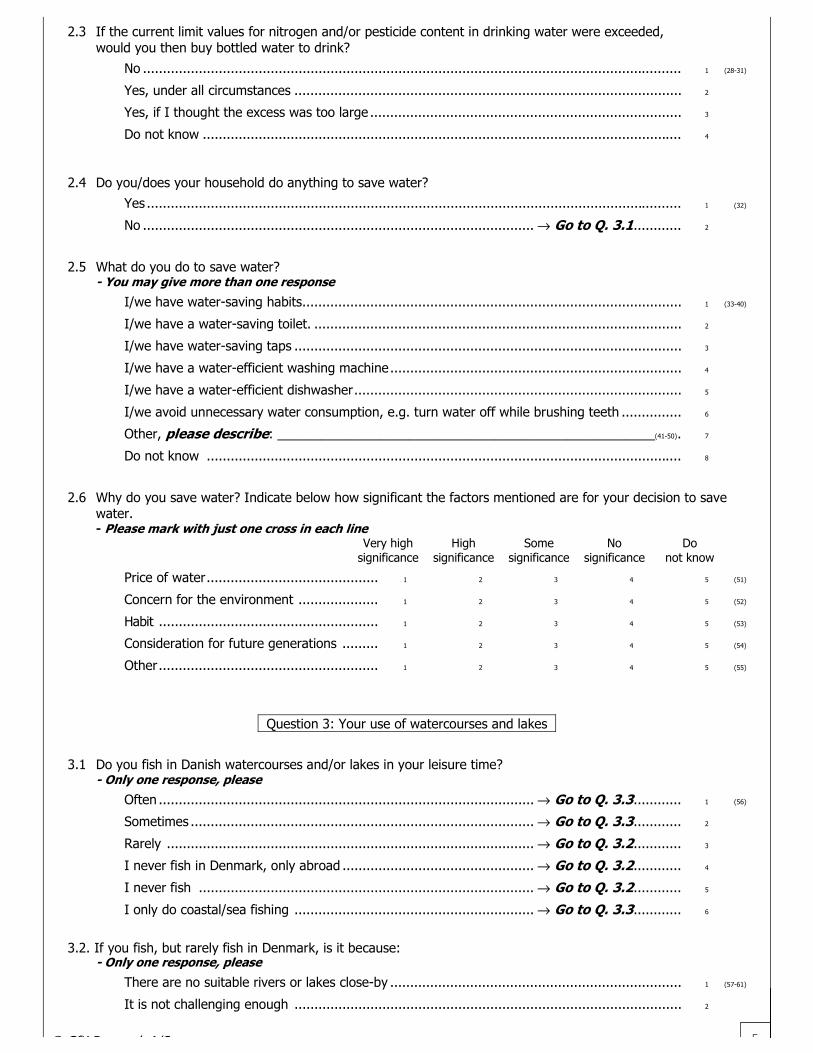
© GfK D k A/S 5
2.3 If the current limit values for nitrogen and/or pesticide content in drinking water were exceeded,would you then buy bottled water to drink?
No .......................................................................................................................................� 1 (28-31)
Yes, under all circumstances .................................................................................................� 2
Yes, if I thought the excess was too large ..............................................................................� 3
Do not know ........................................................................................................................� 4
2.4 Do you/does your household do anything to save water?
Yes ......................................................................................................................................� 1 (32)
No .................................................................................................. → Go to Q. 3.1............� 2
2.5 What do you do to save water?- You may give more than one response
I/we have water-saving habits...............................................................................................� 1 (33-40)
I/we have a water-saving toilet. ............................................................................................� 2
I/we have water-saving taps .................................................................................................� 3
I/we have a water-efficient washing machine.........................................................................� 4
I/we have a water-efficient dishwasher..................................................................................� 5
I/we avoid unnecessary water consumption, e.g. turn water off while brushing teeth ...............� 6
Other, please describe: ____________________________________________________(41-50).� 7
Do not know .......................................................................................................................� 8
2.6 Why do you save water? Indicate below how significant the factors mentioned are for your decision to savewater.- Please mark with just one cross in each line
Very high High Some No Dosignificance significance significance significance not know
Price of water...........................................� 1 � 2 � 3 � 4 � 5 (51)
Concern for the environment ....................� 1 � 2 � 3 � 4 � 5 (52)
Habit .......................................................� 1 � 2 � 3 � 4 � 5 (53)
Consideration for future generations .........� 1 � 2 � 3 � 4 � 5 (54)
Other.......................................................� 1 � 2 � 3 � 4 � 5 (55)
. Question 3: Your use of watercourses and lakes .
3.1 Do you fish in Danish watercourses and/or lakes in your leisure time?- Only one response, please
Often .............................................................................................. → Go to Q. 3.3............� 1 (56)
Sometimes ...................................................................................... → Go to Q. 3.3............� 2
Rarely ............................................................................................ → Go to Q. 3.2............� 3
I never fish in Denmark, only abroad ................................................ → Go to Q. 3.2............� 4
I never fish .................................................................................... → Go to Q. 3.2............� 5
I only do coastal/sea fishing ............................................................ → Go to Q. 3.3............� 6
3.2. If you fish, but rarely fish in Denmark, is it because:- Only one response, please
There are no suitable rivers or lakes close-by .........................................................................� 1 (57-61)
It is not challenging enough .................................................................................................� 2

© GfK D k A/S 6
I do not have time to fish that often .....................................................................................� 3
I am not interested in fishing ................................................................................................� 4
Other ..................................................................................................................................� 5

© GfK D k A/S 7
3.3 Do you bathe in Danish watercourses and/or lakes?- Only one response, please
Often .............................................................................................. → Go to Q. 4.1............� 1 (62)
Sometimes ...................................................................................... → Go to Q. 4.1............� 2
Rarely ............................................................................................. → Go to Q. 3.4............� 3
I never bathe in freshwater ............................................................. → Go to Q. 3.4............� 4
I do not bathe ................................................................................ → Go to Q. 3.4............� 5
3.4. If you rarely or never bathe, is it because:- Only one response, please
There are no suitable rivers or lakes close-by .........................................................................� 1 (63-67)
Water quality is too poor.......................................................................................................� 2
Bottom conditions are poor ..................................................................................................� 3
I do not have time to bathe more often .................................................................................� 4
Other...................................................................................................................................� 5
. Question 4: Your water supply .
4.1 Where does your household�s water come from?- Only one response, please
Council water supply.............................................................................................................� 1 (68)
Private, communal supply ....................................................................................................� 2
Private borehole ..................................................................................................................� 3
Other...................................................................................................................................� 4
Do not know .......................................................................................................................� 5
4.2 Do you know approximately how many cubic metres (1.000 litres) of water your household uses in a year?
Yes .....................................................................................................................................� 1 (69)
No .......................................................................................................................................� 2
4.3 If yes, please state your annual consumption in cubic metres here: .......................... (70-73)
4.4 Do you know how big your household�s annual water bill is?- Only one response, please
Yes, it is less than 1.500 kr. . ................................................................................................� 1 (74)
Yes, it is between 1.500 and 4.000 kr.. ..................................................................................� 2
Yes, it is between 4.000 and 6.000 kr.. ..................................................................................� 3
Yes, it is over 6.000 kr. .........................................................................................................� 4
No, I do not know/cannot remember ....................................................................................� 5
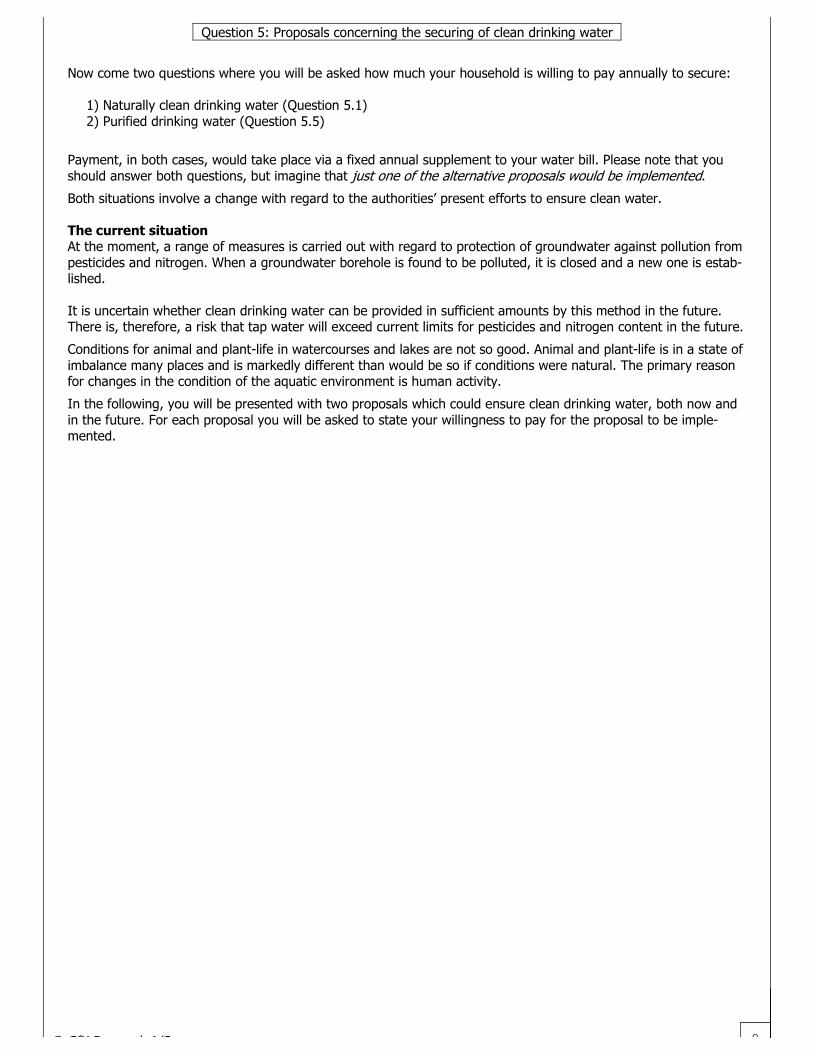
© GfK D k A/S 8
. Question 5: Proposals concerning the securing of clean drinking water .
Now come two questions where you will be asked how much your household is willing to pay annually to secure:
1) Naturally clean drinking water (Question 5.1)2) Purified drinking water (Question 5.5)
Payment, in both cases, would take place via a fixed annual supplement to your water bill. Please note that youshould answer both questions, but imagine that just one of the alternative proposals would be implemented.
Both situations involve a change with regard to the authorities� present efforts to ensure clean water.
The current situationAt the moment, a range of measures is carried out with regard to protection of groundwater against pollution frompesticides and nitrogen. When a groundwater borehole is found to be polluted, it is closed and a new one is estab-lished.
It is uncertain whether clean drinking water can be provided in sufficient amounts by this method in the future.There is, therefore, a risk that tap water will exceed current limits for pesticides and nitrogen content in the future.
Conditions for animal and plant-life in watercourses and lakes are not so good. Animal and plant-life is in a state ofimbalance many places and is markedly different than would be so if conditions were natural. The primary reasonfor changes in the condition of the aquatic environment is human activity.
In the following, you will be presented with two proposals which could ensure clean drinking water, both now andin the future. For each proposal you will be asked to state your willingness to pay for the proposal to be imple-mented.

© GfK D k A/S 9
5.1. Proposal to secure naturally clean drinking water
By carrying out measures, primarily in agriculture, naturally clean drinking water can be secured both now and inthe future. At the same time, very good conditions can be secured for animal and plant-life in watercourses andlakes. This means that animal and plant-life will be more natural, varied and balanced, and affected by human ac-tivity to only a slight to average degree.
It is assumed that the Danish consumer should cover the costs of implementing the proposal. This will take placein the form of a fixed annual sum per household claimed once a year via the water bill.
What is the maximum price that your household would be willing to pay for this type of groundwater protection?
Please remember, if the measures are not implemented, there is a risk that tap water will exceed the limit valueswith regard to pesticide and nitrogen content, and that conditions for animal and plant-life in watercourses andlakes will be less good.
On the scale below, you are asked to mark with a cross the highest of the sums listed that your household wouldbe willing to pay annually for implementation of the proposal. Please give only one response and note that the sumyou put your cross by represents a supplement in excess of that sum you pay for water at the moment.
Before you mark your response, we would like to draw your attention to that similar studies reveal that peopletend to overestimate what they are willing to pay when responding to questions in studies like this one. You are,therefore, asked to consider fully how much your household would actually be willing, and able, to pay with the in-come you have at your disposal at the moment.
Annual sum per household?- Only one response, please .K02.
0 kr. ...................................................................................................................................� 01 (11-12)
100 kr..................................................................................................................................� 02
300 kr..................................................................................................................................� 03
450 kr..................................................................................................................................� 04
625 kr..................................................................................................................................� 05
800 kr..................................................................................................................................� 06
1.050 kr. ..............................................................................................................................� 07
1.200 kr. ..............................................................................................................................� 08
1.700 kr. ..............................................................................................................................� 09
2.400 kr. ..............................................................................................................................� 10
Other...................................................................................................................................� 11
Please state how much in kr.: ________________________________________________() ......� 12
I cannot respond to this question .........................................................................................� 13
I do not want to respond to this question ..............................................................................� 14
5.2. On a scale of 1-7 you are asked to indicate how certain/uncertain you are of the answer you gave in Question5.1. (1 is very uncertain and 7 is very certain). Please note that the degree of certainty does not haveany significance for the usefulness of your response. You can use the range of numbers to gradate your re-sponse.
Very uncertain Very certain
On my response, I feel very .............� 1 � 2 � 3 � 4 � 5 � 6 � 7 (13)

© GfK D k A/S 10
If you indicated 100 kr. or more in Question 5.1 � otherwise go to Q. 5.45.3 Please indicate the reasoning behind your choice of sum in Question 5.1 concerning the securing of naturally
clean drinking water- You may give more than one response
It was the highest sum I could afford ...................................................................................� 01 (14-37)
Clean drinking water is important to me and, therefore, I would willingly pay to ensure clean drinking water sup-plies ....................................................................................................................................� 02
Clean groundwater is important to me and, therefore, I would willingly pay to secure clean groundwater. ..........................................................................................................................................� 03
Clean groundwater is important to plant and animal-life and therefore, I would willingly pay to secure cleangroundwater..........................................................................................................................� 04
Clean groundwater is important to future generations and therefore, I would willingly pay to secure cleangroundwater..........................................................................................................................� 05
I wanted to express my interest in ensuring a healthy and clean environment .........................� 06
Securing clean water is an important task and, by indicating a high sum, I hope to contribute to that soonsomething might be done about this issue .................................................................................� 07
I indicated the sum I would wish I had at my disposal to pay to secure clean drinking water ....� 08
I did not know how else I should respond .............................................................................� 09
I set a sum taking into consideration what I pay for other things ............................................� 10
Other ..................................................................................................................................� 11
Do not know .......................................................................................................................� 12
If you indicated 0 kr. or could not/did not want to respond to Question 5.1 � otherwise go to Q.5.5
5.4 Please indicate the reason(s) for why you responded as you did in Question 5.1 concerning the securing ofnaturally clean drinking water- You may give more than one response
At the moment I cannot afford to pay more for water than I already do ..................................� 01 (38-61)
It is of no significance to me if limit values for pesticides and/or nitrogen content in drinking water areexceeded .............................................................................................................................� 02
It is of no significance to me if limit values for pesticides and/or nitrogen content in groundwater are ex-ceeded.................................................................................................................................� 03
It is of no significance to me whether conditions for animal and plant-life in watercourses and lakes areimproved or not....................................................................................................................� 04
It is not my responsibility to pay for clean water.....................................................................� 05
The public sector or the water companies should pay to secure clean water.............................� 06
Those, who pollute the water should pay to secure clean water in future .................................� 07
I need more information to be able to respond to questions such as these...............................� 08
I did not know how I should respond.....................................................................................� 09
What I would pay to secure clean water is not a concern for others.........................................� 10
Other...................................................................................................................................� 11
Do not know ........................................................................................................................� 12

© GfK D k A/S 11
5.5 Proposal to treat waterVia treatment of polluted groundwater, pesticide and nitrogen residue can be removed, so that the treated watercan be used as water for drinking and other purposes. In this way, clean drinking water can be provided both nowand in the future. In contrast with the previous proposal, however, groundwater is not protected from pollutionwith pesticides and nitrogen. Implementation of the treatment proposal will not involve improvements in conditionsfor animal and plant-life in watercourses and lakes, therefore, conditions will remain less than good. This meansthat animal and plant-life in watercourses and lakes will be markedly different than would be so under natural con-ditions and will be in slight imbalance.
As previously, the costs connected with implementation of the proposal are to be covered by the Danish consumerin the form of a fixed annual sum per household charged via the water bill.
What is the maximum price that your household would be willing to pay for treatment of groundwater so that itcould be used for drinking water?
Please remember that if treatment is not implemented there is a risk that water in the taps will exceed the limitvalues with regard to pesticide and nitrogen content.
On the scale below, you are asked to mark with a cross the highest of the sums listed that your household wouldbe willing to pay annually for implementation of the proposal. Please give only one response and note that the sumyou put your cross by represents a supplement in excess of that sum you pay for water at the moment. Before in-dicating your choice, please consider fully how much your household would actually be willing, and able, to paywith the income you have at your disposal at the moment.
How much would you be willing to pay for drinking water from polluted groundwater to be treated and used asdrinking water?
Annual sum per household- Only one response, please
0 kr. ....................................................................................................................................� 01 (62-63)
100 kr..................................................................................................................................� 02
300 kr..................................................................................................................................� 03
450 kr..................................................................................................................................� 04
625 kr..................................................................................................................................� 05
800 kr..................................................................................................................................� 06
1.050 kr. ..............................................................................................................................� 07
1.200 kr. ..............................................................................................................................� 08
1.700 kr. ..............................................................................................................................� 09
2.400 kr. ..............................................................................................................................� 10
Other ..................................................................................................................................� 11
Please state how much in kr.:________________________________________________(64-78)...� 12
I cannot answer this question ...............................................................................................� 13
I do not want to respond to this question ..............................................................................� 14
If I were to agree to treatment of groundwater, I would want to be compensated in the form of cheaperwater...................................................................................................................................� 15
5.6. On a scale of 1-7 you are asked to indicate how certain/uncertain you are of the answer you gave in Question5.5. (1 is very uncertain and 7 is very certain). Please note that the degree of certainty does not haveany significance for the usefulness of your response. You can use the range of numbers to gradate your re-sponse.
Very uncertain Very certain
On my response, I feel.....................� 1 � 2 � 3 � 4 � 5 � 6 � 7 (79)

© GfK D k A/S 12
If you indicated 100 kr. or more in Question 5.5 � otherwise go to Q. 5.85.7 Please indicate the reasoning behind your choice of sum in Question 5.5 concerning the treatment of drinking
water- You may give more than one response .K03.
It was the highest sum I could afford ...................................................................................� 1 (11-19)
Clean drinking water is important to me and, therefore, I would willingly pay to ensure clean drinking water
supplies ...............................................................................................................................� 2
Securing clean water is an important task and by indicating a high sum, I hope to contribute to that soonsomething might be done about this issue .................................................................................� 3
I indicated the sum I would wish I had at my disposal to pay to secure clean drinking water ....� 4
I did not know how else I should respond. .............................................................................� 5
I set a sum taking into consideration what I pay for other things.............................................� 6
I chose a lower sum than in Question 5.1, as I do not think as much of the proposed alternative inQuestion 5.5 as of that in Question 5.1. .................................................................................� 7
Other...................................................................................................................................� 8
Do not know ........................................................................................................................� 9
If you indicated 0 kr. or could not/did not want to respond to Question 5.5 � otherwise go to Q.5.9
5.8 Please indicate the reason(s) why you responded as you did in Question 5.5 concerning the treatment ofdrinking water- You may give more than one response
At the moment I cannot afford to pay more for water than I already do ..................................� 01 (20-41)
It is of no significance to me if limit values for pesticides and/or nitrogen content in drinking water areexceeded .............................................................................................................................� 02
I regard treated water as inferior in relation to the drinking water I have now..........................� 03
It is not my responsibility to pay for clean water.....................................................................� 04
The public sector or the water companies should pay to secure clean water.............................� 05
Those, who pollute the water should pay to secure clean water in future .................................� 06
I need more information to be able to respond to questions such as these...............................� 07
I did not know how I should respond.....................................................................................� 08
What I would pay to secure clean water is not a concern for others.........................................� 09
Other...................................................................................................................................� 10
Do not know ........................................................................................................................� 11
If in response to Question 5.5 you indicated that you would want compensation - otherwise goto Question 5.10.
5.9 Please indicate how large a sum the household water bill is to be reduced by, before you would accept treatedwater rather than naturally clean drinking water. The annual water bill should be reduced by:- Only one response, please
100 kr..................................................................................................................................� 01 (42-43)
300 kr..................................................................................................................................� 02
450 kr..................................................................................................................................� 03
625 kr..................................................................................................................................� 04
800 kr..................................................................................................................................� 05
1.050 kr. ..............................................................................................................................� 06
1.200 kr. ..............................................................................................................................� 07
1.700 kr. ..............................................................................................................................� 08
2.400 kr. ..............................................................................................................................� 09
More....................................................................................................................................� 10

© GfK D k A/S 13
Do not know ........................................................................................................................� 11

© GfK D k A/S 14
5.10 On what grounds would you demand compensation?- Mark with a cross the statement(s) that best describe why you would demand compensation
The aquatic environment � i.e. animal and plant-life � is not protected under the treatmentalternative............................................................................................................................� 1 (44-50)
I think it is unhealthy to drink treated water...........................................................................� 2
The thought of drinking water that has been polluted is disagreeable ......................................� 3
The sum I indicated equates to the disadvantages I think are associated with treated rather than natu-rally clean water ...................................................................................................................� 4
I do not feel that tap water should be treated, therefore, I indicated a very high sum .........................� 5
Other ....................................................................................................................................................� 6
Do not know ........................................................................................................................� 7
5.11. If the water that came out of your tap was water treated to remove nitrogen and pesticides (rather thanclean groundwater), would you use it as drinking water?
Yes ......................................................................................................................................� 1 (51)
No .......................................................................................................................................� 2
. Question 6: Information .
6.1. Were you familiar with the information in the information sheet before you received this questionnaire?
Absolutely not at all ..............................................................................................................� 1 (52)
Not familiar ..........................................................................................................................� 2
Familiar................................................................................................................................� 3
Very familiar.........................................................................................................................� 4
Do not know ........................................................................................................................� 5
6.2. Where do you have your information on groundwater and drinking water from?- You may give more than one response
Local council/County council..................................................................................................� 1 (53-59)
Water companies..................................................................................................................� 2
Denmark�s governmental Environmental Protection Agency.....................................................� 3
Press/media .........................................................................................................................� 4
From my education/my work.................................................................................................� 5
From campaigns ...................................................................................................................� 6
Other...................................................................................................................................� 7
�Question 7: The water in your local area .
7.1 Have you ever noticed problems with the quality of your drinking water?
Yes ......................................................................................................................................� 1 (60)
No .......................................................................................................................................� 2

© GfK D k A/S 15
�Background questions .
Sex .K04.
Male ....................................................................................................................................� 1 (11)
Female.................................................................................................................................� 2
AgeWhen were you born?
Month ........................................................................................................................ (12-13)
- Put e.g. , if the respondent is born in March
Year .............................................................................................................. (14-17)
LocationWhat local authority area do you live in?- State name of local authority:______________________________________
Size of householdHow many adults, i.e. 18 years or above live in the household in total ......................................... (26)
Is there a child/are there children in the household?- If yes: How old is/are the child/children? Boy Girl Age
1. child..............................................................� 1 � 2 (71) ________year(s) (72-73)
2. child..............................................................� 1 � 2 (74) ________year(s) (75-76)
3. child..............................................................� 1 � 2 (77) ________year(s) (78-79)
4. child..............................................................� 1 � 2 (80) ________year(s) (81-82)
No, there are no children in the household.............................................................................� 1 (83)
How may people, i.e. adults and children, live in the household in total .................................. (30-31)
ResidenceWhat type of residence do you live in?
Terraced house/cluster housing.............................................................................................� 1 (37)
Apartment/apartment block...................................................................................................� 2
Detached one-family house ...................................................................................................� 3
Farm property ......................................................................................................................� 4
Other...................................................................................................................................� 5
IncomeWhat size is the family�s collective yearly gross income? - This should be income before any tax deduc-tions
Under 50000 kr. ...................................................................................................................� 01 (40-41)
Kr. 50.000 - 99.999 ..............................................................................................................� 02
Kr. 100.000 - 149.999...........................................................................................................� 03
Kr. 150.000 - 199.999...........................................................................................................� 04
Kr. 200.000 - 249.999...........................................................................................................� 05
Kr. 250.000 - 299.999...........................................................................................................� 06
Kr. 300.000 - 349.999...........................................................................................................� 07
Kr. 350.000 - 399.999...........................................................................................................� 08
Kr. 400.000 - 449.999...........................................................................................................� 09
Kr. 450.000 - 499.999...........................................................................................................� 10
Kr. 500.000 - 749.999...........................................................................................................� 11
91
0 3

© GfK D k A/S 16
Kr. 750.000 - 999.999...........................................................................................................� 13
Kr. 1.000.000 or above .........................................................................................................� 14

© GfK D k A/S 17
What is your own yearly gross income? - This should be income before any tax deductions
Under 50.000 kr. ..................................................................................................................� 01 (57-58)
Kr. 50.000 - 99.999 ..............................................................................................................� 02
Kr. 100.000 - 149.999...........................................................................................................� 03
Kr. 150.000 - 199.999...........................................................................................................� 04
Kr. 200.000 - 249.999...........................................................................................................� 05
Kr. 250.000 - 299.999...........................................................................................................� 06
Kr. 300.000 - 349.999...........................................................................................................� 07
Kr. 350.000 - 399.999...........................................................................................................� 08
Kr. 400.000 - 449.999...........................................................................................................� 09
Kr. 450.000 - 499.999...........................................................................................................� 10
Kr. 500.000 - 749.999...........................................................................................................� 11
Kr. 750.000 - 999.999...........................................................................................................� 13
Kr. 1.000.000 or above .........................................................................................................� 14
EducationPlease indicate your most recent education?
Education finished at 14-15 years old without continuing education(e.g. 7th, 8th or 9th class) .......................................................................................................� 1 (42)
Education finished at 16-19 years old without continuing education(e.g. 10th class, lower secondary school-leaving exam, higher secondary school-leaving exam or equiva-lent, apprenticeship training, etc.) .........................................................................................� 2
Medium-length further education (e.g. teacher training college/technical schoolor equivalent).......................................................................................................................� 3
Longer-term education in an institution of higher education(e.g. university, technical college, dentist college, business school, etc.) ..................................� 4
Currently studying ................................................................................................................� 5
OccupationWhat is your occupation?
Unskilled worker ...................................................................................................................� 01 (48-49)
Skilled worker.......................................................................................................................� 02
Non-managerial employee/civil servant ..................................................................................� 11
Managerial-level employee/civil servant .................................................................................� 12
Independent farmer..............................................................................................................� 04
Independent retailer/craftsperson..........................................................................................� 05
Independent professional......................................................................................................� 06
Apprentice/student/trainee....................................................................................................� 07
Housewife/assisting spouse...................................................................................................� 08
Retired.................................................................................................................................� 09
Unemployed.........................................................................................................................� 10
The questionnaire is now finished � thank you for your help!

© GfK D k A/S 18
Scheme-version: CE.....! 4 (10)
Study of attitudes to the protection of the aquatic environment in Denmark 760-032
The accompanying questionnaire forms part of a research project concerning future management of the freshwateraquatic environment in Denmark. The project is being undertaken by researchers at Denmark�s National Environ-mental Research Institute.
The freshwater aquatic environment consists of groundwater, lakes and watercourses. The aquatic environmentcan be protected and administered in various ways, each with different consequences for the quality of ground-water and drinking water, and for conditions for animal and plant-life in watercourses and lakes. The purpose ofthis questionnaire is to learn about your attitudes on how the aquatic environment should be administered in thefuture.
We will ask you to answer in accordance with your personal viewpoint. In this way, no answer is more right thananother - we are interested in your opinion. Your answers will be treated confidentially and will be used exclusivelyfor scientific purposes. The questionnaire has been sent out to 1.500 people, and it is important for the results ofthe study that as many as possible respond.
We have attached an information sheet on freshwater and groundwater, and would ask you to read this before re-sponding to the questionnaire.
Thank you in advance for your help and we hope you find the experience enjoyable.

© GfK D k A/S 19
.Question 1: Attitudes to the environment .
1.1 Below is a range of statements on the aquatic environment in Denmark. On a scale of 1-6, please reveal howfar you are in agreement or disagreement with the statement. You can use the figures in between to gradateyour response- Please mark with just one cross in each line
Completely disagree Neither/nor Agree completely Do not know .K01.
Protection of the aquatic environmentis one of the most importanttasks in environmental policy.......� 1 � 2 � 3 � 4 � 5 � 6 (11)
Tap water does not have to bedrinking water. Bottled drinkingwater can be bought ....................� 1 � 2 � 3 � 4 � 5 � 6 (12)
Pesticide pollution is a significantthreat against the quality ofdrinking water in Denmark.............� 1 � 2 � 3 � 4 � 5 � 6 (13)
Nitrogen pollution is a significantthreat against the quality ofdrinking water in Denmark.............� 1 � 2 � 3 � 4 � 5 � 6 (14)
Drinking water does not have tocome from non-treatedgroundwater; treated wateris just as good ............................� 1 � 2 � 3 � 4 � 5 � 6 (15)
Watercourses and lakes shouldhave a rich and natural animal andplant-life ....................................� 1 � 2 � 3 � 4 � 5 � 6 (16)
Drinking water is clean in Denmark.� 1 � 2 � 3 � 4 � 5 � 6 (17)
Problems of pollution of the aquaticenvironment are exaggerated ........� 1 � 2 � 3 � 4 � 5 � 6 (18)
The authorities should use moreresources to protect the aquaticenvironment than they do now.......� 1 � 2 � 3 � 4 � 5 � 6 (19)
. Question 2: Your water consumption .
2.1 Do you/does anyone in your household buy bottled water (spring-water or the like (not sparkling)) as an al-ternative to drinking water from the tap?- Only one response, please
Always .................................................................................................................................� 1 (20)
Often ...................................................................................................................................� 2
Rarely .................................................................................................................................� 3
Never.............................................................................................. → Go to Q. 2.3............� 4
Do not know ................................................................................... → Go to Q. 2.3............� 5
2.2 If/when you/anyone in your household buy(s) bottled water, why is this?- You may give more than one response
It tastes better .....................................................................................................................� 1 (21-27)
It is not polluted...................................................................................................................� 2
It is healthier due to the mineral content, etc. ........................................................................� 3
It comes in handy packaging.................................................................................................� 4
I do not have access to tap water (e.g. when I am out shopping) ...........................................� 5
Other...................................................................................................................................� 6
Do not know ........................................................................................................................� 7

© GfK D k A/S 20

© GfK D k A/S 21
2.3 If the current limit values for nitrogen and/or pesticide content in drinking water were exceeded,would you then buy bottled water to drink?
No .......................................................................................................................................� 1 (28-31)
Yes, under all circumstances .................................................................................................� 2
Yes, if I thought the excess was too large ..............................................................................� 3
Do not know ........................................................................................................................� 4
2.4 Do you/does your household do anything to save water?
Yes ......................................................................................................................................� 1 (32)
No .................................................................................................. → Go to Q. 3.1............� 2
2.5 What do you do to save water?- You may give more than one response
I/we have water-saving habits...............................................................................................� 1 (33-40)
I/we have a water-saving toilet. ............................................................................................� 2
I/we have water-saving taps .................................................................................................� 3
I/we have a water-efficient washing machine.........................................................................� 4
I/we have a water-efficient dishwasher..................................................................................� 5
I/we avoid unnecessary water consumption, e.g. turn water off while brushing teeth ...............� 6
Other, please describe: ____________________________________________________(41-50).� 7
Do not know .......................................................................................................................� 8
2.6 Why do you save water? Indicate below how significant the factors mentioned are for your decision to savewater.- Please mark with just one cross in each line
Very high High Some No Dosignificance significance significance significance not know
Price of water...........................................� 1 � 2 � 3 � 4 � 5 (51)
Concern for the environment ....................� 1 � 2 � 3 � 4 � 5 (52)
Habit .......................................................� 1 � 2 � 3 � 4 � 5 (53)
Consideration for future generations .........� 1 � 2 � 3 � 4 � 5 (54)
Other.......................................................� 1 � 2 � 3 � 4 � 5 (55)
. Question 3: Your use of watercourses and lakes .
3.1 Do you fish in Danish watercourses and/or lakes in your leisure time?- Only one response, please
Often .............................................................................................. → Go to Q. 3.3............� 1 (56)
Sometimes ...................................................................................... → Go to Q. 3.3............� 2
Rarely ............................................................................................ → Go to Q. 3.2............� 3
I never fish in Denmark, only abroad ................................................ → Go to Q. 3.2............� 4
I never fish .................................................................................... → Go to Q. 3.2............� 5
I only do coastal/sea fishing ............................................................ → Go to Q. 3.3............� 6
3.2. If you fish, but rarely fish in Denmark, is it because:- Only one response, please
There are no suitable rivers or lakes close-by .........................................................................� 1 (57-61)
It is not challenging enough .................................................................................................� 2

© GfK D k A/S 22
I do not have time to fish that often .....................................................................................� 3
I am not interested in fishing ................................................................................................� 4
Other ..................................................................................................................................� 5
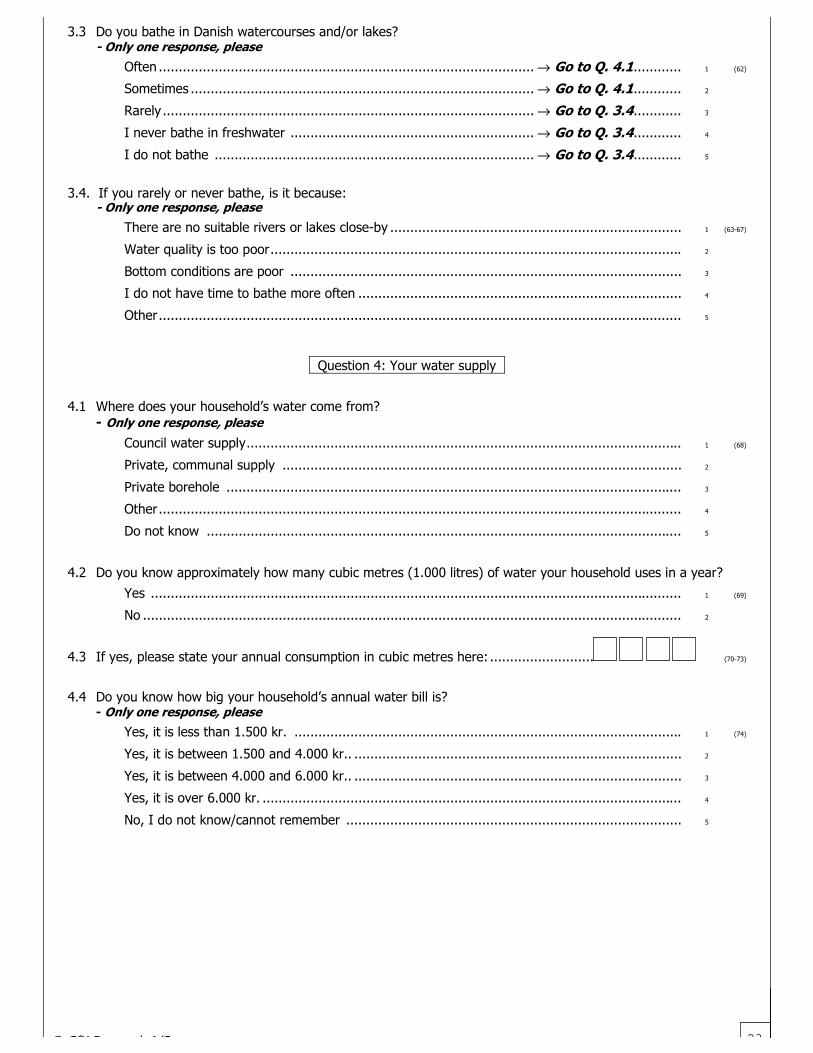
© GfK D k A/S 23
3.3 Do you bathe in Danish watercourses and/or lakes?- Only one response, please
Often .............................................................................................. → Go to Q. 4.1............� 1 (62)
Sometimes ...................................................................................... → Go to Q. 4.1............� 2
Rarely ............................................................................................. → Go to Q. 3.4............� 3
I never bathe in freshwater ............................................................. → Go to Q. 3.4............� 4
I do not bathe ................................................................................ → Go to Q. 3.4............� 5
3.4. If you rarely or never bathe, is it because:- Only one response, please
There are no suitable rivers or lakes close-by .........................................................................� 1 (63-67)
Water quality is too poor.......................................................................................................� 2
Bottom conditions are poor ..................................................................................................� 3
I do not have time to bathe more often .................................................................................� 4
Other...................................................................................................................................� 5
. Question 4: Your water supply .
4.1 Where does your household�s water come from?- Only one response, please
Council water supply.............................................................................................................� 1 (68)
Private, communal supply ....................................................................................................� 2
Private borehole ..................................................................................................................� 3
Other...................................................................................................................................� 4
Do not know .......................................................................................................................� 5
4.2 Do you know approximately how many cubic metres (1.000 litres) of water your household uses in a year?
Yes .....................................................................................................................................� 1 (69)
No .......................................................................................................................................� 2
4.3 If yes, please state your annual consumption in cubic metres here: .......................... (70-73)
4.4 Do you know how big your household�s annual water bill is?- Only one response, please
Yes, it is less than 1.500 kr. .................................................................................................� 1 (74)
Yes, it is between 1.500 and 4.000 kr.. ..................................................................................� 2
Yes, it is between 4.000 and 6.000 kr.. ..................................................................................� 3
Yes, it is over 6.000 kr. .........................................................................................................� 4
No, I do not know/cannot remember ....................................................................................� 5

© GfK D k A/S 24
. Question 5: Study of policy alternatives.
You will now be asked to choose between a range of policy alternatives concerning future management of theaquatic environment. The alternatives vary according to the consequences they hold for:
1. Drinking water quality2. Conditions for animal and plant-life in watercourse and lakes3. The size of your household�s water bill
1. Drinking water quality:The quality of drinking water in a given area will of course depend on more specific local conditions, however, thefollowing three quality levels can describe the general quality of Danish drinking water.
! Naturally clean: Measures aimed primarily at agricultural practices prevent groundwater pollution from pes-ticides and nitrogen. In this way, clean drinking water is secured both now and in the future.
! Uncertain: The current situation, i.e. groundwater is protected as it is at the moment, however, no furthermeasures to prevent pollution are introduced. When a groundwater borehole is found to be polluted it is closedand a new borehole is established. It is in this way that water authorities ensure a supply of clean drinkingwater for consumers today. It is uncertain whether sufficient supplies of clean drinking water can be providedin this way in future. There is, therefore, a risk that in future water from our taps will exceed current limit val-ues for pesticides and nitrogen.
! Treated: By cleaning polluted groundwater for pesticide and nitrogen residues, supplies of clean drinkingwater can be ensured both now and in the future.
2. Conditions for animal and plant-life in watercourse and lakes:Conditions for animal and plant-life in the aquatic environment are affected both by the natural physical conditionsand the degree of pollution. Conditions for animal and plant-life will, therefore, vary from place to place. The fol-lowing three quality levels characterise the conditions in Danish watercourses and lakes.
! Very good: Animal and plant-life is natural, varied and in balance. Slight to medium impact from human ac-tivity.
! Less good: Animal and plant-life is markedly different than would be the case under natural conditions and is,to a degree, in a state of imbalance. Representative of the current situation.
! Poor: Animal and plant-life is significantly different that would be the case under natural conditions and is in astate of serious imbalance. Often completely changed due to human activity.
3. Size of household water bill:It is assumed that the costs of implementing the policy alternatives are covered by the Danish consumer. We askyou to imagine that all consumers will contribute equally to implementation of the alternatives by means of a fixedannual sum per household, paid once a year via the water bill.
You will be asked to make 6 choices in total. Within each choice, you will be asked to choose between 3 alternativepolicy measures, which vary according to the quality of the drinking water, conditions for animal and plant-life inlakes and watercourses, as well as the price of drinking water. The price for each individual policy alternative isstated in the form of a fixed annual sum to be paid via the water bill.
Please note that the amount stated represents a sum over and above the sum which you pay for water at the mo-ment. Furthermore, please note that Alternative 1 in each of the 6 choices represents continuation of current pol-icy.
Before you make your choice, we ask you to study all 3 alternatives carefully. Results from similar studies haveshown that people have a tendency to over-estimate how much they are actually willing to pay for implementationof the various policy measures. Before you mark your selection, therefore, we would ask you to be totally sure thatyou are willing and able to pay the stated sum associated with an alternative.
Please continue to make your choices now - we hope you find the experience enjoyable.

© GfK D k A/S 25
Choice 1. Alternative 1 Alternative 2 Alternative 3 .K02.
Drinking water: Uncertain Naturally clean Treated
Animal and plant-lifein watercourses andlakes:
Less good Very good Less good
Annual increase inwater bill per house-hold:
0 kr. 2.400 kr. 625 kr.
I would prefer (pleasemark with a cross): � 1 � 2 � 3
(11)
Choice 2.Alternative 1 Alternative 2 Alternative 3
Drinking water: Uncertain Uncertain Naturally clean
Animal and plant-lifein watercourses andlakes:
Less good Very good Less good
Annual increase inwater bill per house-hold:
0 kr. 1.700 kr. 300 kr.
I would prefer (pleasemark with a cross): � 1 � 2 � 3
(12)
Choice 3.Alternative 1 Alternative 2 Alternative 3
Drinking water: Uncertain Treated Naturally clean
Animal and plant-lifein watercourses andlakes:
Less good Very good Poor
Annual increase inwater bill per house-hold:
0 kr. 0 kr. 1.050 kr.
I would prefer (pleasemark with a cross): � 1 � 2 � 3
(13)

© GfK D k A/S 26
Choice 4.Alternative 1 Alternative 2 Alternative 3
Drinking water: Uncertain Uncertain Treated
Animal and plant-lifein watercourses andlakes:
Less good Very good Less good
Annual increase inwater bill per house-hold:
0 kr. 1.050 kr. 1.700 kr.
I would prefer (pleasemark with a cross): � 1 � 2 � 3
(14)
________________________________________________________________________________
Choice 5.Alternative 1 Alternative 2 Alternative 3
Drinking water: Uncertain Treated Naturally clean
Animal and plant-lifein watercourses andlakes:
Less good Less good Poor
Annual increase inwater bill per house-hold:
0 kr. 1.050 kr. 300 kr.
I would prefer (pleasemark with a cross): � 1 � 2 � 3
(15)
Choice 6.Alternative 1 Alternative 2 Alternative 3
Drinking water: Uncertain Treated Naturally clean
Animal and plant-lifein watercourses andlakes:
Less good Very good Less good
Annual increase inwater bill per house-hold:
0 kr. 300 kr. 2.400 kr.
I would prefer (pleasemark with a cross): � 1 � 2 � 3
(16)
.S Question 6: Follow-up to question 5 .
6.1. Did you find it difficult to make the choices in Question 5?
Yes ......................................................................................................................................� 1 (17)
No .......................................................................................................................................� 2
6.2. If yes, what made the choices hard?- Mark with one or more crosses
I could not relate to the questions .........................................................................................� 1 (18-25)
I think there was too much information to consider ................................................................� 2

© GfK D k A/S 27
I did not understand the questions ........................................................................................� 3
I think the alternatives were too expensive ............................................................................� 4
It was difficult to choose as several factors were important.....................................................� 5
In principle I do not think that consumers should pay to ensure clean water anda healthy aquatic environment ..............................................................................................� 6
Other...................................................................................................................................� 7
Do not know ........................................................................................................................� 8
6.3. On a scale of 1-7 please indicate how certain/uncertain you are of the choices you made in Question 5 (1 isvery uncertain and 7 is very certain). The degree of certainty/uncertainty does not have any conse-quences for the usefulness of your answers. You can use the range of figures to grade your answer.
Very uncertain Very certain
On my answers, I feel......................� 1 � 2 � 3 � 4 � 5 � 6 � 7 (26)
6.4. Please mark with a cross below the item you put greatest weight on in your choices in Question 5.- Please enter only one cross
Drinking water......................................................................................................................� 1 (27)
Animal and plant-life in watercourses and lakes......................................................................� 2
Size of annual increase in water bill .......................................................................................� 3
It varied from choice to choice ..............................................................................................� 4
Do not know ........................................................................................................................� 5
6.5. Was it exclusively the factor you marked with a cross in Question 6.5 that you looked at in your choices inQuestion 5, or did you take all factors into consideration?
Yes No
It was exclusively that factor I put weight on ......................................................� 1 � 1 (28)
I took all factors into consideration .....................................................................� 2 � 2 (29)
6.6. If the water coming out of your tap was water that was cleaned of nitrogen and pesticides (rather than natu-rally clean groundwater), would you use it as drinking water?
Yes ......................................................................................................................................� 1 (30)
No .......................................................................................................................................� 2
. Question 6: Information .
6.1. Were you familiar with the information in the information sheet before you received this questionnaire?
Absolutely not at all ..............................................................................................................� 1 (52)
Not familiar ..........................................................................................................................� 2
Familiar................................................................................................................................� 3
Very familiar.........................................................................................................................� 4
Do not know ........................................................................................................................� 5
6.2. Where do you have your information on groundwater and drinking water from?- You may give more than one response
Local council/County council..................................................................................................� 1 (53-59)
Water companies..................................................................................................................� 2

© GfK D k A/S 28
Denmark�s governmental Environmental Protection Agency.....................................................� 3
Press/media .........................................................................................................................� 4
From my education/my work.................................................................................................� 5
From campaigns ...................................................................................................................� 6
Other...................................................................................................................................� 7
�Question 7: The water in your local area .
7.1 Have you ever noticed problems with the quality of your drinking water?
Yes ......................................................................................................................................� 1 (60)
No .......................................................................................................................................� 2
�Background questions .
Sex .K04.
Male ....................................................................................................................................� 1 (11)
Female.................................................................................................................................� 2
AgeWhen were you born?
Month ........................................................................................................................ (12-13)
- Put e.g. , if the respondent is born in March
Year .............................................................................................................. (14-17)
LocationWhat local authority area do you live in?- State name of local authority:______________________________________
Size of householdHow many adults, i.e. 18 years or above live in the household in total ......................................... (26)
Is there a child/are there children in the household?- If yes: How old is/are the child/children? Boy Girl Age
1. child..............................................................� 1 � 2 (71) ________year(s) (72-73)
2. child..............................................................� 1 � 2 (74) ________year(s) (75-76)
3. child..............................................................� 1 � 2 (77) ________year(s) (78-79)
4. child..............................................................� 1 � 2 (80) ________year(s) (81-82)
No, there are no children in the household.............................................................................� 1 (83)
How may people, i.e. adults and children, live in the household in total .................................. (30-31)
ResidenceWhat type of residence do you live in?
Terraced house/cluster housing.............................................................................................� 1 (37)
Apartment/apartment block...................................................................................................� 2
Detached one-family house ...................................................................................................� 3
Farm property ......................................................................................................................� 4
Other...................................................................................................................................� 5
IncomeWhat size is the family�s collective yearly gross income? - This should be income before any tax deduc-tions
91
0 3

© GfK D k A/S 29
Under 50000 kr. ...................................................................................................................� 01 (40-41)
Kr. 50.000 - 99.999 ..............................................................................................................� 02
Kr. 100.000 - 149.999...........................................................................................................� 03
Kr. 150.000 - 199.999...........................................................................................................� 04
Kr. 200.000 - 249.999...........................................................................................................� 05
Kr. 250.000 - 299.999...........................................................................................................� 06
Kr. 300.000 - 349.999...........................................................................................................� 07
Kr. 350.000 - 399.999...........................................................................................................� 08
Kr. 400.000 - 449.999...........................................................................................................� 09
Kr. 450.000 - 499.999...........................................................................................................� 10
Kr. 500.000 - 749.999...........................................................................................................� 11
Kr. 750.000 - 999.999...........................................................................................................� 13
Kr. 1.000.000 or above .........................................................................................................� 14

© GfK D k A/S 30
What is your own yearly gross income? - This should be income before any tax deductions
Under 50.000 kr. ..................................................................................................................� 01 (57-58)
Kr. 50.000 - 99.999 ..............................................................................................................� 02
Kr. 100.000 - 149.999...........................................................................................................� 03
Kr. 150.000 - 199.999...........................................................................................................� 04
Kr. 200.000 - 249.999...........................................................................................................� 05
Kr. 250.000 - 299.999...........................................................................................................� 06
Kr. 300.000 - 349.999...........................................................................................................� 07
Kr. 350.000 - 399.999...........................................................................................................� 08
Kr. 400.000 - 449.999...........................................................................................................� 09
Kr. 450.000 - 499.999...........................................................................................................� 10
Kr. 500.000 - 749.999...........................................................................................................� 11
Kr. 750.000 - 999.999...........................................................................................................� 13
Kr. 1.000.000 or above .........................................................................................................� 14
EducationPlease indicate your most recent education?
Education finished at 14-15 years old without continuing education(e.g. 7th, 8th or 9th class) .......................................................................................................� 1 (42)
Education finished at 16-19 years old without continuing education(e.g. 10th class, lower secondary school-leaving exam, higher secondary school-leaving exam or equiva-lent, apprenticeship training, etc.) .........................................................................................� 2
Medium-length further education (e.g. teacher training college/technical schoolor equivalent)......................................................................................................................�3
Longer-term education in an institution of higher education(e.g. university, technical college, dentist college, business school, etc.) ..................................� 4
Currently studying ................................................................................................................� 5
OccupationWhat is your occupation?
Unskilled worker ...................................................................................................................� 01 (48-49)
Skilled worker.......................................................................................................................� 02
Non-managerial employee/civil servant ..................................................................................� 11
Managerial-level employee/civil servant .................................................................................� 12
Independent farmer..............................................................................................................� 04
Independent retailer/craftsperson..........................................................................................� 05
Independent professional......................................................................................................� 06
Apprentice/student/trainee....................................................................................................� 07
Housewife/assisting spouse...................................................................................................� 08
Retired.................................................................................................................................� 09
Unemployed.........................................................................................................................� 10
The questionnaire is now finished � thank you for your help!

Annex 4��� ���������� �������
��� ���������� ����
��� ���������� �����
�� ������������ �������
�� ��������������� ��
��� ��� � ��� ��� � ��� ��� � ��� ��� � ��� ��� �������� ��������������������� ��� 0.51 *** 0.12
��� ��� ����� 107.81 *** 26.49
����� ������ �� �� ������� ���
104.75 * 58.17
���� ������ �� �� ������� ��� -27.97 78.18
������ �� ����� ����� 82.96 65.98Does fish very often 71.85 189.56
����� �� �� -66.61 74.13
������� ������������ �� ���� ��� ����� ��� �������������
132.52 ** 57.12
�� �� ������� �� �� �������� �� ���� � � �
12.32 77.25
��� �� �� ��� �� ��� � ��� �� � �� ����
25.69 59.77
!� ��������� �� ����� ����� �������� ��������� �
-40.35 91.97
�������� �� �� �� �� ����� ���������
-23.94 96.30
"���� ��� � �� �#�� �� ���������� ��� �$������ �
-99.58 73.11
����� ������"��� �� ������ �� � �� ����� �� 147.89 ** 59.51
%� ��� ������ ���� ��� ����� �� 287.64 *** 57.99
&� ���� �� �� ���� 98.03 * 51.86
� � � � �
� � � ��� � ��� �Significance levels at 1%, 5% and 10% are indicated by three, two and one asterisk(s), respectively

��� ���������� �������
��� ���������� ��
��� ���������� ��
�� ���� ���������������
��������� ��
��� ��� � ��� ��� � ��� ��� � ��� ��� � ��� ��� �������� ��������������������� ������ ��� ���������� ������ �� �� ������� ������� ������ �� �� ������� ��������� �� ����� �����Does fish very often����� �� ��������� ������������ �� ���� ��� ����� ������� ����������� �� ������� �� �� �������� �� ���� � � ���� �� �� ��� �� ��� � ��� ��� �� ����!� ��������� �� ����� ��������� ���� ��������� ��������� �� �� �� �� ����� ���������"���� ��� � �� �#�� �� ���������� ��� �$������ � ����� ������&� ���� �� �� ����
� � � � �� � � ��� � ��� �
Significance levels at 1%, 5% and 10% are indicated by three, two and one asterisk(s), respectively
National Environmental Research InstituteThe National Environmental Research Institute, NERI, is a research institute of the Ministry of the Environment.In Danish, NERI is called Danmarks Miljøundersøgelser (DMU).NERI’s tasks are primarily to conduct research, collect data, and give advice on problems related to the environ-ment and nature.
Addresses: URL: http://www.dmu.dk
National Environmental Research InstituteFrederiksborgvej 399PO Box 358DK-4000 RoskildeDenmarkTel: +45 46 30 12 00Fax: +45 46 30 11 14
ManagementPersonnel and Economy SecretariatMonitoring, Advice and Research SecretariatDepartment of Policy AnalysisDepartment of Atmospheric EnvironmentDepartment of Marine EcologyDepartment of Environmental Chemistry and MicrobiologyDepartment of Arctic EnvironmentProject Manager for Quality Management and Analyses
National Environmental Research InstituteVejlsøvej 25PO Box 314DK-8600 SilkeborgDenmarkTel: +45 89 20 14 00Fax: +45 89 20 14 14
Department of Terrestrial EcologyDepartment of Freshwater Ecology
National Environmental Research InstituteGrenåvej 12-14, KaløDK-8410 RøndeDenmarkTel: +45 89 20 17 00Fax: +45 89 20 15 15
Department of Wildlife Biology and Biodiversity
Publications:NERI publishes professional reports, technical instructions, and the annual report. A R&D projects' catalogue isavailable in an electronic version on the World Wide Web.Included in the annual report is a list of the publications from the current year.

Faglige rapporter fra DMU/NERI Technical Reports
����Nr. 501: EUDANA - EUtrofiering af Dansk Natur. Videnbehov, modeller og perspektiver. Af Bak, J.L. & Ejrnæs, R. 49
s. (elektronisk)Nr. 502: Samfundsøkonomiske analyser af ammoniakbufferzoner. Udredning for Skov- og Naturstyrelsen. Af Schou,
J.S., Gyldenkærne, S. & Bak, J.L. 36 s. (elektronisk)Nr. 503: Luftforurening fra trafik, industri og landbrug i Frederiksborg Amt. Af Hertel, O. et al. 88 s. (elektronisk)Nr. 504: Vingeindsamling fra jagtsæsonen 2003/04 i Danmark. Af Clausager, I. 70 s. (elektronisk)Nr. 505: Effekt af virkemidler på kvælstofudvaskning fra landbrugsarealer. Eksempel fra oplandet til Mariager Fjord.
Thorsen, M. 56 s. (elektronisk)Nr. 506: Genindvandring af bundfauna efter iltsvindet 2002 i de indre danske farvande. Af Hansen, J.L.S., Josejson,
A.B. & Petersen, T.M. 61 s. (elektronisk)Nr. 507: Sundhedseffekter af luftforurening - beregningspriser. Af Andersen, M.S. et al. 83 s. (elektronisk)Nr. 508: NOVANA. Det nationale program for overvågning af vandmiljøet og naturen. Programbeskrivelse - del 2. Af
Svendsen, L.M. et al. 2005. 126 s., 100,00 kr.Nr. 509: Persistent organic Pollutants (POPs) in the Greenland environment - Long-term temporal changes and effects
on eggs of a bird of prey. By Sørensen, P.B. et al. 124 pp. (electronic)Nr. 510: Bly i blod fra mennesker i Nuuk, Grønland - en vurdering af blyhagl fra fugle som forureningskilde. Af
Johansen, P. et al. 30 s. (elektronisk)Nr. 511: Fate of mercury in the Arctic (FOMA). By Skov, H. et al. 54 pp. (elektronic)Nr. 512: Krondyr, dådyr og sika i Danmark. Forekomst og jagtlig udnyttelse i jagtsæsonen 2001/02. Af Asferg, T.,
Olesen, C.R. & Andersen, J.P. 41 s. (elektronisk)Nr. 513: Marine områder 2003 - Miljøtilstand og udvikling. NOVA 2003. Af Ærtebjerg, G. et al. 121 s. (elektronisk)Nr. 514: Landovervågningsoplande 2003. NOVA 2003. Af Grant, R. et al. 118 s. (elektronisk)Nr. 515: Søer 2003. NOVA 2003. Af Jensen, J.P. et al. 85 s. (elektronisk)Nr. 516: Vandløb 2003. NOVA 2003. Af Bøgestrand, J. (red.) 54 s. (elektronisk)Nr. 517: Vandmiljø 2004. Tilstand og udvikling - faglig sammenfatning. Af Andersen, J.M. et al. 100,00 kr.Nr. 518: Overvågning af vandmiljøplan II - Vådområder. Af Hoffmann, C.C. et al. 2005. 103 s. (elektronisk)Nr. 519: Atmosfærisk deposition 2003. NOVA 2003. Af Ellermann, T. et al. 45 s. (elektronisk)Nr. 520: Atmosfærisk deposition. Driftsrapport for luftforurening i 2003. Af Ellermann, T. et al. 78 s. (elektronisk)Nr. 521: Udvikling og afprøvning af metoder til indsamling af flora og fauna på småstenede hårdbundshabitater. Af
Dahl, K. et al. 85 s. (elektronisk)Nr. 522: Luftkvalitet langs motorveje. Målekampagne og modelberegninger. Af Jensen, S.S. et al. 67 s. (elektronisk)Nr. 523: ExternE transport methodology for external cost evaluation of air pollution. Estimation of Danish exposure
factors. By Jensen, S.S. et al. 44 pp. (electronic)Nr. 524: Råstofaktiviteter og natur- og miljøhensyn i grønland. Af Boertmann, D. 2005. 101 s. (elektronisk)Nr. 525: Screening of "new" contaminants in the marine environment of Greenland and the Faroe Islands. By Vorkamp,
K. et al. 97 pp. (electronic)
����Nr. 526: Effekter af fiskeri på stenrevs algevegetation. Et pilotprojekt på Store Middelgrund i Kattegat. Af Dahl, K. 16
s. (elektronisk)Nr. 527: The impact on skylark numbers of reductions in pesticide usage in Denmark. Predictions using a landscape-
scale individual-based model. By Topping, C.J. 33 pp. (electronic)Nr. 528: Vitamins and minerals in the traditional Greenland diet. By Andersen, S.M. 43 pp. (electronic)Nr. 529: Mejlgrund og lillegrund. En undersøgelse af biologisk diversitet på et lavvandet område med stenrev i Samsø
Bælt. Af Dahl, K., Lundsteen, S. & Tendal, O.S. 87 s. (elektronisk)Nr. 530: Eksempler på økologisk klassificering af kystvande. Vandrammedirektiv-projekt, Fase IIIa. Af Andersen, J.H.
et al. 48 s. (elektronisk)Nr. 531: Restaurering af Skjern Å. Sammenfatning af overvågningsresultater fra 1999-2003. Af Andersen, J.M. (red.).
94 s.Nr. 532: NOVANA. Nationwide Monitoring and Assessment Programme for the Aquatic and Terrestrial Environments.
Programme Description - Part 1. By Svendsen, L.M. & Norup, B. (eds.). 53 pp., 60,00 DKK.Nr. 533: Fate of mercury in the Arctic (FOMA). Sub-project atmosphere. By Skov, H. et al. 55 pp. (electronic)Nr. 534: Control of pesticides 2003. Chemical Substances and Chemical Preparations. By Krongaard, T., Petersen, K.T.
& Christoffersen, C. 32 pp. (electronic)Nr. 538: Tungmetaller i tang og musling ved Ivituut 2004. Johansen, P. & Asmund, G. 27 s. (elektronisk)Nr. 540: Cadmiumindholdet i kammusling �������������� ved Nuuk, Vestgrønland, 2004. Af pedersen, K.H.,
Jørgensen, B. & Asmund, G. 36 s. (elektronisk)

543 V
aluation of groundw
ater protection versus water treatm
ent in D
enmark by C
hoice Experim
ents and C
ontingent Valuation
National Environmental Research Institute ISBN 87-7772-877-7Ministry of the Environment • Denmark ISSN 1600-0048
The benefits of groundwater protection are estimated to assess the non-marketed benefits associated with increased protection of the groundwater resource, as compared to purification of groundwater for drinking water purposes. The study comprises valuation of the effects on both drinking water quality and the quality of surface water recipients, expressed by the quality of the living conditions for wild animals, fish and plants in lakes and waterways. The methods Discrete Choice Experiments method (CE) and Contingent valuation (CV) are used for the valuation. The results indicate that there is a significant positive willingness to pay for groundwater protection, where the willingness to pay for drinking water quality exceeds that for surface water quality. The value of groundwater protection exceeds that from purification, and this result supports the current Danish groundwater policy and the aim of the Water Framework Directive that aims at a holistic management government of the aquatic environment.