Embed Size (px)
DESCRIPTION
Valuation of ecosystem services II. Charit tingsabadh October 2006. outline. Nuisance-hazard-risk Bads Damage costs Abatement costs Valuation issues. Nuisance-hazard-risk. Levels of disturbances Risk analysis format See next slide. Hazard Potential. Hazard situation. Needs. - PowerPoint PPT Presentation
Citation preview
Valuation of ecosystem services II
Charit tingsabadh
October 2006
outline
• Nuisance-hazard-risk
• Bads
• Damage costs
• Abatement costs
• Valuation issues
Nuisance-hazard-risk
• Levels of disturbances
• Risk analysis format
• See next slide
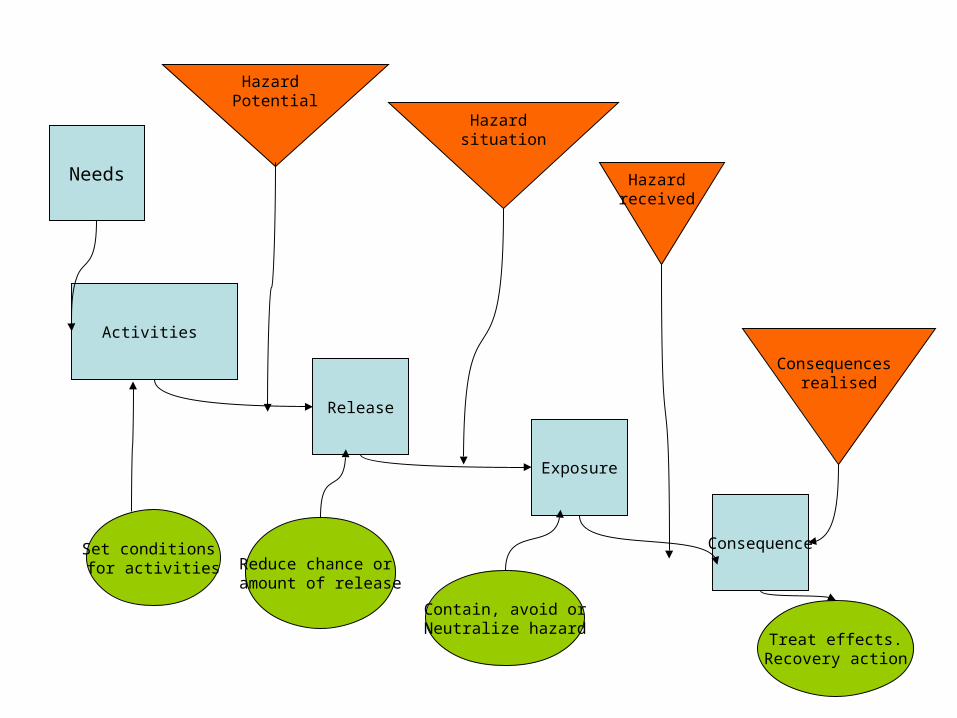
Needs
Activities
Release
Exposure
Consequence
Hazard Potential
Hazard situation
Hazard received
Consequences realised
Set conditions for activities Reduce chance or
amount of release
Contain, avoid orNeutralize hazard
Treat effects.Recovery action
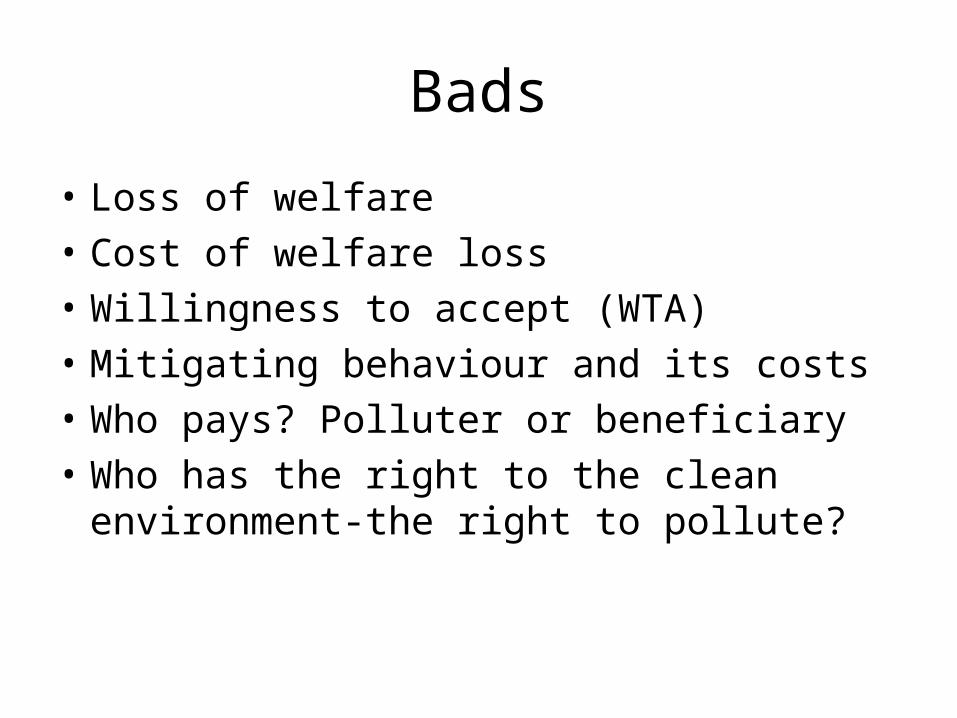
Bads
• Loss of welfare
• Cost of welfare loss
• Willingness to accept (WTA)
• Mitigating behaviour and its costs
• Who pays? Polluter or beneficiary
• Who has the right to the clean environment-the right to pollute?
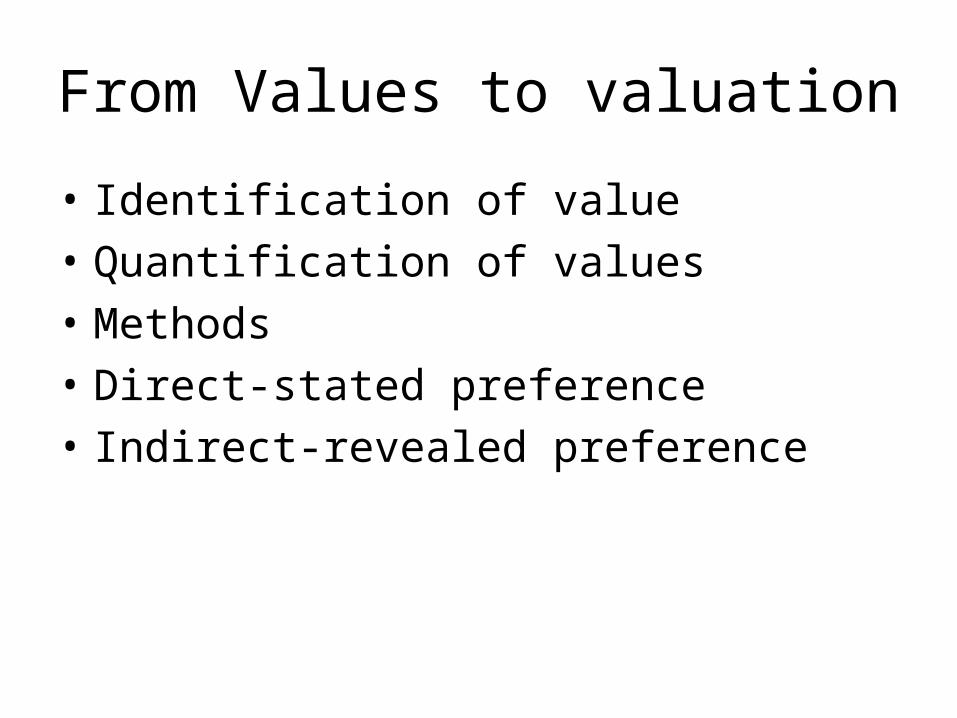
From Values to valuation
• Identification of value
• Quantification of values
• Methods
• Direct-stated preference
• Indirect-revealed preference
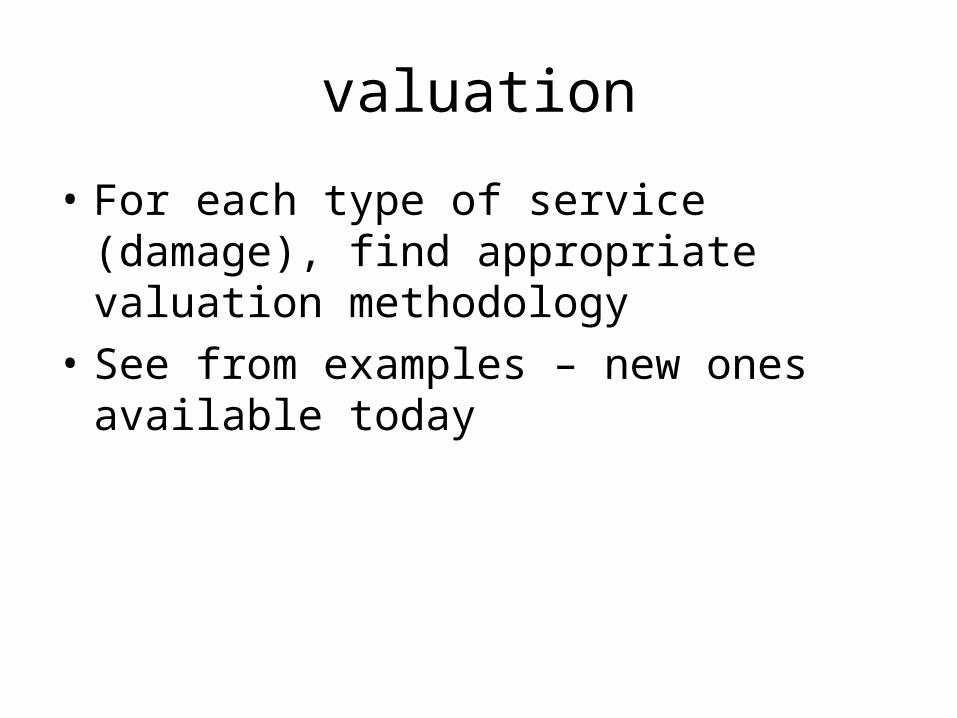
valuation
• For each type of service (damage), find appropriate valuation methodology
• See from examples – new ones available today
Air pollution
• See paper for general description:
• Hernandez
Celebrating 100 years of Health
Science, Health and Development: Achievements and Challenges in One Hundred Years of PAHO
Environmental Protection and Development:Air quality
Mauricio HernándezDirector, Centro de Investigación en Salud Poblacional.
Instituto Nacional de Salud Pública, Mexico
• This most excellent canopy, the air…why it appears no other thing to me than a foul and pestilent congregation of vapors.
W. Shakespeare
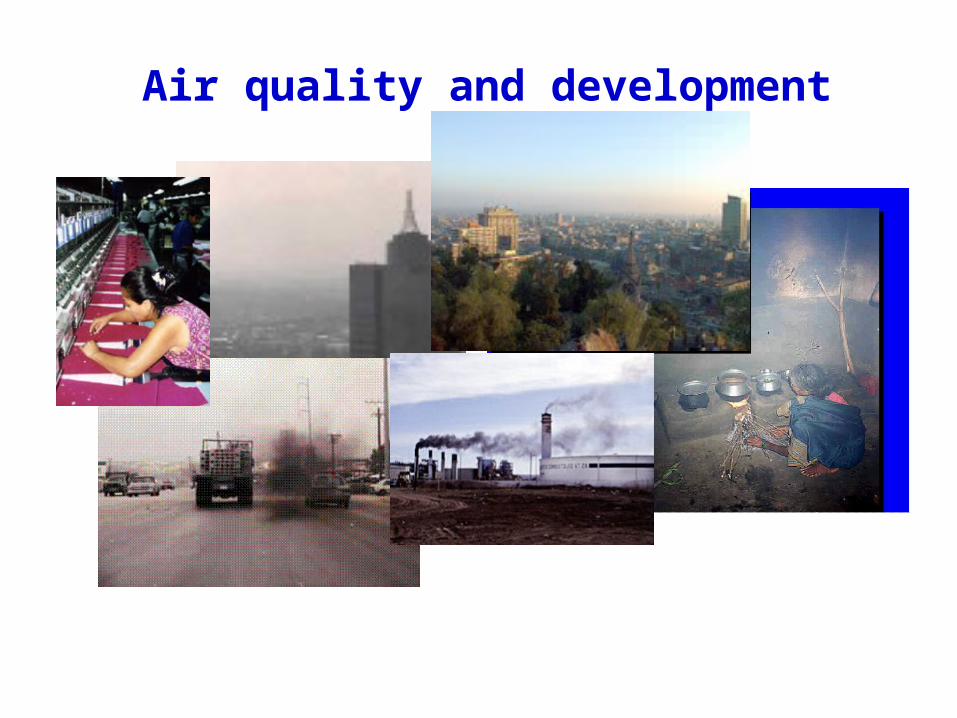
Air quality and development
Presentation outline
• What have we learned
• Current situation in the Americas
• Mexico City –Case study
- Why is important to do research?
• Recommendations for a research agenda in the region
• Conclusions
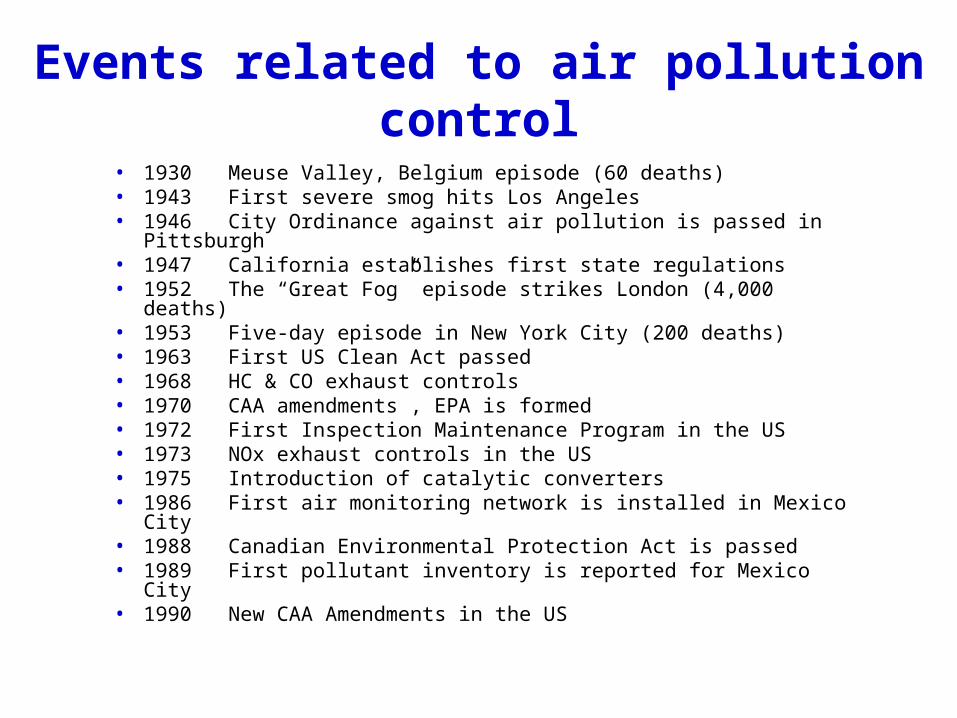
Events related to air pollution control
• 1930 Meuse Valley, Belgium episode (60 deaths)• 1943 First severe smog hits Los Angeles• 1946 City Ordinance against air pollution is passed in Pittsburgh• 1947 California establishes first state regulations• 1952 The “Great Fog” episode strikes London (4,000 deaths)• 1953 Five-day episode in New York City (200 deaths)• 1963 First US Clean Act passed • 1968 HC & CO exhaust controls• 1970 CAA amendments , EPA is formed• 1972 First Inspection Maintenance Program in the US• 1973 NOx exhaust controls in the US• 1975 Introduction of catalytic converters• 1986 First air monitoring network is installed in Mexico City • 1988 Canadian Environmental Protection Act is passed• 1989 First pollutant inventory is reported for Mexico City• 1990 New CAA Amendments in the US
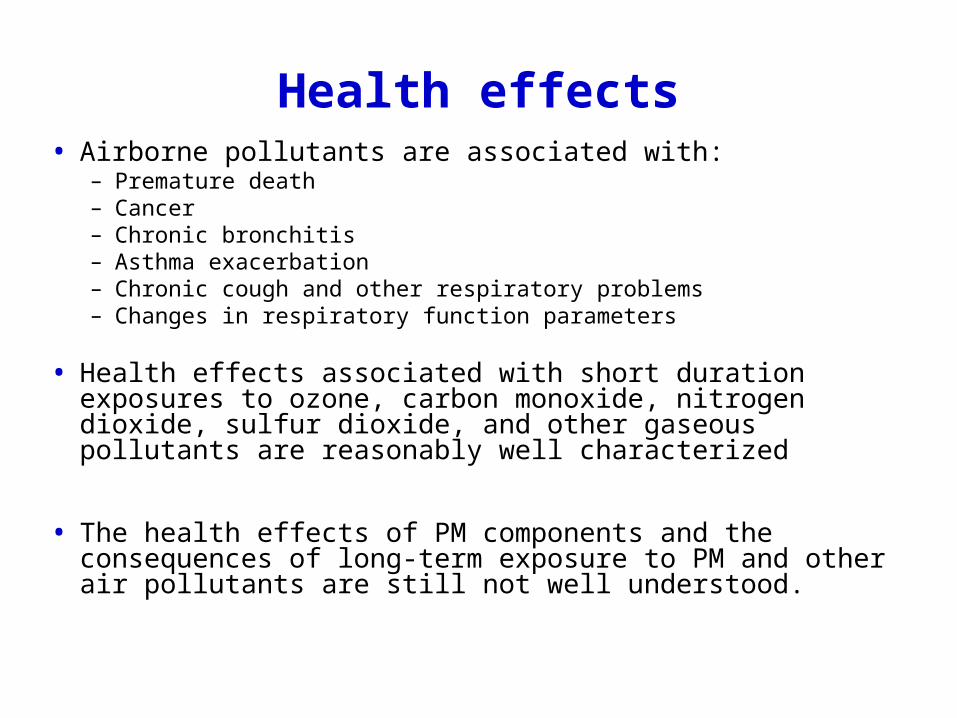
Health effects• Airborne pollutants are associated with:
– Premature death – Cancer – Chronic bronchitis – Asthma exacerbation– Chronic cough and other respiratory problems– Changes in respiratory function parameters
• Health effects associated with short duration exposures to ozone, carbon monoxide, nitrogen dioxide, sulfur dioxide, and other gaseous pollutants are reasonably well characterized
• The health effects of PM components and the consequences of long-term exposure to PM and other air pollutants are still not well understood.
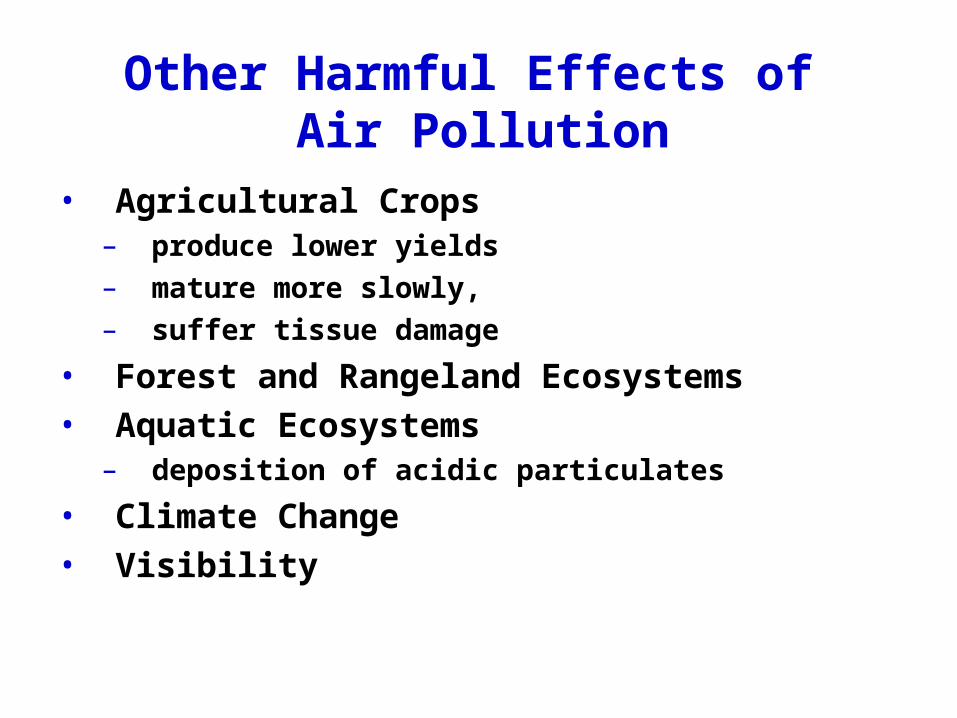
Other Harmful Effects of Air Pollution
• Agricultural Crops– produce lower yields – mature more slowly, – suffer tissue damage
• Forest and Rangeland Ecosystems• Aquatic Ecosystems
– deposition of acidic particulates
• Climate Change• Visibility
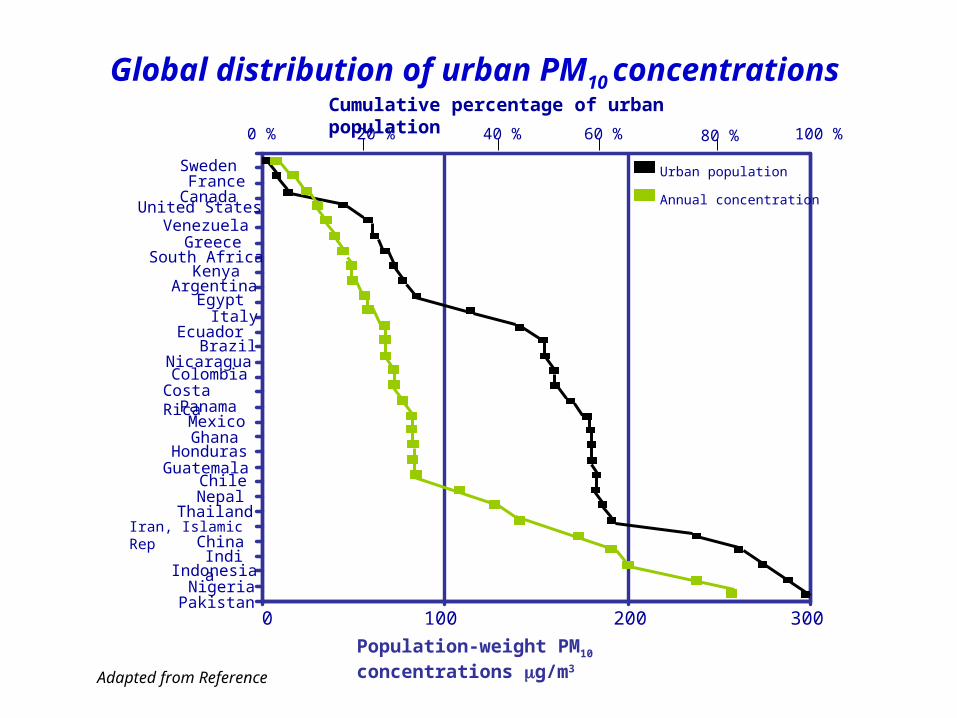
0 100 200 300
United States
Egypt
Colombia
Mexico
Chile
Sweden France
Canada
VenezuelaGreece
South AfricaKenya
Argentina
ItalyEcuador
BrazilNicaragua
Costa RicaPanama
GhanaHonduras
Guatemala
NepalThailand
Iran, Islamic RepChinaIndia
IndonesiaNigeria
Pakistan
Population-weight PM10 concentrations g/m3
Global distribution of urban PM10 concentrations
Adapted from Reference
Urban population
Annual concentration
0 % 20 % 40 % 60 % 80 % 100 %
Cumulative percentage of urban population
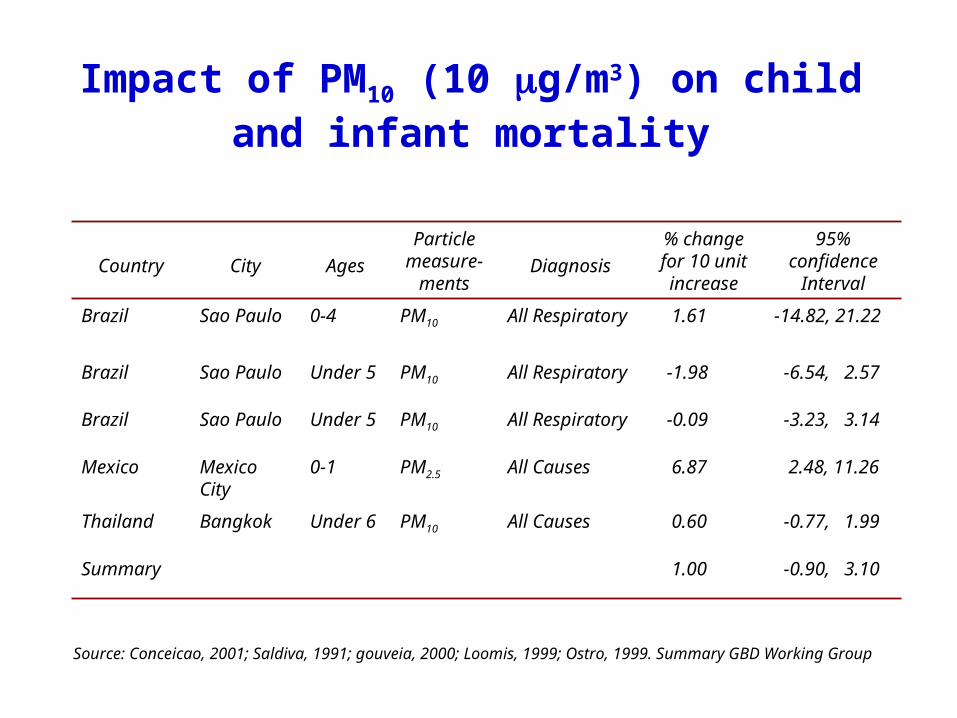
Impact of PM10 (10 g/m3) on child and infant mortality
Country City Ages
Particle measure-
mentsDiagnosis
% change for 10 unit increase
95% confidence
Interval
Brazil Sao Paulo 0-4 PM10 All Respiratory 1.61 -14.82, 21.22
Brazil Sao Paulo Under 5 PM10 All Respiratory -1.98 -6.54, 2.57
Brazil Sao Paulo Under 5 PM10 All Respiratory -0.09 -3.23, 3.14
Mexico Mexico City
0-1 PM2.5 All Causes 6.87 2.48, 11.26
Thailand Bangkok Under 6 PM10 All Causes 0.60 -0.77, 1.99
Summary 1.00 -0.90, 3.10
Source: Conceicao, 2001; Saldiva, 1991; gouveia, 2000; Loomis, 1999; Ostro, 1999. Summary GBD Working Group
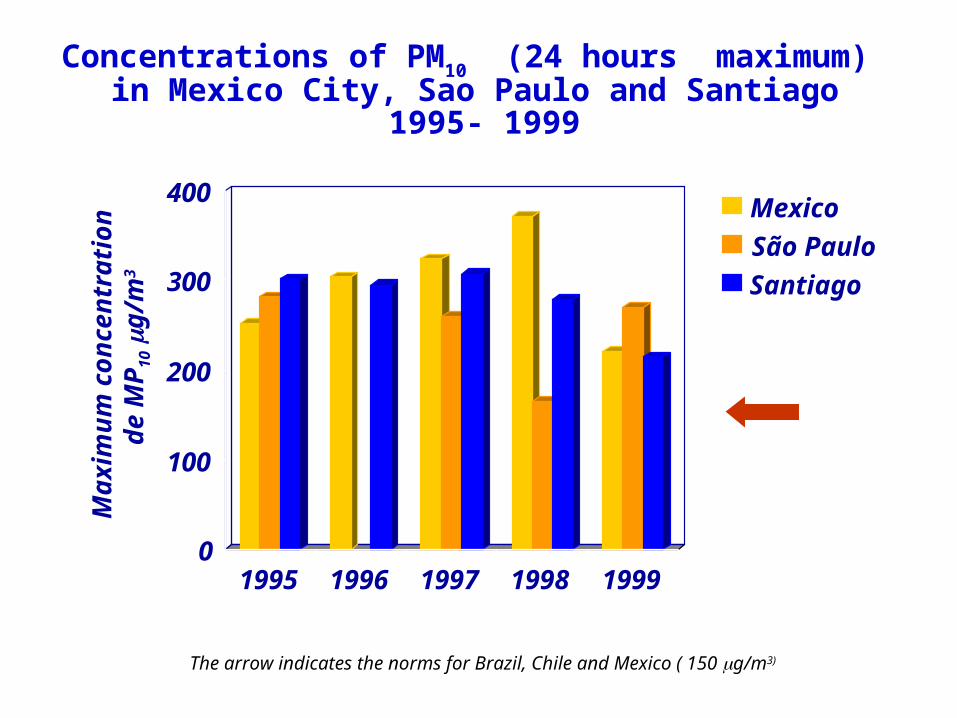
Concentrations of PM10 (24 hours maximum) in Mexico City, Sao Paulo and Santiago
1995- 1999
The arrow indicates the norms for Brazil, Chile and Mexico ( 150 g/m3)
Ma
xim
um
co
nc
en
tra
tio
n
de
MP
10 g
/m3
0
100
200
300
400
1995 1996 1997 1998 1999
Mexico
São Paulo
Santiago
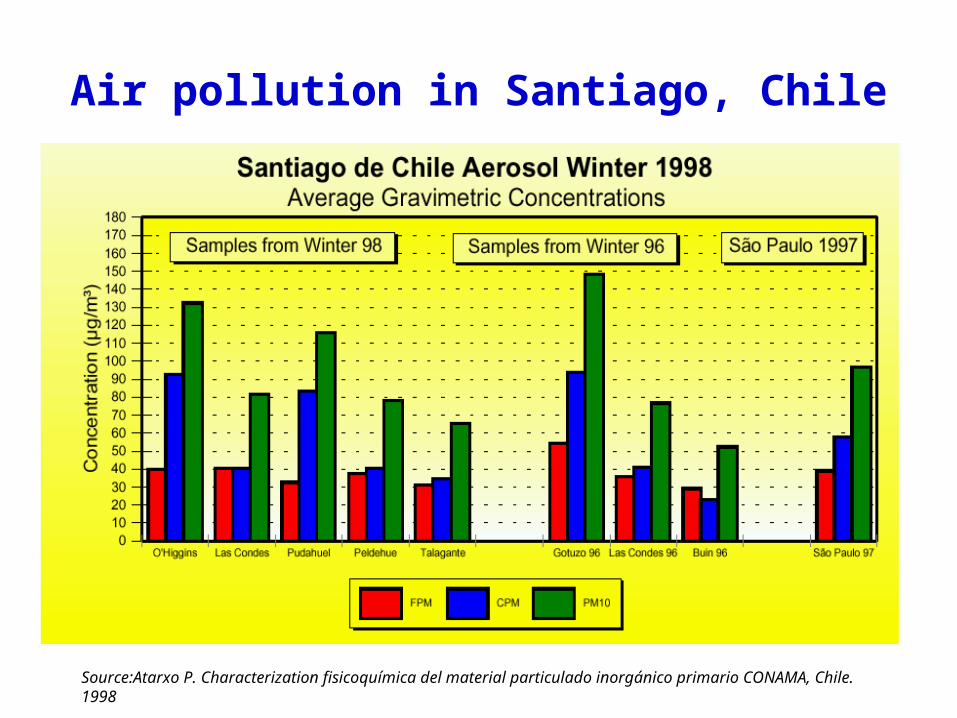
Air pollution in Santiago, Chile
Source:Atarxo P. Characterization fisicoquímica del material particulado inorgánico primario CONAMA, Chile. 1998

TSP in Lima, Peru
Source: DIGESA, Lima Peru.
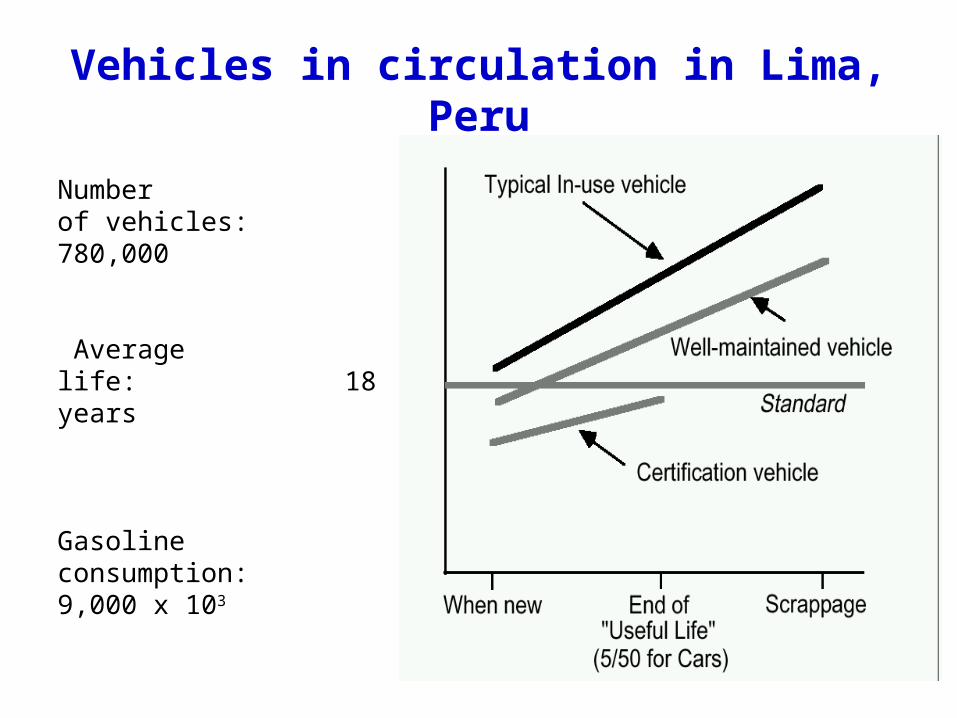
Vehicles in circulation in Lima, Peru
Numberof vehicles: 780,000
Averagelife: 18 years
Gasolineconsumption: 9,000 x 103
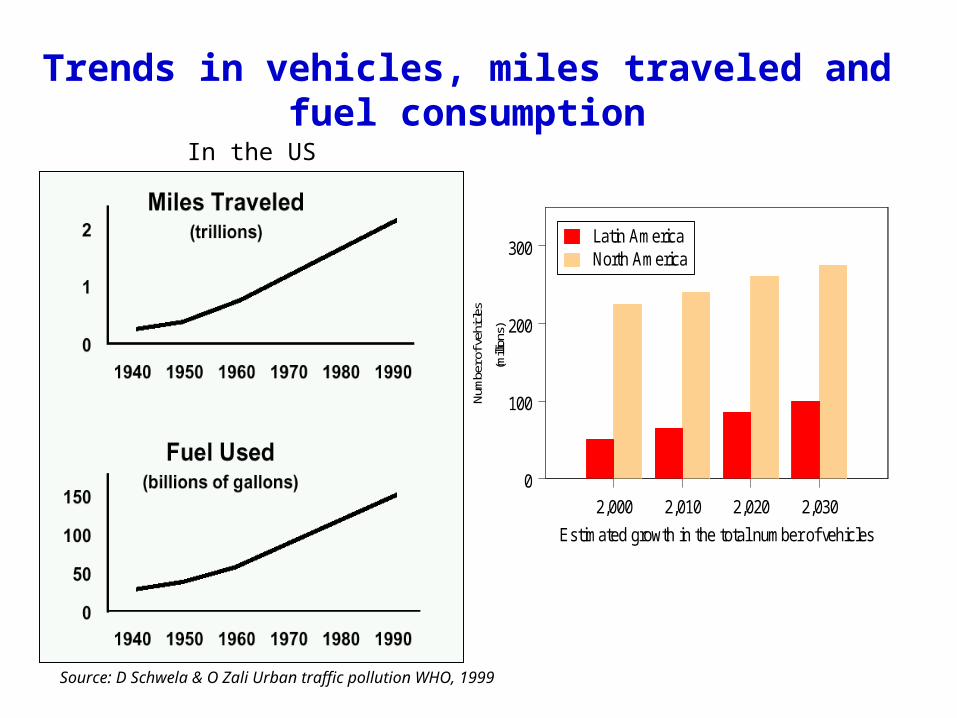
Trends in vehicles, miles traveled and fuel consumption
Source: D Schwela & O Zali Urban traffic pollution WHO, 1999
2,000 2,010 2,020 2,030
Estimated growth in the total number of vehicles
0
100
200
300
Num
ber o
f veh
icle
s
(m
illion
s)
Latin AmericaNorth America
In the US
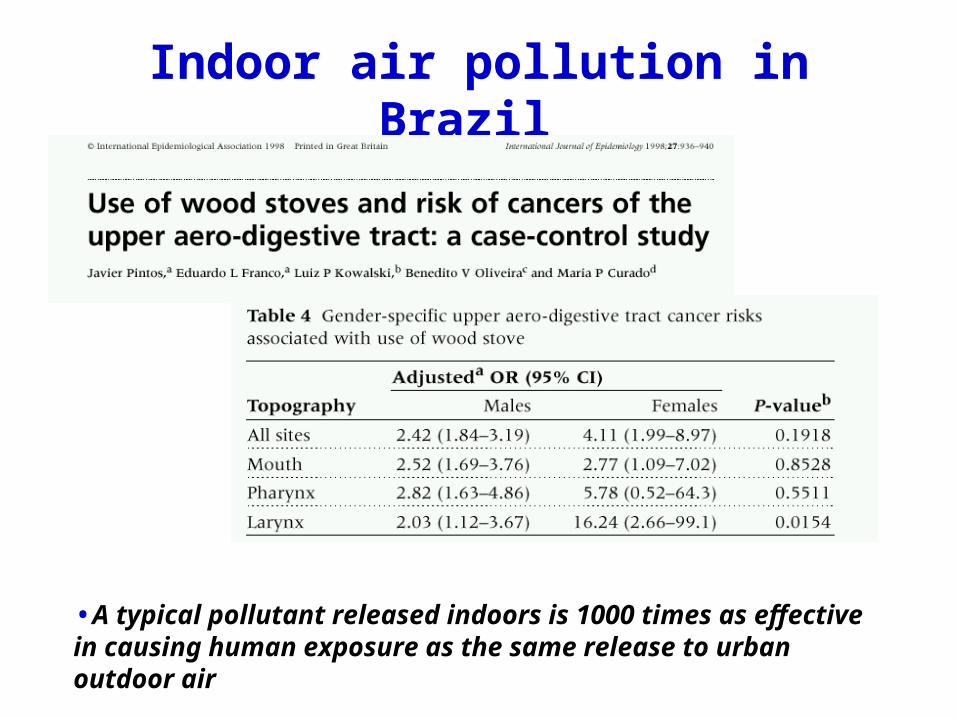
Indoor air pollution in Brazil
•A typical pollutant released indoors is 1000 times as effective in causing human exposure as the same release to urban outdoor air
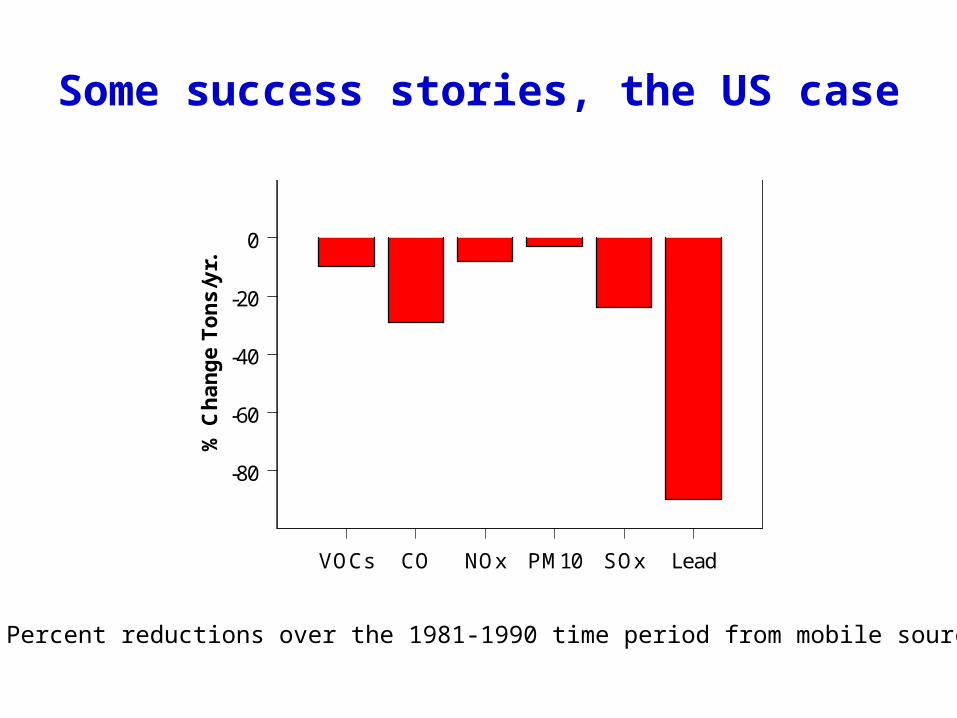
Some success stories, the US case
Percent reductions over the 1981-1990 time period from mobile sources
VOCs CO NOx PM10 SOx Lead
-80
-60
-40
-20
0
% C
ha
ng
e T
on
s/y
r.
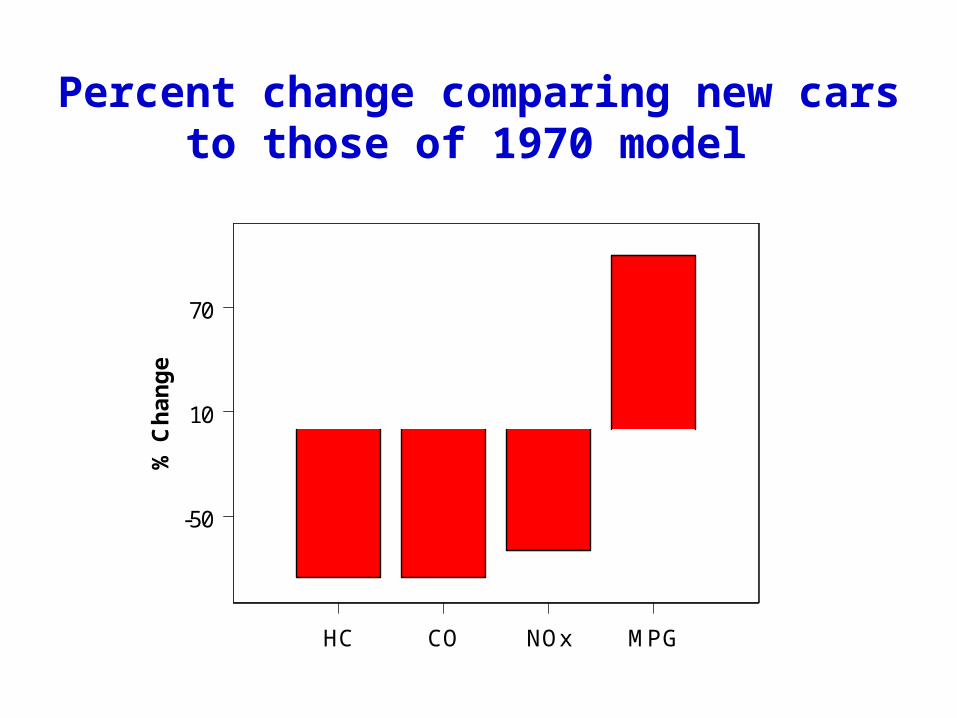
Percent change comparing new cars to those of 1970 model
HC CO NOx MPG
-50
10
70
% C
ha
ng
e
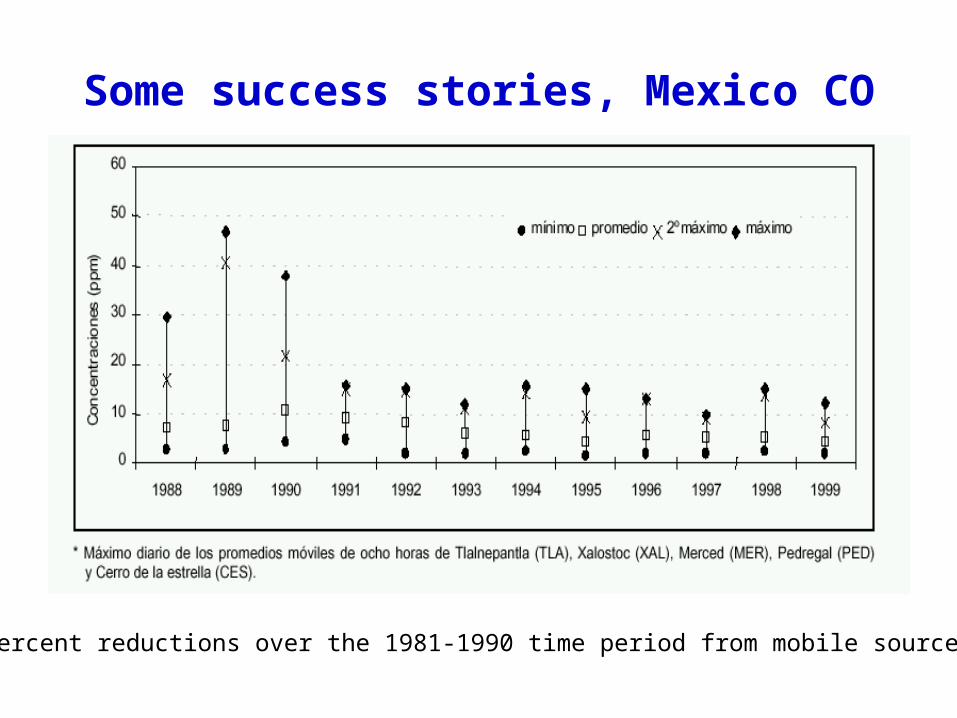
Some success stories, Mexico CO
Percent reductions over the 1981-1990 time period from mobile sources
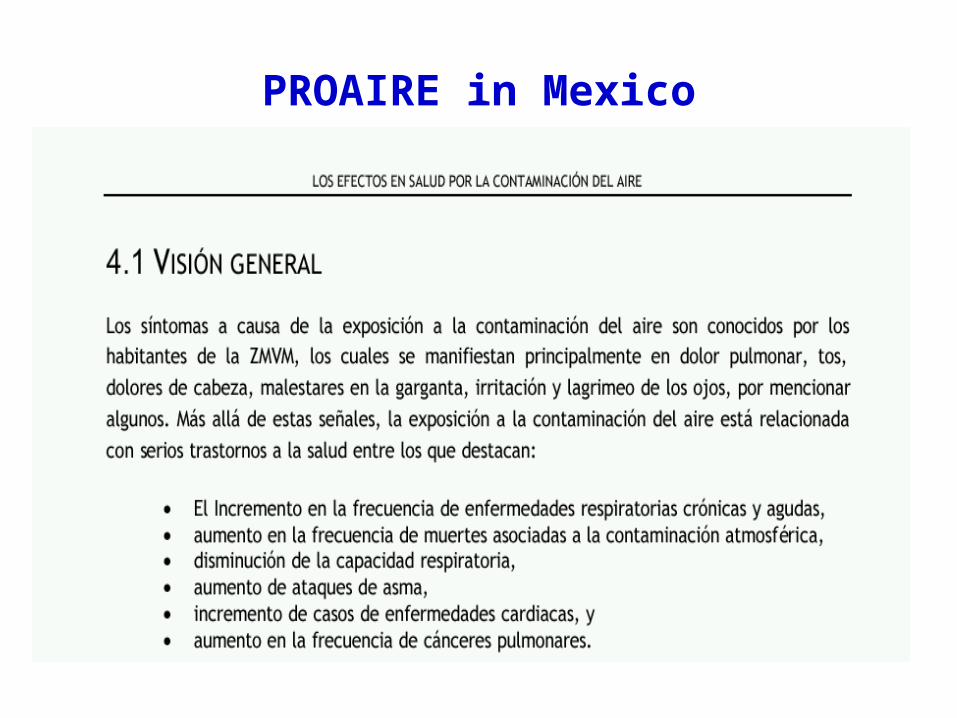
PROAIRE in Mexico
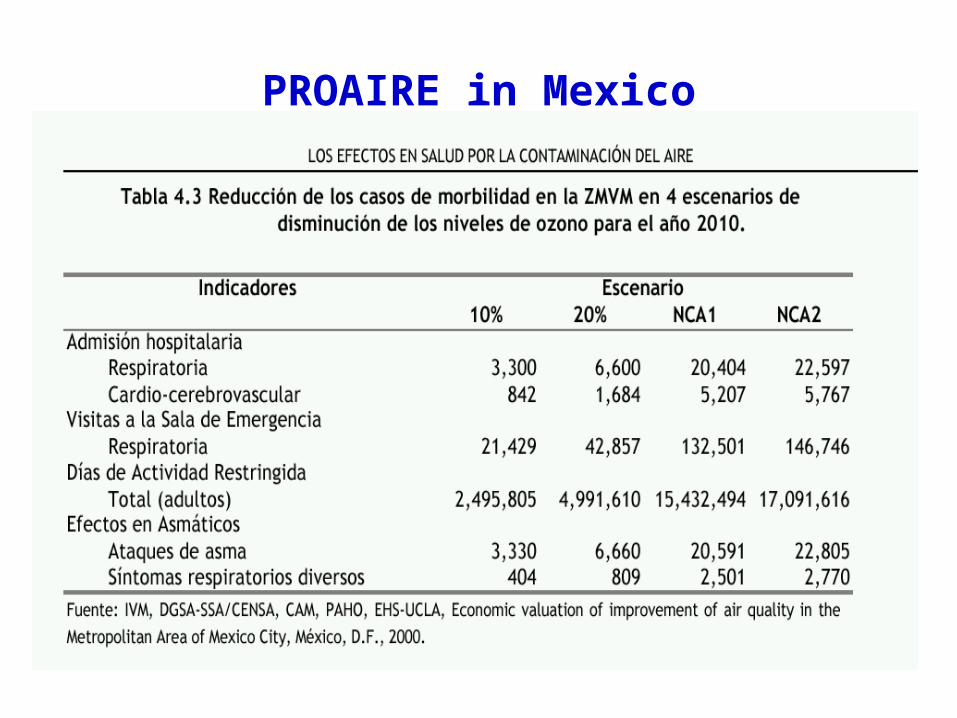
PROAIRE in Mexico
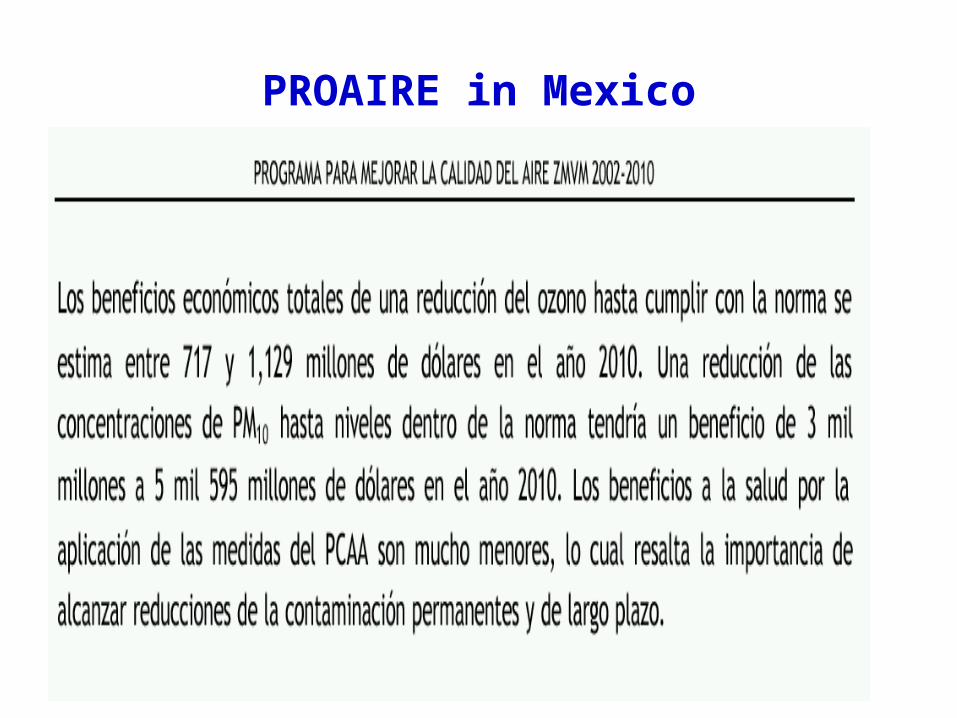
PROAIRE in Mexico
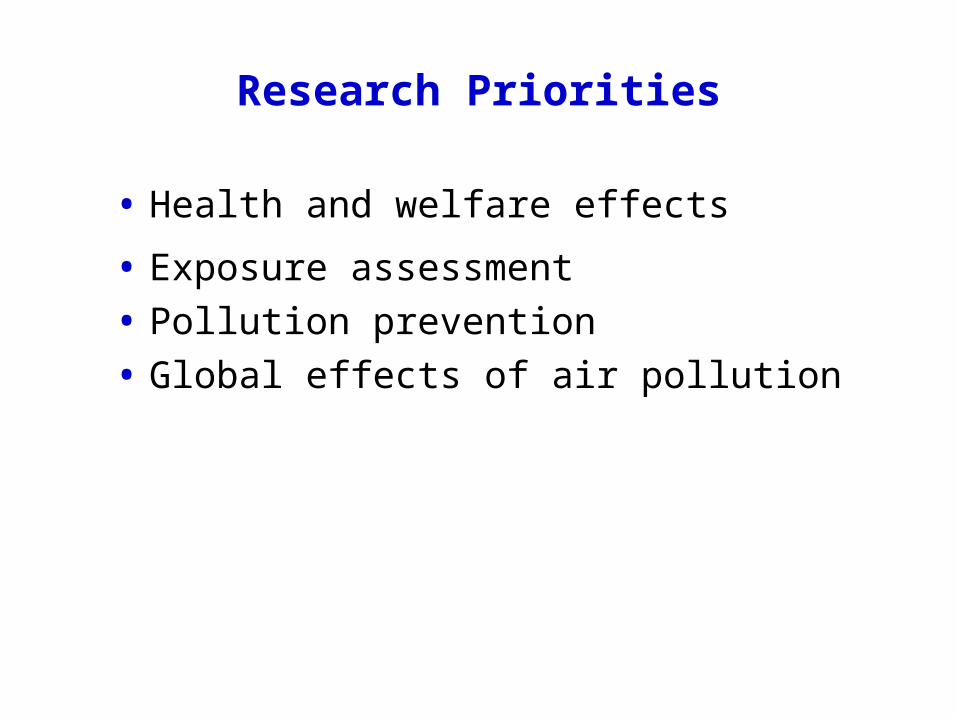
Research Priorities
• Health and welfare effects
• Exposure assessment
• Pollution prevention
• Global effects of air pollution
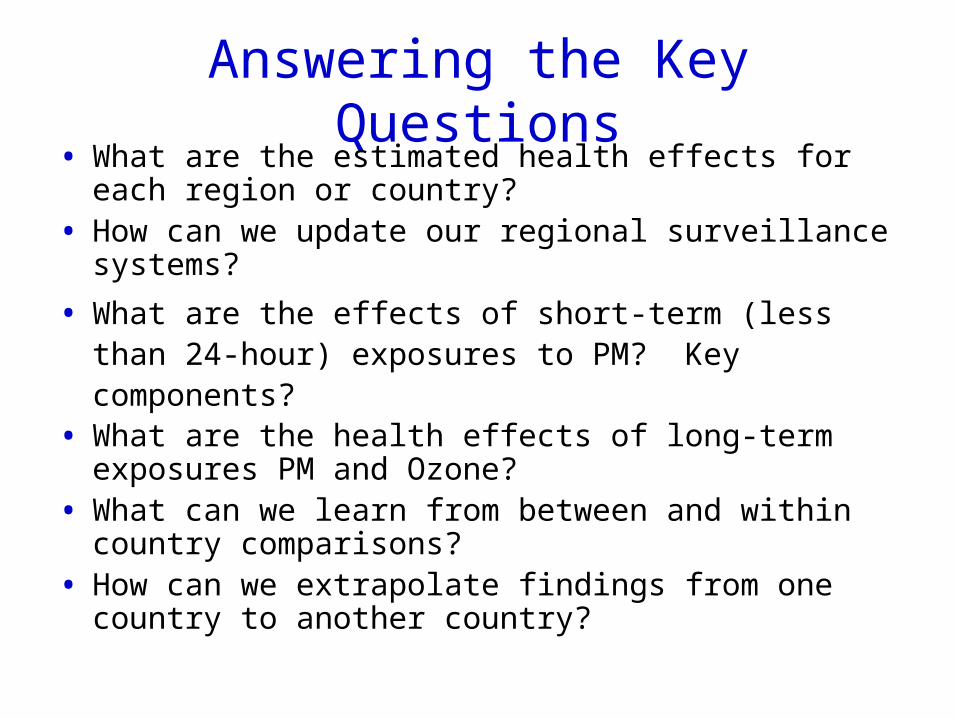
Answering the Key Questions• What are the estimated health effects for each region or
country?• How can we update our regional surveillance systems?
• What are the effects of short-term (less than 24-hour) exposures to PM? Key components?
• What are the health effects of long-term exposures PM and Ozone?
• What can we learn from between and within country comparisons?
• How can we extrapolate findings from one country to another country?
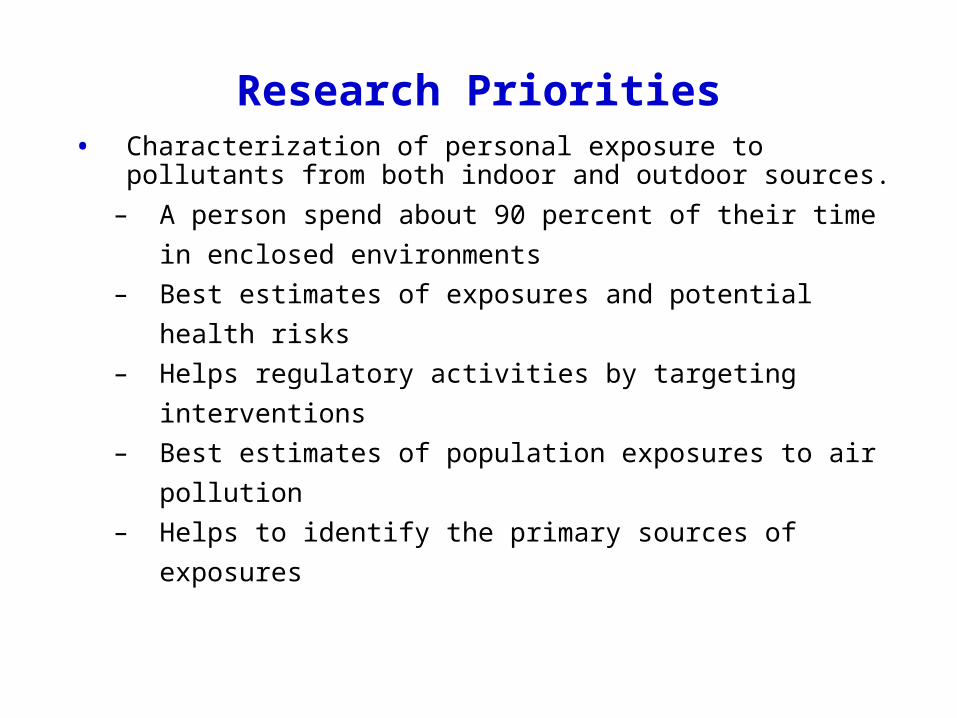
Research Priorities• Characterization of personal exposure to pollutants
from both indoor and outdoor sources.
– A person spend about 90 percent of their time in
enclosed environments
– Best estimates of exposures and potential health
risks
– Helps regulatory activities by targeting interventions
– Best estimates of population exposures to air
pollution
– Helps to identify the primary sources of exposures
Research Priorities
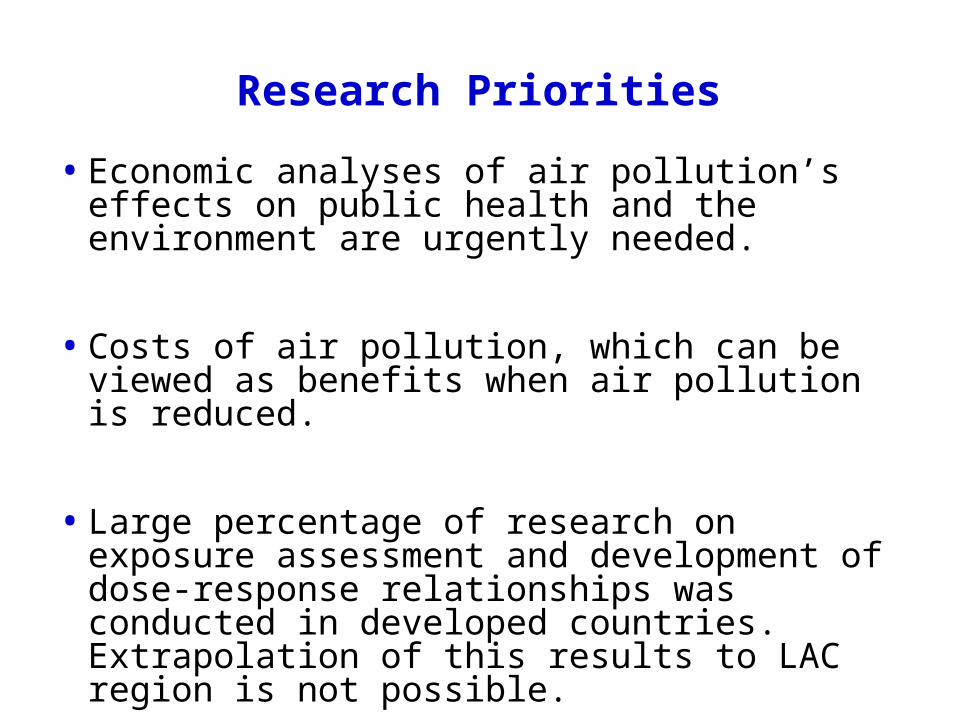
• Economic analyses of air pollution’s effects on public health and the environment are urgently needed.
• Costs of air pollution, which can be viewed as benefits when air pollution is reduced.
• Large percentage of research on exposure assessment and development of dose-response relationships was conducted in developed countries. Extrapolation of this results to LAC region is not possible.
Research Priorities• Different demographics and varying chemical compositions
of air pollutants
• Extrapolation of dose-response estimates for ranges outside of those observed
• Correlation between ambient exposure and personal exposure may not be the same
• Environmental and socioeconomic conditions, diet, lifestyle and income, may modify the effects.
• The role of selected survivor and competing causes limits inference
Economic externalities of air pollution
• To compare benefits and costs.
• To set priorities.
• To get the attention of decision makers and legislators.
Answering the Key Questions• What are the relative health benefits of
improving air quality?
• What is the public’s willingness to pay to avoid the health effects of air pollution?
• Are people at the lower end of the socioeconomic scale exposed to higher levels of pollutants?
• Best technology transfer and training?
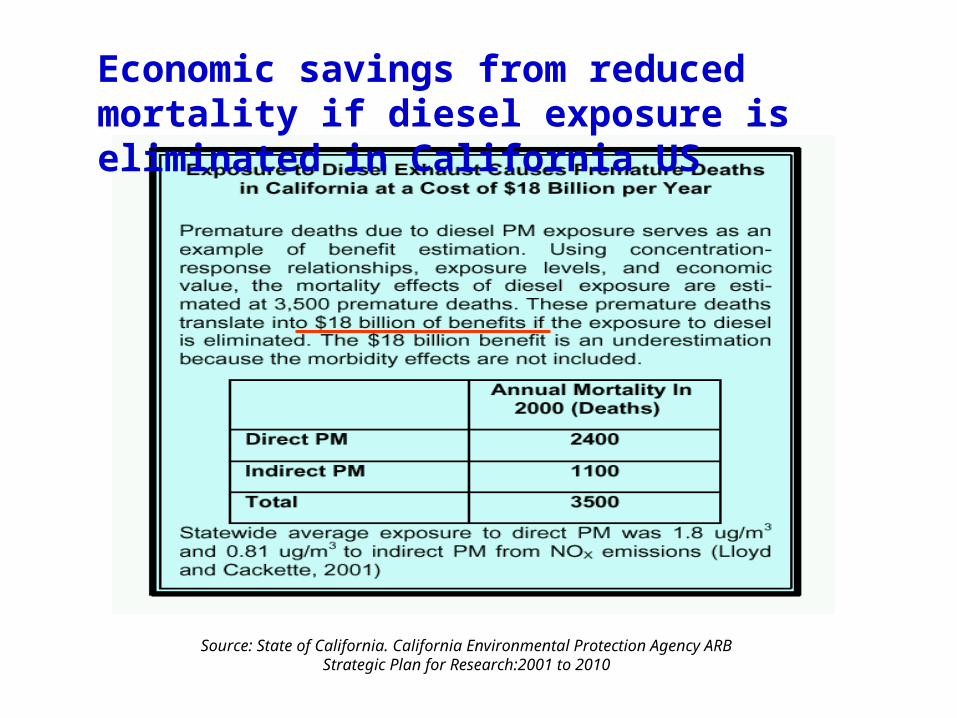
Source: State of California. California Environmental Protection Agency ARBStrategic Plan for Research:2001 to 2010
Economic savings from reduced mortality if diesel exposure is eliminated in California US
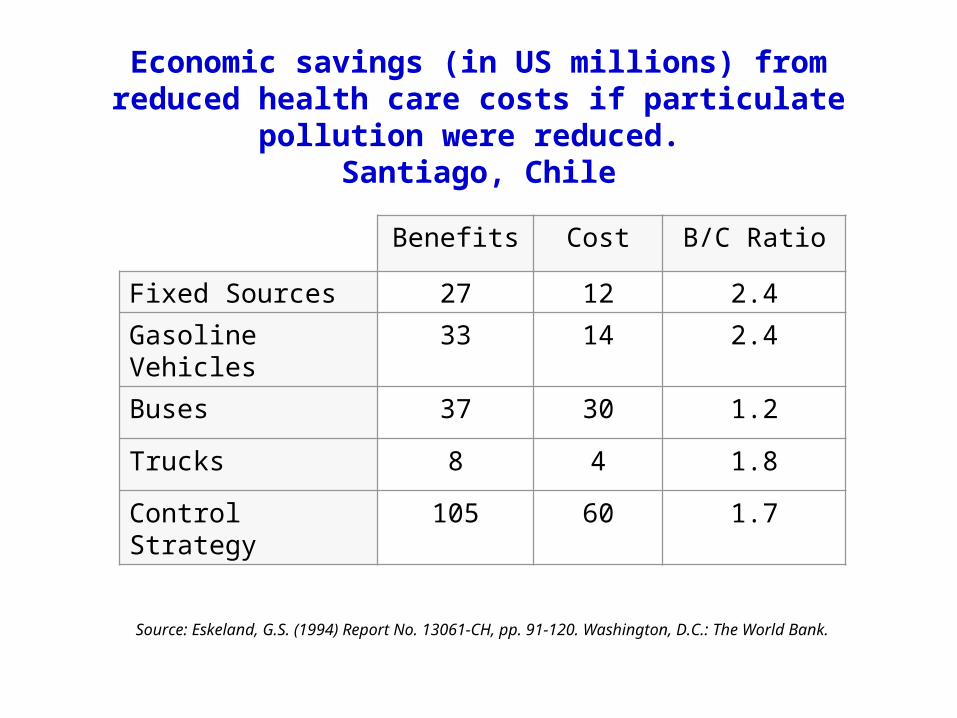
Economic savings (in US millions) from reduced health care costs if particulate pollution were reduced.
Santiago, Chile
Benefits Cost B/C Ratio
Fixed Sources 27 12 2.4
Gasoline Vehicles 33 14 2.4
Buses 37 30 1.2
Trucks 8 4 1.8
Control Strategy 105 60 1.7
Source: Eskeland, G.S. (1994) Report No. 13061-CH, pp. 91-120. Washington, D.C.: The World Bank.
Research Priorities
• Rich households spend a higher proportion of their budgets on gasoline than do poor households; gasoline vehicles give rise to a number of externalities among them air pollutant emissions
• Gasoline engines may affect poor households more than rich households.
What are the appropriate levels for gasoline taxes?
Research Priorities
• Emissions resulting from human activities are substantially increasing the atmospheric levels of the greenhouse gases:
– carbon dioxide
– Methane
– Chlorofluorocarbons
– nitrous oxide.
• Climate change will be one of the most challenging and complex environmental problems that future generations will be facing
Research Priorities
• Concerns about global warming must be taken seriously:– Rapid warming pathway
– Greenhouse gases have lifetimes of decades or even centuries
– Warming of the oceans occurs over many decades
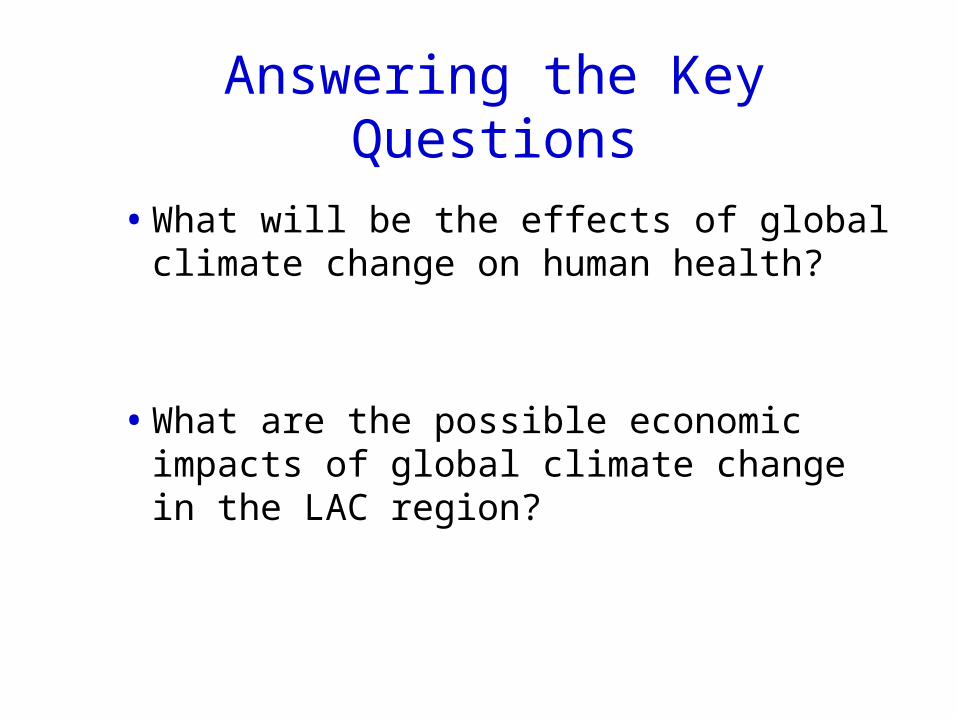
• What will be the effects of global climate change on human health?
• What are the possible economic impacts of global climate change in the LAC region?
Answering the Key Questions
Conclusions
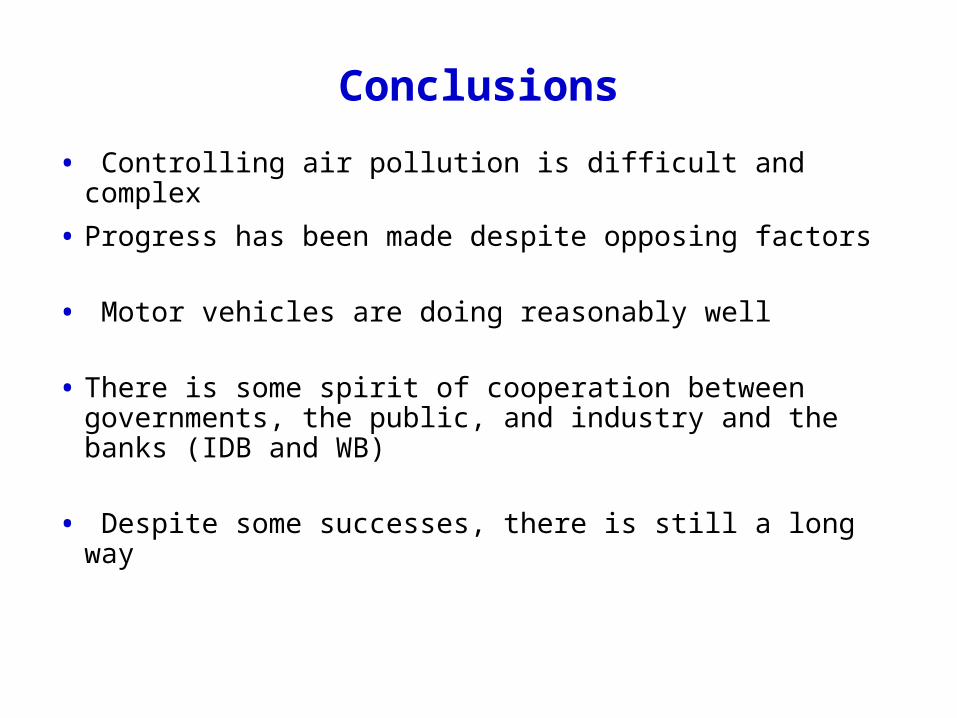
• Controlling air pollution is difficult and complex
• Progress has been made despite opposing factors
• Motor vehicles are doing reasonably well
• There is some spirit of cooperation between governments, the public, and industry and the banks (IDB and WB)
• Despite some successes, there is still a long way
Conclusions
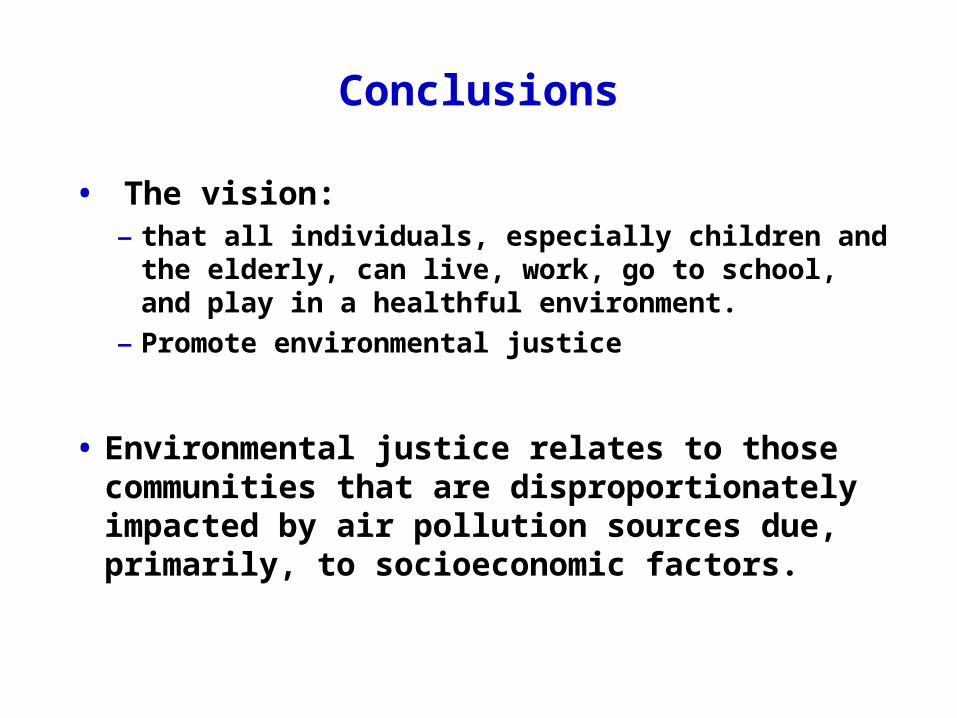
• The vision: – that all individuals, especially children and the
elderly, can live, work, go to school, and play in a healthful environment.
– Promote environmental justice
• Environmental justice relates to those communities that are disproportionately impacted by air pollution sources due, primarily, to socioeconomic factors.
Conclusions
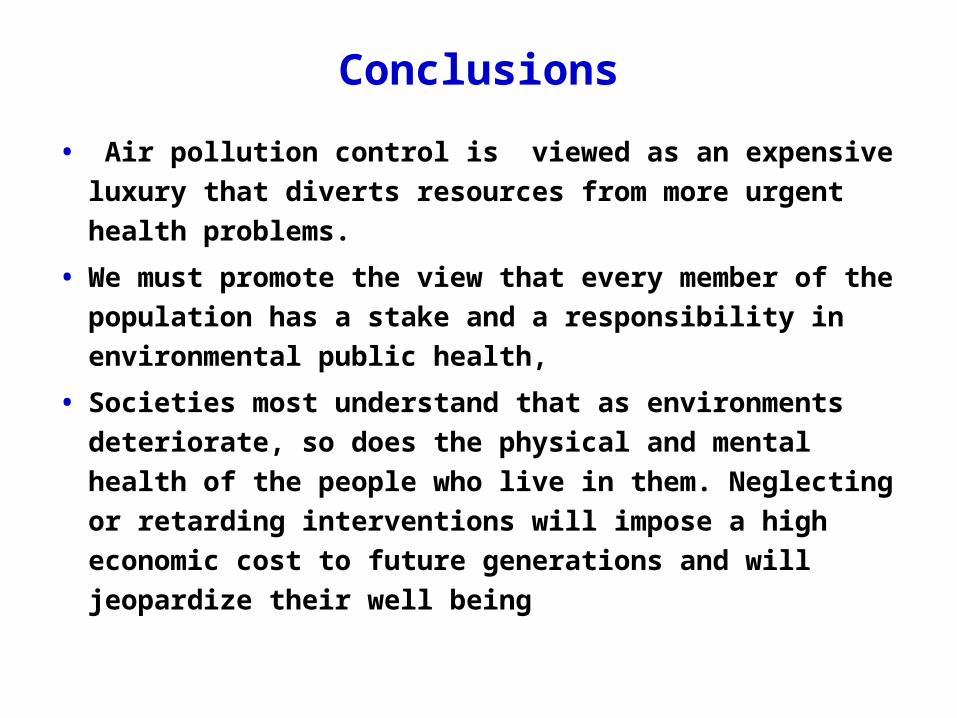
• Air pollution control is viewed as an expensive
luxury that diverts resources from more urgent health
problems.
• We must promote the view that every member of the
population has a stake and a responsibility in
environmental public health,
• Societies most understand that as environments
deteriorate, so does the physical and mental health of
the people who live in them. Neglecting or retarding
interventions will impose a high economic cost to
future generations and will jeopardize their well being
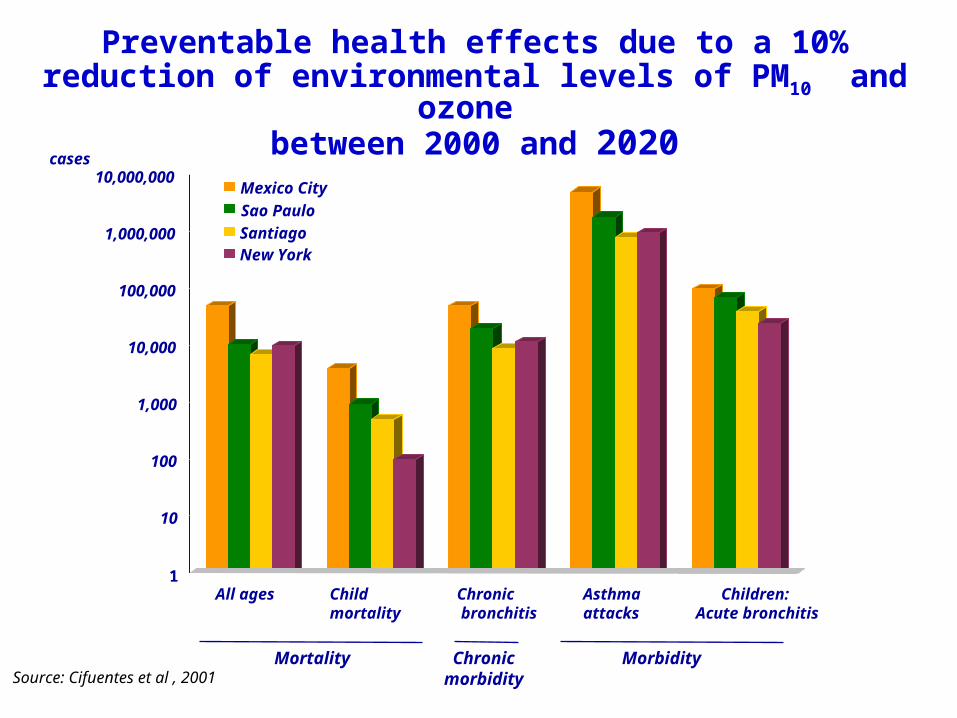
Preventable health effects due to a 10% reduction of environmental levels of PM10 and ozone
between 2000 and 2020
10
100
1,000
10,000
100,000
1,000,000
10,000,000
Mortality Chronic morbidity
Morbidity
1All ages Child
mortalityChronic bronchitis
Asthma attacks
Children: Acute bronchitis
Mexico City
Sao Paulo
SantiagoNew York
cases
Source: Cifuentes et al , 2001
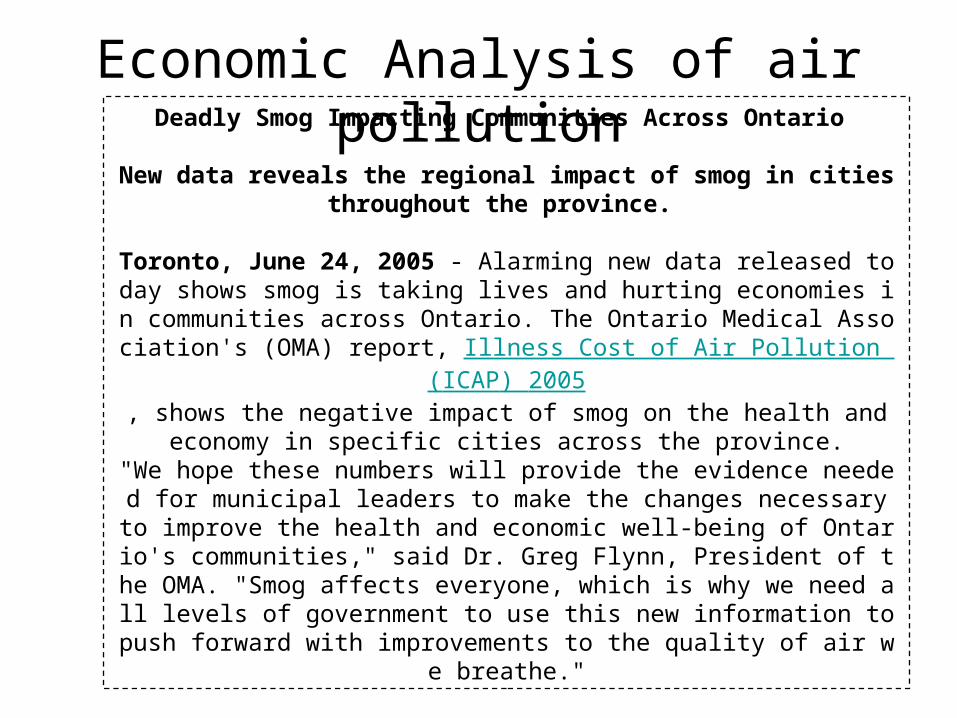
Economic Analysis of air pollutionDeadly Smog Impacting Communities Across Ontario
New data reveals the regional impact of smog in cities throughout the province.
Toronto, June 24, 2005 - Alarming new data released today shows smog is taking lives and hurting economies in communities across Ontario. The Ontario Medical Association's (OMA) report, Illness Cost of Air Pollution (
ICAP) 2005, shows the negative impact of smog on the health and economy in specifi
c cities across the province."We hope these numbers will provide the evidence needed for municipal leaders to make the changes necessary to improve the health and economic well-being of Ontario's communities," said Dr. Greg Flynn, President of the OMA. "Smog affects everyone, which is why we need all levels of government to use this new information to push forward with improvements to t
he quality of air we breathe."
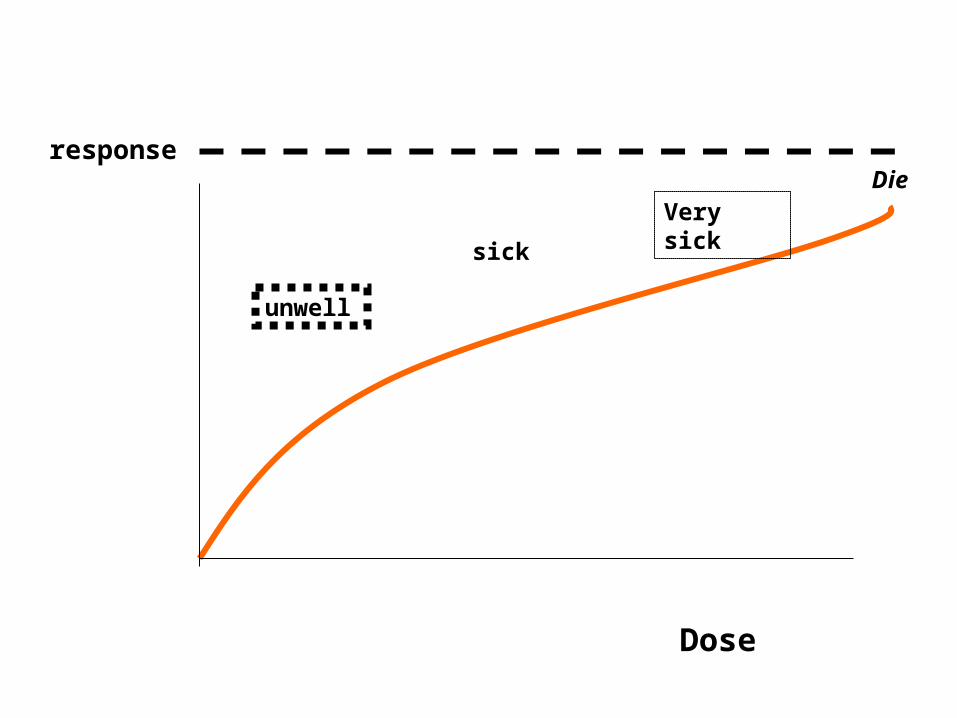
Dose
responseDie
Very sick
sick
unwell
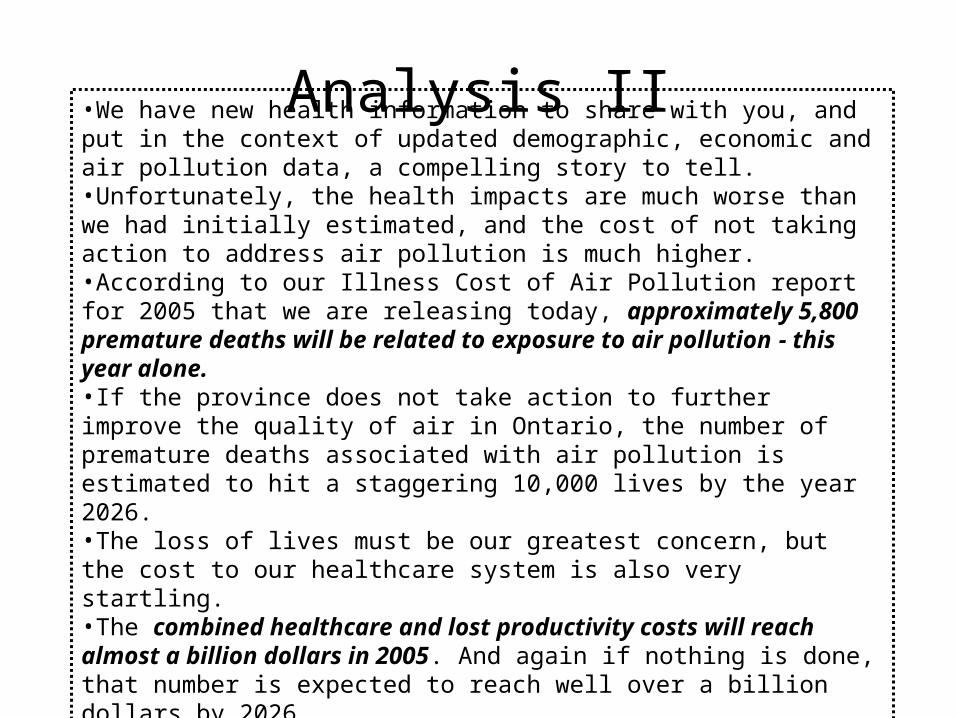
Analysis II•We have new health information to share with you, and put in the context of updated demographic, economic and air pollution data, a compelling story to tell.•Unfortunately, the health impacts are much worse than we had initially estimated, and the cost of not taking action to address air pollution is much higher. •According to our Illness Cost of Air Pollution report for 2005 that we are releasing today, approximately 5,800 premature deaths will be related to exposure to air pollution - this year alone.•If the province does not take action to further improve the quality of air in Ontario, the number of premature deaths associated with air pollution is estimated to hit a staggering 10,000 lives by the year 2026.•The loss of lives must be our greatest concern, but the cost to our healthcare system is also very startling.•The combined healthcare and lost productivity costs will reach almost a billion dollars in 2005. And again if nothing is done, that number is expected to reach well over a billion dollars by 2026.
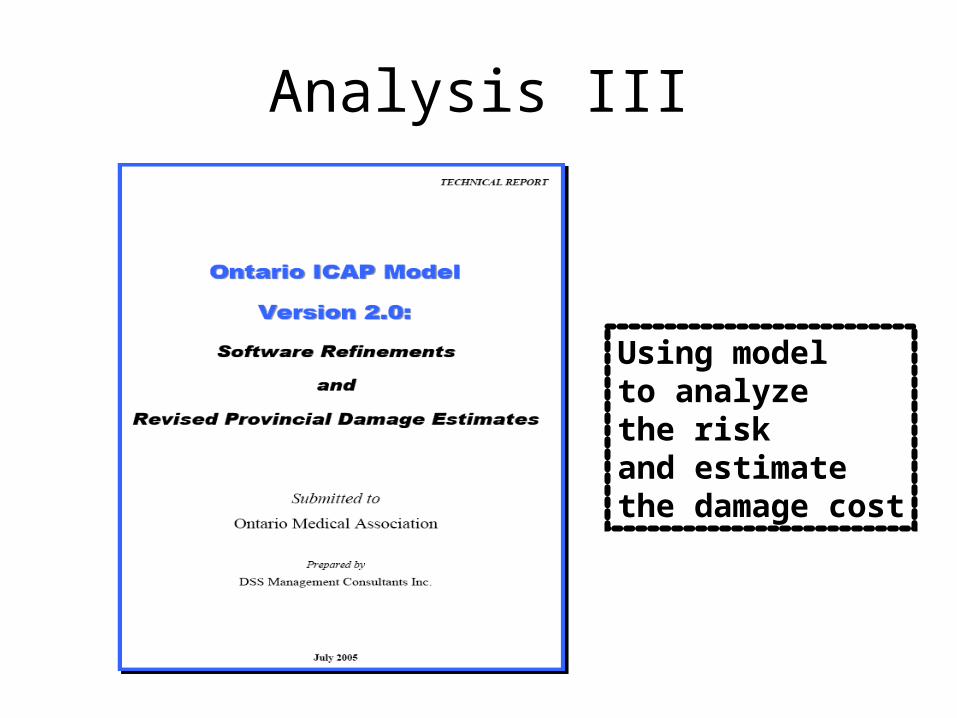
Analysis III
Using model to analyze the risk and estimate the damage cost
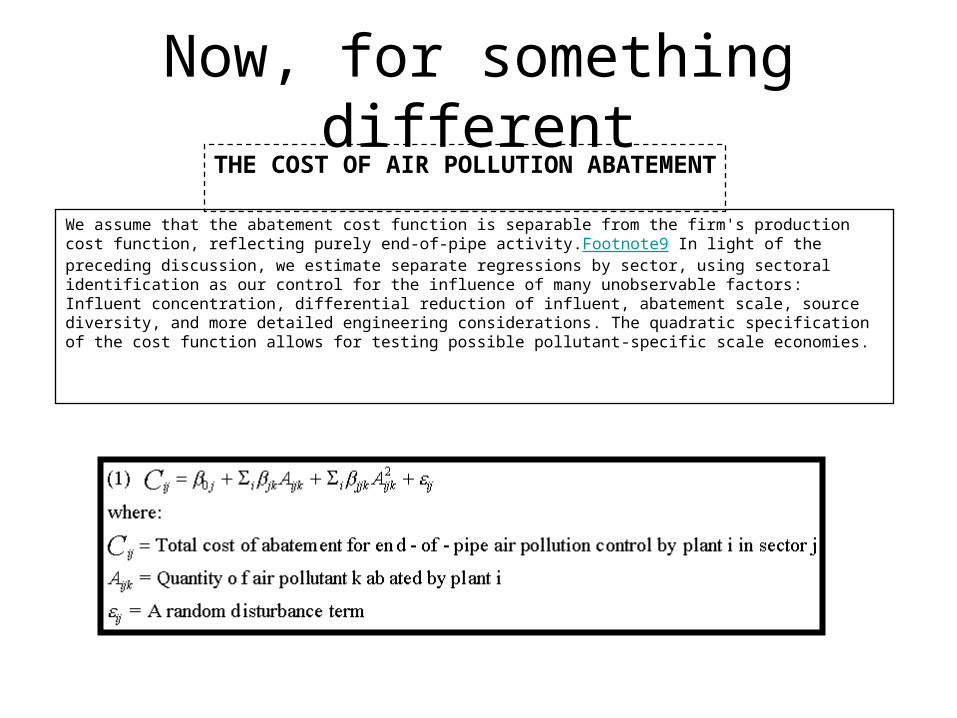
Now, for something differentTHE COST OF AIR POLLUTION ABATEMENT
We assume that the abatement cost function is separable from the firm's production cost function, reflecting purely end-of-pipe activity.Footnote9 In light of the preceding discussion, we estimate separate regressions by sector, using sectoral identification as our control for the influence of many unobservable factors: Influent concentration, differential reduction of influent, abatement scale, source diversity, and more detailed engineering considerations. The quadratic specification of the cost function allows for testing possible pollutant-specific scale economies.
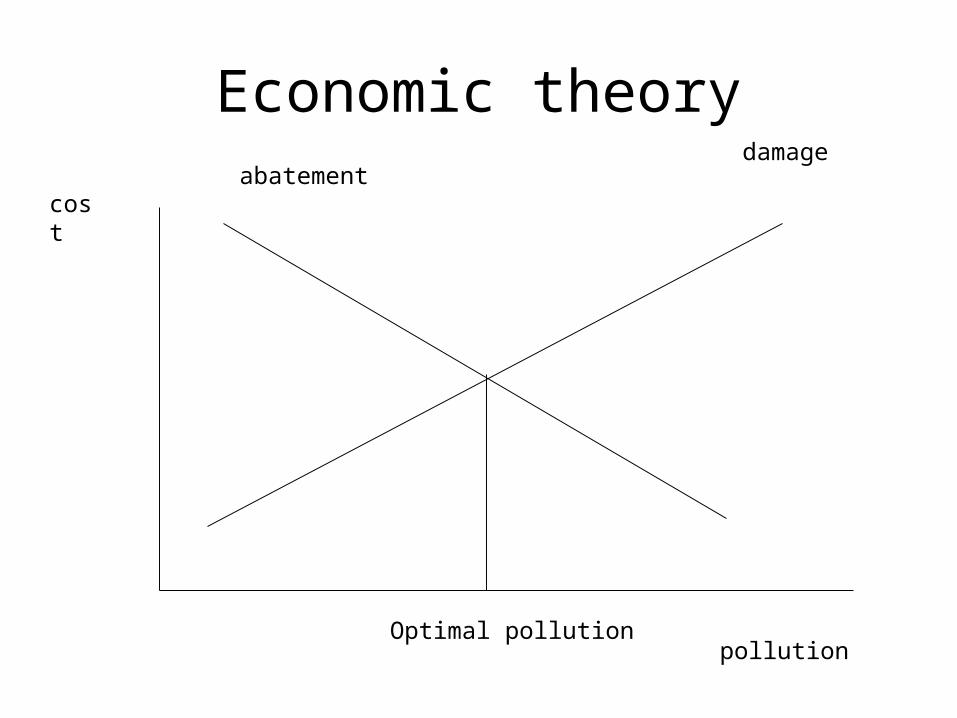
Economic theory
cost
pollution
damageabatement
Optimal pollution
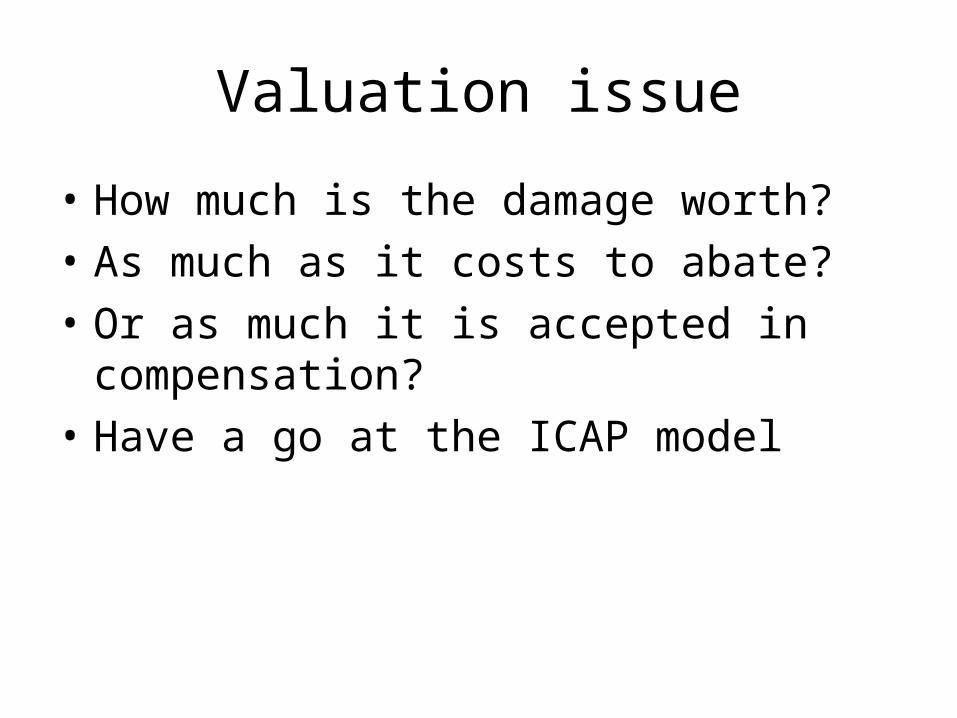
Valuation issue
• How much is the damage worth?
• As much as it costs to abate?
• Or as much it is accepted in compensation?
• Have a go at the ICAP model
By Navaroj Yasawadi
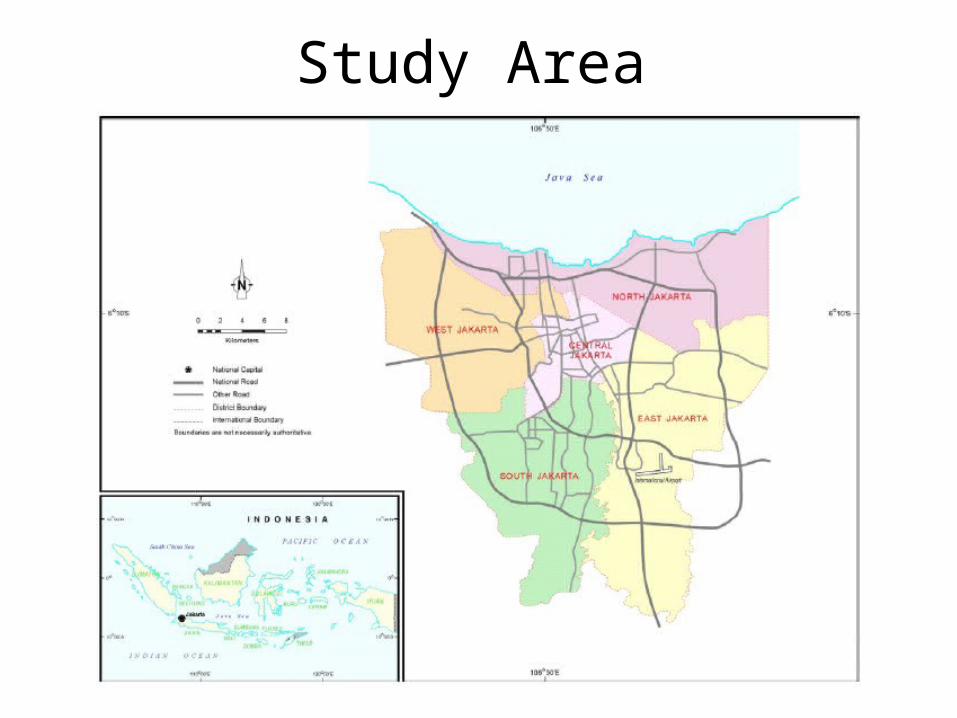
Study Area
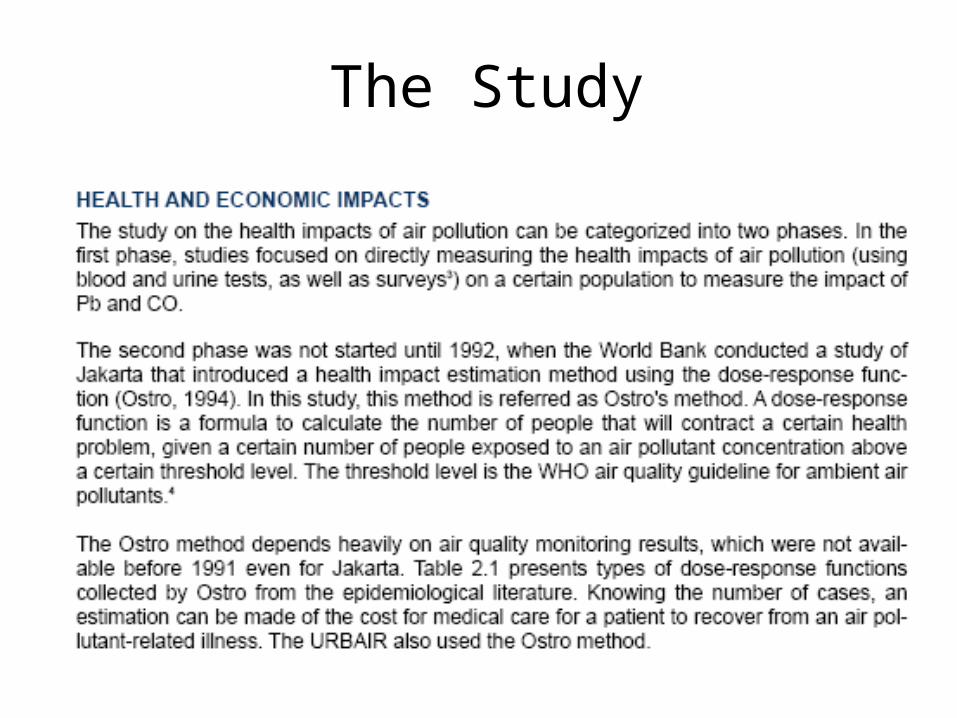
The Study
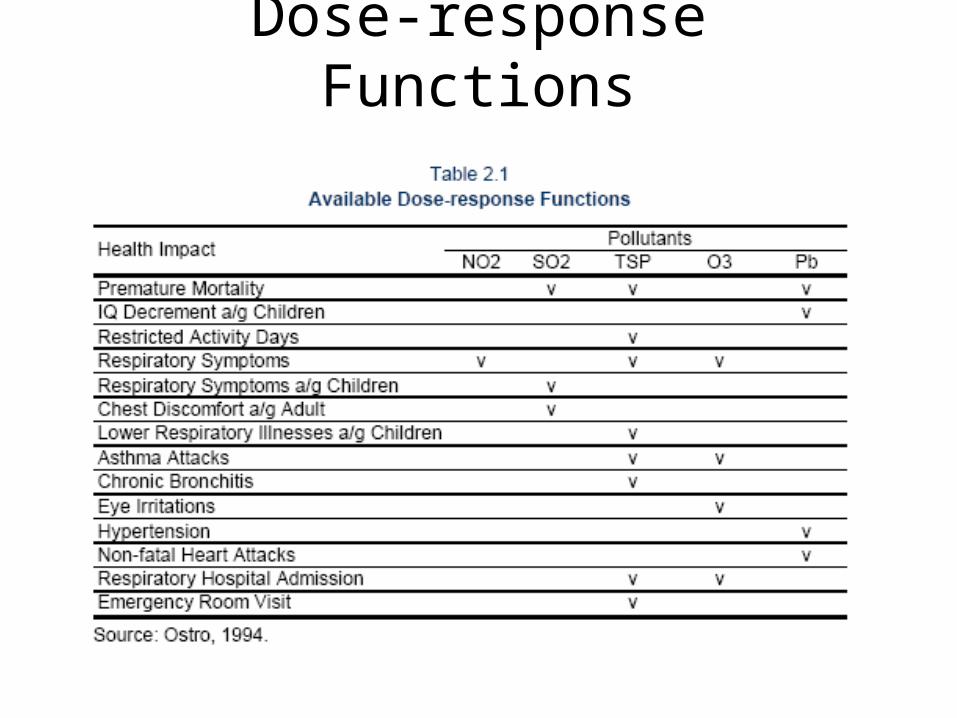
Dose-response Functions
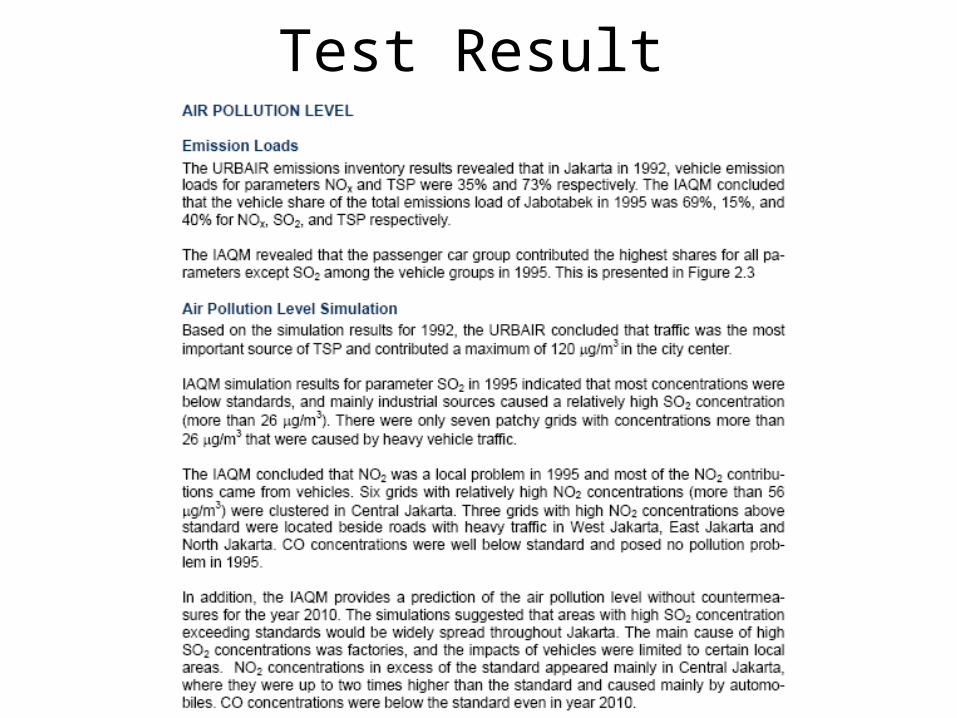
Test Result
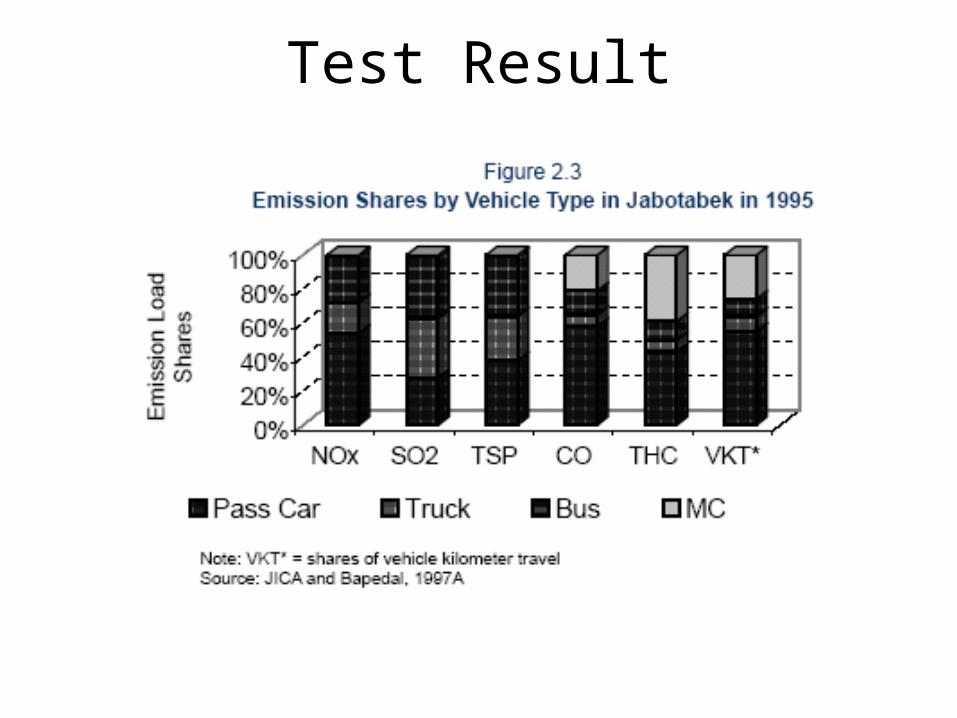
Test Result
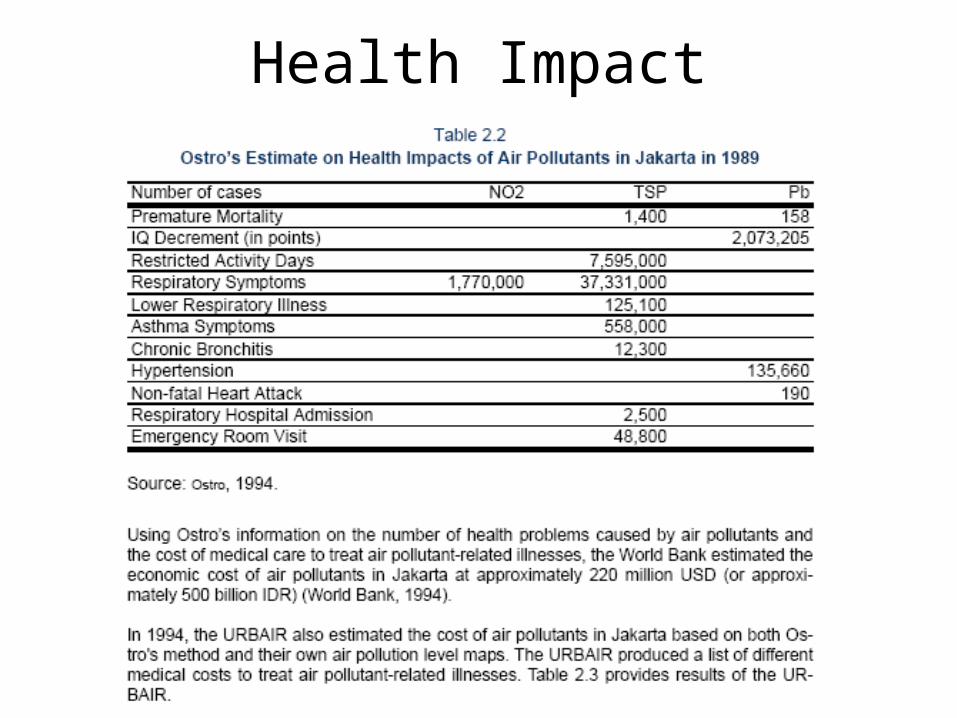
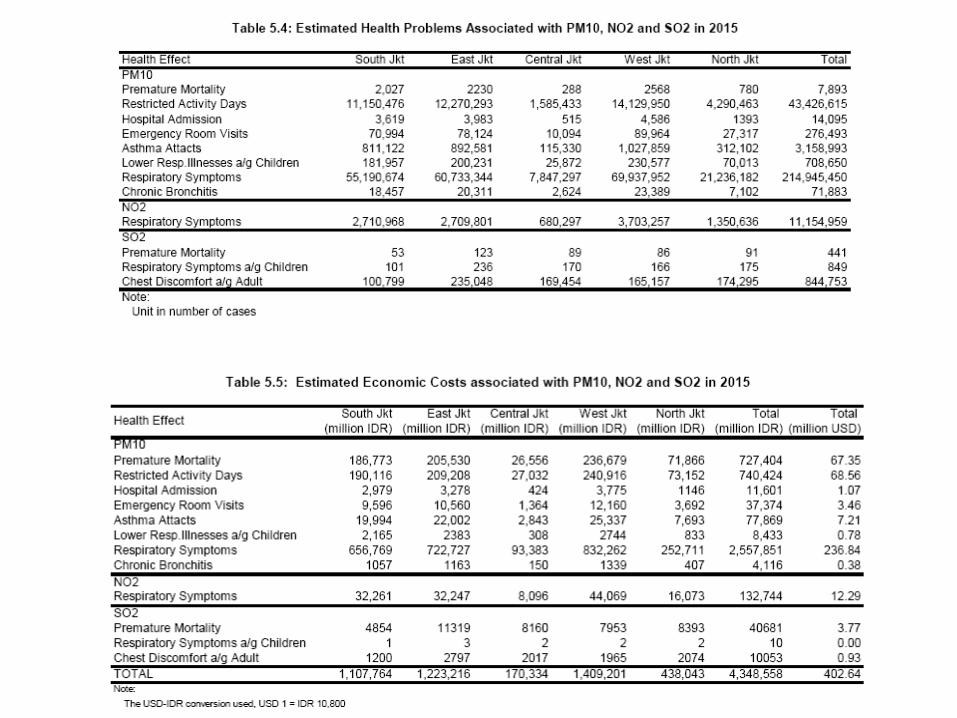
Health Impact
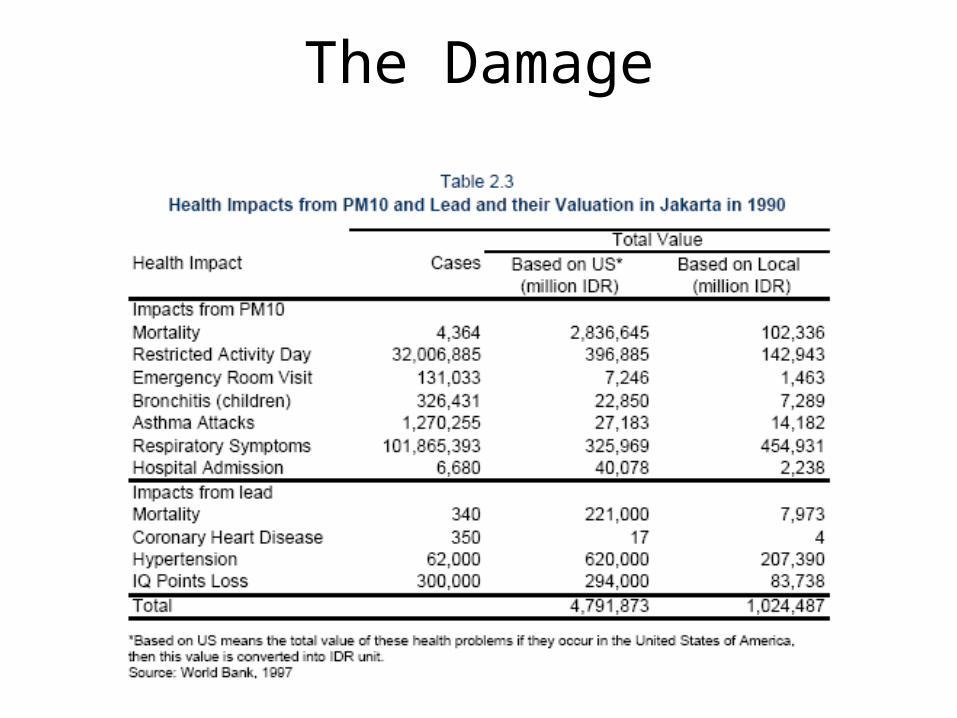
The Damage
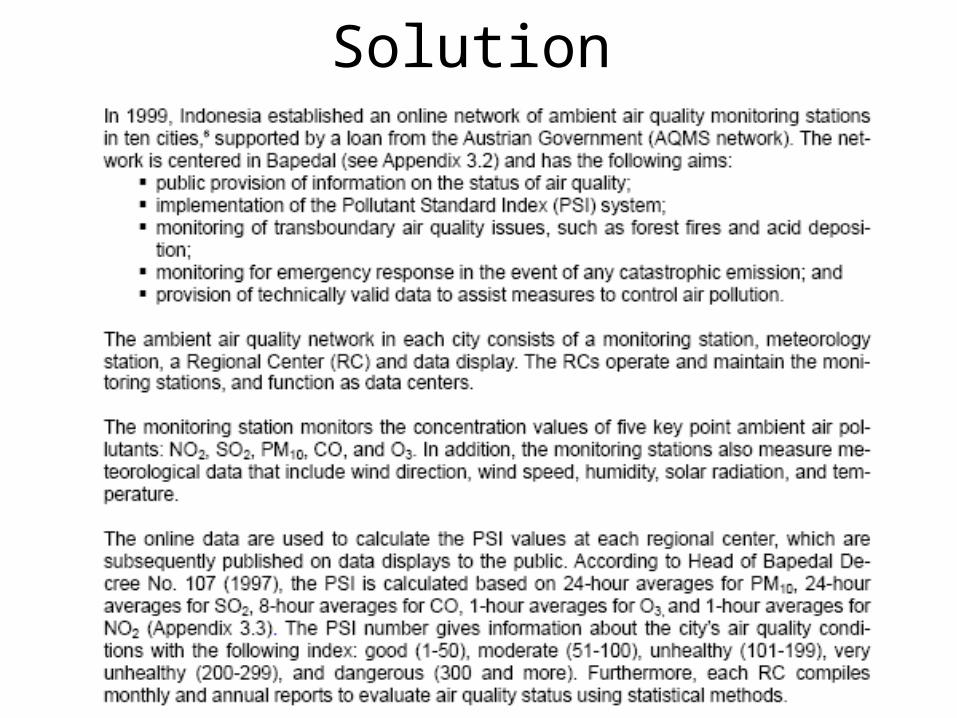
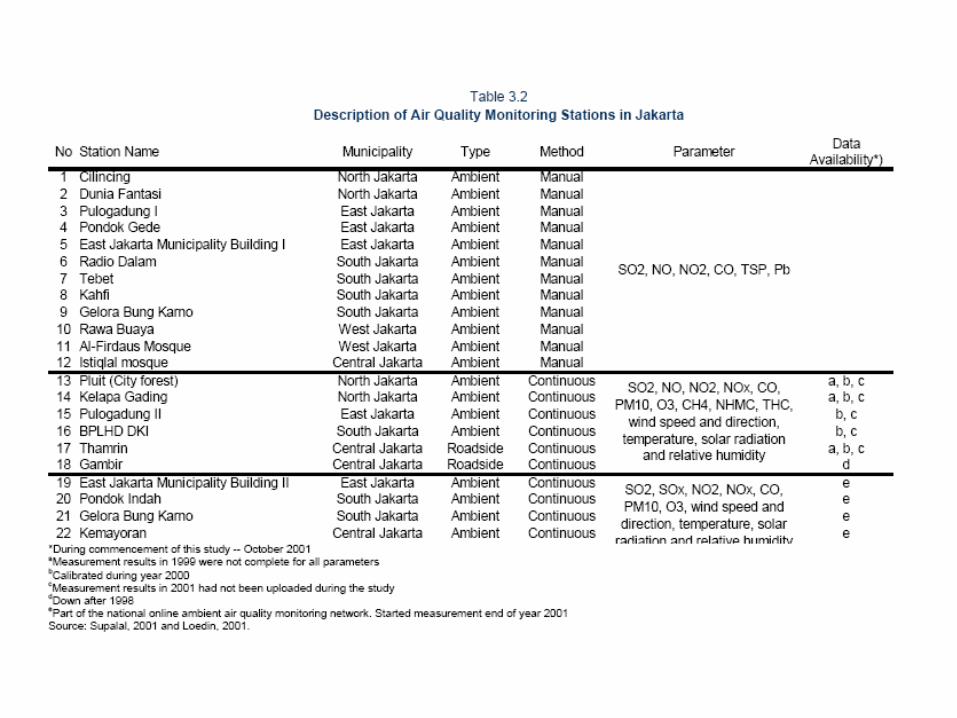
Solution
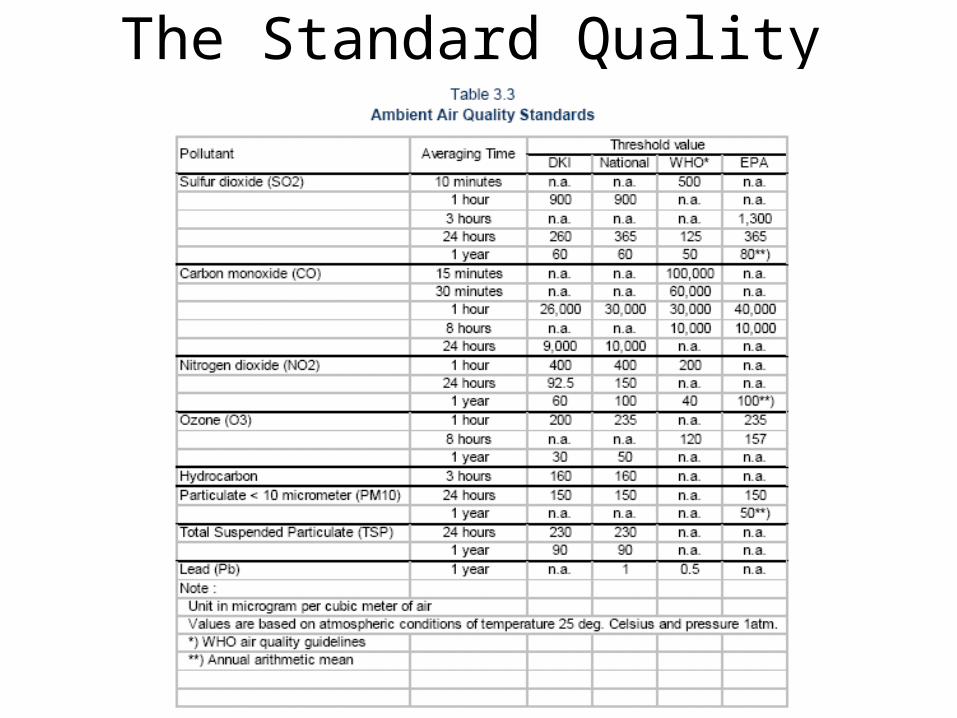
The Standard Quality
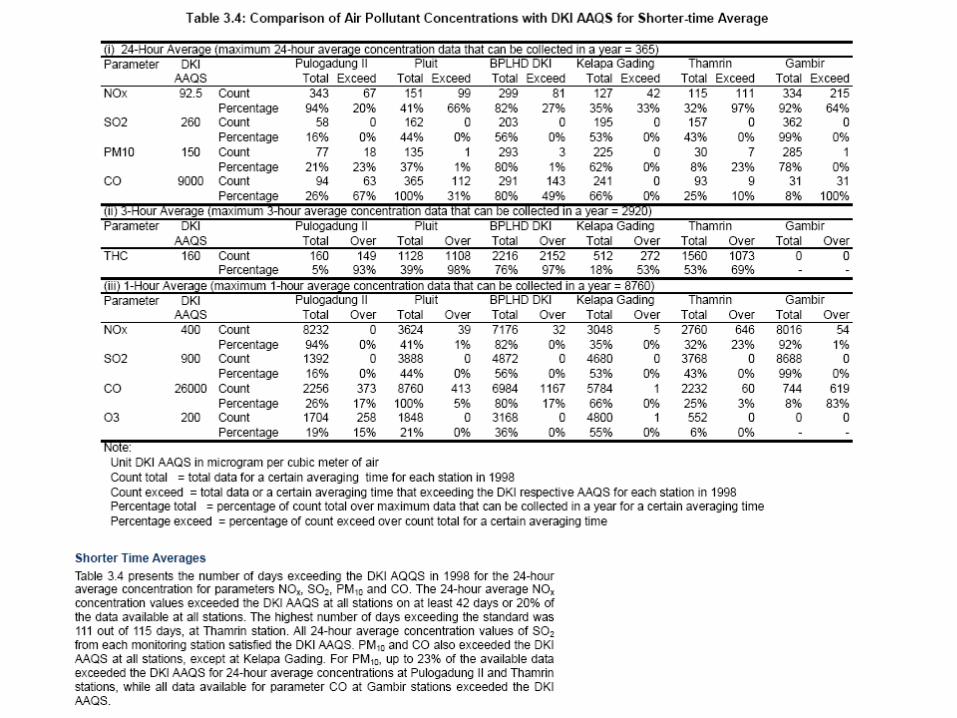
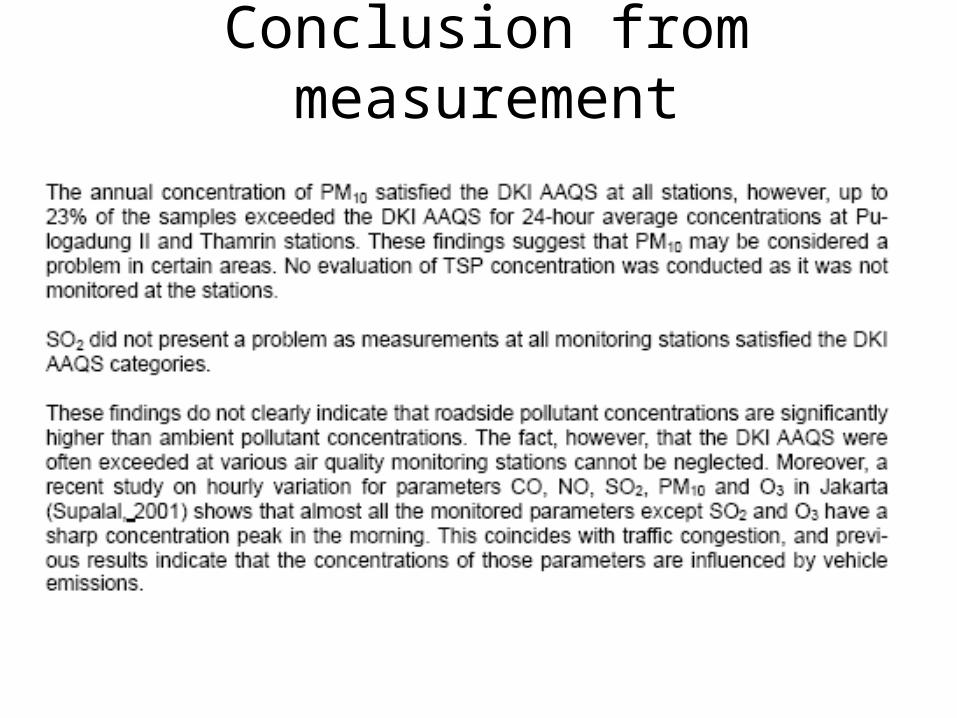
Conclusion from measurement
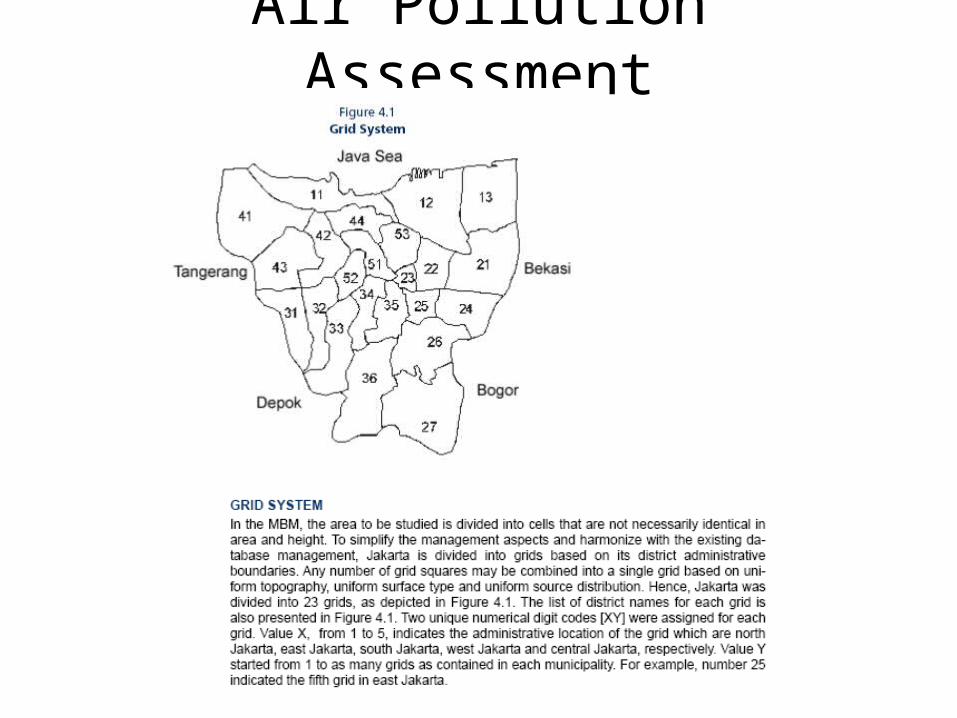
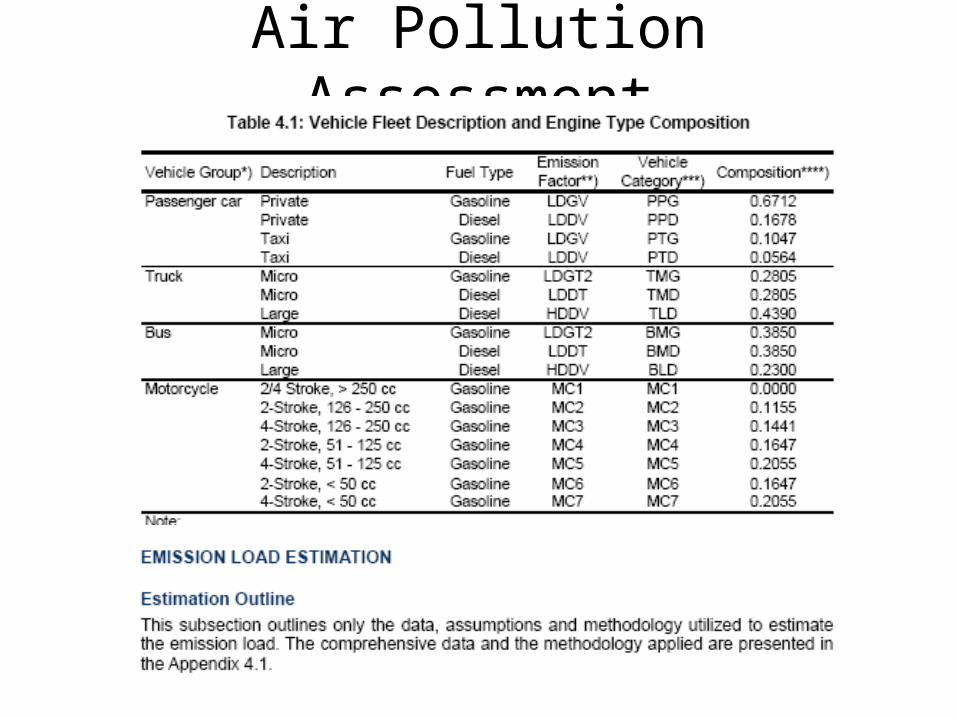
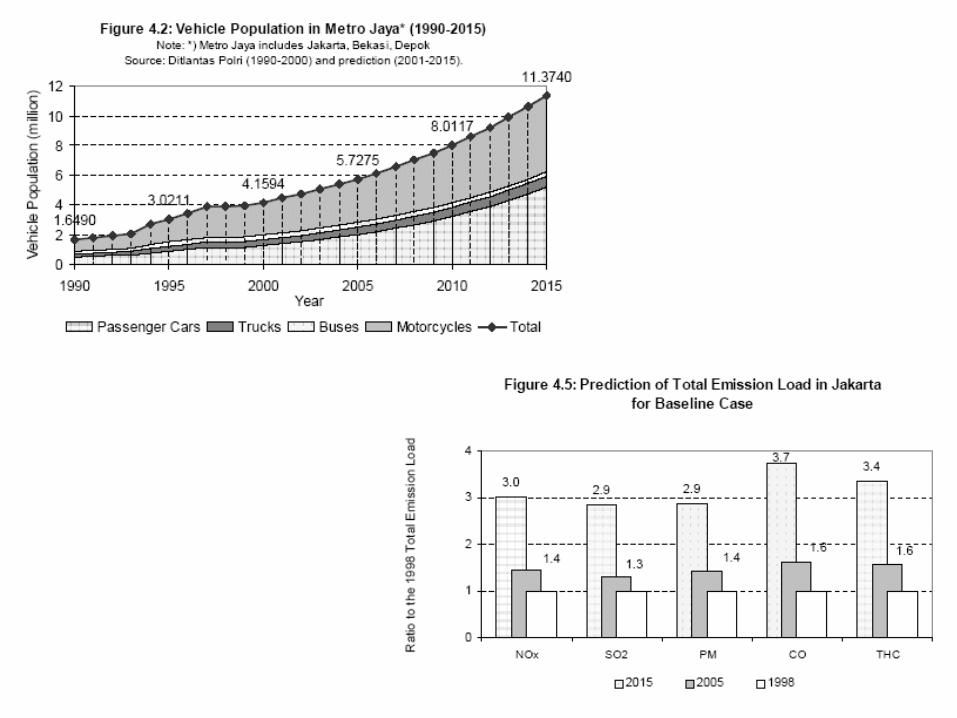
Air Pollution Assessment
Air Pollution Assessment
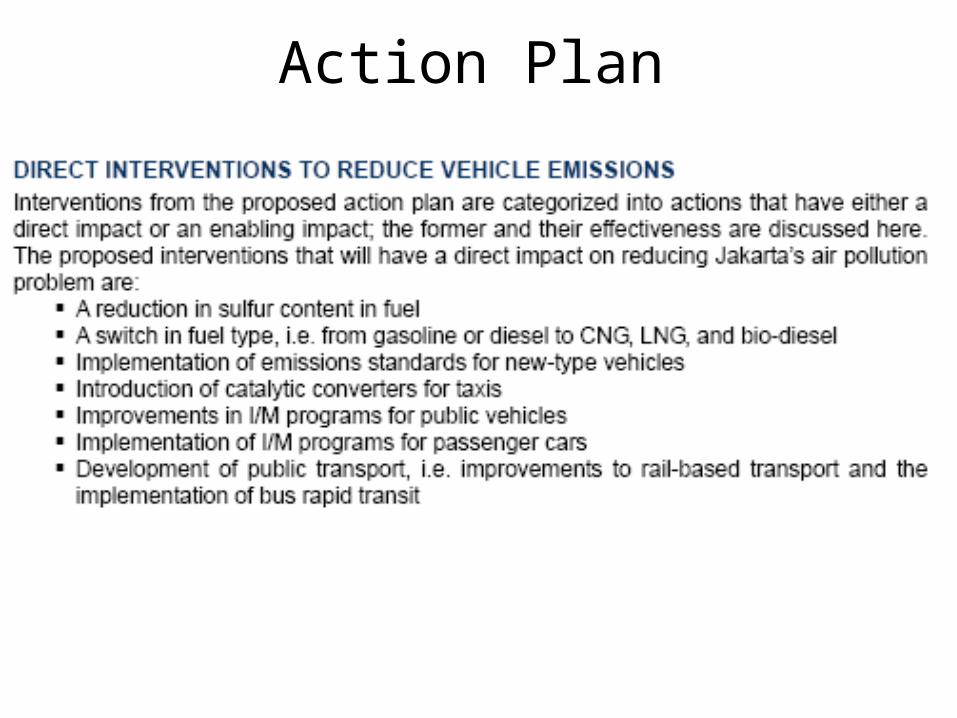
Action Plan

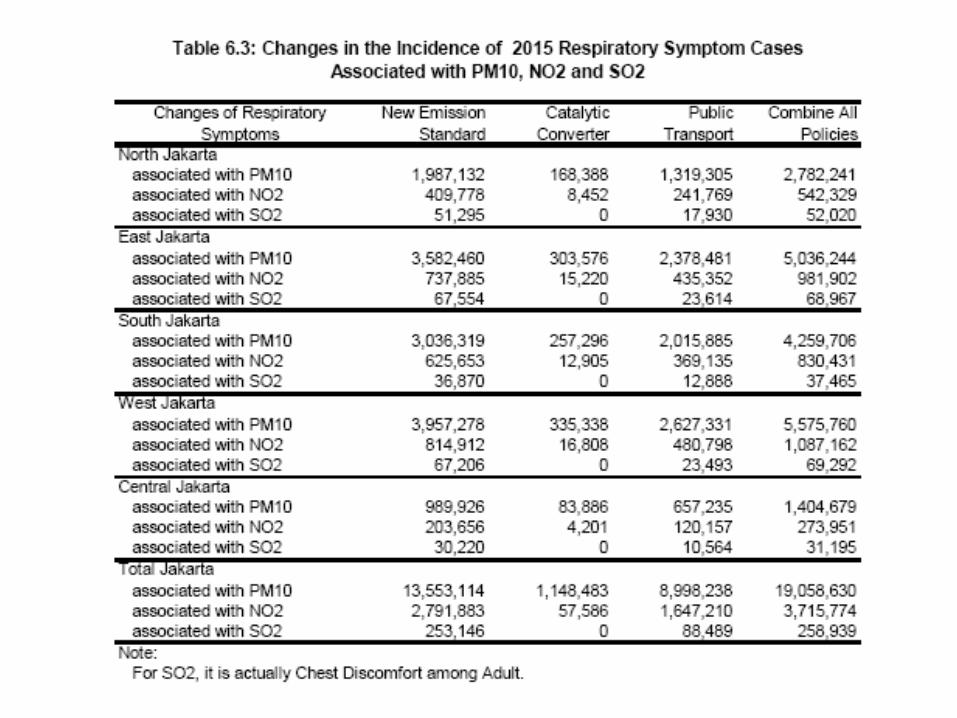
Estimation of result
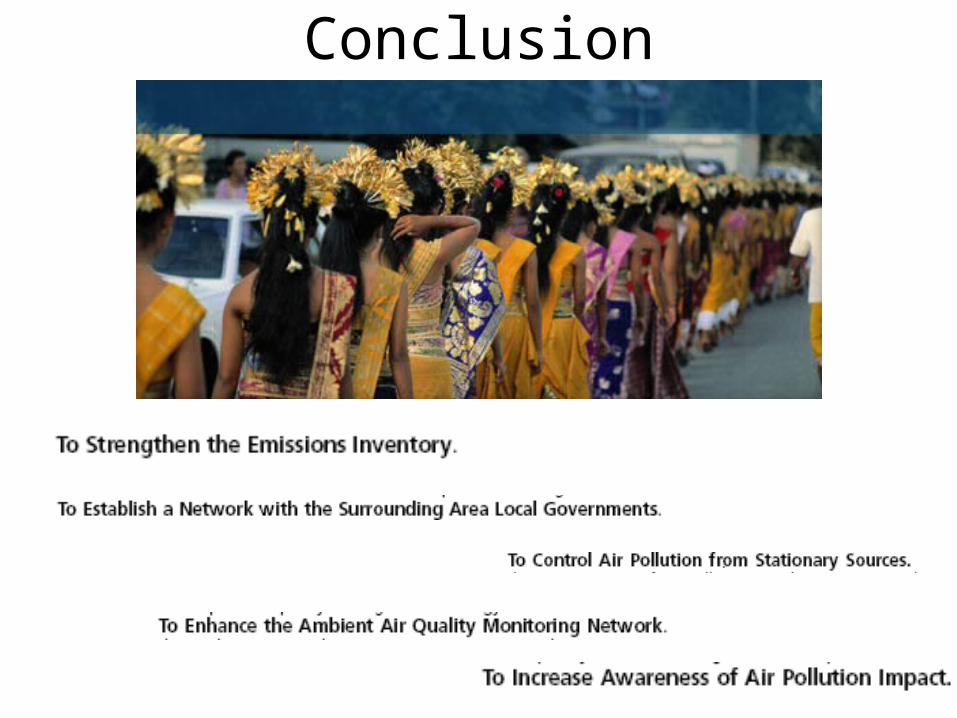
Conclusion