Embed Size (px)
Citation preview
Valuation-Driven Profit Transfer among Corporate Segments
1
Valuation-Driven Profit Transfer among Corporate Segments
Haifeng You Hong Kong University of Science and
Technology
Shanghai University of Finance and Economics
May 20, 2011
Valuation-Driven Profit Transfer among Corporate Segments
2
Research Questions
• Does equity valuation consideration induce conglomerates to transfer profits among corporate segments? Specifically, do they transfer profits from segments with relatively low valuations to those with high valuations?
• If such incentives exist, do they vary with the dispersion of segment valuations?
• What are the implications on equity valuation of conglomerate firms?

Valuation-Driven Profit Transfer among Corporate Segments
3
Background: Analysts’ valuation of conglomerates
Valuation-Driven Profit Transfer among Corporate Segments
4
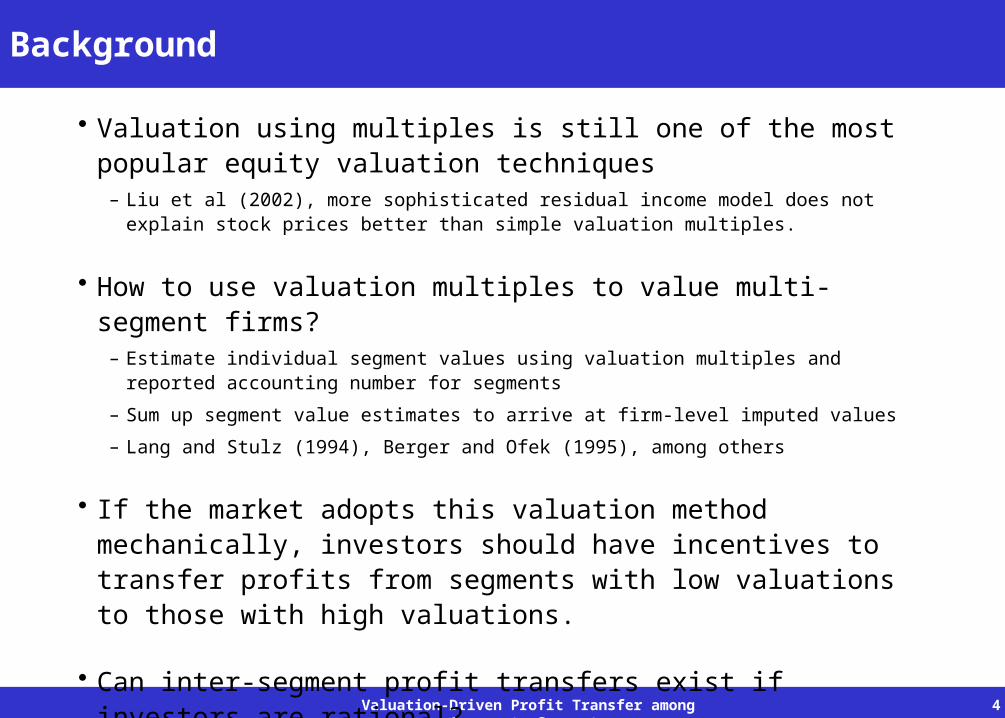
Background
• Valuation using multiples is still one of the most popular equity valuation techniques – Liu et al (2002), more sophisticated residual income model does not explain stock
prices better than simple valuation multiples.
• How to use valuation multiples to value multi-segment firms?– Estimate individual segment values using valuation multiples and reported
accounting number for segments
– Sum up segment value estimates to arrive at firm-level imputed values
– Lang and Stulz (1994), Berger and Ofek (1995), among others
• If the market adopts this valuation method mechanically, investors should have incentives to transfer profits from segments with low valuations to those with high valuations.
• Can inter-segment profit transfers exist if investors are rational?
Valuation-Driven Profit Transfer among Corporate Segments
5
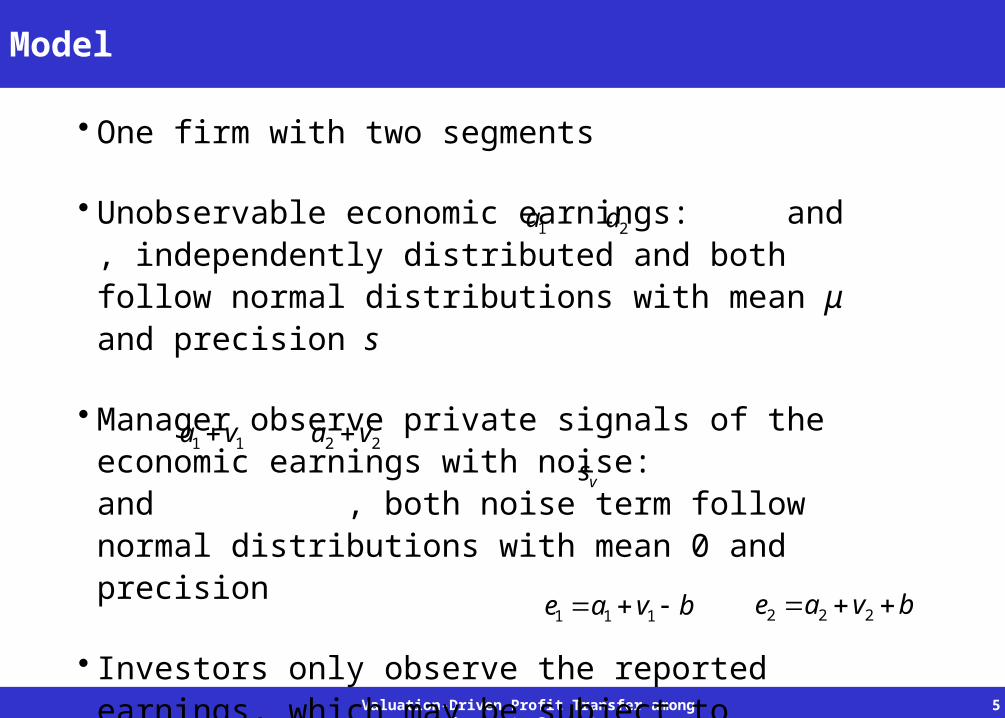
Model
• One firm with two segments
• Unobservable economic earnings: and , independently distributed and both follow normal distributions with mean μ and precision s
• Manager observe private signals of the economic earnings with noise: and , both noise term follow normal distributions with mean 0 and precision
• Investors only observe the reported earnings, which may be subject to manipulation, denoted as: and Neither manager’s private signal nor b is observable to investors.
1a 2a
11 va 22 va
vs
bvae 111 bvae 222

Valuation-Driven Profit Transfer among Corporate Segments
6
Model
• Managers bear personal costs for profit transfer f(b). The cost function is a convex function with f(0)=0 and f’(0)=0.
• Earnings multiples for the two segments, m and m+n, are exogenous. And n>0.
• The task of the market is to determine the market value of the firm, given reported earnings and a conjecture of profit transfer:
It is easy to show that:
,
Valuation-Driven Profit Transfer among Corporate Segments
7
Model
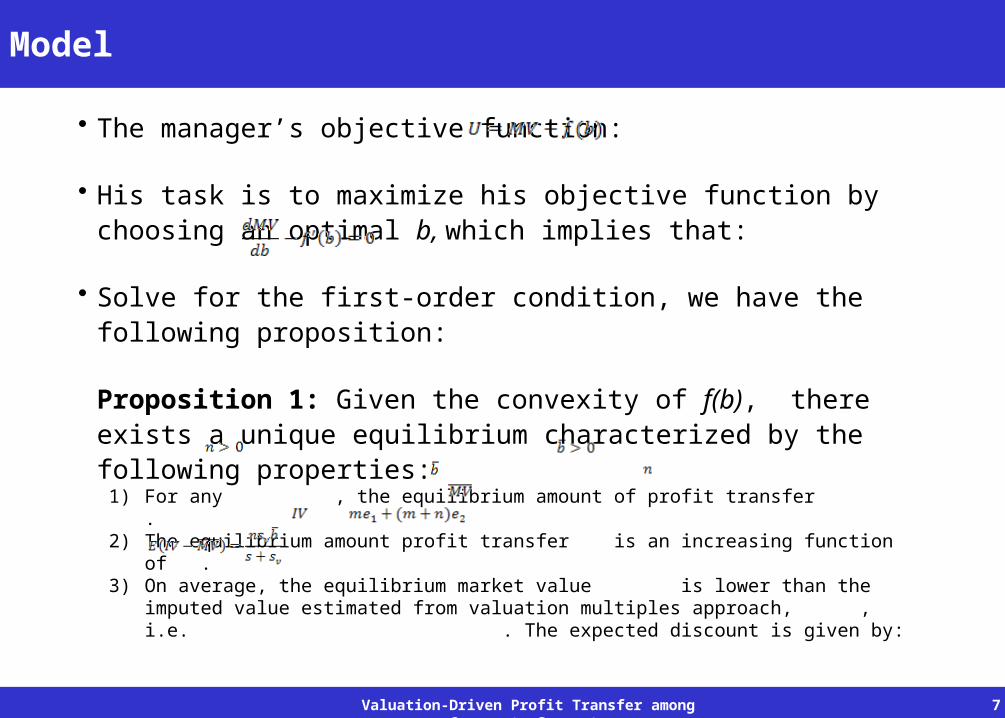
• The manager’s objective function:
• His task is to maximize his objective function by choosing an optimal b, which implies that:
• Solve for the first-order condition, we have the following proposition:
Proposition 1: Given the convexity of f(b), there exists a unique equilibrium characterized by the following properties:
1) For any , the equilibrium amount of profit transfer .2) The equilibrium amount profit transfer is an increasing function of .3) On average, the equilibrium market value is lower than the imputed value
estimated from valuation multiples approach, , i.e. . The expected discount is given by:
Valuation-Driven Profit Transfer among Corporate Segments
8
Empirical Implications and Hypotheses
• Property 1: For any , the equilibrium amount of profit transfer
• Even if investors are rational and the market is not fooled, the manager still transfers a positive amount of profits from the segment with lower valuation to the other.
• If profits are transferred to (from) segments with relatively higher (lower) valuations, those segments should report abnormally high (low) profitability.
• Hypothesis 1: Ceteris paribus, the abnormal profitability of a segment is increasing with its relative valuation multiple.
Valuation-Driven Profit Transfer among Corporate Segments
9
Empirical Implications and Hypotheses
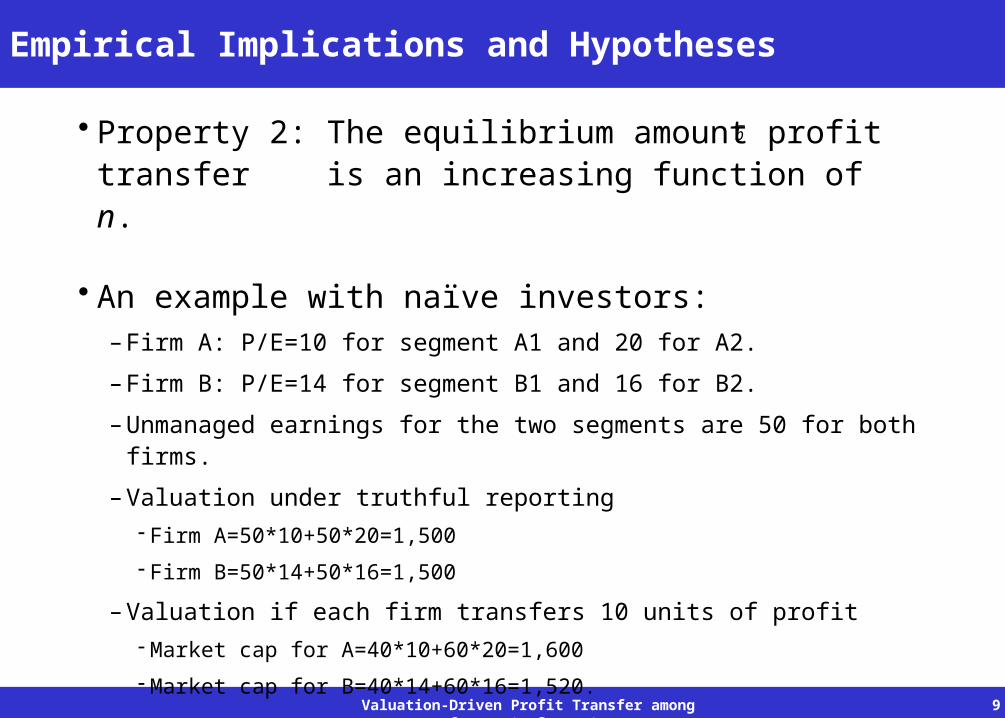
• Property 2: The equilibrium amount profit transfer is an increasing function of n.
• An example with naïve investors:– Firm A: P/E=10 for segment A1 and 20 for A2.
– Firm B: P/E=14 for segment B1 and 16 for B2.
–Unmanaged earnings for the two segments are 50 for both firms.
– Valuation under truthful reporting- Firm A=50*10+50*20=1,500
- Firm B=50*14+50*16=1,500
– Valuation if each firm transfers 10 units of profit- Market cap for A=40*10+60*20=1,600
- Market cap for B=40*14+60*16=1,520.
b
Valuation-Driven Profit Transfer among Corporate Segments
10
Empirical Implications and Hypotheses
• Under the rational framework, investors do not observe, but rationally anticipate the amount of profit transfer.
• Given any market conjecture, the marginal benefit of profit transfer under the rational investor scenario is still larger for firms with more dispersed valuations. Other things being equal, these firms should have greater incentive to transfer profits.
• Hypothesis 2: The positive association between abnormal profitability and relative industry valuation is stronger for conglomerate firms with more dispersed valuation multiples.
Valuation-Driven Profit Transfer among Corporate Segments
11
Empirical Implications and Hypotheses
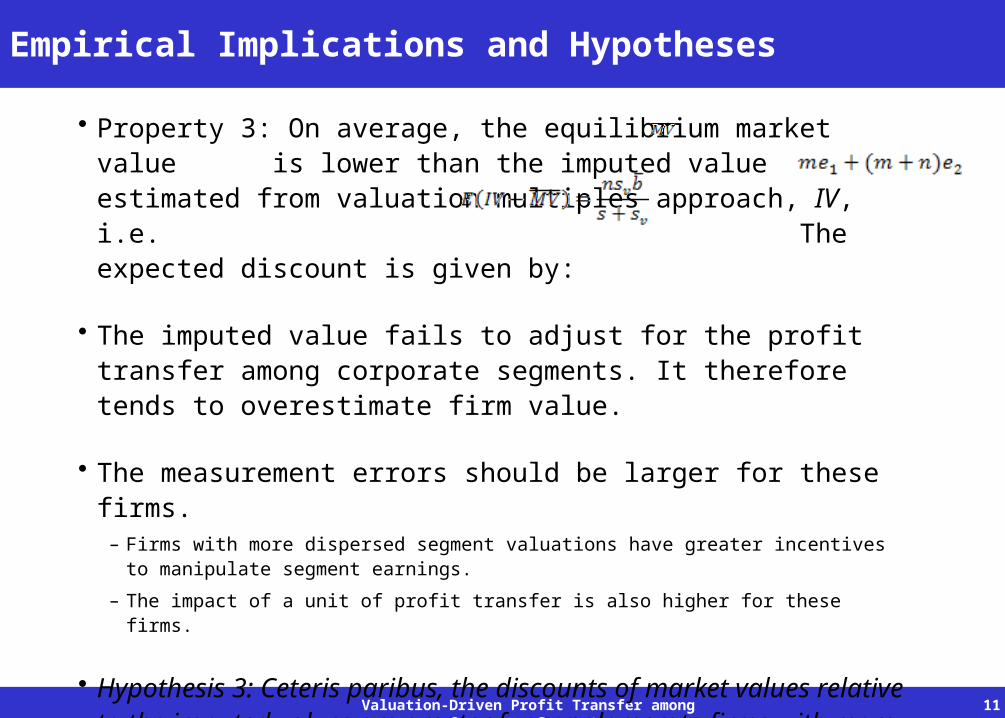
• Property 3: On average, the equilibrium market value is lower than the imputed value estimated from valuation multiples approach, IV, i.e. The expected discount is given by:
• The imputed value fails to adjust for the profit transfer among corporate segments. It therefore tends to overestimate firm value.
• The measurement errors should be larger for these firms. – Firms with more dispersed segment valuations have greater incentives to
manipulate segment earnings.
– The impact of a unit of profit transfer is also higher for these firms.
• Hypothesis 3: Ceteris paribus, the discounts of market values relative to the imputed values are greater for conglomerate firms with more dispersed segment valuation multiples.
Valuation-Driven Profit Transfer among Corporate Segments
12
Data and Sample Selection
• Financial data– Segment data: Compustat Segments Database
–Other financial data: Compustat North America Fundamental
• Stock returns and prices: CRSP
• Sample selection– Sample period: 1998-2007
– Exclude financial and utilities industries
– Exclude firm-years with total assets or sales revenue less than $20 million
– Exclude multiple-segment firms with total sales from Compustat Segment database differing from sales revenue from the Annual Fundamental database for more than 1%
Valuation-Driven Profit Transfer among Corporate Segments
13
Research Design
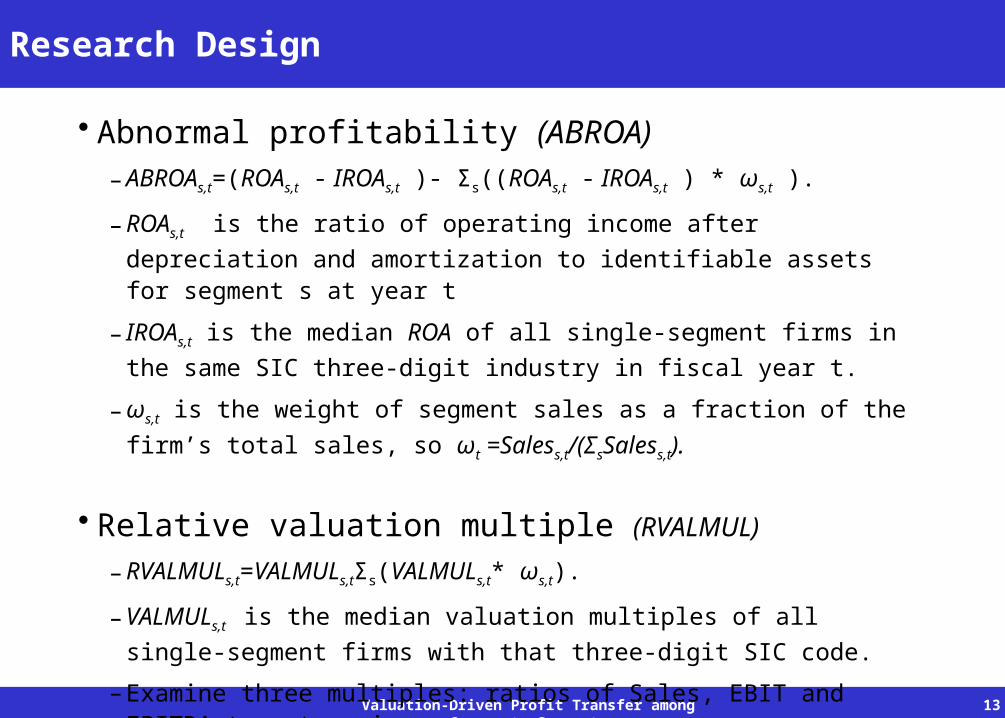
• Abnormal profitability (ABROA)– ABROAs,t=(ROAs,t - IROAs,t )- Σs((ROAs,t - IROAs,t ) * ωs,t ).
–ROAs,t is the ratio of operating income after depreciation and
amortization to identifiable assets for segment s at year t
– IROAs,t is the median ROA of all single-segment firms in the
same SIC three-digit industry in fiscal year t.
–ωs,t is the weight of segment sales as a fraction of the firm’s total
sales, so ωt =Saless,t/(ΣsSaless,t).
• Relative valuation multiple (RVALMUL)
–RVALMULs,t=VALMULs,tΣs(VALMULs,t* ωs,t).
– VALMULs,t is the median valuation multiples of all single-
segment firms with that three-digit SIC code.
– Examine three multiples: ratios of Sales, EBIT and EBITDA to enterprises
Valuation-Driven Profit Transfer among Corporate Segments
14
Model to Test Hypothesis 1
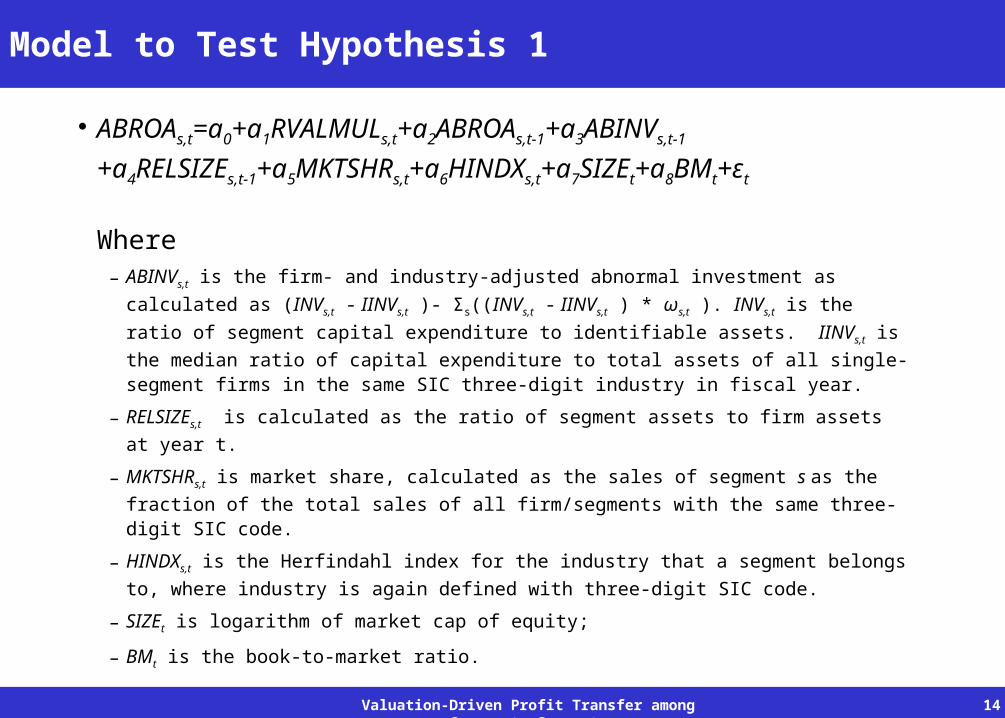
• ABROAs,t=a0+a1RVALMULs,t+a2ABROAs,t-1+a3ABINVs,t-1
+a4RELSIZEs,t-
1+a5MKTSHRs,t+a6HINDXs,t+a7SIZEt+a8BMt+εt
Where – ABINVs,t is the firm- and industry-adjusted abnormal investment as calculated as
(INVs,t - IINVs,t )- Σs((INVs,t - IINVs,t ) * ωs,t ). INVs,t is the ratio of segment capital
expenditure to identifiable assets. IINVs,t is the median ratio of capital expenditure
to total assets of all single-segment firms in the same SIC three-digit industry in fiscal year.
– RELSIZEs,t is calculated as the ratio of segment assets to firm assets at year t.
– MKTSHRs,t is market share, calculated as the sales of segment s as the fraction of
the total sales of all firm/segments with the same three-digit SIC code.
– HINDXs,t is the Herfindahl index for the industry that a segment belongs to, where
industry is again defined with three-digit SIC code.
– SIZEt is logarithm of market cap of equity;
– BMt is the book-to-market ratio.
Valuation-Driven Profit Transfer among Corporate Segments
15
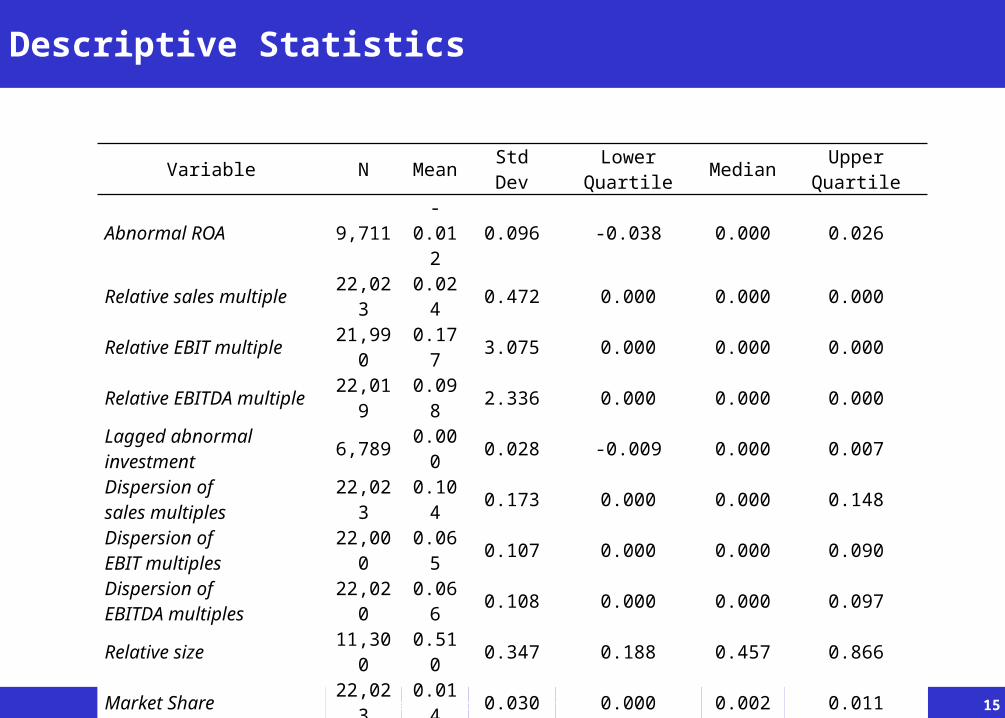
Descriptive Statistics
Variable NMea
nStd Dev
Lower Quartile
Median
Upper Quartile
Abnormal ROA 9,711-
0.012
0.096 -0.038 0.000 0.026
Relative sales multiple
22,023
0.024
0.472 0.000 0.000 0.000
Relative EBIT multiple
21,990
0.177
3.075 0.000 0.000 0.000
Relative EBITDA multiple
22,019
0.098
2.336 0.000 0.000 0.000
Lagged abnormal investment
6,7890.00
00.028 -0.009 0.000 0.007
Dispersion ofsales multiples
22,023
0.104
0.173 0.000 0.000 0.148
Dispersion ofEBIT multiples
22,000
0.065
0.107 0.000 0.000 0.090
Dispersion ofEBITDA multiples
22,020
0.066
0.108 0.000 0.000 0.097
Relative size11,30
00.51
00.347 0.188 0.457 0.866
Market Share22,02
30.01
40.030 0.000 0.002 0.011
Herfindahl index22,02
30.08
20.067 0.038 0.055 0.104
Log of market cap21,26
96.35
52.024 4.837 6.236 7.708
Book to market21,26
90.58
00.432 0.282 0.471 0.746
Valuation-Driven Profit Transfer among Corporate Segments
16
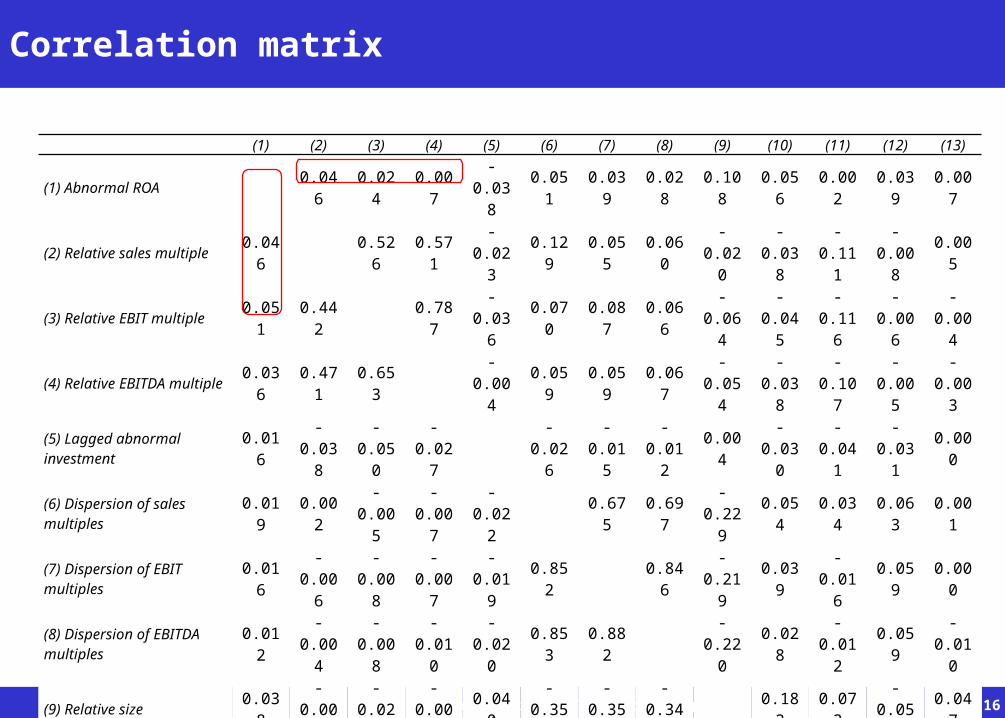
Correlation matrix
(1) (2) (3) (4) (5) (6) (7) (8) (9) (10) (11) (12) (13)
(1) Abnormal ROA 0.046 0.024 0.007-
0.0380.051 0.039 0.028 0.108 0.056 0.002 0.039 0.007
(2) Relative sales multiple 0.046 0.526 0.571
-0.023
0.129 0.055 0.060-
0.020-
0.038-
0.111-
0.0080.005
(3) Relative EBIT multiple 0.051 0.442 0.787
-0.036
0.070 0.087 0.066-
0.064-
0.045-
0.116-
0.006-
0.004(4) Relative EBITDA multiple 0.036 0.471 0.653
-0.004
0.059 0.059 0.067-
0.054-
0.038-
0.107-
0.005-
0.003(5) Lagged abnormal investment 0.016
-0.038
-0.050
-0.027
-0.026
-0.015
-0.012
0.004-
0.030-
0.041-
0.0310.000
(6) Dispersion of sales multiples 0.019 0.002
-0.005
-0.007
-0.022
0.675 0.697-
0.2290.054 0.034 0.063 0.001
(7) Dispersion of EBIT multiples 0.016
-0.006
-0.008
-0.007
-0.019
0.852 0.846-
0.2190.039
-0.016
0.059 0.000
(8) Dispersion of EBITDA multiples 0.012
-0.004
-0.008
-0.010
-0.020
0.853 0.882-
0.2200.028
-0.012
0.059-
0.010
(9) Relative size 0.038-
0.004-
0.025-
0.0080.040
-0.352
-0.350
-0.345
0.182 0.073-
0.0590.047
(10) Market share 0.071-
0.035-
0.055-
0.0500.004 0.061 0.041 0.044 0.276 0.358 0.426
-0.049
(11) Herfindahl index-
0.019-
0.120-
0.128-
0.124-
0.0300.037 0.006 0.013 0.101 0.506
-0.041
0.143
(12) Log of market cap 0.005 0.001 0.000-
0.002-
0.0070.076 0.075 0.079
-0.047
0.543-
0.023-
0.466
(13) Book to market 0.012-
0.003-
0.007-
0.007-
0.010-
0.013-
0.019-
0.0180.052
-0.032
0.186-
0.453
Valuation-Driven Profit Transfer among Corporate Segments
17
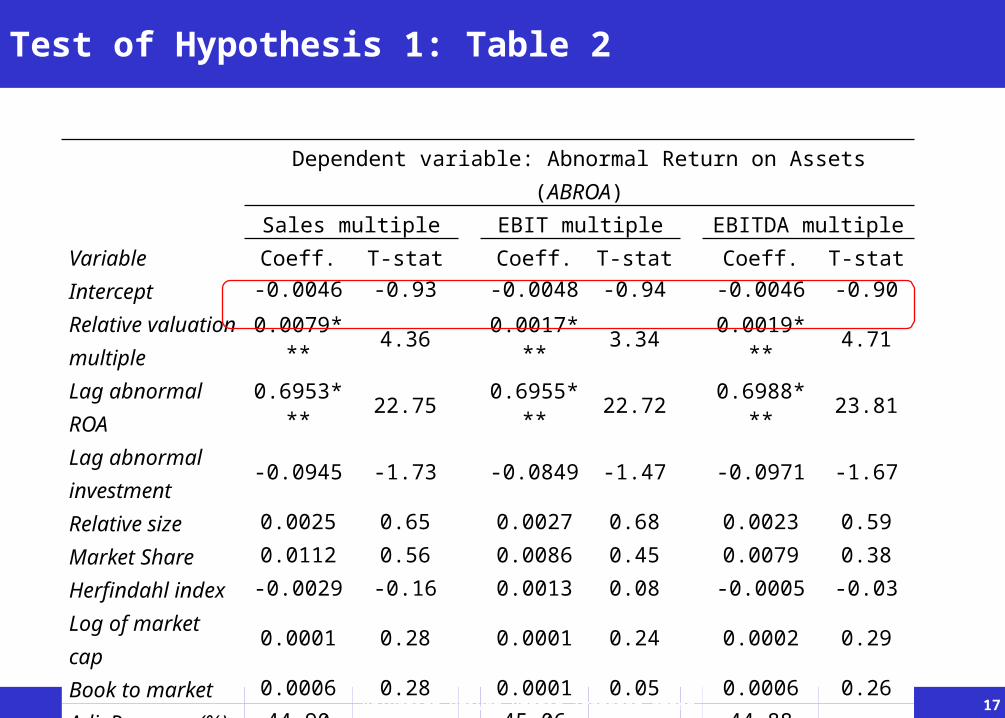
Test of Hypothesis 1: Table 2
Dependent variable: Abnormal Return on Assets (ABROA)
Sales multiple EBIT multiple EBITDA multiple
Variable Coeff. T-stat Coeff. T-stat Coeff. T-statIntercept -0.0046 -0.93 -0.0048 -0.94 -0.0046 -0.90Relative valuation multiple
0.0079*** 4.36 0.0017*
** 3.34 0.0019*** 4.71
Lag abnormal ROA
0.6953*** 22.75 0.6955*
** 22.72 0.6988*** 23.81
Lag abnormal investment
-0.0945 -1.73 -0.0849 -1.47 -0.0971 -1.67
Relative size 0.0025 0.65 0.0027 0.68 0.0023 0.59Market Share 0.0112 0.56 0.0086 0.45 0.0079 0.38Herfindahl index
-0.0029 -0.16 0.0013 0.08 -0.0005 -0.03
Log of market cap
0.0001 0.28 0.0001 0.24 0.0002 0.29
Book to market 0.0006 0.28 0.0001 0.05 0.0006 0.26Adj. R-square (%)
44.90 45.06 44.88
Average N 515 515 515
Valuation-Driven Profit Transfer among Corporate Segments
18
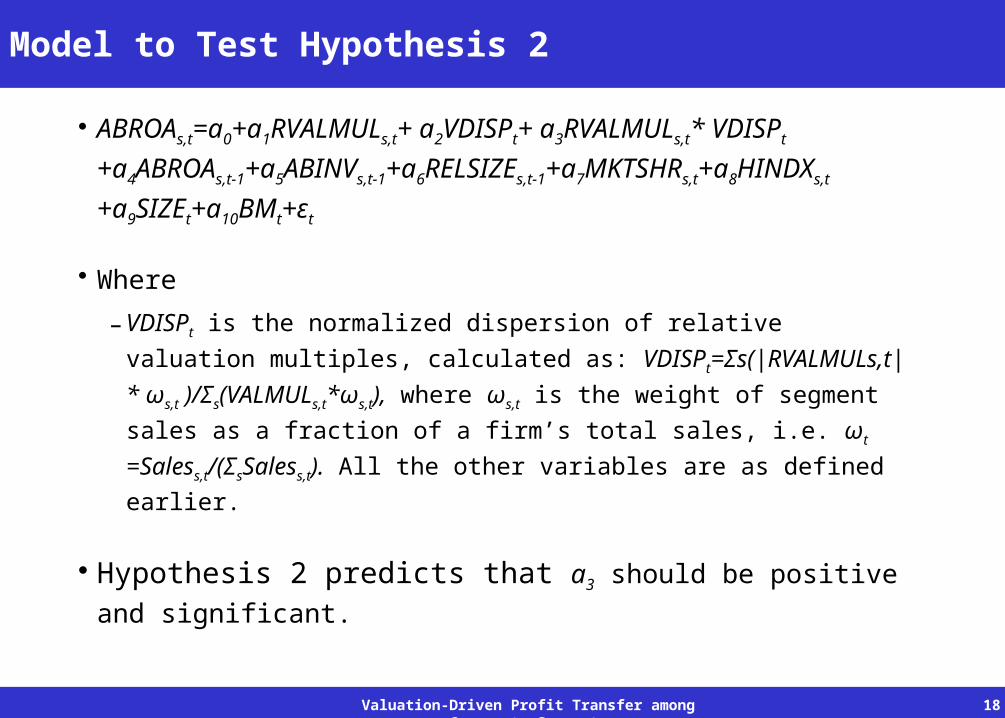
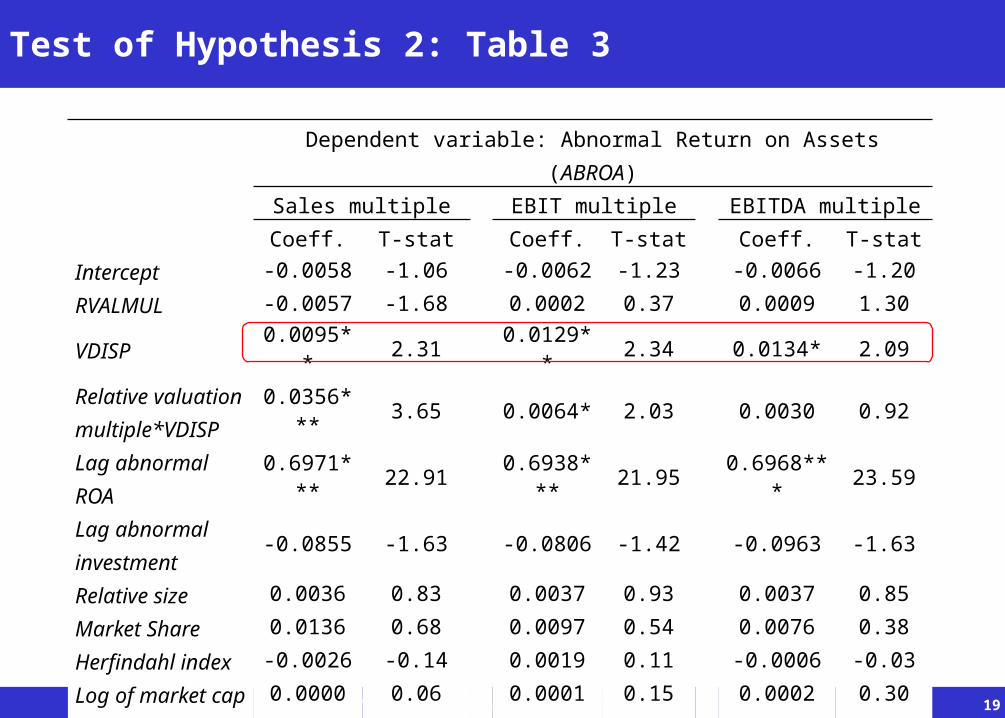
Model to Test Hypothesis 2
• ABROAs,t=a0+a1RVALMULs,t+ a2VDISPt+ a3RVALMULs,t*
VDISPt +a4ABROAs,t-1+a5ABINVs,t-1+a6RELSIZEs,t-
1+a7MKTSHRs,t+a8HINDXs,t +a9SIZEt+a10BMt+εt
• Where
– VDISPt is the normalized dispersion of relative valuation
multiples, calculated as: VDISPt=Σs(|RVALMULs,t|* ωs,t
)/Σs(VALMULs,t*ωs,t), where ωs,t is the weight of segment sales as
a fraction of a firm’s total sales, i.e. ωt =Saless,t/(ΣsSaless,t). All
the other variables are as defined earlier.
• Hypothesis 2 predicts that a3 should be positive and
significant.
Valuation-Driven Profit Transfer among Corporate Segments
19
Test of Hypothesis 2: Table 3
Dependent variable: Abnormal Return on Assets (ABROA)Sales multiple EBIT multiple EBITDA multiple
Coeff. T-stat Coeff. T-stat Coeff. T-statIntercept -0.0058 -1.06 -0.0062 -1.23 -0.0066 -1.20RVALMUL -0.0057 -1.68 0.0002 0.37 0.0009 1.30
VDISP0.0095*
* 2.31 0.0129** 2.34 0.0134* 2.09
Relative valuation multiple*VDISP
0.0356*** 3.65 0.0064* 2.03 0.0030 0.92
Lag abnormal ROA
0.6971*** 22.91 0.6938*
** 21.95 0.6968*** 23.59
Lag abnormal investment
-0.0855 -1.63 -0.0806 -1.42 -0.0963 -1.63
Relative size 0.0036 0.83 0.0037 0.93 0.0037 0.85Market Share 0.0136 0.68 0.0097 0.54 0.0076 0.38Herfindahl index
-0.0026 -0.14 0.0019 0.11 -0.0006 -0.03
Log of market cap
0.0000 0.06 0.0001 0.15 0.0002 0.30
Book to market 0.0005 0.21 0.0002 0.07 0.0007 0.31Adj. R-square(%)
45.31 45.26 44.93
Average N 513 513 513
Valuation-Driven Profit Transfer among Corporate Segments
20
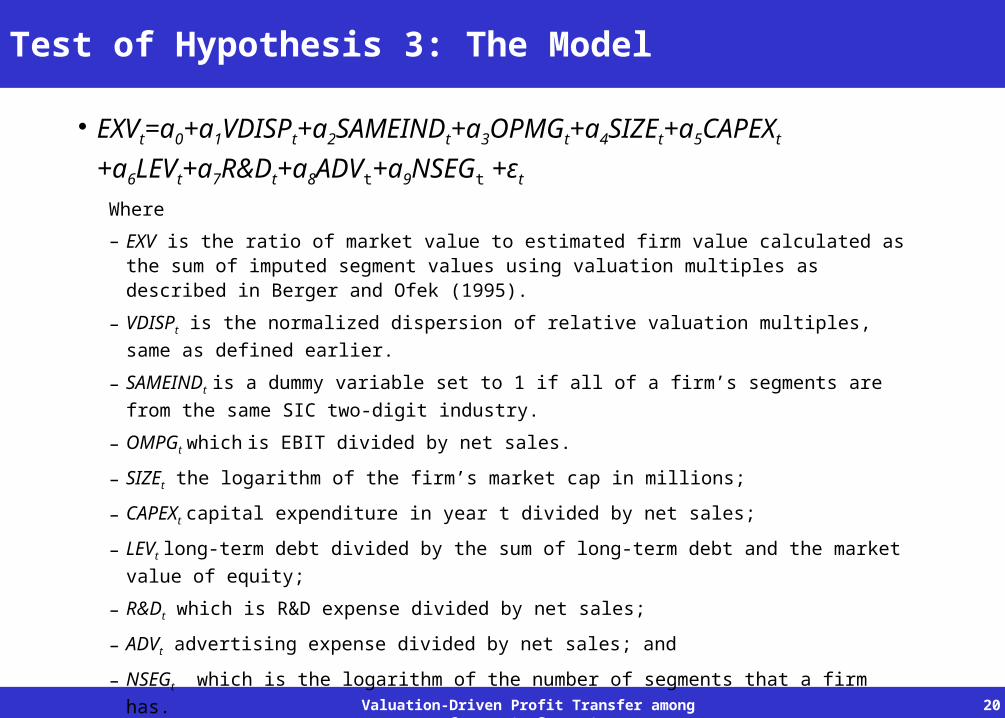
Test of Hypothesis 3: The Model
• EXVt=a0+a1VDISPt+a2SAMEINDt+a3OPMGt+a4SIZEt+a5CAP
EXt +a6LEVt+a7R&Dt+a8ADVt+a9NSEGt +εt
Where
– EXV is the ratio of market value to estimated firm value calculated as the sum of imputed segment values using valuation multiples as described in Berger and Ofek (1995).
– VDISPt is the normalized dispersion of relative valuation multiples, same as
defined earlier.
– SAMEINDt is a dummy variable set to 1 if all of a firm’s segments are from the
same SIC two-digit industry.
– OMPGt which is EBIT divided by net sales.
– SIZEt the logarithm of the firm’s market cap in millions;
– CAPEXt capital expenditure in year t divided by net sales;
– LEVt long-term debt divided by the sum of long-term debt and the market value of
equity;
– R&Dt which is R&D expense divided by net sales;
– ADVt advertising expense divided by net sales; and
– NSEGt which is the logarithm of the number of segments that a firm has.
• Hypothesis 3 suggests that a1 should be negative.
Valuation-Driven Profit Transfer among Corporate Segments
21
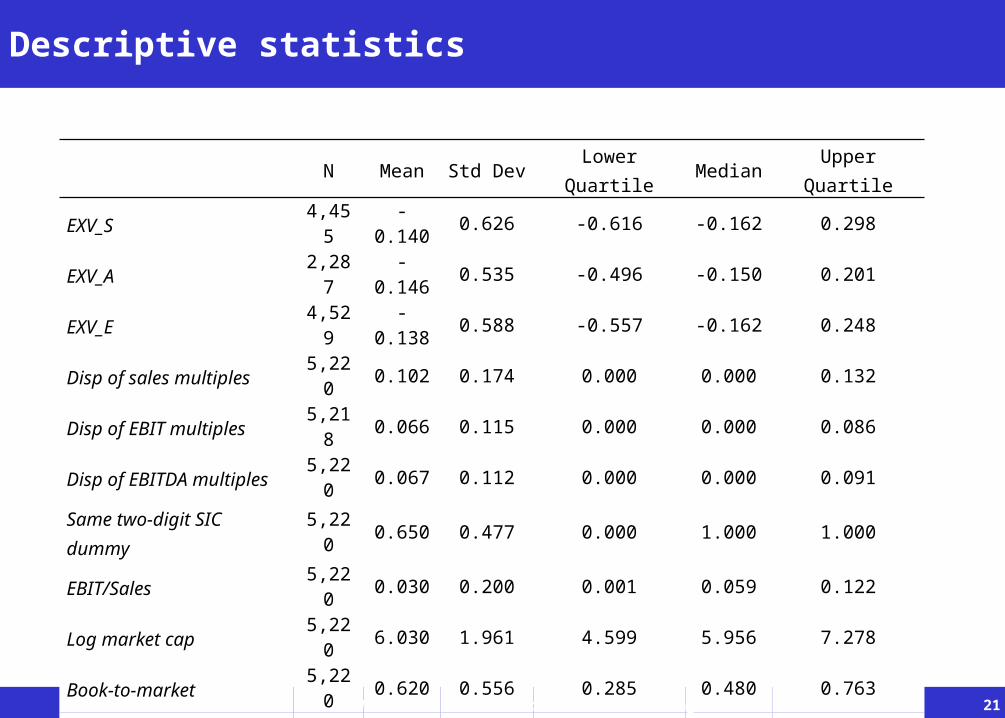
Descriptive statistics
N Mean Std DevLower
QuartileMedian
Upper Quartile
EXV_S 4,455 -0.140 0.626 -0.616 -0.162 0.298EXV_A 2,287 -0.146 0.535 -0.496 -0.150 0.201EXV_E 4,529 -0.138 0.588 -0.557 -0.162 0.248Disp of sales multiples 5,220 0.102 0.174 0.000 0.000 0.132Disp of EBIT multiples 5,218 0.066 0.115 0.000 0.000 0.086Disp of EBITDA multiples
5,220 0.067 0.112 0.000 0.000 0.091
Same two-digit SIC dummy
5,220 0.650 0.477 0.000 1.000 1.000
EBIT/Sales 5,220 0.030 0.200 0.001 0.059 0.122Log market cap 5,220 6.030 1.961 4.599 5.956 7.278Book-to-market 5,220 0.620 0.556 0.285 0.480 0.763Capital expenditure 5,176 0.062 0.095 0.018 0.034 0.064Long-term debt 5,192 0.148 0.190 0.001 0.067 0.227R&D 5,220 0.076 0.112 0.000 0.032 0.116AD 5,220 0.008 0.021 0.000 0.000 0.004Log # segments 5,220 1.248 0.211 1.099 1.099 1.386
Valuation-Driven Profit Transfer among Corporate Segments
22
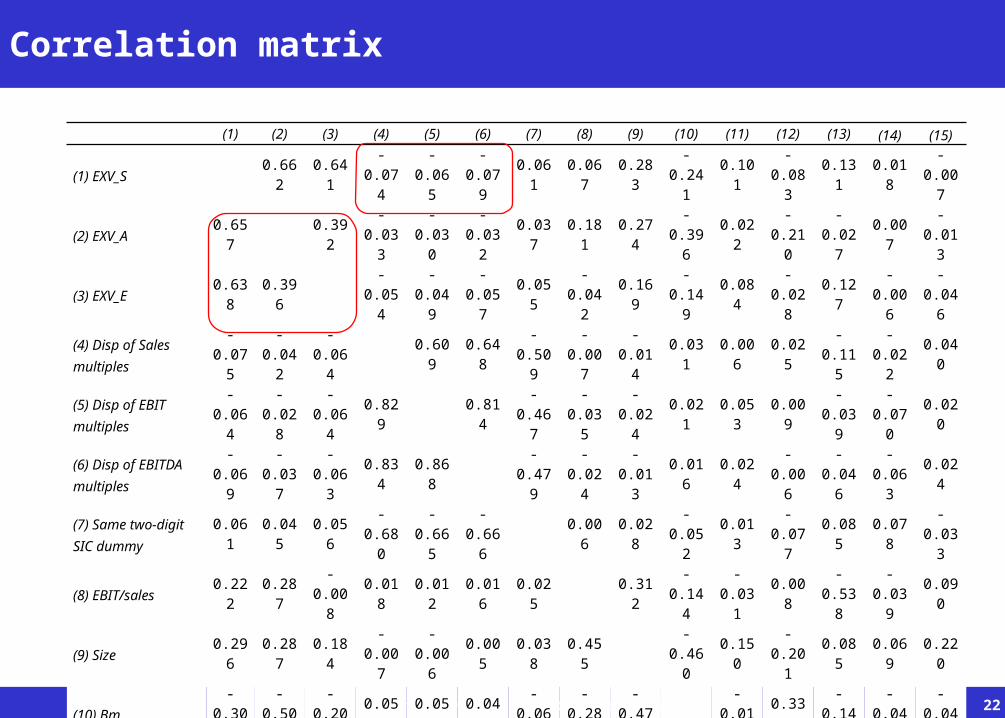
Correlation matrix
(1) (2) (3) (4) (5) (6) (7) (8) (9) (10) (11) (12) (13) (14) (15)
(1) EXV_S0.66
20.64
1
-0.07
4
-0.06
5
-0.07
9
0.061
0.067
0.283
-0.24
1
0.101
-0.08
3
0.131
0.018
-0.00
7
(2) EXV_A0.65
70.39
2
-0.03
3
-0.03
0
-0.03
2
0.037
0.181
0.274
-0.39
6
0.022
-0.21
0
-0.02
7
0.007
-0.01
3
(3) EXV_E0.63
80.39
6
-0.05
4
-0.04
9
-0.05
7
0.055
-0.04
2
0.169
-0.14
9
0.084
-0.02
8
0.127
-0.00
6
-0.04
6
(4) Disp of Sales multiples
-0.07
5
-0.04
2
-0.06
4
0.609
0.648
-0.50
9
-0.00
7
-0.01
4
0.031
0.006
0.025
-0.11
5
-0.02
2
0.040
(5) Disp of EBIT multiples
-0.06
4
-0.02
8
-0.06
4
0.829
0.814
-0.46
7
-0.03
5
-0.02
4
0.021
0.053
0.009
-0.03
9
-0.07
0
0.020
(6) Disp of EBITDA multiples
-0.06
9
-0.03
7
-0.06
3
0.834
0.868
-0.47
9
-0.02
4
-0.01
3
0.016
0.024
-0.00
6
-0.04
6
-0.06
3
0.024
(7) Same two-digit SIC dummy
0.061
0.045
0.056
-0.68
0
-0.66
5
-0.66
6
0.006
0.028
-0.05
2
0.013
-0.07
7
0.085
0.078
-0.03
3
(8) EBIT/sales0.22
20.28
7
-0.00
8
0.018
0.012
0.016
0.025
0.312
-0.14
4
-0.03
1
0.008
-0.53
8
-0.03
9
0.090
(9) Size0.29
60.28
70.18
4
-0.00
7
-0.00
6
0.005
0.038
0.455
-0.46
0
0.150
-0.20
1
0.085
0.069
0.220
(10) Bm-
0.309
-0.50
0
-0.20
8
0.053
0.053
0.047
-0.06
6
-0.28
8
-0.47
3
-0.01
4
0.338
-0.14
2
-0.04
8
-0.04
3
(11) Capx0.13
10.07
60.10
60.01
00.04
00.03
20.01
10.18
70.29
0
-0.13
1
0.066
0.057
-0.03
1
0.011
(12) Long-term debt
-0.10
1
-0.20
9
-0.03
5
0.080
0.063
0.054
-0.10
0
-0.01
9
-0.06
5
0.236
0.036
-0.24
0
-0.03
0
0.021
(13) R&D0.09
2
-0.04
2
0.084
-0.11
8
-0.07
5
-0.08
2
0.115
-0.16
0
0.143
-0.23
9
0.163
-0.34
5
-0.00
2
-0.02
6
(14) AD0.03
5
-0.01
6
0.009
-0.11
9
-0.11
5
-0.13
0
0.070
-0.01
3
0.060
-0.09
0
-0.05
0
-0.12
9
0.105
0.001
(15) Log # segments
-0.00
5
-0.00
5
-0.04
2
0.088
0.073
0.077
-0.04
0
0.072
0.191
-0.04
9
0.037
0.057
0.023
-0.01
4
Valuation-Driven Profit Transfer among Corporate Segments
23
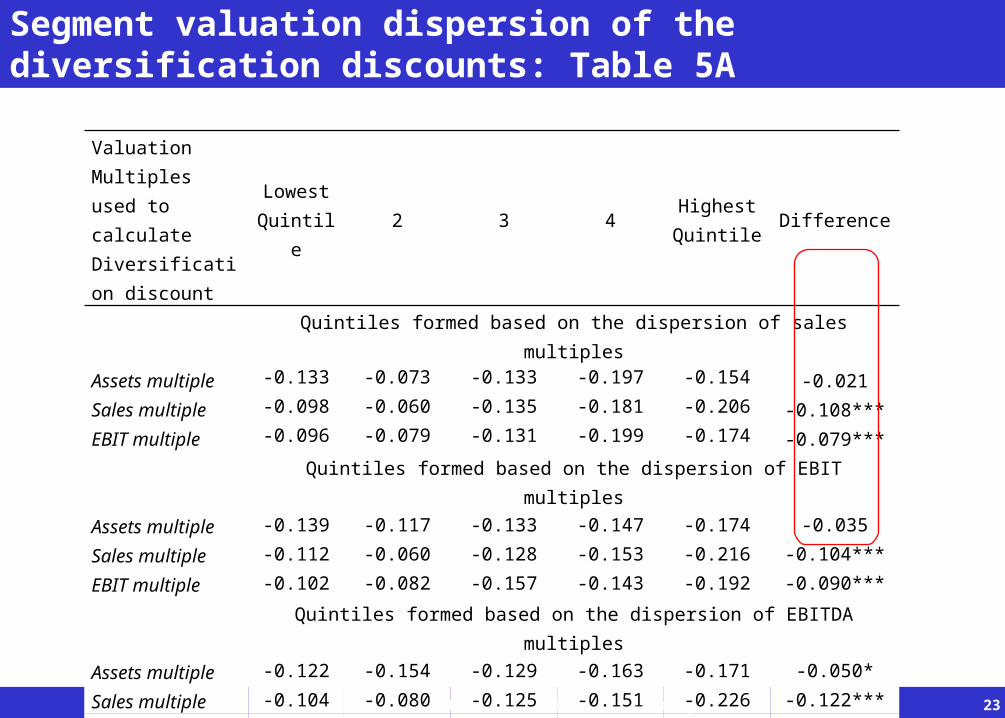
Segment valuation dispersion of the diversification discounts: Table 5A
Valuation Multiples used to calculate Diversification discount
LowestQuintile
2 3 4HighestQuintile
Difference
Quintiles formed based on the dispersion of sales multiplesAssets multiple -0.133 -0.073 -0.133 -0.197 -0.154 -0.021Sales multiple -0.098 -0.060 -0.135 -0.181 -0.206 -0.108***EBIT multiple -0.096 -0.079 -0.131 -0.199 -0.174 -0.079***
Quintiles formed based on the dispersion of EBIT multiplesAssets multiple -0.139 -0.117 -0.133 -0.147 -0.174 -0.035Sales multiple -0.112 -0.060 -0.128 -0.153 -0.216 -0.104***EBIT multiple -0.102 -0.082 -0.157 -0.143 -0.192 -0.090***
Quintiles formed based on the dispersion of EBITDA multiplesAssets multiple -0.122 -0.154 -0.129 -0.163 -0.171 -0.050*Sales multiple -0.104 -0.080 -0.125 -0.151 -0.226 -0.122***EBIT multiple -0.104 -0.101 -0.126 -0.132 -0.222 -0.118***
Valuation-Driven Profit Transfer among Corporate Segments
24
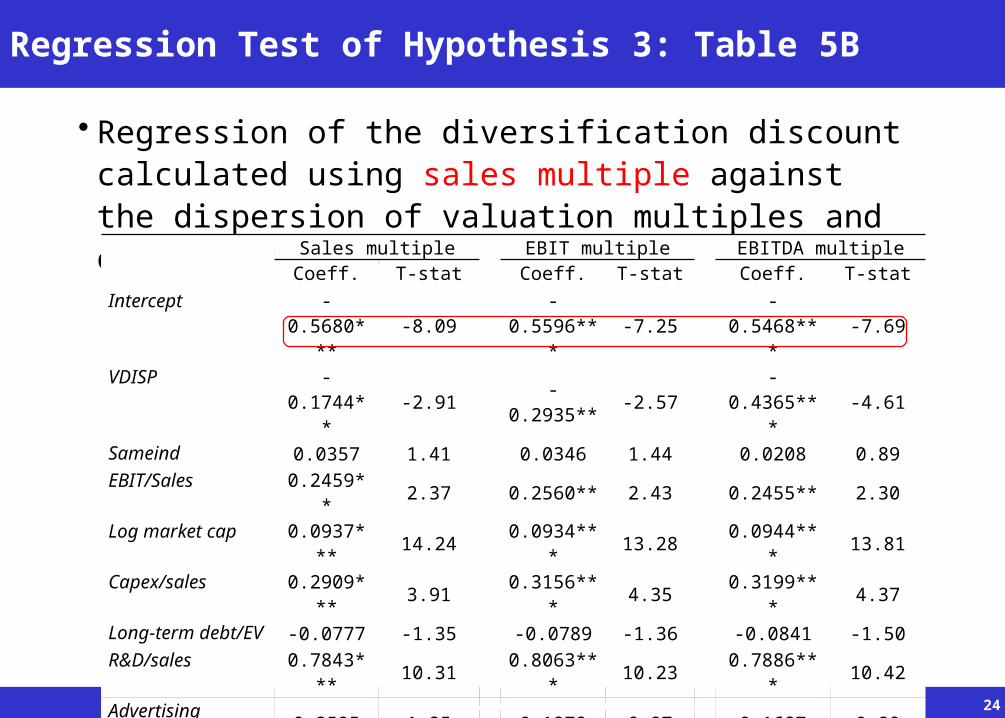
Regression Test of Hypothesis 3: Table 5B
• Regression of the diversification discount calculated using sales multiple against the dispersion of valuation multiples and other control variablesSales multiple EBIT multiple EBITDA multiple
Coeff. T-stat Coeff. T-stat Coeff. T-stat
Intercept -0.5680**
*-8.09
-0.5596**
*-7.25 -0.5468*** -7.69
VDISP -0.1744**
-2.91 -0.2935** -2.57 -0.4365*** -4.61
Sameind 0.0357 1.41 0.0346 1.44 0.0208 0.89EBIT/Sales 0.2459** 2.37 0.2560** 2.43 0.2455** 2.30Log market cap 0.0937**
*14.24
0.0934***
13.28 0.0944*** 13.81
Capex/sales 0.2909***
3.910.3156**
*4.35 0.3199*** 4.37
Long-term debt/EV
-0.0777 -1.35 -0.0789 -1.36 -0.0841 -1.50
R&D/sales 0.7843***
10.310.8063**
*10.23 0.7886*** 10.42
Advertising exp/sales
0.2595 1.25 0.1978 0.97 0.1687 0.80
Log # of segments
-0.1826**
*-4.90
-0.1873**
*-5.16 -0.1863*** -5.17
Adj. R-square (%)
11.42 11.58 11.69
Average N 429 429 429
Valuation-Driven Profit Transfer among Corporate Segments
25
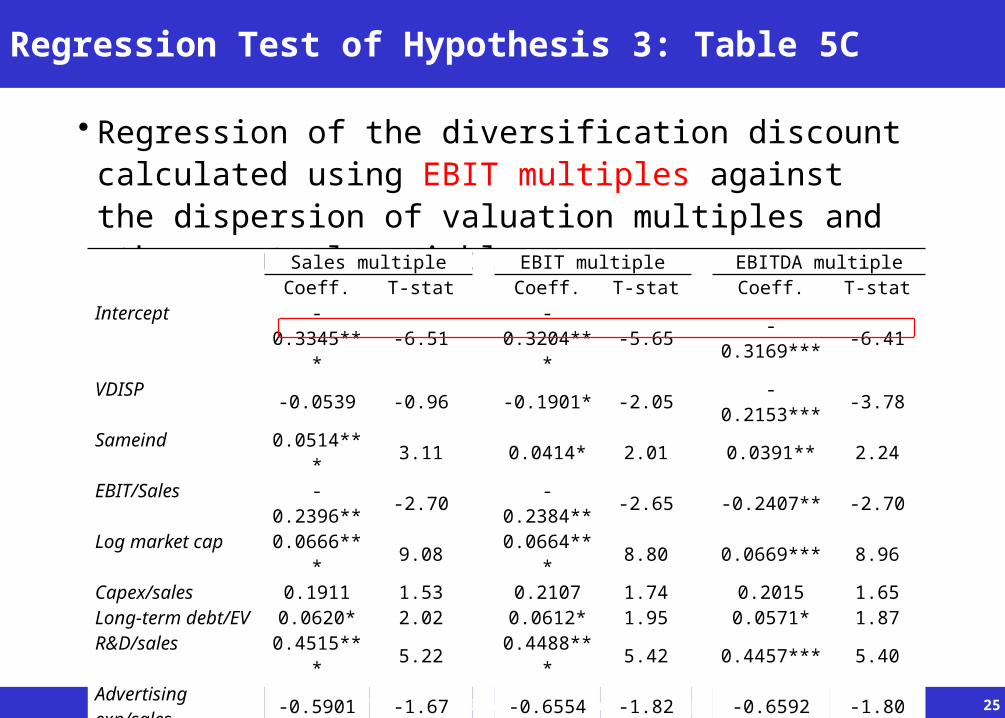
Regression Test of Hypothesis 3: Table 5C
• Regression of the diversification discount calculated using EBIT multiples against the dispersion of valuation multiples and other control variablesSales multiple EBIT multiple EBITDA multiple
Coeff. T-stat Coeff. T-stat Coeff. T-statIntercept -
0.3345***
-6.51-
0.3204***
-5.65 -0.3169*** -6.41
VDISP -0.0539 -0.96 -0.1901* -2.05 -0.2153*** -3.78Sameind 0.0514**
*3.11 0.0414* 2.01 0.0391** 2.24
EBIT/Sales -0.2396** -2.70 -0.2384** -2.65 -0.2407** -2.70Log market cap 0.0666**
*9.08
0.0664***
8.80 0.0669*** 8.96
Capex/sales 0.1911 1.53 0.2107 1.74 0.2015 1.65Long-term debt/EV
0.0620* 2.02 0.0612* 1.95 0.0571* 1.87
R&D/sales 0.4515***
5.220.4488**
*5.42 0.4457*** 5.40
Advertising exp/sales
-0.5901 -1.67 -0.6554 -1.82 -0.6592 -1.80
Log # of segments
-0.2171**
*-13.88
-0.2182**
*-13.99 -0.2191*** -13.44
Adj. R-square (%)
5.69 5.75 5.66
Average N 437 437 437
Valuation-Driven Profit Transfer among Corporate Segments
26
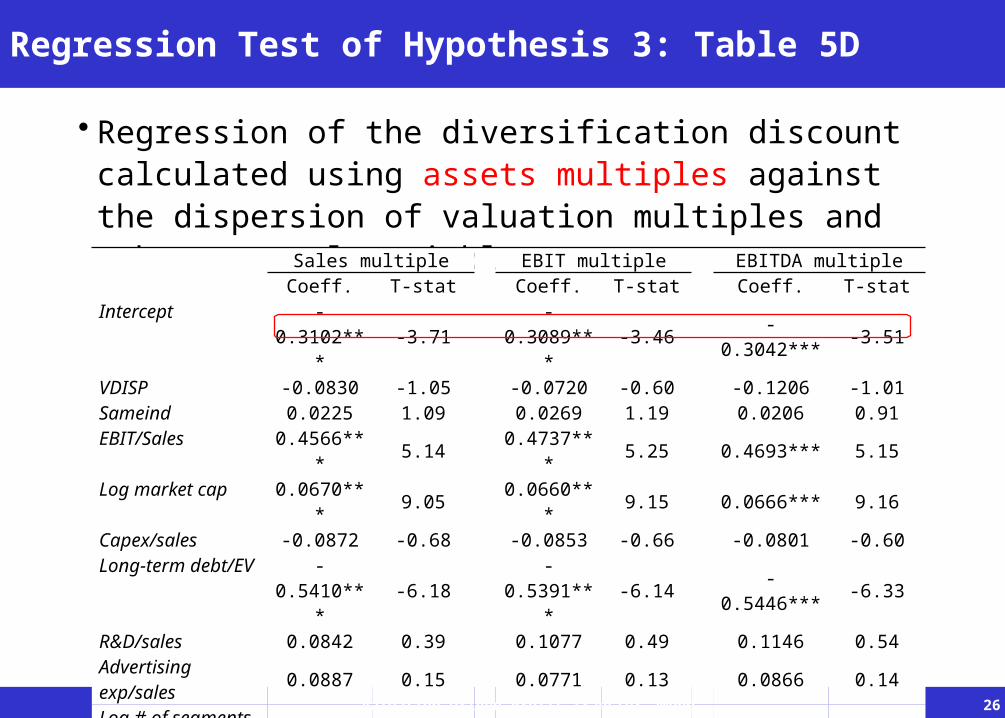
Regression Test of Hypothesis 3: Table 5D
• Regression of the diversification discount calculated using assets multiples against the dispersion of valuation multiples and other control variablesSales multiple EBIT multiple EBITDA multiple
Coeff. T-stat Coeff. T-stat Coeff. T-statIntercept -
0.3102***
-3.71-
0.3089***
-3.46 -0.3042*** -3.51
VDISP -0.0830 -1.05 -0.0720 -0.60 -0.1206 -1.01Sameind 0.0225 1.09 0.0269 1.19 0.0206 0.91EBIT/Sales 0.4566**
*5.14
0.4737***
5.25 0.4693*** 5.15
Log market cap 0.0670***
9.050.0660**
*9.15 0.0666*** 9.16
Capex/sales -0.0872 -0.68 -0.0853 -0.66 -0.0801 -0.60Long-term debt/EV
-0.5410**
*-6.18
-0.5391**
*-6.14 -0.5446*** -6.33
R&D/sales 0.0842 0.39 0.1077 0.49 0.1146 0.54Advertising exp/sales
0.0887 0.15 0.0771 0.13 0.0866 0.14
Log # of segments
-0.1205** -2.60 -0.1229** -2.66 -0.1227** -2.68
Adj. R-square (%)
13.02 12.95 12.94
Average N 216 216 216

Valuation-Driven Profit Transfer among Corporate Segments
27
Revenue Transfer or Cost Allocation? Table 6A
• Regression of abnormal asset turnover against relative valuation multiples and other control variables
Sales multiple EBIT multiple EBITDA multipleCoeff. T-stat Coeff. T-stat Coeff. T-stat
Intercept 0.0217* 1.83 0.0235 1.76 0.0229 1.69Relative valuation multiple
0.0489*** 3.88 0.0041 1.76 0.0079** 2.90
Lag abnormal ATO
0.7849*** 25.78 0.7893*
** 24.60 0.7881*** 24.45
Lag abnormal investment
-0.5201*
**-5.90
-0.5201*
**-6.12
-0.5400**
*-6.66
Relative Size 0.0264 1.51 0.0242 1.43 0.0253 1.38Market Share 0.0267 0.27 0.0289 0.30 0.0391 0.38
Herfindahl index
-0.0983* -1.93
-0.1173*
*-2.25 -
0.1138** -2.03
Log of market cap
-0.0030*
*-2.86
-0.0028*
*-2.71 -
0.0029** -3.13
Book to market -0.0122 -1.42 -0.0113 -1.30 -0.0109 -1.26Adj. R-square (%) 59.96 59.75 59.74
Average N 599 599 599
Valuation-Driven Profit Transfer among Corporate Segments
28
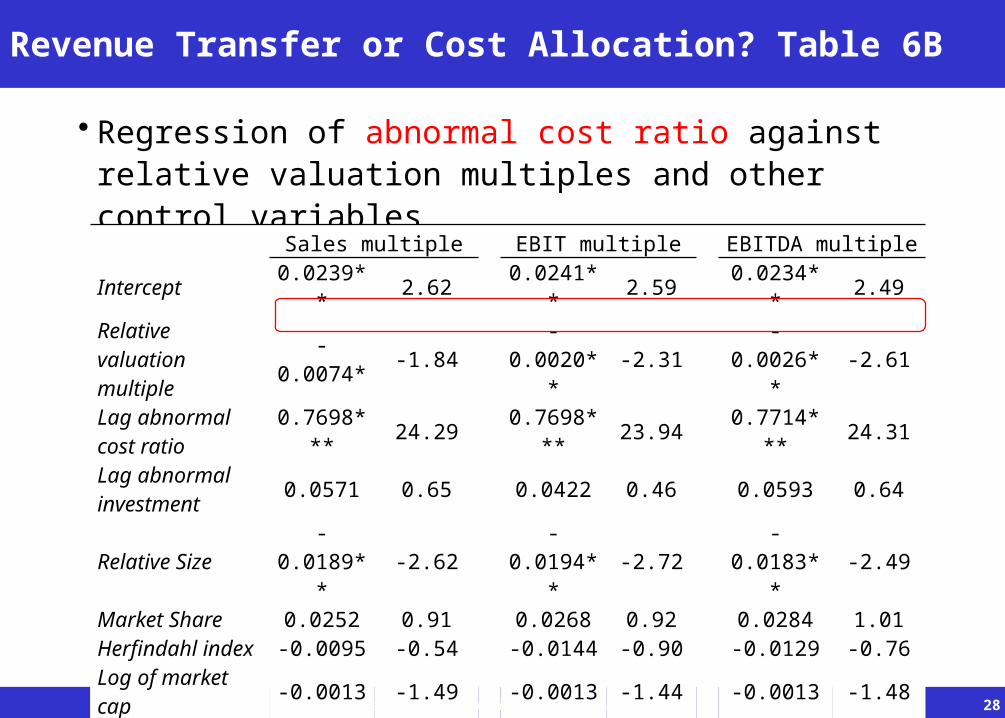
Revenue Transfer or Cost Allocation? Table 6B
• Regression of abnormal cost ratio against relative valuation multiples and other control variables
Sales multiple EBIT multiple EBITDA multiple
Intercept 0.0239** 2.62 0.0241*
* 2.59 0.0234** 2.49
Relative valuation multiple
-0.0074* -1.84
-0.0020*
*-2.31 -
0.0026** -2.61
Lag abnormal cost ratio
0.7698*** 24.29 0.7698*
** 23.94 0.7714*** 24.31
Lag abnormal investment 0.0571 0.65 0.0422 0.46 0.0593 0.64
Relative Size-
0.0189**
-2.62-
0.0194**
-2.72 -0.0183** -2.49
Market Share 0.0252 0.91 0.0268 0.92 0.0284 1.01Herfindahl index -0.0095 -0.54 -0.0144 -0.90 -0.0129 -0.76
Log of market cap -0.0013 -1.49 -0.0013 -1.44 -0.0013 -1.48
Book to market -0.0030 -0.77 -0.0021 -0.57 -0.0027 -0.71
Adj. R-square (%) 49.19 49.67 49.22
Average N 574 573 574
Valuation-Driven Profit Transfer among Corporate Segments
29
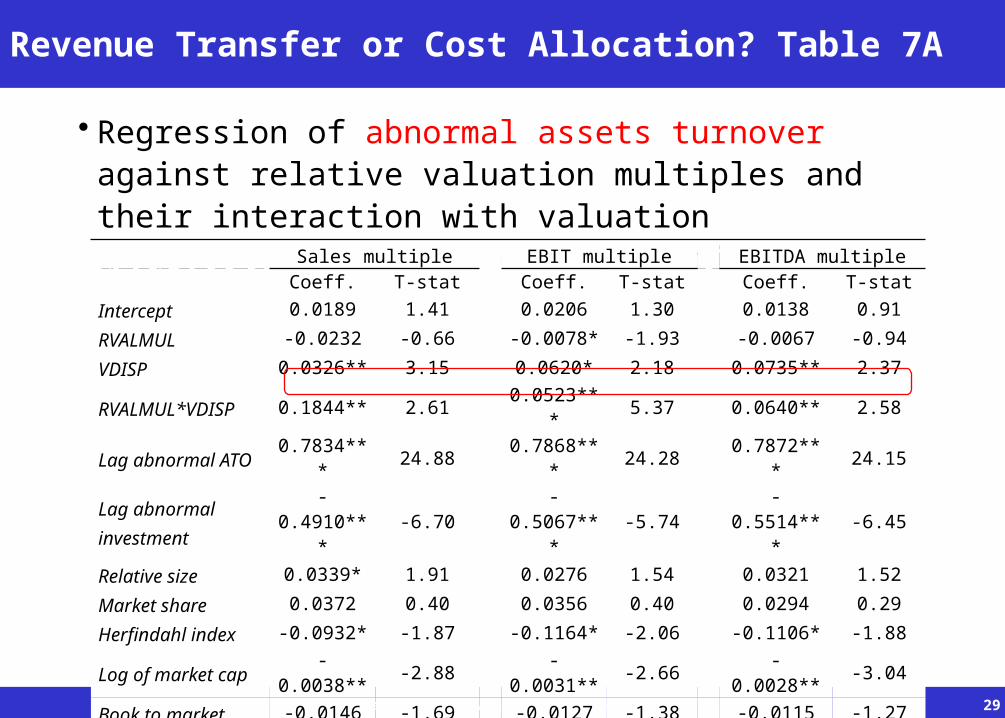
Revenue Transfer or Cost Allocation? Table 7A
• Regression of abnormal assets turnover against relative valuation multiples and their interaction with valuation dispersion and other control variables Sales multiple EBIT multiple EBITDA multiple
Coeff. T-stat Coeff. T-stat Coeff. T-statIntercept 0.0189 1.41 0.0206 1.30 0.0138 0.91RVALMUL -0.0232 -0.66 -0.0078* -1.93 -0.0067 -0.94VDISP 0.0326** 3.15 0.0620* 2.18 0.0735** 2.37RVALMUL*VDISP
0.1844** 2.610.0523**
*5.37 0.0640** 2.58
Lag abnormal ATO
0.7834***
24.880.7868**
*24.28 0.7872*** 24.15
Lag abnormal investment
-0.4910**
*-6.70
-0.5067**
*-5.74
-0.5514***
-6.45
Relative size 0.0339* 1.91 0.0276 1.54 0.0321 1.52Market share 0.0372 0.40 0.0356 0.40 0.0294 0.29Herfindahl index -0.0932* -1.87 -0.1164* -2.06 -0.1106* -1.88Log of market cap
-0.0038** -2.88 -0.0031** -2.66 -0.0028** -3.04
Book to market -0.0146 -1.69 -0.0127 -1.38 -0.0115 -1.27Adj. R-square(%) 60.32 60.07 60.01Average N 597 597 597
Valuation-Driven Profit Transfer among Corporate Segments
30
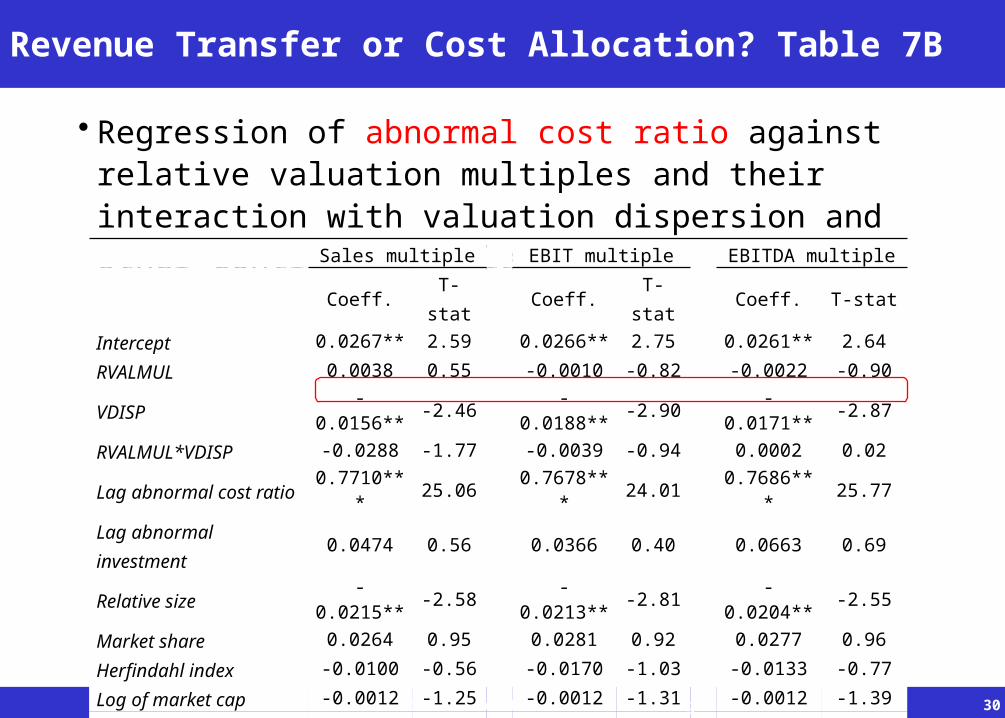
Revenue Transfer or Cost Allocation? Table 7B
• Regression of abnormal cost ratio against relative valuation multiples and their interaction with valuation dispersion and other control variables
Sales multiple EBIT multiple EBITDA multipleCoeff. T-stat Coeff. T-stat Coeff. T-stat
Intercept 0.0267** 2.59 0.0266** 2.75 0.0261** 2.64RVALMUL 0.0038 0.55 -0.0010 -0.82 -0.0022 -0.90
VDISP-
0.0156**-2.46
-0.0188**
-2.90 -0.0171** -2.87
RVALMUL*VDISP -0.0288 -1.77 -0.0039 -0.94 0.0002 0.02Lag abnormal cost ratio
0.7710***
25.060.7678**
*24.01
0.7686***
25.77
Lag abnormal investment
0.0474 0.56 0.0366 0.40 0.0663 0.69
Relative size-
0.0215**-2.58
-0.0213**
-2.81 -0.0204** -2.55
Market share 0.0264 0.95 0.0281 0.92 0.0277 0.96Herfindahl index -0.0100 -0.56 -0.0170 -1.03 -0.0133 -0.77Log of market cap -0.0012 -1.25 -0.0012 -1.31 -0.0012 -1.39Book to market -0.0029 -0.75 -0.0021 -0.58 -0.0029 -0.78Adj. R-square(%) 49.61 49.83 49.34Average N 572 571 572
Valuation-Driven Profit Transfer among Corporate Segments
31
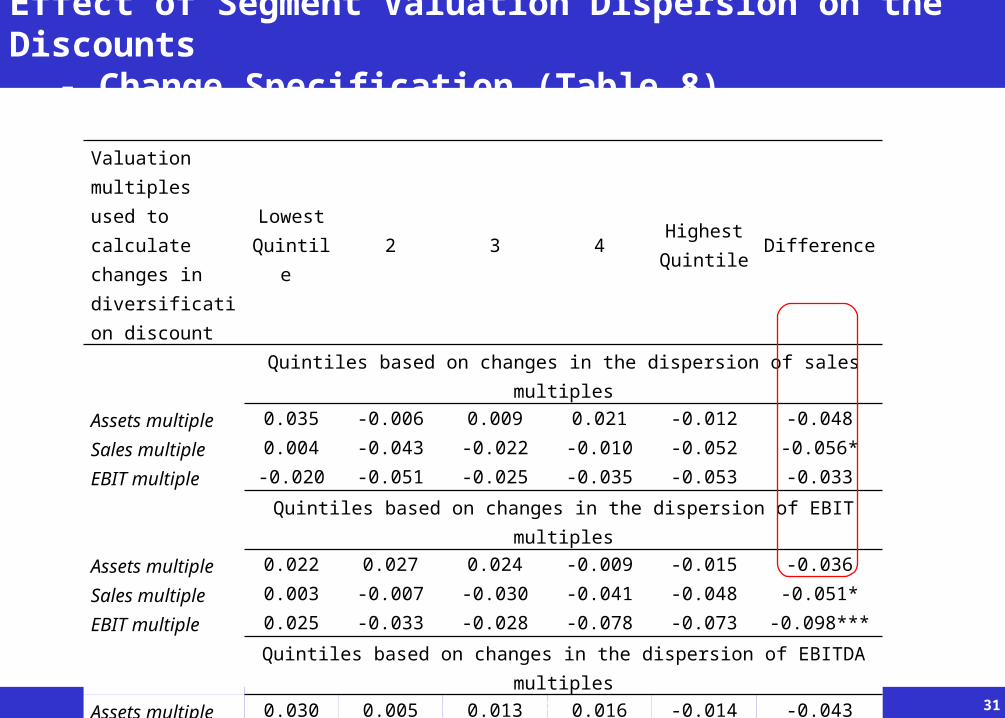
Effect of Segment Valuation Dispersion on the Discounts
- Change Specification (Table 8)
Valuation multiples used to calculate changes in diversification discount
LowestQuintile
2 3 4HighestQuintile
Difference
Quintiles based on changes in the dispersion of sales multiplesAssets multiple 0.035 -0.006 0.009 0.021 -0.012 -0.048Sales multiple 0.004 -0.043 -0.022 -0.010 -0.052 -0.056*EBIT multiple -0.020 -0.051 -0.025 -0.035 -0.053 -0.033
Quintiles based on changes in the dispersion of EBIT multiplesAssets multiple 0.022 0.027 0.024 -0.009 -0.015 -0.036Sales multiple 0.003 -0.007 -0.030 -0.041 -0.048 -0.051*EBIT multiple 0.025 -0.033 -0.028 -0.078 -0.073 -0.098***
Quintiles based on changes in the dispersion of EBITDA multiplesAssets multiple 0.030 0.005 0.013 0.016 -0.014 -0.043Sales multiple 0.018 -0.013 -0.044 -0.012 -0.067 -0.085***EBIT multiple 0.024 -0.053 -0.046 -0.024 -0.080 -0.104***
Valuation-Driven Profit Transfer among Corporate Segments
32
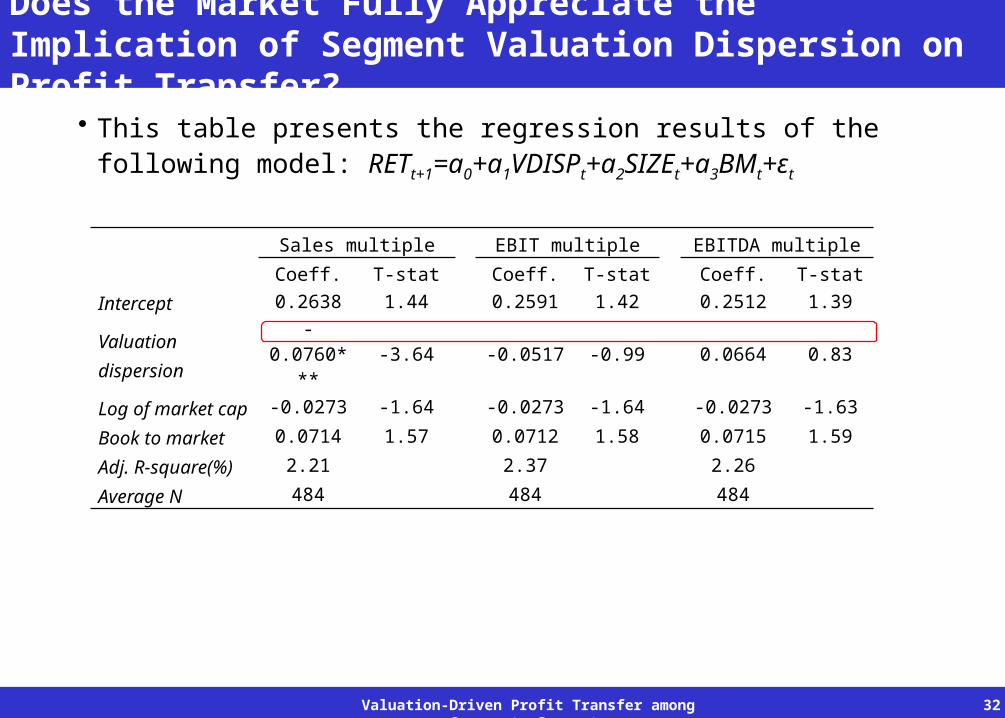
Does the Market Fully Appreciate the Implication of Segment Valuation Dispersion on Profit Transfer?
• This table presents the regression results of the following model: RETt+1=a0+a1VDISPt+a2SIZEt+a3BMt+εt
Sales multiple EBIT multiple EBITDA multipleCoeff. T-stat Coeff. T-stat Coeff. T-stat
Intercept 0.2638 1.44 0.2591 1.42 0.2512 1.39
Valuation dispersion
-0.0760**
*-3.64 -0.0517 -0.99 0.0664 0.83
Log of market cap
-0.0273 -1.64 -0.0273 -1.64 -0.0273 -1.63
Book to market 0.0714 1.57 0.0712 1.58 0.0715 1.59Adj. R-square(%)
2.21 2.37 2.26
Average N 484 484 484
Valuation-Driven Profit Transfer among Corporate Segments
33
Conclusions
• Equity valuation incentives induce managers to transfer profits from segments with relatively low valuations to those with high valuations.
• Such incentive exists even if investors are rational and perfectly anticipate and adjust for the amount of profit transfer.
• Managers have greater incentives to transfer profits for firms with more divergent segment valuations.
• Valuing conglomerates using multiples approach without adjusting for the inter-segment profit transfer leads to overestimated firm values. Such measurement errors increase with the dispersion of segment valuations.
• The market appears to at least partially appreciate and adjust for such earnings manipulation incentives in setting the prices for conglomerate firms.
Valuation-Driven Profit Transfer among Corporate Segments
34
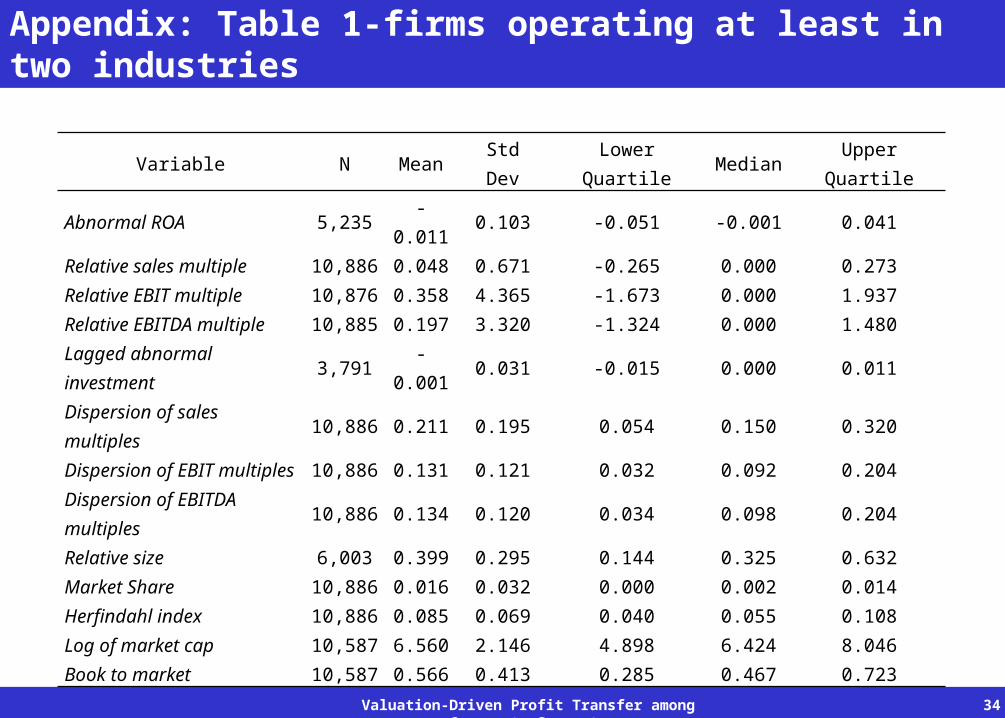
Appendix: Table 1-firms operating at least in two industries
Variable N Mean Std DevLower
QuartileMedian
Upper Quartile
Abnormal ROA 5,235-
0.0110.103 -0.051 -0.001 0.041
Relative sales multiple 10,886 0.048 0.671 -0.265 0.000 0.273
Relative EBIT multiple 10,876 0.358 4.365 -1.673 0.000 1.937Relative EBITDA multiple
10,885 0.197 3.320 -1.324 0.000 1.480
Lagged abnormal investment
3,791-
0.0010.031 -0.015 0.000 0.011
Dispersion of sales multiples
10,886 0.211 0.195 0.054 0.150 0.320
Dispersion of EBIT multiples
10,886 0.131 0.121 0.032 0.092 0.204
Dispersion of EBITDA multiples
10,886 0.134 0.120 0.034 0.098 0.204
Relative size 6,003 0.399 0.295 0.144 0.325 0.632
Market Share 10,886 0.016 0.032 0.000 0.002 0.014
Herfindahl index 10,886 0.085 0.069 0.040 0.055 0.108
Log of market cap 10,587 6.560 2.146 4.898 6.424 8.046
Book to market 10,587 0.566 0.413 0.285 0.467 0.723

Valuation-Driven Profit Transfer among Corporate Segments
35
Appendix: Table 1-firms operating at least in two industries
(1) (2) (3) (4) (5) (6) (7) (8) (9) (10) (11) (12) (13)(1) Abnormal ROA
0.057 0.029 0.008 -0.026 0.063 0.044 0.026 0.054 0.036 0.004 0.050 0.000
(2) Relative sales multiple
0.060 0.524 0.570 -0.026 0.124 0.031 0.036 -0.002 -0.055 -0.157 -0.018 0.009
(3) Relative EBIT multiple
0.066 0.520 0.787 -0.042 0.043 0.065 0.038 -0.066 -0.065 -0.164 -0.016 -0.004
(4) Relative EBITDA multiple
0.049 0.554 0.763 -0.004 0.042 0.042 0.052 -0.061 -0.055 -0.150 -0.012 -0.003
(5) Lagged abnormal investment
0.014 -0.053 -0.066 -0.031 -0.020 -0.005 0.000 0.014 -0.034 -0.056 -0.040 0.013
(6) Dispersion of sales multiples
0.042 0.023 -0.001 0.001 -0.017 0.482 0.512 -0.045 0.013 0.009 0.002 0.036
(7) Dispersion of EBIT multiples
0.028 -0.010 -0.013 -0.004 -0.002 0.522 0.752 -0.029 -0.014 -0.081 -0.004 0.034
(8) Dispersion of EBITDA multiples
0.013 -0.008 -0.017 -0.011 -0.002 0.541 0.757 -0.026 -0.032 -0.075 -0.006 0.017
(9) Relative size -0.002 0.013 -0.039 -0.035 0.040 0.004 0.019 0.022 0.201 0.080 -0.062 0.016(10) Market share
0.056 -0.055 -0.075 -0.062 -0.005 0.063 0.002 0.001 0.303 0.356 0.470 -0.063
(11) Herfindahl index
-0.029 -0.193 -0.196 -0.177 -0.048 0.007 -0.085 -0.076 0.098 0.464 -0.024 0.114
(12) Log of market cap
0.016 -0.014 -0.005 -0.002 -0.014 -0.004 -0.005 -0.003 -0.044 0.613 0.009 -0.431
(13) Book to market
0.006 0.009 0.000 -0.002 0.004 0.032 0.024 0.014 0.005 -0.074 0.136 -0.417
Valuation-Driven Profit Transfer among Corporate Segments
36
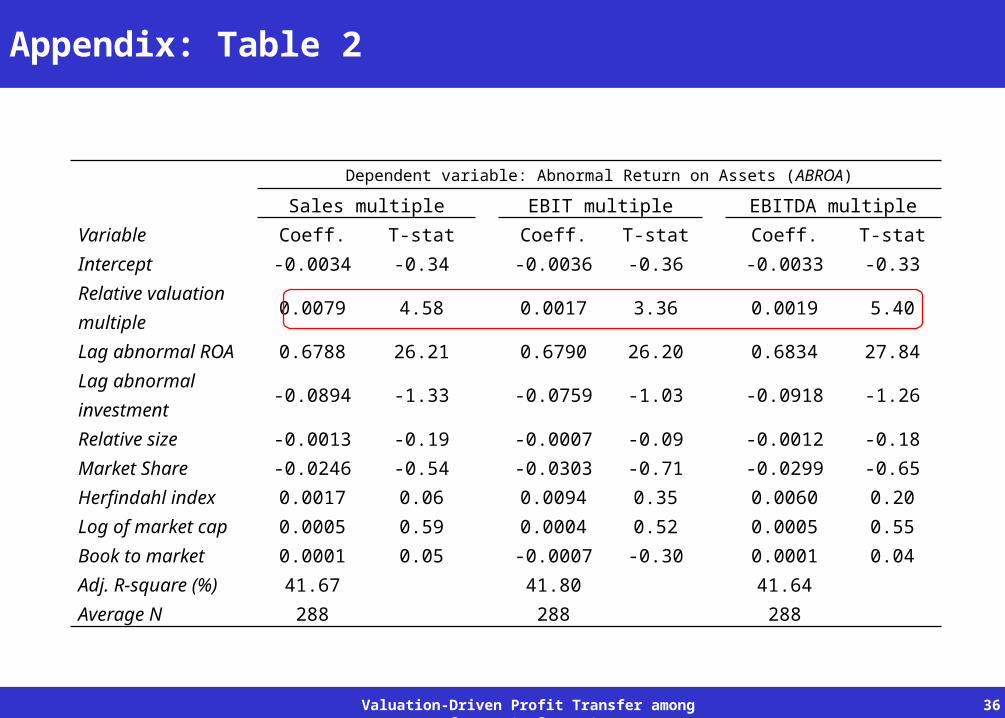
Appendix: Table 2
Dependent variable: Abnormal Return on Assets (ABROA)
Sales multiple EBIT multiple EBITDA multiple
Variable Coeff. T-stat Coeff. T-stat Coeff. T-stat
Intercept -0.0034 -0.34 -0.0036 -0.36 -0.0033 -0.33
Relative valuation multiple 0.0079 4.58 0.0017 3.36 0.0019 5.40
Lag abnormal ROA
0.6788 26.21 0.6790 26.20 0.6834 27.84
Lag abnormal investment
-0.0894 -1.33 -0.0759 -1.03 -0.0918 -1.26
Relative size -0.0013 -0.19 -0.0007 -0.09 -0.0012 -0.18
Market Share -0.0246 -0.54 -0.0303 -0.71 -0.0299 -0.65
Herfindahl index 0.0017 0.06 0.0094 0.35 0.0060 0.20
Log of market cap
0.0005 0.59 0.0004 0.52 0.0005 0.55
Book to market 0.0001 0.05 -0.0007 -0.30 0.0001 0.04
Adj. R-square (%) 41.67 41.80 41.64
Average N 288 288 288
Valuation-Driven Profit Transfer among Corporate Segments
37
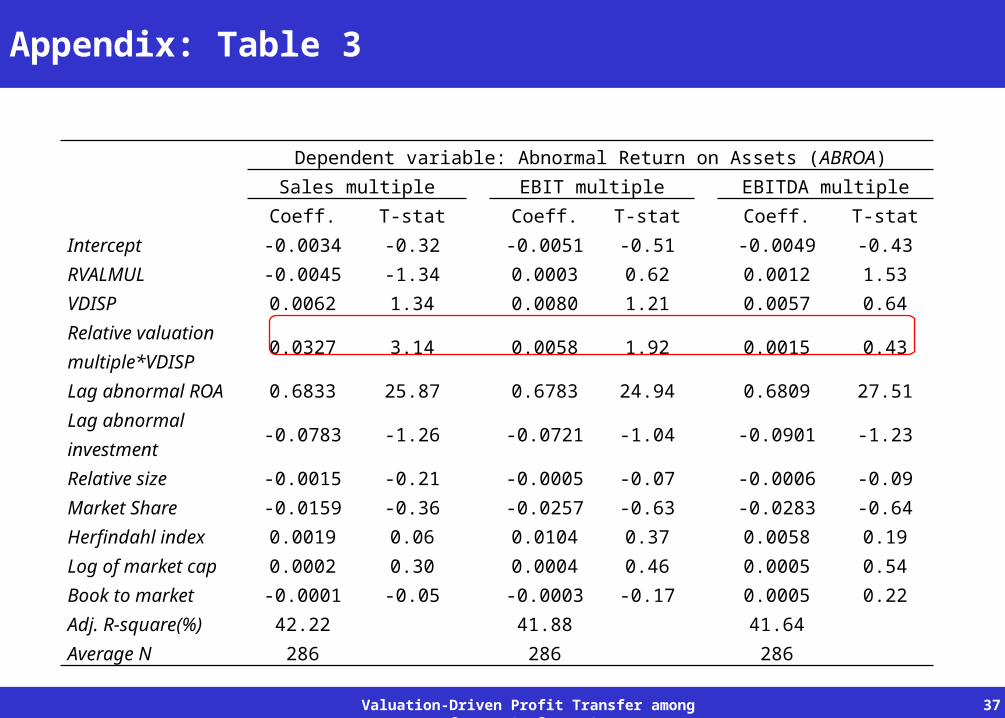
Appendix: Table 3
Dependent variable: Abnormal Return on Assets (ABROA)Sales multiple EBIT multiple EBITDA multiple
Coeff. T-stat Coeff. T-stat Coeff. T-stat
Intercept -0.0034 -0.32 -0.0051 -0.51 -0.0049 -0.43
RVALMUL -0.0045 -1.34 0.0003 0.62 0.0012 1.53
VDISP 0.0062 1.34 0.0080 1.21 0.0057 0.64
Relative valuation multiple*VDISP
0.0327 3.14 0.0058 1.92 0.0015 0.43
Lag abnormal ROA
0.6833 25.87 0.6783 24.94 0.6809 27.51
Lag abnormal investment
-0.0783 -1.26 -0.0721 -1.04 -0.0901 -1.23
Relative size -0.0015 -0.21 -0.0005 -0.07 -0.0006 -0.09
Market Share -0.0159 -0.36 -0.0257 -0.63 -0.0283 -0.64
Herfindahl index 0.0019 0.06 0.0104 0.37 0.0058 0.19
Log of market cap 0.0002 0.30 0.0004 0.46 0.0005 0.54
Book to market -0.0001 -0.05 -0.0003 -0.17 0.0005 0.22
Adj. R-square(%) 42.22 41.88 41.64
Average N 286 286 286