Embed Size (px)
DESCRIPTION
VALUATION. Five Categories of Valuation Methods. Discounted cash-flow Market-based Mixed models Asset-based methods Option-based methods. Discounted Cash-Flow Approach. Estimated future cash flows are discounted back to present value based on the investor’s required rate of return - PowerPoint PPT Presentation
Citation preview
VALUATION
Five Categories of Valuation Methods
1. Discounted cash-flow2. Market-based3. Mixed models4. Asset-based methods5. Option-based methods

Discounted Cash-Flow Approach Estimated future cash flows are
discounted back to present value based on the investor’s required rate of return
Discounted dividend valuation Discounted operating cash-flow
models

Discounted Dividend Valuation
Most straightforward approach Explicit cash flows received by
equity investors Dividends Terminal value when shares are sold
Firm is expected to have an infinite life

Discounted Dividend ValuationTheoretical Model
No-growth, constant dividend
Dividends are growing at rate g
r
D0P
gr
g)(D
gr
DP
10
0
1

Discounted Dividend ValuationRequired rate of return (r)
r is the rate of return demanded on a specific investment
Based on investor’s assessment of risk
CAPM )( fmf rrrr

CAPM -- Example rf, Risk-free (30-year Treasury
bond) = 5% rm, Expected stock market return
= 10% Risk premium = (rm – rf)
Beta = 1.5 r = 5% + 1.5(10%-5%) r = 12.5%

Discounted Dividend ValuationRequired rate of return (r)
For nonpublic companies, use a buildup model and historical sources for data Begin with risk-free rate + Equity risk premium + Small company premium + Company specific risk premium = Required rate of return

Discounted Dividend ValuationGrowth rate (g)
Top-Down analysis Begin with growth of economy Adjust for industry, sector and company
factors Sustainable growth = ROE(1-Payout
rate) ROE = Earnings/Average equity Payout rate: proportion of earnings used
to pay dividends or repurchase shares

Company A Annual dividend = $0.16 Beta = 1.35 ROE = 13% Payout ratio = 20%
Economic 20-year Treasury bond = 4.75% Historical market risk premium = 5.4%
Discounted Dividend Valuation- example

r = .0475+1.35(.054) = .120 g = .13(1-.20) = .104 Value = $11.04…
Discounted Dividend Valuation- example
104.120.
)104.1(16.0$
Discounted Dividend Valuation
Assumes a single, constant growth rate (g)
What if growth rates differ? Use a multi-stage model to
calculate future dividends Calculate future stock value based on
future dividend Calculate present value of stock and
dividends

Discounted Operating Cash-Flow Models
Most applicable in the event of a takeover
Free cash flow (FCF) is operating cash flows less necessary investments in working capital and property, plant and equipment
gr
FCFV
1
0

FCFF or FCFEEBITDALess: Depreciation and AmortizationEBITLess: Interest PaidEBTLess: TaxesNet IncomePlus: Depreciation and amortizationLess: Increase in Working CapitalOperating Cash FlowPlus: Interest Expense*(1-tax rate)Less: Increase in Fixed CapitalFree Cash Flows to the Firm (FCFF)Less: Interest Expense*(1-tax rate)Plus: New debt borrowingLess: Debt RepaymentFree Cash Flows to the Equity (FCFE)

Discount Rate FCFF
Weighted Average Cost of Capital FCFE
Cost of Equity (required rate of return)

Discounted Operating Cash-Flow ModelsOther considerations
Growth Can use a multi-stage model to
accommodate rate changes Forecasting cash flows requires
judgment Begin with reported, historical cash flow
and earnings Make company-appropriate adjustments

Special Issues Loss generating firm valuation Closed Firm Valuation Start-up companies

Valuation Of GAP Retail Stores
Revenues 13.763,00 Operating Income 1.851,00 Capital Expenditures 1.650,00 Depreciation 524,00 Total value of Debt 7.460,38 Market value of Equity 28.795,00 Tax rate 35,00%Return on Capital (will be maintained till perpetuity) 13,61%High Growth period-5 years 12,73%Stable Growth 5,00%Beta-high growth 1,20 Beta- stable growth 1,00 Risk free rate 5,40%Market Premium 4,00%Pretax cost of debt 7,20%

Years EBIT(1-t) Reinvestment FCFF Disc. Rate Present Value0 1.203 1.126 1 1.356 1.269 87 9,06% 80 2 1.529 1.431 98 9,06% 82 3 1.723 1.613 110 9,06% 85 4 1.943 1.818 124 9,06% 88 5 2.190 2.050 140 9,06% 91
Total 426
High Growth Stable GrowthDebt Ratio 21% 21%Equity Ratio 79% 79%Beta 1,20 1,00 Risk free rate 5,40% 5%Risk Premium 4,00% 4%Pretax debt rate 7,20% 7%Tax rate 35,00% 35%Cost of debt 4,68% 4,68%Cost of equity 10,20% 9,40%WACC 9,06% 8,43%

FCFF-Stable Growth
Reinvestment Rate =g/ROC 36,74%
FCFF6 EBIT5(1-t)*(1+g)*(1-R) 1.455
Terminal Value FCFF6/(WACC-g) 42.429 1.455/(8,43%-5%)
Disc.terminal value 28.310
Value of Operating Assets 28.736 28.310+426
Value of Equity Value of Operating Assets+Cash and MS-Debt

Market-based Models
Compare subject company to other similar companies for which market prices are available
Simple computations but require a great deal of professional judgment
P/E Model P/B Method P/S Model

P/E Model
Assumes a company is worth a certain multiple of its current earnings
Assumes each share is worth the same multiple of EPS
Derived from the dividend discount models
Requires judgment regarding Peer firms and their prices Historical (average) data

P/E Model
Firms with no internal growth prospects, paying out 100% of earnings Current P/E = 1/r
Constant growth, Leading P/E P0/E1 = (D1/E1)/(r-g) D = annual dividends, E = EPS
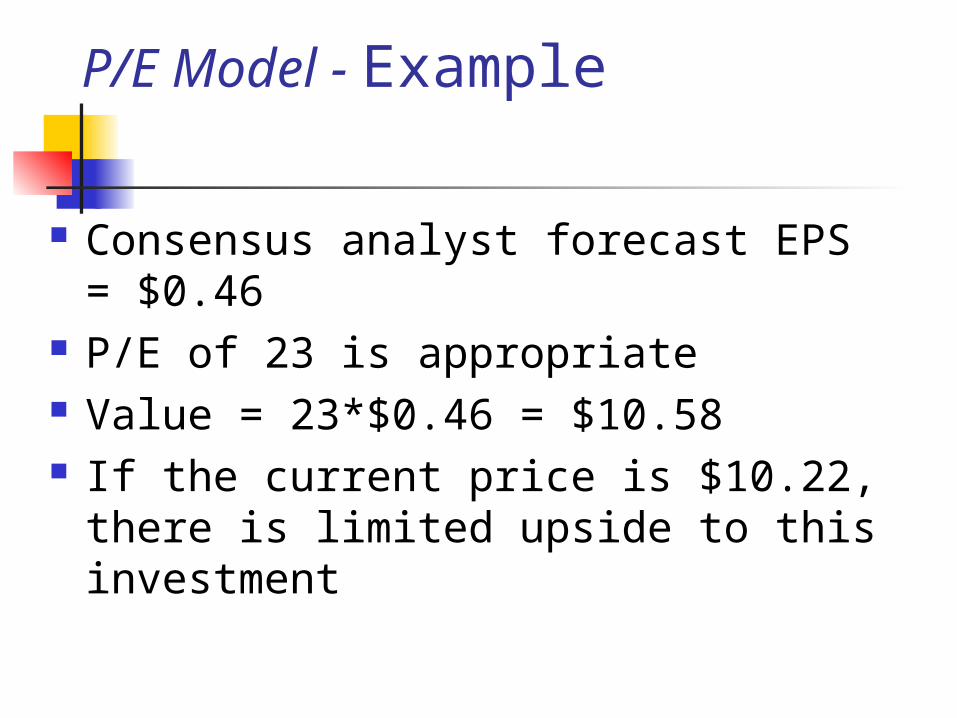
P/E Model - Example
Consensus analyst forecast EPS = $0.46
P/E of 23 is appropriate Value = 23*$0.46 = $10.58 If the current price is $10.22, there is
limited upside to this investment
Mixed Models
Because the previous models are linked (discounted dividend model) a combined approach can be used
May use discounted cash flow approach to forecast cash flows then use market multiple to derive terminal value
Residual income approaches are linked to the dividend discount model

Asset-Based Models Used when a company is going to
be liquidated Valuation is based on underlying
assets Market value of balance sheet items Assets and liabilities
Also called cost or adjusted book value approach

Options-Based Models Theoretically elegant but practical
application is difficult Analyst must have information about
opportunities (and their value) available to a firm
Equity ownership is viewed as an option call on the firm Limited downside, unlimited upside

Selecting a Model Consider characteristics of the firm
Dividend paying Growing Likely to be liquidated
Consider data availability of data Publicly available or closely held
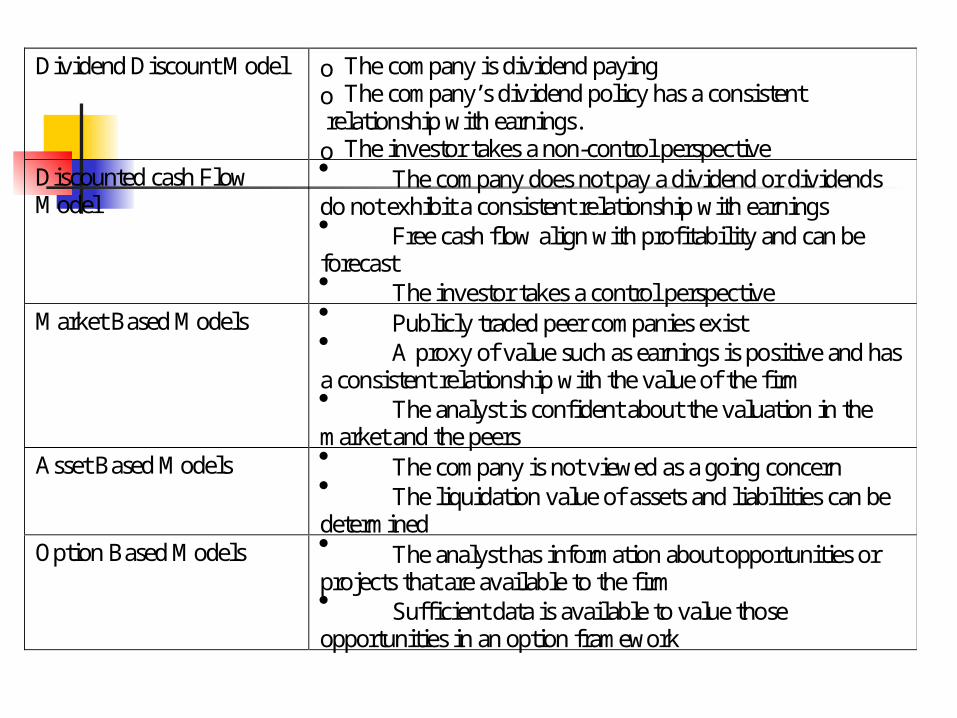
Dividend Discount Model o The company is dividend paying o The company’s dividend policy has a consistent relationship with earnings. o The investor takes a non-control perspective
Discounted cash Flow Model
The company does not pay a dividend or dividends do not exhibit a consistent relationship with earnings Free cash flow align with profitability and can be forecast The investor takes a control perspective
Market Based Models Publicly traded peer companies exist A proxy of value such as earnings is positive and has a consistent relationship with the value of the firm The analyst is confident about the valuation in the market and the peers
Asset Based Models The company is not viewed as a going concern The liquidation value of assets and liabilities can be determined
Option Based Models The analyst has information about opportunities or projects that are available to the firm Sufficient data is available to value those opportunities in an option framework