Embed Size (px)
Citation preview

UW MEDICINE FY15 Budget
VALLEY MEDICAL CENTER
FY 15 OPERATING AND CAPITAL BUDGETS
FF&A COMMITTEE
MAY 15, 2014
UW MEDICINE STRATEGIC PLAN 1. Build Key Programs
Regional Heart Center
Vascular Center
Neurosciences Institute
Oncology (SCCA)
Eye Institute
Organ Transplantation
Spine/Sports Musculoskeletal
Trauma System Safety Net Care
Health Care Reform
Obstetrics/Neonatal
Stra
tegi
c Se
rvic
e Ex
pans
ion/
In
nova
tions
Car
e N
ew P
rogr
ams/
In
nova
tions
in C
are
Polic
y/
Advo
cacy
Pain Center
Strategic Partnerships & ACO Development
Primary & Secondary Care Expansion
Service Excellence Patients Are First
Pillar Goals
Patient Safety, Quality & Cost-Effective
Outcomes Performance Improvement
Workforce Development/HR
IT Advancements
Integration of Research Innovation
Educational Innovation Clinical
Innovation
2. Build Relationships & Provider Network
3. Deliver Service Excellence
4. Deliver Quality, Safety, & Value Based Outcomes
5. Organizational Capability & Fiscal Integrity
Diabetes & Obesity
Digestive/GI
Accountable Care Organization
Palliative Care
Integrated Mental Health/Primary Care
Telemedicine
Long Range Financial Plan
2

Financial Forecast
Future success is based on growth of clinics & outpatient services which will maintain inpatient utilization.
Major changes will come as healthcare reform enters year two: • Demand for service • Payment reductions • Shift from volume to quality & patient satisfaction • Move to Triple Aim
PREAMBLE
3
4
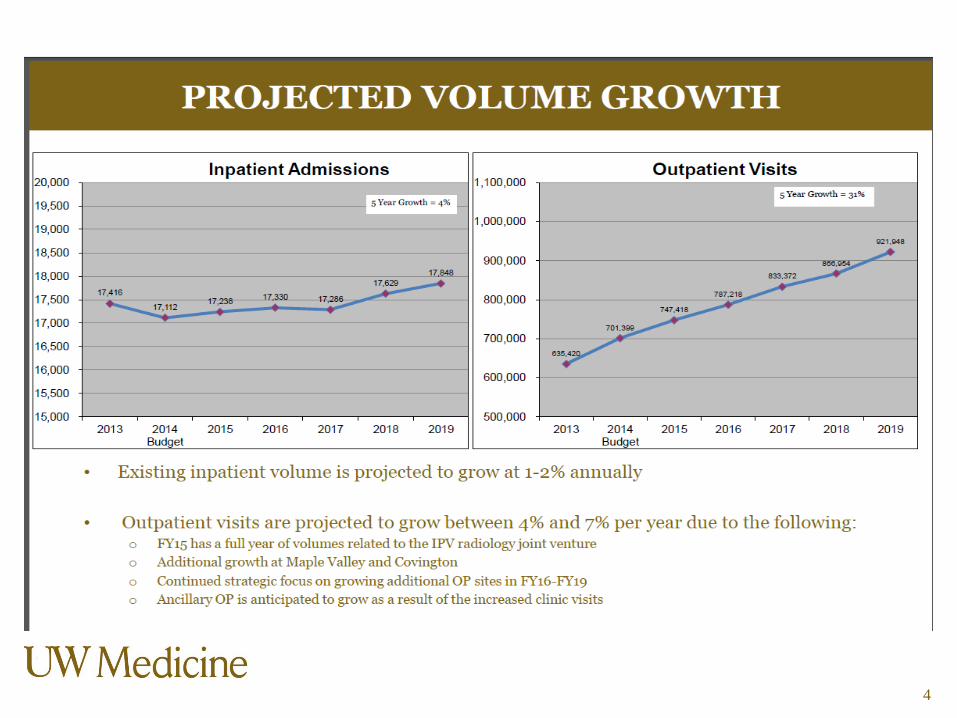
Understanding the reimbursement impact of a shift in payer mix from one category to another.
IMPACTS OF SHIFT FROM SELF PAY TO MEDICAID
The Affordable Care Act (ACA) will change our traditional payor mix.
Based on the reimbursement levels of the new exchange category contracts and the number of new Medicaid enrollees, gross and net revenues will change.
This impact could be significant if the exchange population is large enough or if we are unable to negotiate to ensure that exchange-related contracts maintain a sufficient margin.
Uninsured/ Self-Pay Patients
Join Exchange
Plans
Small Employers
With No Insurance Coverage Join the
Exchange
Existing Insured
Commercial Patients Shift to
Exchange Plans; Loss in Market
Share
Medicare/ State
Payments Decrease
Due to Adjustments
in DSH, CPE,IME
Uninsured Patients
join Medicaid
5
4

TABLE OF CONTENTS
• FY14 Results
• FY15 Challenges and Investing in the Future
• FY15 Operating Budget Assumptions
• Financial Plan Comparison
• Volumes, Revenues and Payer Mix
• Salary & Non-Salary Expenses
• Allocations
• Performance Improvement Initiatives
• Non-Operating Revenue and Expense
• FY15 Budget Results
• FY15 Capital Budget
• Risks
• Approvals
6

FY14 RESULTS
• Net income from operations is projected to be $10.7 million at end of fiscal year compared to a budget of $9k.
• Operating margin is projected at 2.3% compared to a budget of 0%.
• Primary reasons operating margin has exceeded budget are: • Outpatient volumes, including hospital ancillary and urgent and specialty clinic
volumes, have been greater than anticipated impacting net revenue by approximately $1.7 million.
• Significant effort related to cost containment including implementation of performance improvements impacting net revenue and operating expenses by approximately $7 million.
• Modifications to employee benefit expense impacting total operating expenses by approximately $2 million.
7

CONTINUED CHALLENGES IN ECONOMIC ENVIRONMENT MOVING INTO FY15
• Federal Issues
• State Issues
• Commercial Payer issues
• Pressure to reduce payment rates
• Interest in risk sharing
• Medicaid Expansion and Health Care Exchanges – effective January 1, 2014
• Need for increased community access (i.e. growth)
8

Strategically, FY15 will be another year of positioning the medical center and the entire UW Medicine system for the future. Included in those plans are: • Continued development of the UW Medicine Accountable Care
Network, including organizational commitment to the “Triple Aim” • Reduce the Cost of Care
• Enhance the Experience and Outcomes of Patients
• Improve the Health of the Population
• Leveraging Patients are First structure and goals– patient experience, quality and fiscal responsibility
• IT Services investments including a common IT front-end (EPIC EMR), maximizing meaningful use incentive dollars and continued preparation for ICD-10 implementation
• Strategic clinical access investments and consistency with UW Medicine strategic plan
• Execution on Performance Improvement Initiatives
FY15 – INVESTING IN OUR FUTURE
9

FY15 OPERATING BUDGET ASSUMPTIONS

FY15 BUDGET
11
The FY15 budget goal is a total margin of 1.01% or $5.2 million, with an operating margin of 0.7% or $3.6 million.
The FY15 financial operating priorities include: • Net revenue enhancement (revenue cycle)
• Overall expense reduction (cost per case mix adjusted discharge)
• Supply Chain initiatives
• Transformation of Care initiatives

FINANCIAL PLAN COMPARISON
12
FY15 Budget
Financial Plan for FY15
Net Patient Revenue Growth 7.9% 1.5%
FTEs per Adjusted Occupied Bed 6.64 6.11
FTEs 2,583 2,491
Salaries and Benefits as a % of Total Net Revenue 58.9% 60.5%
Supply Expense as a % of Total Net Revenue 13.7% 13.2%
Operating Margin 0.7% 0.5%
Total Margin 1.0% 1.0%
Operating Expense per CMI Adjusted Admission $9,110 $9,482

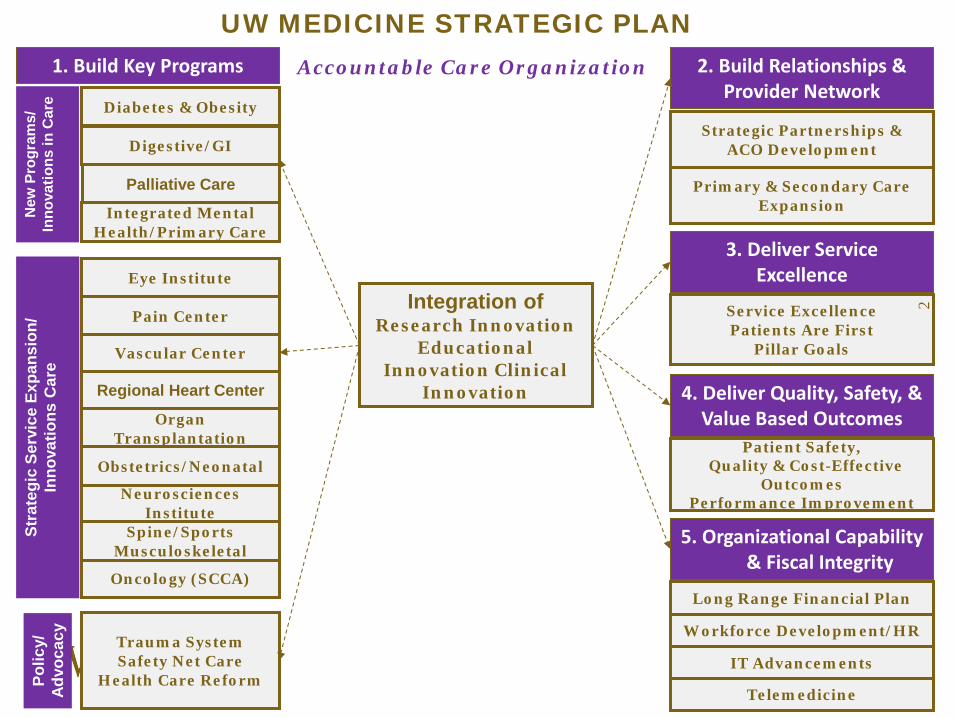
PROJECTED VOLUME GROWTH
• Inpatient admissions are projected to grow 2.8% from FY14 projected admissions due primarily to slight growth expected in general medicine/surgical areas.
• Inpatient surgical case volumes are projected to grow at 1.5% based on detailed work done to project volumes by surgeon, including additional cases based on new surgeon recruitment, specifically in Vascular Surgery.
• The increase in admissions includes an overall assumption that continued expansion within the Clinic Network will produce downstream hospital volume growth.
• Surgical growth assumptions include the full-year effect of several new surgeons brought on in FY14, specifically Urology and Vascular Surgery, along with replacements in Gyn and Neurology.
13
4,773
4,490
4,198
4,261
3,900
4,000
4,100
4,200
4,300
4,400
4,500
4,600
4,700
4,800
4,900
FY12 FY13 FY14Projected
FY15Budget
Case
s
Inpatient Surgical Cases
Year over year growth rates -6.8%24.9% 1.5%-6.5%

OUTPATIENT VOLUME
• Clinic Visits are projected to grow 10.1% from FY14 projected visits due primarily to the opening of the Maple Valley Primary and Urgent Care Clinics, along with expansion at North Benson Urgent Care and hiring of several new providers in areas such as Obstetrics, ENT, General Surgery, Podiatry, and Family Medicine.
• Outpatient surgical cases are projected to grow at 18% based on detailed work done to project volumes by surgeon, including additional cases based on new surgeon recruitment, specifically in General, Vascular, Ears/Nose/Throat and Orthopedic Surgeries.
• Surgical growth assumptions also include the full-year effect of several new surgeons brought on in FY14, specifically Urology and Vascular Surgery, along with replacements in Gyn and Neurology
14

• Constraints on reimbursement by all payers are creating challenges in generating sufficient financial margins
• An overall price increase of 4% has been incorporated into the assumptions
• Reimbursement impacts by payer have been included as follows:
• Medicare – Market basket increases, wage adjustments and pay for performance projections were included and resulted in slight increases in Medicare reimbursement. Decreases for Disproportionate Share dollars (DSH) were also included.
• Medicaid – Effective July 1, 2014, Medicaid is expected to rebase both IP and OP payments. This assumption does not impact VMC on the inpatient fee-for-service side, and is unfavorable as it relates to outpatient. Also included is a 3% withholding for the HCA budget neutrality adjustment. No change for the Safety Net Assessment, Certified Public Expenditure (CPE) program, or DSH are assumed.
• Commercial – nominal increases based on contracts that are currently in place as well as a small amount of realization of price increases.
NET REVENUE ASSUMPTIONS
15

VMC has experienced an increase in the Medicaid payer mix beginning in January, 2014, due to the newly expanded Medicaid program
VMC is currently participating in a number of the exchange programs and is monitoring the volumes related to this business as it evolves.
There is currently an assumption in the FY15 budget that the payer mix will be higher for Medicaid and lower for self-pay, replicating January-March 2015 actual payer mix. Management will continue to monitor payer mix changes monthly.
PAYER MIX AND MEDICAID EXPANSION
16
43%
34%
19%
0% 4%
FY14 (YTD March)
Commercial
Medicare
Medicaid
HIX
Self-pay
41.25%
35%
20%
1% 2.75%
FY15 Budget
Commercial
Medicare
Medicaid
HIX
Self-pay

LABOR EXPENSE TRENDING
17
• The FY15 budget assumes a 7% increase in FTEs primarily related to expansion in the Clinic Network.
• Salaries and benefits were adjusted for anticipated union and merit increases (averaging approximately 3%) in FY15, along with the effects of changes in the retirement and medical plans.
7.19 6.92
6.42 6.64
-
1.00
2.00
3.00
4.00
5.00
6.00
7.00
8.00
9.00
10.00
2,300
2,350
2,400
2,450
2,500
2,550
2,600
FY12 FY13 FY14Projected
FY15Budget
FTEs
per
Adj
uste
d O
ccup
ied
Bed
FTEs
FTE Trending
FTEs FTEs per AOB
59.5%61.2%
57.8%58.9%
30.0%
35.0%
40.0%
45.0%
50.0%
55.0%
60.0%
65.0%
70.0%
200,000
220,000
240,000
260,000
280,000
300,000
320,000
FY12 FY13 FY14Projected
FY15Budget
Dolla
rs in
(000
's)
Salary & Benefits as % of Total Net Revenue
Salary and Benefits $ Salary and Benefits as a % of Total Net Revenue

SUPPLY EXPENSE
18
• Drug expense inflation is budgeted at 5%, Medical Supplies at 3% and Other Expenses at 2%, prior to Performance Improvement Initiatives.
• Supply expenses are also increasing in FY15 due to the expansion of the 340B pharmaceutical program, as well as re-classifying blood products as a supply rather than a purchased service.
• Management also evaluates supply expense per CMI adjusted discharge as it takes into account other important factors that influence results.
14.0%13.4% 13.2% 13.7%
0.0%
5.0%
10.0%
15.0%
20.0%
54,000
56,000
58,000
60,000
62,000
64,000
66,000
68,000
70,000
72,000
FY12 FY13 FY14Projected
FY15Budget
Sup
ply
Exp
ense
as
% o
f Tot
al N
et R
even
ue
Sup
ply
Exp
ense
(in
000
s)
Supply Expense Trending
Supply Expense Supply Exp as % of Net Rev 50th Percentile 25th Percentile
UHC Peer Group 25th percentile: 15.68%UHC Peer Group 50th percentile: 17.02%
1,396 1,282
1,176 1,259
-
200
400
600
800
1,000
1,200
1,400
1,600
1,800
2,000
54,000
56,000
58,000
60,000
62,000
64,000
66,000
68,000
70,000
72,000
FY12 FY13 FY14Projected
FY15Budget
Supp
lies/
CMI A
djus
ted
Adm
issi
on
Supp
ly E
xpen
se (i
n 00
0s)
Supplies/CMI Adjusted Admission Trending
Supply Expense Supplies/CMI Adjusted Admission 50th Percentile 25th Percentile
UHC Peer Group 25th percentile - $1,183UHC Peer Group 75th percentile - $1,386

ALLOCATIONS AND OTHER EXPENSES
19
There are a number of allocations and system related expenses that have been included in the budget. Total allocations represent .6% (or $3.2 million) of total operating expenses for FY15.
• IT Services
• UW Medicine Central Budgets, which include Compliance, Marketing, Advancement, Credentialing and Executive leadership
• Financial Services, which include Accounting, Finance, Patient Financial Services, ICD-10, Cost Reporting, Governmental Programs, Contracting and Revenue Cycle
• Other allocations, which include Human Resources, Professional Liability Insurance, Risk Management and the Transfer Center
Central Budget
13%
Financial Services
46%
IT Services 15%
Contact Center 5%
Other 21%
FY15 Shared Services - VMC $3M

COST PER CMI ADJUSTED ADMISSION
20
FY14 March Annualized
FY15 Budget
FY15 LRFP
NUMERATOROperating Expense $456,177,000 505,086,000$ $470,611,000
DENOMINATORCase Mix Index 1.40 1.42 1.37 Net Admissions 16,765 17,238 17,238 OP Adjustment Factor 2.23 2.27 2.10 Adjusted Admissions 37,397 39,046 36,227 CMI Adjusted Admissions 52,356 55,446 49,631
RESULTOperating Exp/CMI Wtd Adj Admission $8,713 $9,110 $9,482
Operating Expense per CMI Adjusted Admission

PERFORMANCE IMPROVEMENT INITIATIVES
21
Included in the FY15 Operating Budget are the following performance improvement initiatives (both new and carryover from FY 2014)
• Revenue cycle initiatives of $11.2 million for continued revenue enhancements, including further shift of self pay patients to Medicaid, continued impact of healthcare exchanges, and improved charge capture, denials management, contract management and point of service cash collections.
• Supply chain initiatives of $0.4 million focus on supply reductions primarily in surgical supplies.
• Transformation of care initiatives of $3.6 million focusing on 340B Pharmacy Program Expansion and other operational opportunities.
These initiatives, totaling $15.2 million, will be tracked, measured and reported on a monthly basis throughout FY15.

NON-OPERATING REVENUE AND EXPENSES
•Non-operating revenue and expenses include the following:
• Property Tax Revenue of approximately $17. 2 million
• Interest and amortization expense on outstanding debt issues of $18.1 million
• Investment income, including the Build America Bond subsidy, estimated at $3.2 million.
• Other net expense of $0.7 million – includes all medical office building revenue and expense, and other non-operating transactions (property gain/loss).
22

BOND COVENANTS
• VMC has two types of bond indebtedness:
• Limited Tax General Obligation bonds (LTGOs)
• Revenue bonds • As the LTGOs are backed by property tax revenues, there are
no specific financial coverage ratios required for any of these debt issues.
• Revenue bond financial coverage ratio: • Net income available for debt service must be at least 1.25x the
maximum annual debt service on outstanding revenue bonds.
• Coverage Level – FY13 – 2.21x
• Coverage Level – FY14 as of March 2015 – 6.57x
• Coverage Level – Budget FY15 – 5.42x
23

FY14 PROJECTED VS. FY15 BUDGET
24
March 2014 Projected Operating Income (Dollars in 000s) 10,724$
RevenueVolume Increases (Net Revenue Impact) 14,063 Commercial Contract Changes & Price Increases (Net Revenue Impact) 12,588 Net Revenue Performance Improvements 8,131 Other Revenue Changes 6,984 Payor Mix Degradation - Total Revenue 41,766
Salary & Benefits Benefit and Salary Inflation (15,942) Increase and/or Changes in FTEs (14,243) Performance ImprovementsTotal Salary & Benefits (30,185)
Non-Salary ExpenseMedical Supplies and Drug Expenses (6,928) Purchased Services and Other (8,968) Performance Improvements (3,228) Total Non-Salary Expense (19,124)
Capital Expenses
Depreciation 400 Total Capital Expenses 400
2015 Budgeted Operating Margin 3,581$

FY15 OPERATING BUDGET SUMMARY
25
(in 000s) FY12
Audited FY13
AuditedFY14
ProjectedFY15
Budget
% Change YTD Actual vs.
Budget
Total Patient Revenue 1,192,078$ 1,255,937$ 1,391,621$ 1,496,003$ 7.5%
Total Deductions (786,462) (839,613) (953,249) (1,022,842) 7.3%66.0% 66.9% 68.5% 68.4% -0.2%
Net Patient Revenue 405,616 416,324 438,372 473,161 7.9%
Other Revenue 22,958 27,285 28,529 35,506 24.5%Total Net Revenue 428,574 443,609 466,901 508,667 8.9%
ExpensesSalaries, Wages & Benefits 254,898 271,597 269,643 299,827 11.2%Supplies and Other 149,825 157,399 153,893 173,018 12.4%Depreciation 32,529 32,440 32,641 32,241 -1.2%Total Expenses 437,252 461,436 456,177 505,086 10.7%
Income from Operations (8,678)$ (17,827)$ 10,724$ 3,581$ -66.6%
Operating Margin -2.0% -4.0% 2.3% 0.7% -69.3%
Nonoperating Income (Expense) 3,295 829 344 1,574 357.6%
NET INCOME (5,383)$ (16,998)$ 11,068$ 5,155$ -53.4%

FY15 CAPITAL BUDGET
26

• Capital investment levels are evaluated based on comparison to key industry ratios and benchmarks, as well as margin targets • Historical values for key ratios and benchmarks are as shown:
KEY CAPITAL RATIOS
27
Ratio of Capital Expenditures to Depreciation Expense Days Cash = Cash / (Operating Expense – Depreciation) / 365

CAPITAL BUDGET HISTORY
• VMC’s capital history reflects block funding for 3 major areas:
• Construction
• Equipment
• IT Services
28
Five Year Capital History($ in 000s)
CY11 CY12 FY13 FY14 FY15
Construction 26,811 32,825 14,900 8,105 9,100 Equipment 6,081 5,207 2,463 3,714 3,700 IT Services 39,515 29,084 18,376 3,187 6,700 Core Capital Budget 72,407 67,116 35,739 15,006 19,500

FY15 CAPITAL BUDGET OVERVIEW
29
VMC proposes a $19.5 million core capital budget for FY15. Significant projects include:
• Expansion of North Benson Urgent Care Clinic
• Renovations to certain Lab and Outpatient Radiology areas
• IT initiatives and upgrades to ancillary systems
• Equipment for new programs/physicians and growth
• Equipment purchases on expiring leases

FY15 BUDGET PLAN RISKS
30
VMC
Achievement of Budgeted Patient Volumes
Payer Channeling and Rate Compression
Management of Expenses
Medicaid Expansion
Global RisksVolume and Strategic Growth
Implementation of Strategic Initiatives
Management of Expenses
Impacts of Healthcare Reform

REQUEST FOR APPROVALS
31
• Management recommends approval of the FY15 operating margin of $3.6 million, which represents a 0.7% operating margin and $5.2 million or 1.0% total margin.
• Management recommends approval of the FY15 capital budget of $19.5 million.