Embed Size (px)
Citation preview
Validation Testing of a High Rate Disk Filter For Water Recycling
Applications
PNCWA 2010
Keith Bourgeous, Nicola Fontaine, and Kathy Marks
Filename.ppt
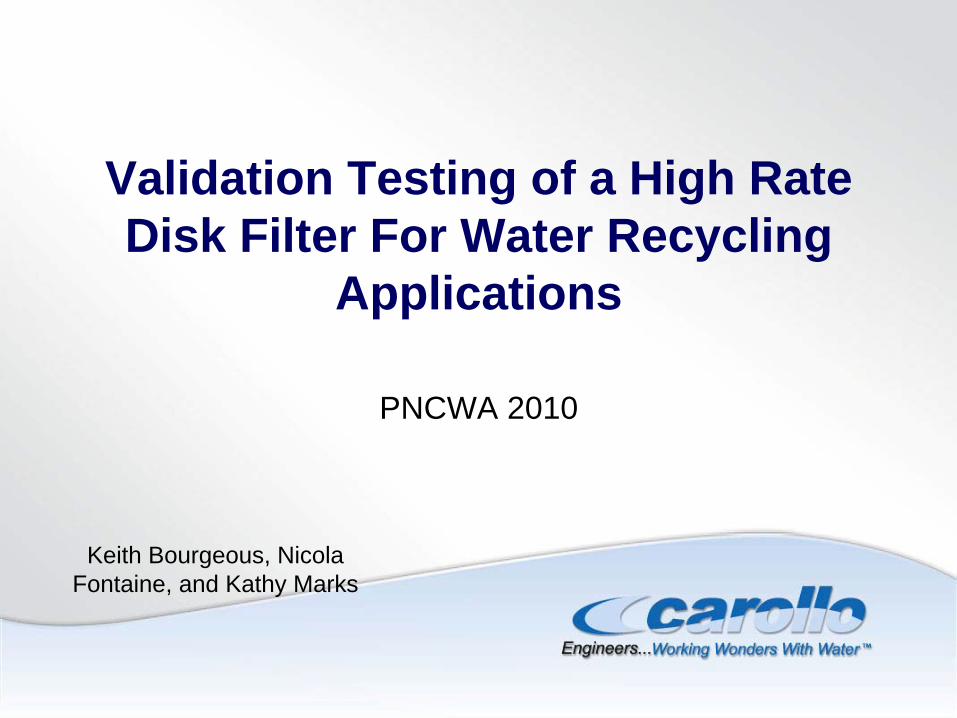
Testing Designed to Demonstrate Filtration Performance According to California Water Recycling Criteria
Title 22 requires that the water beTertiary disinfected effluent that •Turbidity < 2 NTU •Total Coliform < 2.2 MPN/100 mL
•Filtration/Disinfection 5 log poliovirus

Filename.ppt
Why Do We Care About the California Title 22 Standards?
Reuse Standards Are Very Similar•Turbidity < 2 NTU •Total Coliform < 2.2 MPN/100 mL
Filename.ppt
Background on Title 22 Water Reuse Criteria

Filename.ppt
Title 22 Wastewater Reclamation Criteria Treatment Requirements Pre 1978
Coagulation Flocculation Sedimentation Filtration Disinfection
SecondaryEffluent Title 22
CompliantEffluent
120 mg/Lalum
Filename.ppt
Pomona Virus Study
• Conducted by the County Sanitation Districts of Los Angeles County
• Funded By Regional Water Quality Control Board & the EPA
• Purpose of the StudyTo investigate less costly treatment alternatives
Filename.ppt
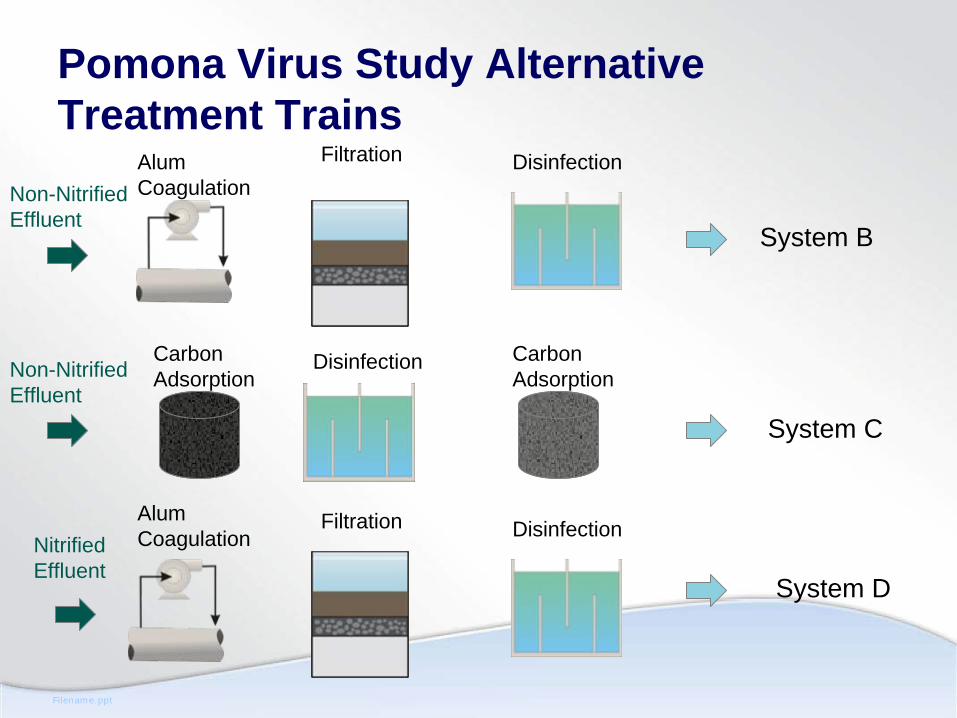
Pomona Virus Study Alternative Treatment Trains
AlumCoagulation
DisinfectionFiltration
Non-NitrifiedEffluent
System B
Carbon Adsorption
Disinfection
Filtration
Carbon AdsorptionNon-Nitrified
EffluentSystem C
AlumCoagulationNitrified
EffluentSystem D
Disinfection
Filename.ppt
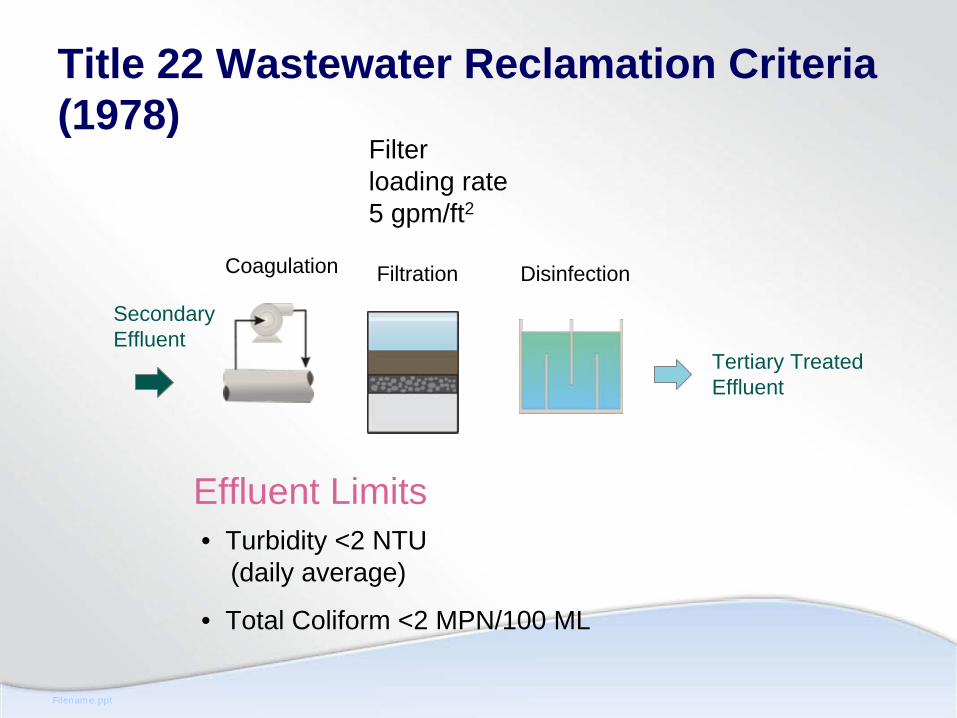
Title 22 Wastewater Reclamation Criteria (1978)
Coagulation DisinfectionFiltration
Secondary Effluent
• Turbidity <2 NTU(daily average)
• Total Coliform <2 MPN/100 ML
Effluent Limits
Tertiary Treated Effluent
Filter loading rate5 gpm/ft2
Filename.ppt
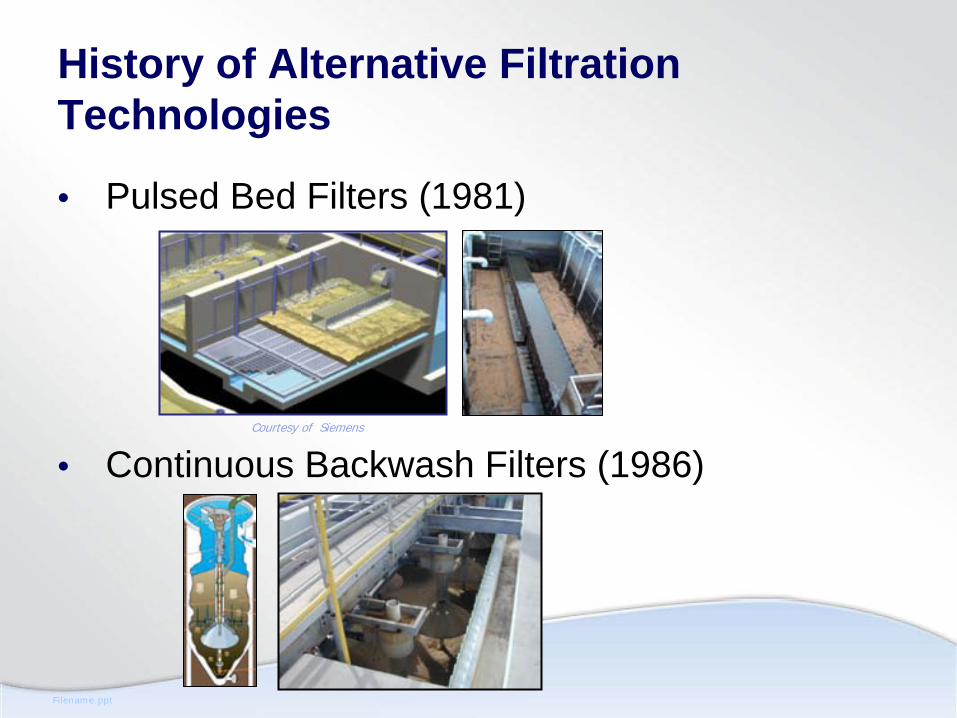
History of Alternative Filtration Technologies
• Pulsed Bed Filters (1981)
• Continuous Backwash Filters (1986)Courtesy of Siemens
Filename.ppt
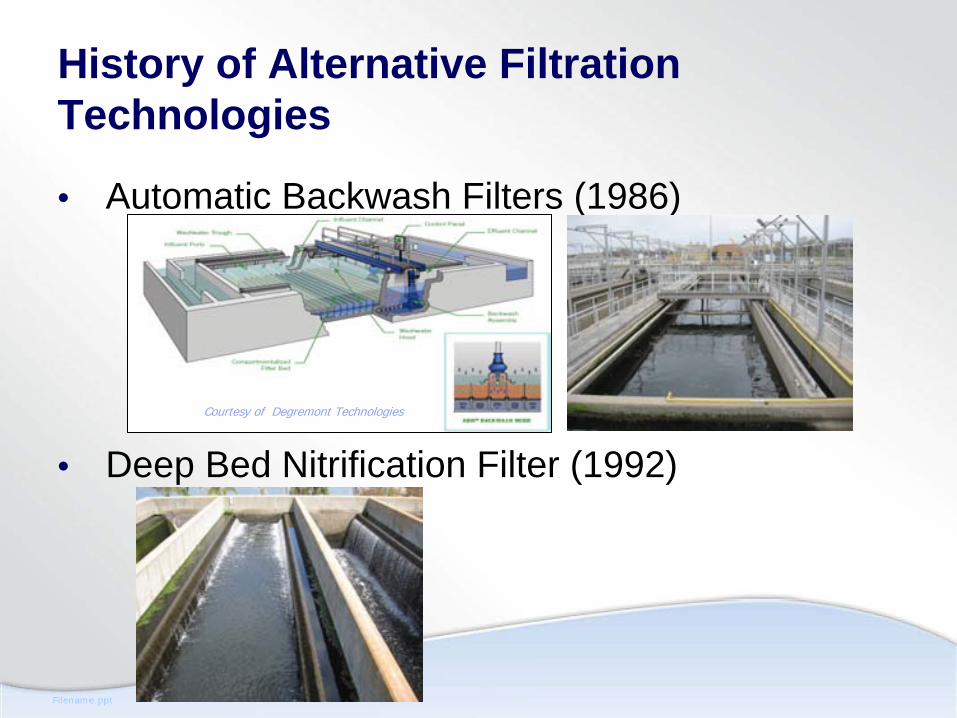
History of Alternative Filtration Technologies
• Automatic Backwash Filters (1986)
• Deep Bed Nitrification Filter (1992)Courtesy of Degremont Technologies
Filename.ppt
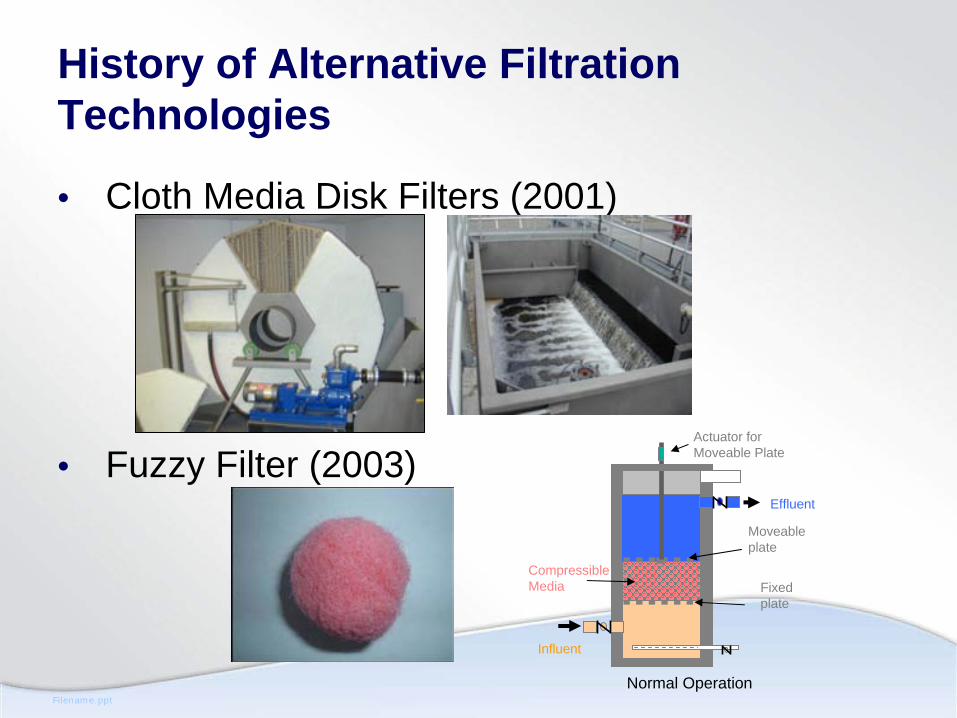
History of Alternative Filtration Technologies
• Cloth Media Disk Filters (2001)
• Fuzzy Filter (2003)Moveable plate
Influent
Effluent
Fixed plate
CompressibleMedia
Actuator for Moveable Plate
Normal Operation
Filename.ppt
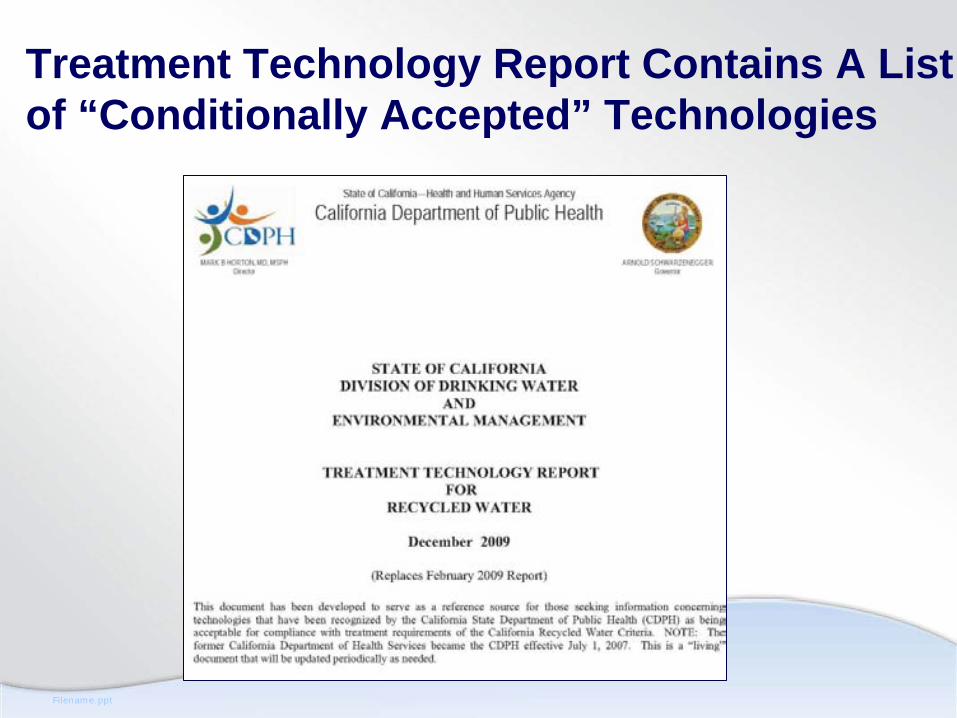
Treatment Technology Report Contains A List of “Conditionally Accepted” Technologies
Filename.ppt
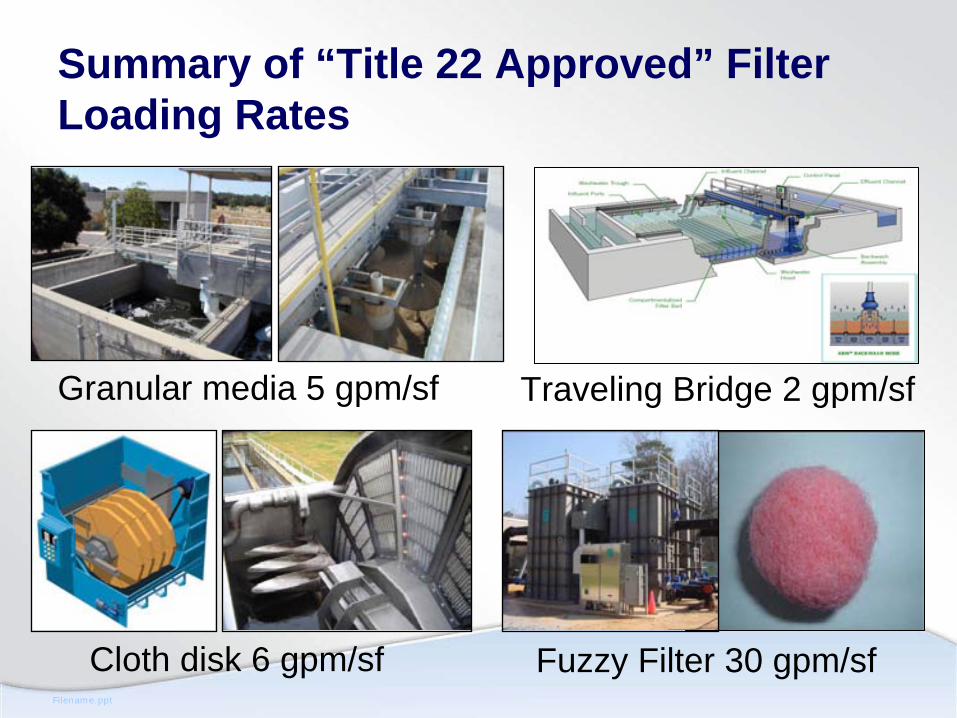
Summary of “Title 22 Approved” Filter Loading Rates
Granular media 5 gpm/sf Traveling Bridge 2 gpm/sf
Cloth disk 6 gpm/sf Fuzzy Filter 30 gpm/sf
Filename.ppt
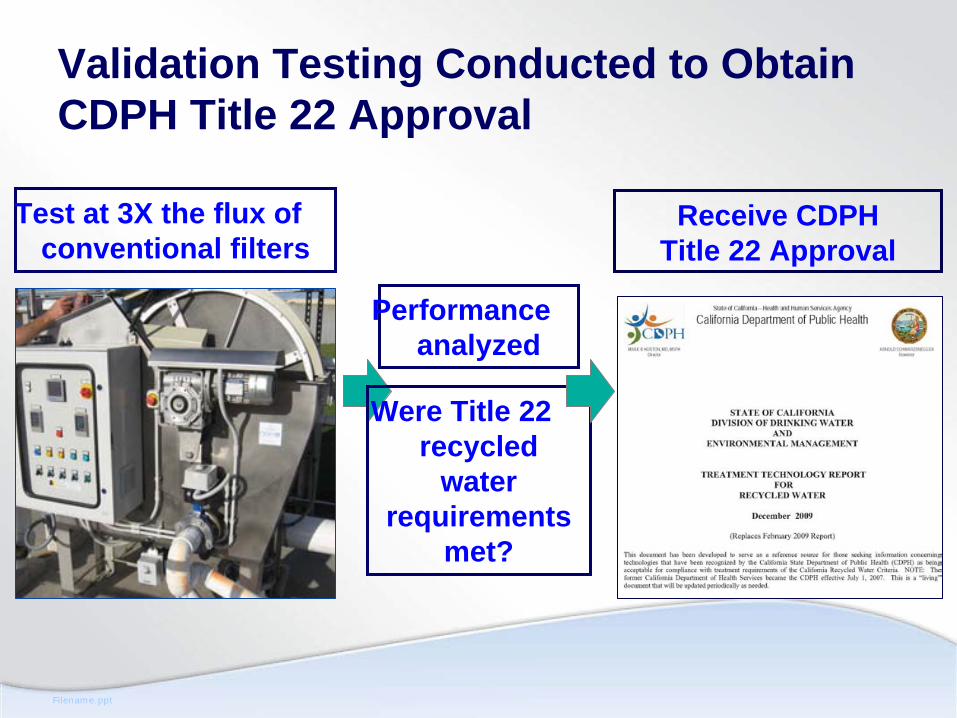
Validation Testing Conducted to Obtain CDPH Title 22 Approval
Receive CDPHTitle 22 Approval
Test at 3X the flux of conventional filters
Were Title 22 recycled
water requirements
met?
Performance analyzed
Filename.ppt
Description of the Ultrascreen® Filter

Filename.ppt
Effluent valve
Variable speed filter drive unit
Influent Line
Filename.ppt
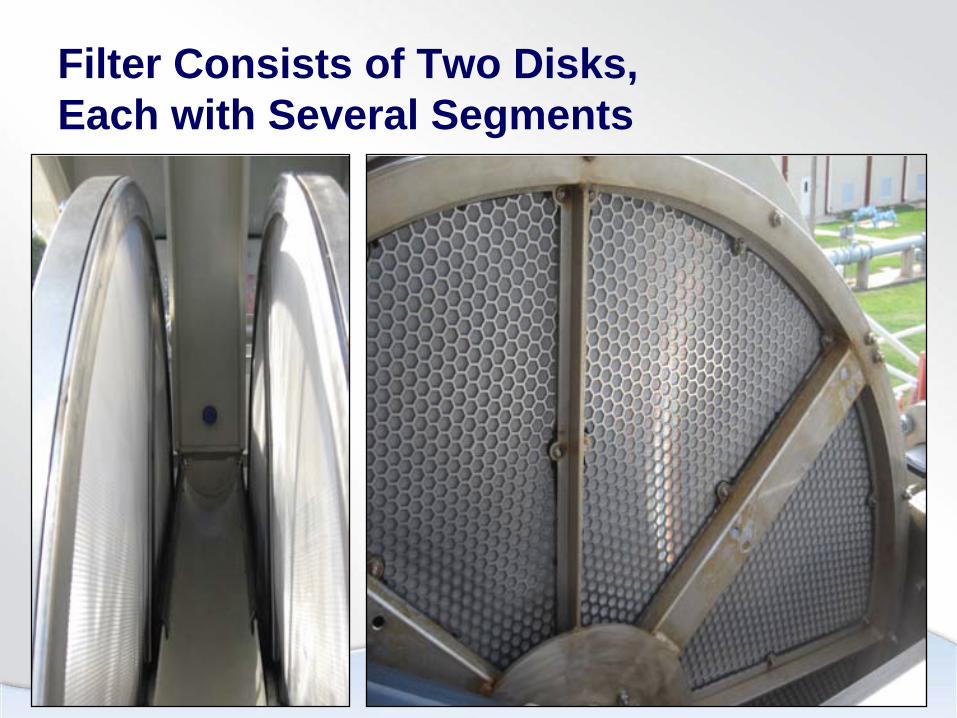
Filter Consists of Two Disks, Each with Several Segments
Filename.ppt
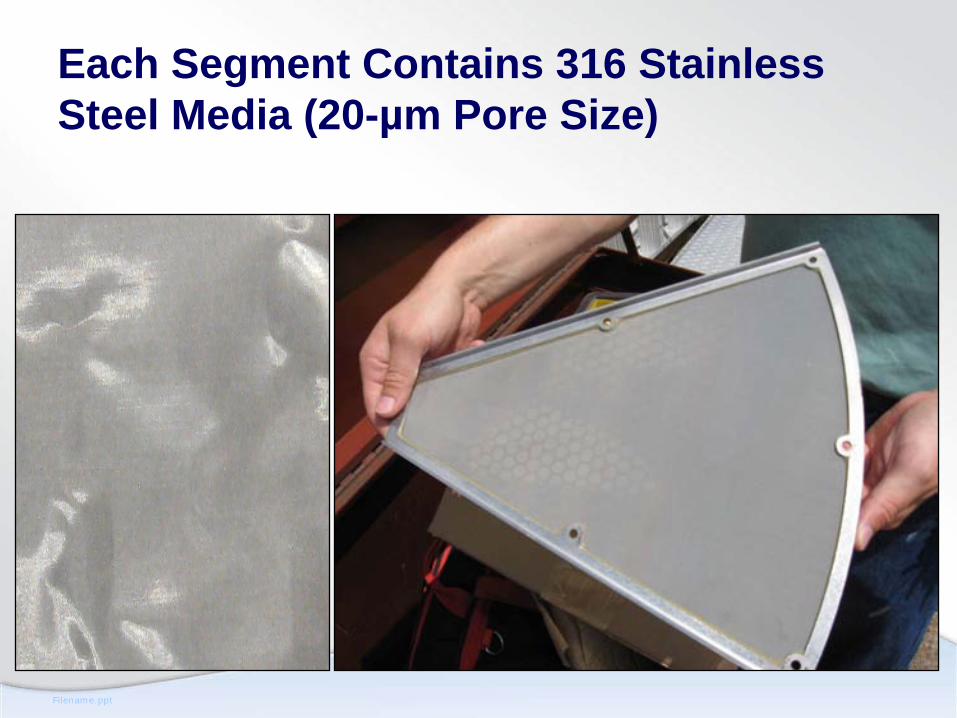
Each Segment Contains 316 Stainless Steel Media (20-µm Pore Size)

Filename.ppt
Ultrascreen®: Inside-Out Flow Path, Rotating Disks & Free Filtrate Discharge

Filename.ppt
Comparison of Ultrascreen® Effluent Flow Path To Other Microscreen Disk Filters
Filename.ppt
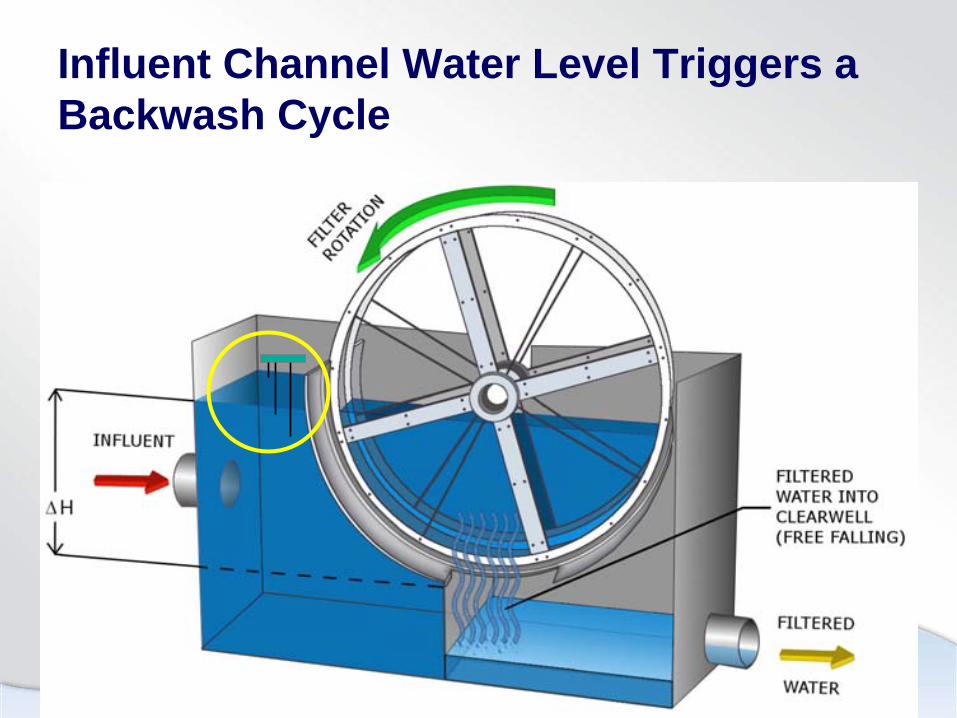
Influent Channel Water Level Triggers a Backwash Cycle

Filename.ppt
Backwash Cycle Triggered By Influent Water Level
High water level triggers a backwash
cycle
Low water level ends a backwash
cycle

Filename.ppt
Backwash Cycle Removes Accumulated Particles from Disks
Backwash spray
nozzles
Backwash water flow
path
Filename.ppt
Ultrascreen®
Title 22 Performance Testing Protocol

Filename.ppt
Development of Testing Protocol Was A Collaborative Process
Filename.ppt
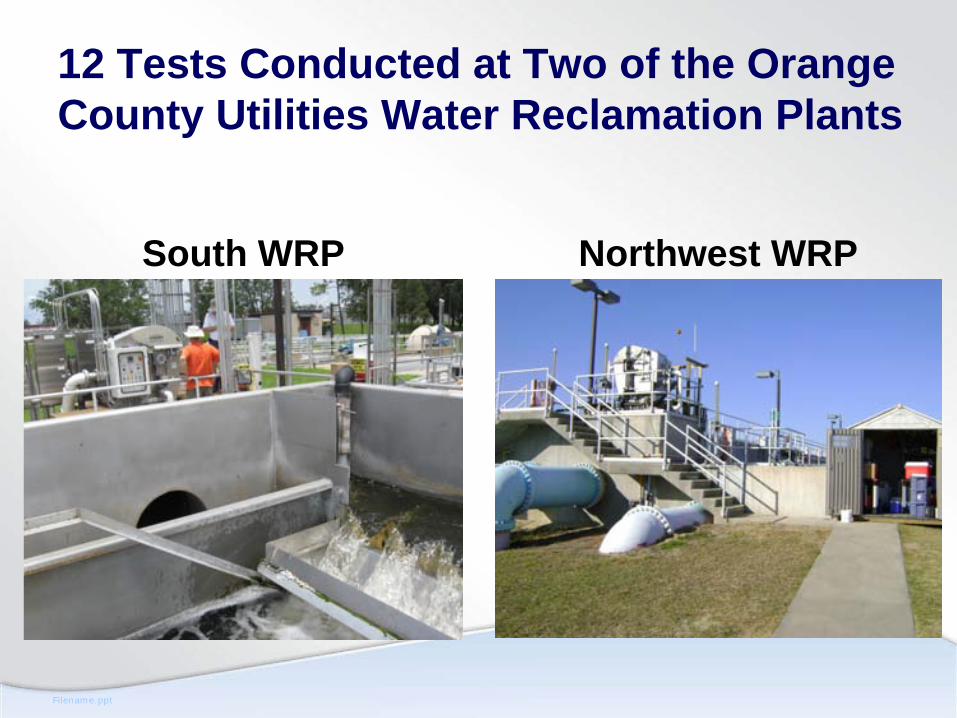
12 Tests Conducted at Two of the Orange County Utilities Water Reclamation Plants
South WRP Northwest WRP
Filename.ppt
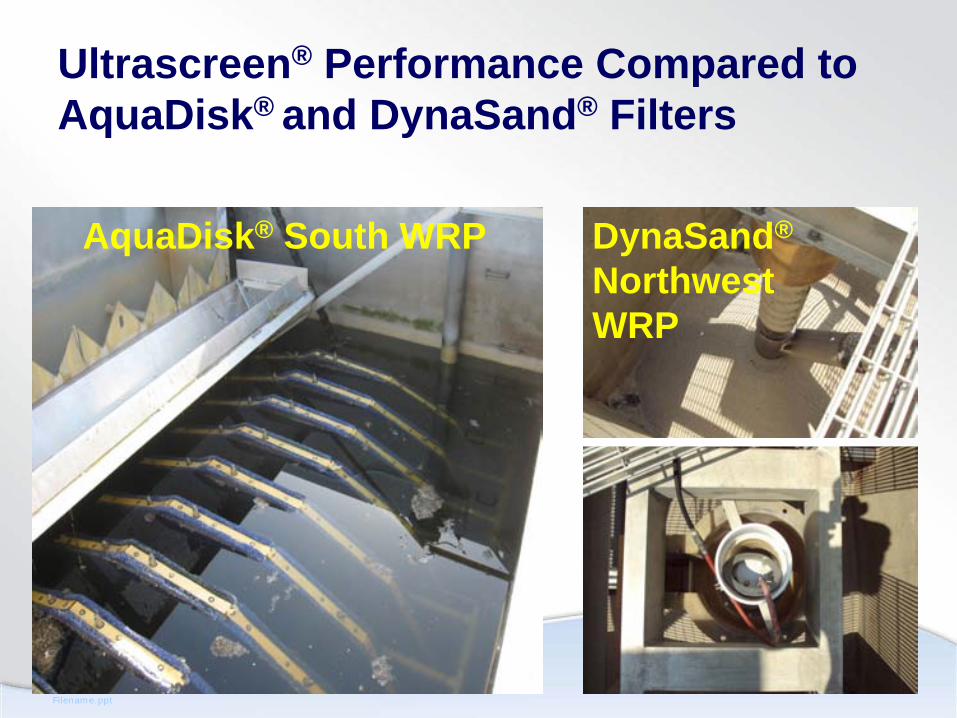
Ultrascreen® Performance Compared to AquaDisk® and DynaSand® Filters
AquaDisk® South WRP DynaSand®
Northwest WRP

Filename.ppt
Ultrascreen® Performance Compared to Existing Filters at Hydraulic Loading Rates of
6, 8, 12 &16 gpm/sf
Filename.ppt
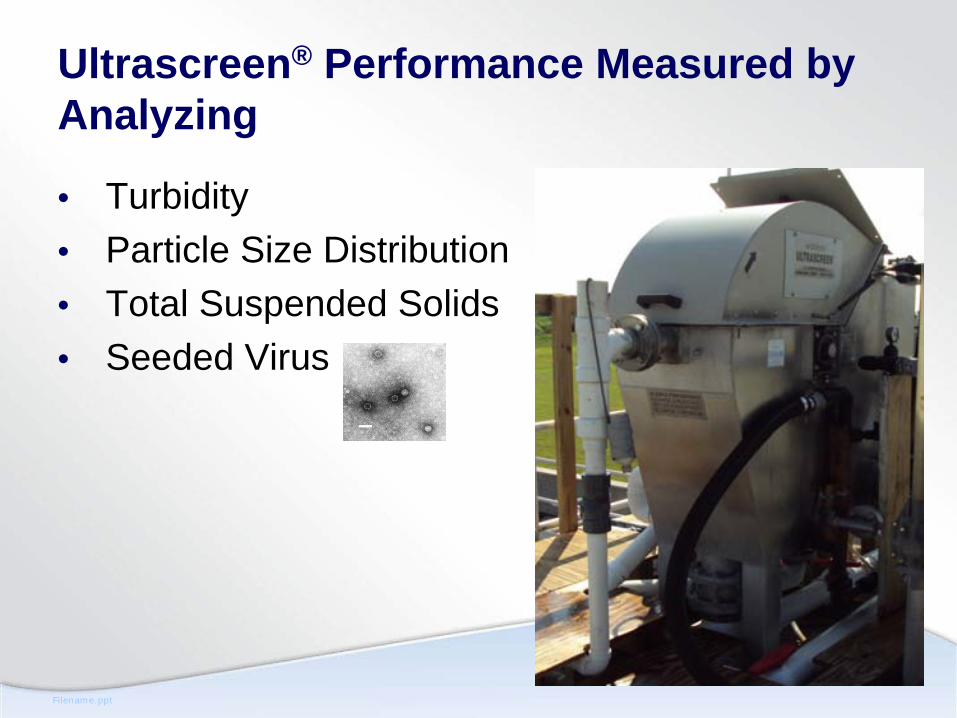
Ultrascreen® Performance Measured by Analyzing
• Turbidity• Particle Size Distribution• Total Suspended Solids• Seeded Virus
Filename.ppt
Ultrascreen®
Title 22 Performance Testing Results

Filename.ppt
Ultrascreen® Title 22 Performance Testing Results are Grouped as Follows
• Turbidity Performance• Particle Removal• Virus Spiking• Solids Spiking• Reject Water Generation
Filename.ppt
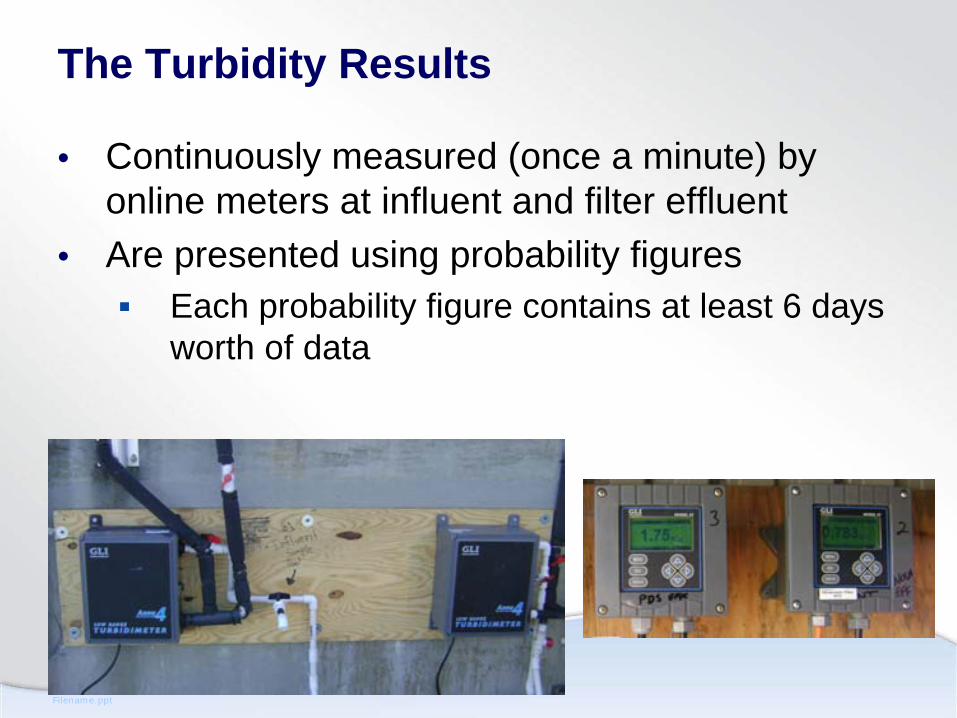
The Turbidity Results
• Continuously measured (once a minute) by online meters at influent and filter effluent
• Are presented using probability figures Each probability figure contains at least 6 days worth of data

Filename.ppt
>8 gpm/sf - Ultrascreen® Performed Equivalently to Full-Scale Filters Operating at Lower Loading Rates
AquaDisk® 1.89 gpm/sf, DynaSand® <2 gpm/sf
0
1
2
3
4
5
6
7
8
9
10
.001 .01 .1 1 5 10 20 30 50 70 80 90 95 99 99.9
99.9
9
99.9
99
Secondary EffluentNova Ultrascreen EffluentAquaDisk Effluent
Turb
idity
, NTU
Percent of values equal to or less than the indicated value
.001 .01 .1 1 5 10 20 30 50 70 80 90 95 99 99.9
99.9
9
99.9
99
Secondary EffluentNova Ultrascreen EffluentDynasand Effluent
Percent of values equal to or less than the indicated value
Turb
idity
, NTU
South WRF-2B Northwest WRF-2B
Percent of values equal to or less than the indicated value

Filename.ppt
>12 gpm/sf - Ultrascreen® Performed Equivalently to Full-Scale Filters Operating at Lower Loading Rates
AquaDisk® <3 gpm/sf, DynaSand® <2 gpm/sf
0
1
2
3
4
5
6
7
8
9
10
.001 .01 .1 1 5 10 20 30 50 70 80 90 95 99 99.9
99.9
9
99.9
99
Secondary EffluentNova Ultrascreen EffluentAquaDisk Effluent
Turb
idity
, NTU
Percent of values equal to or less than the indicated value
.001 .01 .1 1 5 10 20 30 50 70 80 90 95 99 99.9
99.9
9
99.9
99
Secondary EffluentNova Ultrascreen EffluentDynasand Effluent
Percent of values equal to or less than the indicated value
Turb
idity
, NTU South WRF-3A Northwest
WRF-3A
Percent of values equal to or less than the indicated value
Filename.ppt
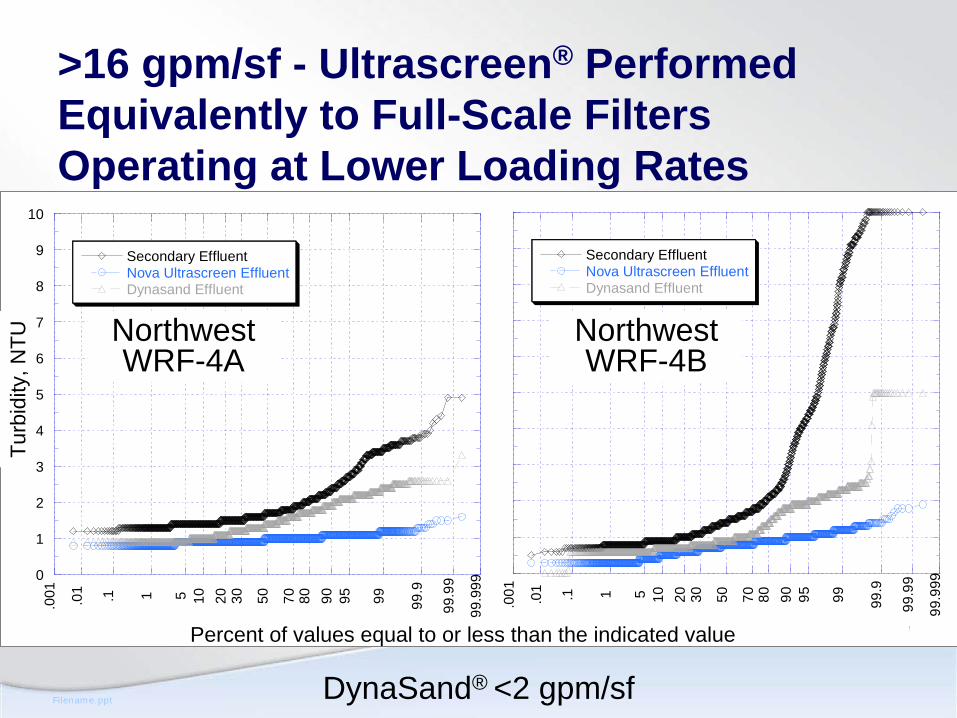
>16 gpm/sf - Ultrascreen® Performed Equivalently to Full-Scale Filters Operating at Lower Loading Rates
0
1
2
3
4
5
6
7
8
9
10
.001 .01 .1 1 5 10 20 30 50 70 80 90 95 99 99.9
99.9
9
99.9
99
Secondary EffluentNova Ultrascreen EffluentDynasand Effluent
Turb
idity
, NTU
Percent of values equal to or less than the indicated value
.001 .01 .1 1 5 10 20 30 50 70 80 90 95 99 99.9
99.9
9
99.9
99
Secondary EffluentNova Ultrascreen EffluentDynasand Effluent
Percent of values equal to or less than the indicated value
Turb
idity
, NTU
DynaSand® <2 gpm/sf
Northwest WRF-4A
Northwest WRF-4B
Percent of values equal to or less than the indicated value

Filename.ppt
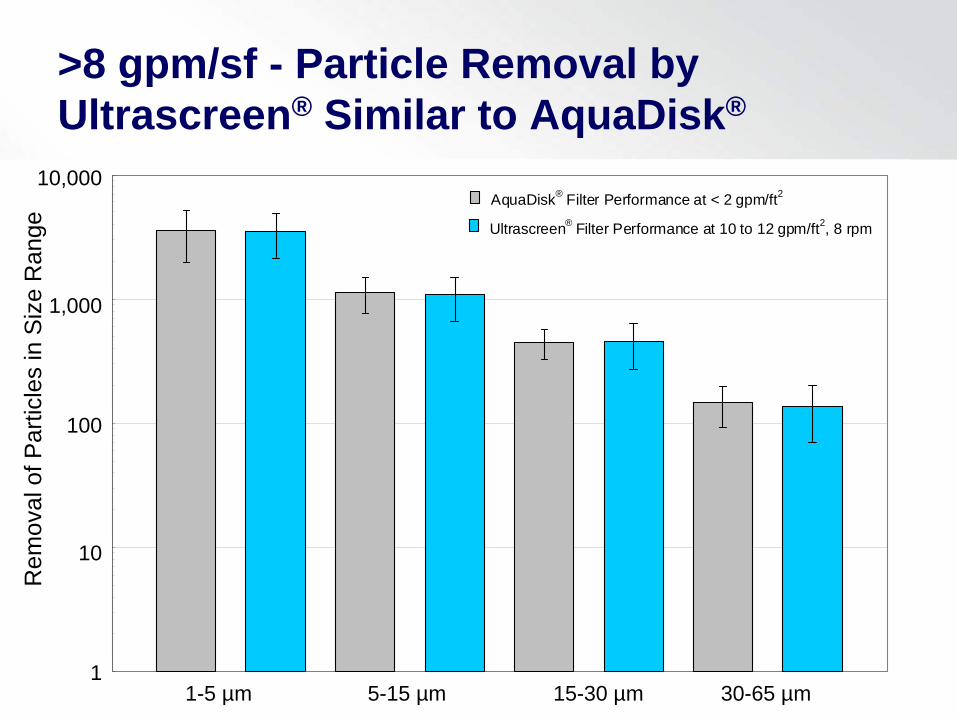
Particle Removal Performance
• Measured daily for the Ultrascreen® and full-scale filters
• Once a week multiple influent and effluent particle size distribution samples were collected
• Was calculated for each sample collection event, and average removals are presented in the following bar charts
Filename.ppt
>8 gpm/sf - Particle Removal by Ultrascreen® Similar to AquaDisk®
1
10
100
1,000
10,000
Rem
oval
of P
artic
les
With
in P
artic
le S
ize
Ran
ge
AquaDisk® Filter Performance at < 2 gpm/ft2
Ultrascreen® Filter Performance at 10 to 12 gpm/ft2, 8 rpm
1-5 0m Particles 5-15 0m Particles 15-30 0m Particles 30-65 0m Particles1-5 µm 5-15 µm 15-30 µm 30-65 µm
10,000
100
10
1
1,000
Rem
oval
of P
artic
les
in S
ize
Ran
ge

Filename.ppt
>8 gpm/sf - Large Particle Removal by Ultrascreen® Similar to DynaSand®
1-5 µm 5-15 µm 15-30 µm 30-65 µm
10,000
100
10
1
1,000
Rem
oval
of P
artic
les
in S
ize
Ran
ge
Filename.ppt
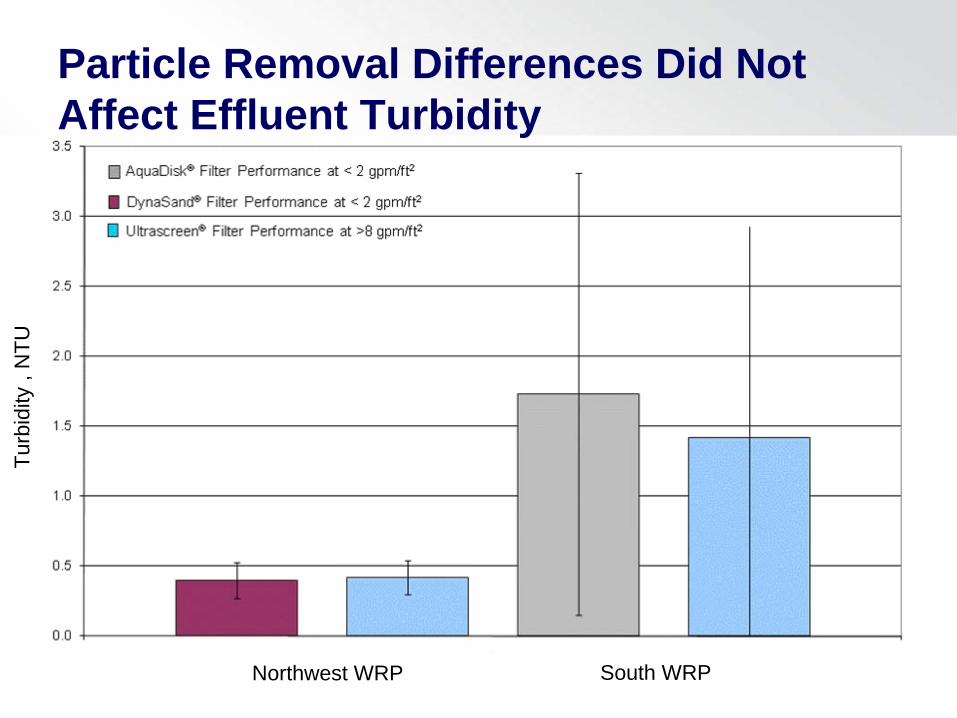
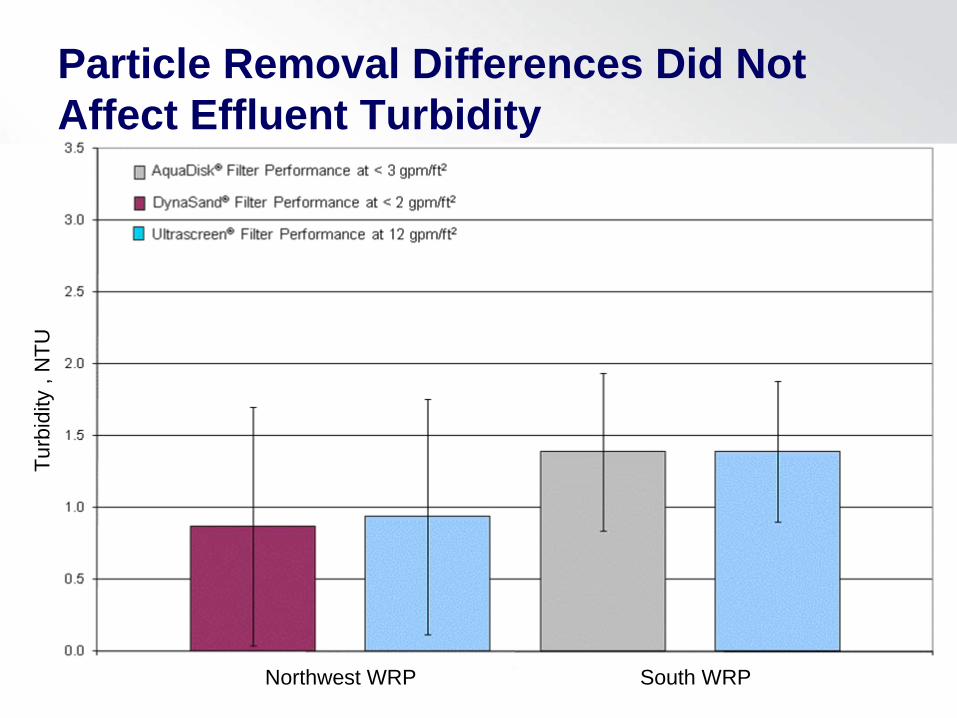
Turb
idity
, N
TU
Northwest WRP South WRP
Particle Removal Differences Did Not Affect Effluent Turbidity
Filename.ppt
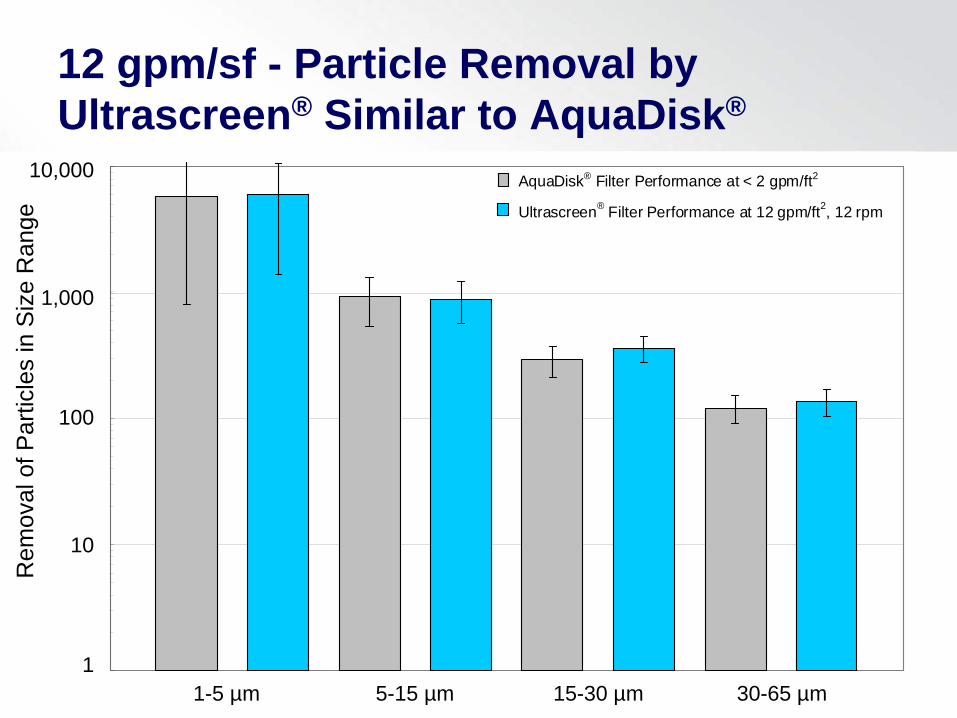
12 gpm/sf - Particle Removal by Ultrascreen® Similar to AquaDisk®
1
10
100
1,000
10,000
Rem
oval
of P
artic
les
With
in P
artic
le S
ize
Ran
ge
AquaDisk® Filter Performance at < 2 gpm/ft2
Ultrascreen® Filter Performance at 12 gpm/ft2, 12 rpm
1-5 ηm Particles 5-15 ηm Particles 15-30 ηm Particles 30-65 ηm Particles1-5 µm 5-15 µm 15-30 µm 30-65 µm
10,000
100
10
1
1,000
Rem
oval
of P
artic
les
in S
ize
Ran
ge
Filename.ppt
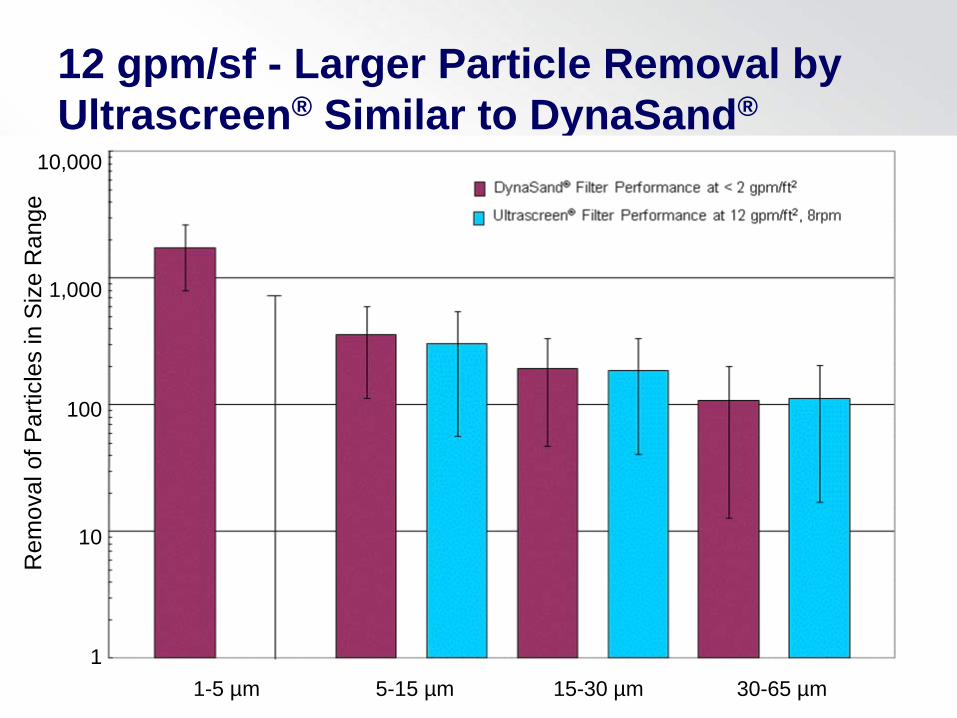
12 gpm/sf - Larger Particle Removal by Ultrascreen® Similar to DynaSand®
1-5 µm 5-15 µm 15-30 µm 30-65 µm
10,000
100
10
1
1,000
Rem
oval
of P
artic
les
in S
ize
Ran
ge
Filename.ppt
Turb
idity
, N
TU
Northwest WRP South WRP
Particle Removal Differences Did Not Affect Effluent Turbidity
Filename.ppt
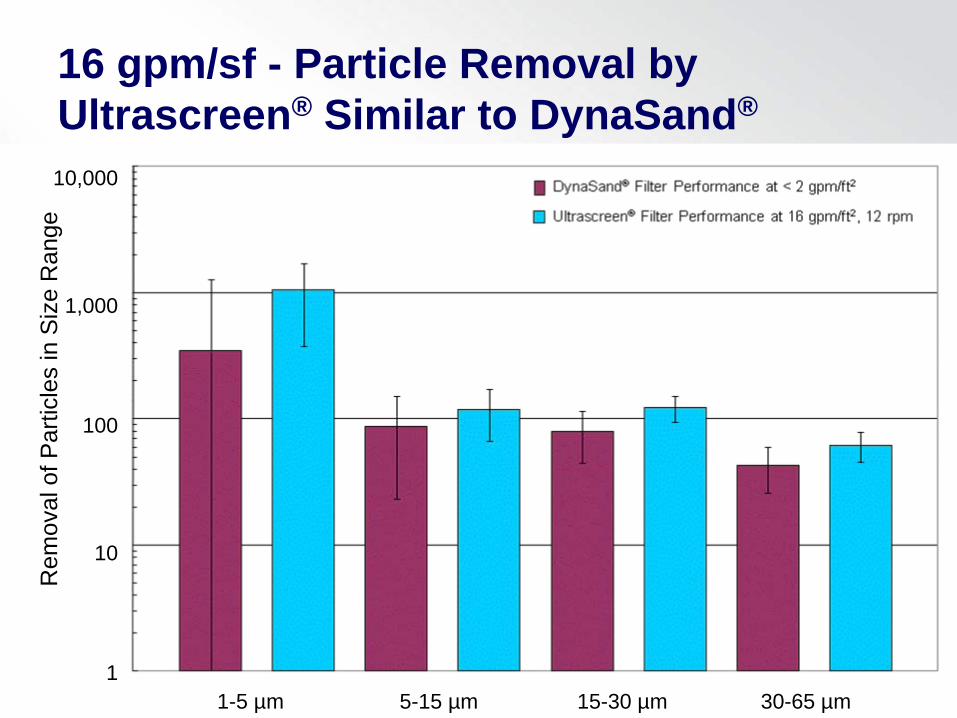
16 gpm/sf - Particle Removal by Ultrascreen® Similar to DynaSand®
1-5 µm 5-15 µm 15-30 µm 30-65 µm
10,000
100
10
1
1,000
Rem
oval
of P
artic
les
in S
ize
Ran
ge
Filename.ppt
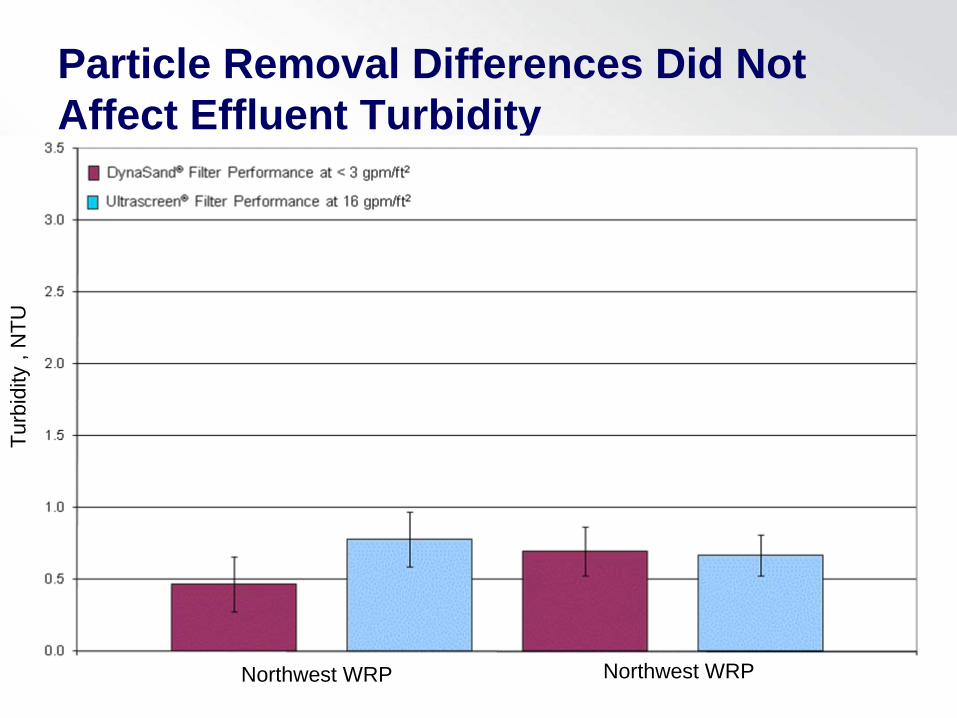
Particle Removal Differences Did Not Affect Effluent Turbidity
Turb
idity
, N
TU
Northwest WRP Northwest WRP

Filename.ppt
Ultrascreen® Virus Challenge Experiments
• MS2 bacteriophage seeded in the filter influent (>106 PFU/mL)
• Two tests were conducted at 6 gpm/sf
• Each test lasted approximately 1 hr
MS2 (25-35 nm)
Filename.ppt
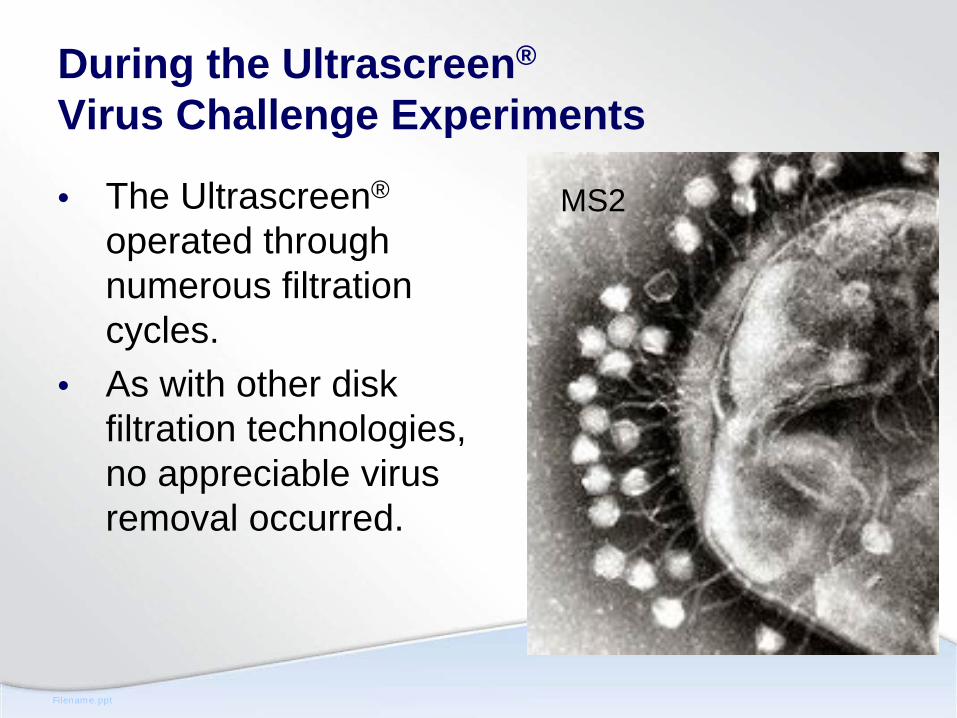
During the Ultrascreen®
Virus Challenge Experiments
• The Ultrascreen®
operated through numerous filtration cycles.
• As with other disk filtration technologies, no appreciable virus removal occurred.
MS2

Filename.ppt
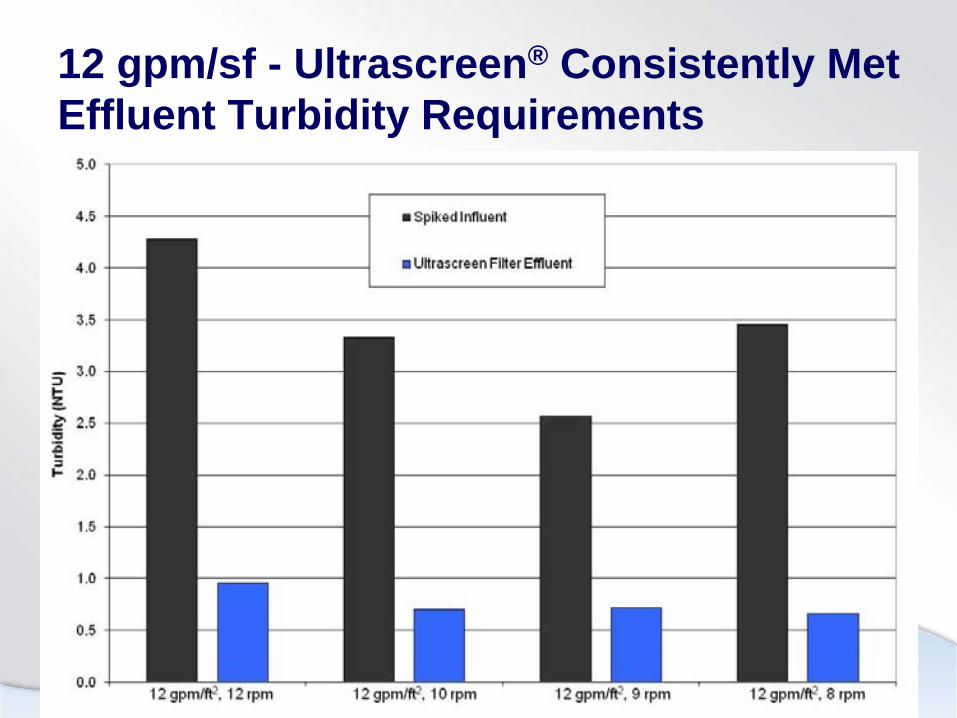
Solid Spiking Experiments
• Conducted three days of testing to document system performance at elevated influent solids levels
• Turbidity removal of grab samples are presented in the graphs found in the following slides

Filename.ppt
8 gpm/sf - Ultrascreen® Consistently Met Effluent Turbidity Requirements
Filename.ppt
12 gpm/sf - Ultrascreen® Consistently Met Effluent Turbidity Requirements

Filename.ppt
16 gpm/sf - Ultrascreen® Consistently Met Effluent Turbidity Requirements

Filename.ppt
Comparison of Ultrascreen® Reject Water Generation Rate
Filter Technology Reject Rate%
AquaDisk® <6.0
DynaSand® 12.6-22.0
Ultrascreen® 0.5-1.65

Filename.ppt
Ultrascreen® Performance Summary

Filename.ppt
The Ultrascreen® Filter :
• Consistently met the Title 22 turbidity limit of 2 NTU for flux values ranging from 6 to 16 gpm/sf
• Removed particles similarly to the full-scale filters, where different the effluent turbidity was not affected
• Satisfied Title 22 effluent turbidity limits during solid spiking experiments
Filename.ppt
Ultrascreen® Approval Status
Filename.ppt
Conditional Acceptance Granted for the Ultrascreen with the Following Provisions
• <6 gpm/sf-can be used with a disinfection process capable of 4-log virus inactivation
(i.e., chlorine)• >6 to <16 gpm/sf-must be used with
a disinfection process capable of 5- log virus inactivation
(i.e., UV, pasteurization, or ozone)
Filename.ppt
Acknowledgements
• Nova Water Technologies• Orange County Utilities
William Hurley, P.E.Shane Beener, P.E.Operations staff of South WRF and Northwest WRF
• South Tahoe Public Utility District• Carollo Employees
Jennifer Stokke and Sean PoustNicola Fontaine, Elise Moore, and Jennifer Warren