Embed Size (px)
Citation preview
WINDTESTKaiser-Wilhelm-Koog GmbH EOW 2007 Berlin Slide No. 1
VALIDATION OF WIND SPEED DISTURBANCES TO CUPS AT THE METEORLOCICAL MAST ON THE OFFSHORE PLATFORM FINO1 USING WIND-LIDAR MEASUREMENTSAuthors:
Detlef KindlerWINDTEST K.-W.-Koog GmbH
Andy OldroydOldbaum Services Ltd.
DOWNVInD EU-Project
FINO BMU-Project
Title

WINDTESTKaiser-Wilhelm-Koog GmbH EOW 2007 Berlin Slide No. 2
• MotivationUndisturbed wind measurements offshore
• North Sea research platforms FINO-1 & -3
• Assessment of a wind LiDAR system offshore on FINO-1
• Investigation of the distorted wind flow by the met. mast structure on the FINO-1 platform
using a wind LiDAR
• Application to future measurements on FINO-3
Outline

WINDTESTKaiser-Wilhelm-Koog GmbH EOW 2007 Berlin Slide No. 3
• Wind speed measurements offshore masts wind statistic, speed and directionwind speed profileenergy yield analysis
• High quality data at all heightsfor all wind directions
• Attention:wind flow distortion by mast structure itself (in certain wind directions)
Motivation

WINDTESTKaiser-Wilhelm-Koog GmbH EOW 2007 Berlin Slide No. 4
FINO 3 (2008)
FINO 1 (2003)
& Alpha VentusGerman offshore
test site (2008)
FINO Research Platforms

WINDTESTKaiser-Wilhelm-Koog GmbH EOW 2007 Berlin Slide No. 5
SKN=NW
-28m SKN
-58m SKN
+20,5m SKN
+103 SKN
Layout FINO 1 vs. FINO 3
FINO 1
+ 20,5 m
+ 103 m
- 28 m
SKN
-23 m
-50 m
+22 m+26 m
+4.6 m
+105 m
FINO 3
+ 21,5 m
+ 105 m
- 23 m

WINDTESTKaiser-Wilhelm-Koog GmbH EOW 2007 Berlin Slide No. 6
Main Deck
3
4
5
6
6 a
C
B
DContainer2
1Pile
WS
T, P, F, N, S, dT
T, F
WS, WD
WS
WS, WD
WS
7
8
9
10
10 a
Top
A
11 WS
WS
WS
WS, WD
WS, WD
T, P, F, N, dT
Measurement Levels

WINDTESTKaiser-Wilhelm-Koog GmbH EOW 2007 Berlin Slide No. 7
Hauptdeck
3
4
5
6
6 a
C
B
DContainer2
1Pfahl
7
8
9
10
10 a
Top
A
11
WS Cup 1 Hz
WD Vane 1Hz
WS/WD SONIC 10 Hz
Wind Sensors

WINDTESTKaiser-Wilhelm-Koog GmbH EOW 2007 Berlin Slide No. 8
FINO-1 Wind Flow Distortion
Square Mast Base
B
N
S
EW
075°
015°
255° 105°
165°195°
285°
345°
cup onmast top
030°
240°
cup onboom 60m
A
B
A
A
A
B
Disturbed Sectors
B
A
A

WINDTESTKaiser-Wilhelm-Koog GmbH EOW 2007 Berlin Slide No. 9
FINO-1 Wind LiDAR Assessment
Level 1
103 m
81 m
61 m
ComparisonComparisontop level & 2 boom levelstop level & 2 boom levels
Cups, disturbedCups, disturbed
LiDAR, undisturbedLiDAR, undisturbed Level 2
Level3

WINDTESTKaiser-Wilhelm-Koog GmbH EOW 2007 Berlin Slide No. 10
Height:103 (78) m
WS range:
2 to 23 m/s
Slope:m = 0.97
Regr. coefficient:
R2 = 0.99
WS Regression 103 m (Top)
Cup
LiD
AR
Undisturbed top sectors

WINDTESTKaiser-Wilhelm-Koog GmbH EOW 2007 Berlin Slide No. 11
Analysis Sector 15°-75°, 105°-165°, 195°-255°, 295°-345°
103 (78) m 81 (56) m 61 (36) m10-min-avg. values 1965 / / Slope "m" 0.97 / / Regr. Coeff "R2" 0.99 / /
103 (78) m 81 (56) m 61 (36) m10-min-avg. values 6005 2589 2749Slope "m" 0.98 0,97 0,98Regr. Coeff "R2" 0.99 0.99 1,00
30° to 90° and 180° to 240°
1st Period, 4 weeks
2nd Period, 14 weeks
Regression Results
WINDTESTKaiser-Wilhelm-Koog GmbH EOW 2007 Berlin Slide No. 12
Correction Procedure
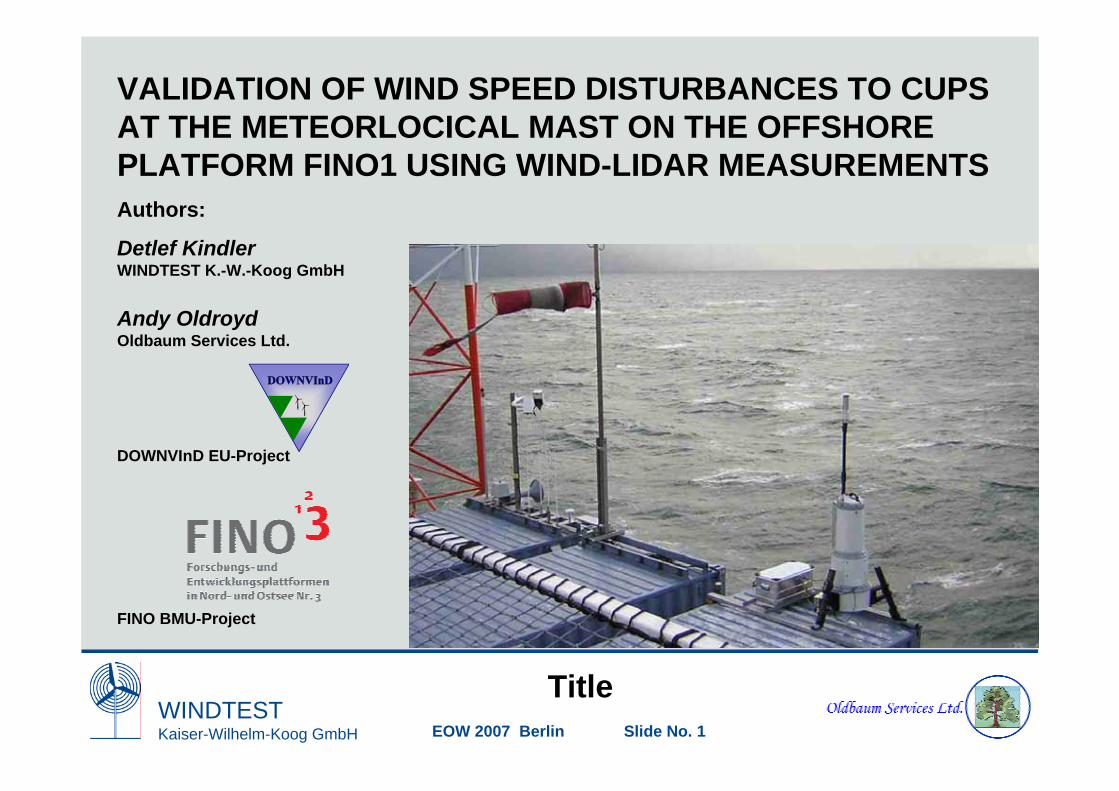
• Use regression results from undisturbed sectorsto correct LiDAR wind speeds
• Use corrected LiDAR wind speeds as undisturbedequivalent of cup wind speeds for all wind directions,i.e. as well in disturbed sectors
• Derive correction factors in WD ranges, i.e. as well in disturbed sectors
…to be applied to the full time series
WINDTESTKaiser-Wilhelm-Koog GmbH EOW 2007 Berlin Slide No. 13
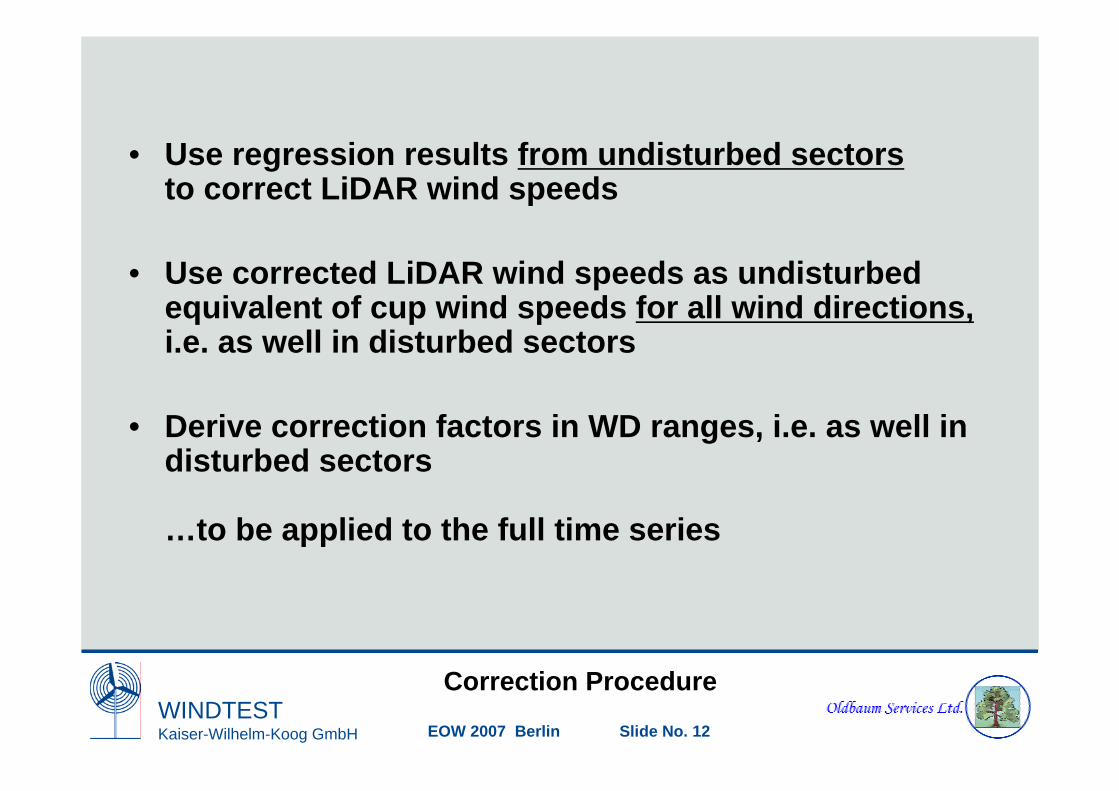
Top WS corrections 103 m

WINDTESTKaiser-Wilhelm-Koog GmbH EOW 2007 Berlin Slide No. 14
Boom WS Corrections 81 m

WINDTESTKaiser-Wilhelm-Koog GmbH EOW 2007 Berlin Slide No. 15
FINO 1: Square Base
Main Wind Dire
ction SW
Met Mast Base
FINO 3: Triangular Base

WINDTESTKaiser-Wilhelm-Koog GmbH EOW 2007 Berlin Slide No. 16
N
S
EW
Main Wind Direction SW
Mess-mast
Main Deck
Heli Deck
Mess-mast
FINO 3 – Mast & Boom Orientation

WINDTESTKaiser-Wilhelm-Koog GmbH EOW 2007 Berlin Slide No. 17
Pure Wind Speed Level
70 m - Level 7
Cup
Cup
Cup
N
S
EW

WINDTESTKaiser-Wilhelm-Koog GmbH EOW 2007 Berlin Slide No. 18
Summary
• Cup vs. LiDAR comparison campaign on FINO1 LiDAR proved high quality and good availabilityallowed an analysis of mast disturbance effects
• Heavy disturbances of wind flow from mast structureneed pre-cautions
- slim mast structure- triangular mast shape three boom directions- sufficient boom length
• Consequences for FINO3triangular shaped, slim met. mast layoutfinal boom layout still to be defined
• Outlook:LiDAR as stand alone offshore wind monitoring tool
on smaller support structures (maybe floating…)on existing offshore structures …
… e.g. like oil & gas platforms… research project

WINDTESTKaiser-Wilhelm-Koog GmbH EOW 2007 Berlin Slide No. 19
The End
Thanks


![SCISCITATOR 2015 · [1]. Riverine communities experience two main types of disturbances: natural disturbances and anthropogenic disturbances. Natural disturbances in riverine ecosystems](https://img.dokumen.tips/doc/110x75/5f27dd3959f0c41da22eeec5/sciscitator-1-riverine-communities-experience-two-main-types-of-disturbances.jpg)