Embed Size (px)
Citation preview

Article Designation: Refereed JTATM Volume 4, Issue 1,Summer 2004
1
Volume 4, Issue 1, Summer 2004
VALIDATION OF ‘FEMALE FIGURE IDENTIFICATION TECHNIQUE
(FFIT) FOR APPAREL’ SOFTWARE
Priya Devarajan Graduate Student, Department of Textile and Apparel Technology and Management
North Carolina State University Dr. Cynthia L. Istook
Associate Professor, Department of Textile and Apparel Technology and Management North Carolina State University
ABSTRACT
The software “Female Figure Identification Technique (FFIT) for Apparel’ was developed at North Carolina State University, College of Textiles as a starting point to classify females based on their body shapes. The nine body shapes identified in the software could be used effectively to implement mass customization strategies in the apparel retail industry. In addition the shapes could be used in developing new sizing standards for the apparel industry. The software was built using a convenience sample of 253 female subjects primarily from the state of North Carolina. This study was developed to validate the software using a larger population. Multivariate statistical methods of discriminant analysis and Multivariate Analysis of Variance (MANOVA) were used for the validation process. The percentage accuracy of the FFIT for Apparel© software was found to be around 90% and was better than the discriminant function developed from the training sample used to build the software. During the validation process, the scans were visually analyzed and many interesting details throwing light on the influence of body scan data on shape analysis were found.
Keywords: Female Figure Identification Technique (FFIT) for Apparel, Body shape studies, Apparel sizing
Introduction The emergence of sophisticated 3-dimensional body measurement technologies and apparel CAD systems has allowed major apparel retailers to use “made-to-measure” apparel as a viable marketing tool. To successfully implement mass customization strategies in the apparel industry, it is necessary to have 1) a sophisticated body measurement technology, 2) an integration tool that allows the body measurements to be analyzed and directed into
CAD systems and, 3) a standard set of patterns that can be altered according to the customer’s body shape determined from their body scan data. Developing these standard patterns could be based on the body shapes found in the population, since research studies have shown that pattern alteration points and processes often differ for people with different body shapes. Hence it is necessary to identify the standard body shapes representative of the current population since the process of generating customized patterns from 3-D body scan data

Article Designation: Refereed JTATM Volume 4, Issue 1,Summer 2004
2
will be greatly facilitated if the body shapes of the subjects are known.
Though much research is going on in the area of integrating the body-scan and apparel CAD technologies, very little attention has focused on identifying the standard body shapes in the population. Some software has been developed that calculates somatotype variables and attempts to sort human bodies, but it considers the body as a two-dimensional entity, while in reality the human body is three-dimensional (Simmons, 2002). Three-dimensional body measurement technology is a useful tool that could effectively and accurately analyze the human body and its shape proportions. Presently, the ‘Female Figure Identification Technique (FFIT) for Apparel©’ software is the only software developed that differentiates the female population according to their body shapes using 3-D body-scan data. FFIT for Apparel©, developed by experienced research scholars who have worked in the area of apparel construction and fit for more than 30 years, has significant potential for the apparel industry. The software was developed from a convenience sample of 256 subjects in North Carolina. In order to demonstrate the generalization of the FFIT software©, it was important to determine the extent to which it could effectively define body shapes for a nationally representative large sample. The software was in its developmental stage and validation was essential to make it of value for commercial use in sorting women based on their body shapes.
The Need for New Sizing Standards
The inadequacy of the current apparel sizing systems and the resulting problems associated with the fit of ready-to-wear apparel has gained significant importance in the last decade. The garment size for an individual differs from one brand of apparel to another. This is particularly seen in women’s clothing where female consumers have to try on each and every garment before buying them. According to a study by Kurt Salmon Associates (“The fit problem,” n.d.), 62% of people are not satisfied with the fit of their apparel. In the current
situation, where customer satisfaction is the top priority, it is imperative to come up with a solution for these issues.
Current Standards
The sizing standards used in the United States were developed based on a 1941 study by Ruth O’Brien and William Sheldon. This study was comprised of 10,042 women volunteers with more than 98% white women. The study reported that the volunteers were mostly young women since older women were reluctant to participate (O’Brien & Sheldon, 1941). The current Misses sizing standard, ASTM D-5585 (American Society of Testing & Materials, 1995a) was derived from the PS 42-70 (U.S. Department of Commerce, 1970) database, developed in 1970, which originated from the 1941 study. Thus, it is biased with respect to ethnicity and age. In addition, the current demographics of the US population are completely different from the generations before (Istook, Simmons & Devarajan, 2002). The body shapes and sizes have continuously changed due to the changing life style, nutrition, sports and other activities of people (LePechoux, 1998). A recent study conducted using the FFIT© software developed at NC State University, College of Textiles, demonstrated that the current standards for body type classification were insufficient to meet the needs of current customers (Simmons, 2002). The study ran the body measurements of the most recent sizing standard (ASTM 5585-Missy) using the FFIT© software and found that the standard measurements fell into the ‘Spoon’ category. The study also found that the closest sizing standard for a subject in the age group of 18-30 (conducted on a convenience sample of 222 subjects) was the CS215-58 sizing standard which was developed in 1958 and is now completely obsolete. This shows that the current Missy sizing standard is not meeting the needs of the current customer. Thus, because of its outdated foundation, the ASTM standard is not able to fulfill the needs of the current population of the US. In addition to this, the apparel manufacturers have their own sizing systems based on their target markets (Simmons, 2001). Since they consider their sizing systems as an important commercial marketing tool, they are

Article Designation: Refereed JTATM Volume 4, Issue 1,Summer 2004
3
not willing to disclose their sizing systems (Le Pechoux, 1998) and are reluctant to accept a common sizing system, which might have the potential to provide consumers a standard size in all brands.
Perception of Fit
The perception of fit differs from one individual to another. Research studies show that people seek different benefits from their clothing. Anderson et. al (2001) reported that some of the benefits sought by women when purchasing clothing included fashion image, figure flaw compensation, sex appeal, clothing preference, and fashion innovativeness. Age, geographical location, body shape, fashion and culture play an important role in people’s preferences of fit. In the United States, young women are more fashion conscious and prefer clothing that fits them, whereas mature women give priority to comfort of the apparel over fashion image. Also, women who are comfortable with their body shapes are more likely to wear form fitting apparel, whereas women dissatisfied with their body shapes may not prefer close fitting garments. Therefore, in addition to body measurements as a basis for apparel sizing, manufacturers and retailers must understand consumer’s perceptions of physical comfort, psychological comfort, and appearance, which all impact the consumer decision process (Anderson et. al, 2001). All the above problems indicate a strong need for a new sizing system that will reflect the body types of the current population.
Body Shape Studies
The study of human body types is called ‘Somatotyping’. Even though William Sheldon introduced the word ‘Somatotype’ in his book Varieties of Human Physique in 1970, the study of human body and the different types associated with it have been of great interest for the past two centuries. Most of the earlier work was done on the relationship between the morphology and the psychology of a person. Comas (1960), in his book Manual of Physical Anthropology, refers to the science of ‘Biotypology’, which is the study of physiology and its relationship with
the psychology of an individual. Body type research in relation to apparel was done in the later part of the 20th century, with major contributions from Dr. Helen Douty (1977) of Auburn University. She developed a method called ‘visual somatometry’ which was aimed to improve the fit of custom-made apparel. Her work also was directed towards the awareness of the relationship between body weight and fitness and various conditions of heart abnormalities.
Other than the work of Helen Douty, no previous research has been conducted that classified body types in relation to clothing or apparel. Although some of them used a combination of girth and length measurements, most of the work was done by psychiatrists who were interested in exploring the relationship between a person’s physiology and psychology. There has been a distinct similarity in the way the researchers looked at body types – linear or lateral, or a combination of the two. Even though Douty devised a method for custom fitting of apparel, her work also looked at body as a two-dimensional contour.
Application of Body Shape Studies in Apparel
Heisey, Brown and Johnson (1986) used
a graphical somatometry method and developed a mathematical framework for pattern alterations. Their method was effective for the lower half of the bodice and the darted legs of the skirt and pants, and not entirely satisfactory for any area in which the garment curves in more than one direction.
Another research study that used hip
shapes was that of Farrell-Beck and Pouliot (1983). They developed an experimental method to alter pant patterns using graphic somatometry techniques. In their research, they used five figure variations namely round hip, pear-shaped hip, average hip, weight in front and weight in back.
Gazzuolo et. al (1992) used statistical regression models to compare the traditional linear measurements with the measurements taken of frontal and lateral view photographs for use in the development of patterns for the upper torso of female body forms. The research

Article Designation: Refereed JTATM Volume 4, Issue 1,Summer 2004
4
suggested the photographic method of measurement extraction using a video capture and automated measuring of silhouette angles as a rapid low-cost methodology of anthropometric data collection for garment pattern development (Gazzuolo et al., 1992).
Researchers at Auburn University developed the NTC Women’s Body Shape Analysis Tool (WBSAT) which used hourglass shape as a launching point for understanding body shapes and identified three other shapes – rectangle, pear and inverted triangle (Connell, 2002). Body build, hip shape, shoulder slope, front torso shape, buttocks shape, back curvature, and posture were identified as body components important in apparel sizing.
Figure Type Classification in the Apparel Industry
People with ideal figure types have
always been used by the apparel industry so that technicians could obtain dimensions for pattern making and fitting, designers could create their new designs, and manufacturers could use their bodies for showing their garments (Armstrong, 1987). Orzechowski & Froney (as cited in Workman & Lentz, 2000) stated that the sources from which apparel manufacturers access body dimension for their prototype or ideal figures are professional fit models, government statistics, surveys and databases compiled by private, non-profit organizations, industry dress forms, competitors’ apparel and a company’s target customers. However, these ideal figure types vary vastly among different manufacturers, which cause consumer dissatisfaction.
The pattern industry established its
figure types and standards to meet the needs of consumers (Armstrong, 1987). Patterns were sized using the bust as the single control dimension (Salusso-Deonier, 1982). The figure types include Young Junior / Teen, Junior Petite, Junior, Miss Petite, Miss, Half-size and Woman (Armstrong, 1987). Even though there are standards established, department stores and other branded apparel manufacturers use their own figure types targeting their consumers,
since these standards do not meet the requirements of the current population.
Even though industries like fashion, fitness and apparel retail defined body types for different purposes; their body type classifications are similar. They used alphabets (H, O, A, X, R, I, S), geometric shapes (Rectangular, Oval, Triangle), names of fruits (Apple, Pear) and other distinctly shaped things (Hourglass, Bean, Heart) to classify body types (Simmons, 2001). Application of Body Shape Studies In Other Industries
Body shape analysis has been
undertaken in various fields for different purposes. The automobile, aerospace, and furniture industries have been conducting considerable research on the shapes of bodies, repetitive motion of human body parts, and postures of people to design their equipment, which are ultimately operated by humans. The study of body shapes for use in equipment design was first undertaken by the military during the world war when developing fighter jets and other equipment, which evolved into the science of ergonomics. Since then, this study has gained significant importance for various reasons, such as human productivity, work physiology, quality of working life, safer and healthier work environment, and cost effectiveness, and is largely applied in space systems, consumer products, industrial and office settings and computer systems (“Ergonomics: The Science For Better Living and Working,” n.d.). Since the data collected for developing military equipment were mainly from the military population, there was a need for the collection of information on the civilian population for which office setup, computer systems and other consumer products could be designed.
Numerous studies on body posture and
loads on the spine during sitting were conducted in ergonomics to identify the comfortable positions of chairs and office furniture. Studies on pelvic and lumbar bones, trunk, posture and back muscles were done to analyze the activity

Article Designation: Refereed JTATM Volume 4, Issue 1,Summer 2004
5
of these while sitting. Discomfort, pain, disease and other impairments in the human body raised the issues of the design of seats in offices, vehicles, and other industrial settings. To reduce uncomfortable, painful and potentially harmful loads on body structures, especially the spinal cord and the back muscles, the heights and angles of tables and chairs were analyzed. Further, customized workplace design came to be used in the furniture industry where computer programs were used to customize workplace design for each individual by feeding anthropometric information of overall height, body weight, shoulder to shoulder width, biceps circumference, forearm length, hand length, buttock-knee length, calf girth, foot length and other measurements (Abdel-Moty & Khalil, 1985).
German apparel industry researchers
studied the postural and work-envelope problems of apparel sewing. A study by John Wick and Colin G. Drury (1985) developed workstation design changes in order to improve the working posture of the operator. Research work related to sewing postures included the postures of the trunk, neck/head, upper extremities and lower extremities. It was found that due to the poor posture of the trunk and upper extremities, sewing workers experience the problem of cumulative trauma diseases and other symptoms like low back pain, cervical spine injuries, etc.
Studies using body scan data to design car seats were undertaken with the construction of a model representing human body forms using body scan data. While the body scans represent the shape and dimensions of an individual, a study conducted by the professors of the Department of Human Sciences, Loughborough University of Technology was aimed to synthesize a model from a combination of scan data for shape and data from anthropometric surveys for dimensionality (Case, Xiao & Porter, 1995).
The ‘Computerized Anthropometric Research & Design Laboratory (CARD), a division of Human Interface Technology of Crew System Interface Division of the Air Force has developed a software named INTEGRATE
to analyze fit issues on protective equipment. Another interface, ‘3-D human surface imaging’ of the lab analyses the design and evaluation process of equipment and clothing for government and civilian projects using the head and whole body. The CARD lab proposed to use the data from the whole body scanner to improve the fit of uniforms, anti-G suits, and other equipment, redesign the layout of aircraft cockpits and crew stations and "Flesh out" human body models used in aircraft design (“Computerized Anthropometric Research & Design Laboratory (CARD),” n.d.). The lab also conducted cockpit evaluations using test methods that evaluated subjects of small and large sizes in aircraft crew stations for reach to controls, body clearance and mobility and developed ‘cockpit maps’ which would give the maximum and minimum body sizes that could safely operate the aircraft. The lab conducts fit testing using scanners and tests the fit of equipment for humans – for example, protective helmets for use by a soldier. Technology of Non-Contact Measurement
The apprehension of people to being
measured using a tape measure and calipers that invade their privacy, along with their inclination towards form-fitting garments has led to the development of non-contact body measurement technologies. The emergence of 3-dimensional body scanning has instigated a new way of apparel retailing. Once a person’s body is captured using a body scanner, it could be retrieved and any part of his/her body could be measured any number of times without actual contact with the measured person. Sizing Surveys Using 3d Body Scanners
Lands End
In 2000, Lands’ End sponsored the world’s first body scanning truck “My Virtual Model Tour 2000”. [TC] 2’s body scanners were used to collect measurements from which virtual models were constructed. Clothes could be tried on the virtual model and the size of an individual could be identified to promote Lands’ End’s products (Simmons, 2001).

Article Designation: Refereed JTATM Volume 4, Issue 1,Summer 2004
6
CAESAR
In 1997, the Civilian American and European Surface Anthropometry Resource (CAESAR) project, a comprehensive research study, was conducted to gather information about human body measurements of the current population in the United States and Europe (Netherlands and Italy). The project used a whole body scanner to gather information that could be used for designing “better and more cost effective products” in any industry (“CAESAR: 3D anthropometric database”, n.d.) and was funded by representatives from apparel, aerospace, automotive and other industries. It was a combined effort of the government and industry to collect consumer body measurements for comparison and the outcome was a database developed from nearly 4500 samples of body measurement data collected from the U.S. and European (Netherlands and Italy) civilians. The survey was completed in 2001 and the 3D scan data along with 99 measurements (40 of which were taken using traditional methods with tape measures) and demographic characteristics of the sample were distributed to the partners. The data collected from this study was used for different applications including workstation design, driver/operator control centers, and even to study the aging of people.
SizeUK
The national sizing survey of the United Kingdom began in 2000 and was completed in 2001 with 11,000 subjects from all over the United Kingdom scanned using 3D whole body scanners that extracted 130 body measurements. The survey was a collaborative effort between the UK government, major UK apparel retailers, and leading academics and technology companies (Treleaven, n.d.). The aim of the survey was to develop sizing standards that represent the population of the UK.
SizeUSA
The aim of the national sizing survey, funded by the U.S. Department of Commerce and industry partners conducted in the US between July 2002 to July 2003 was to gather
“accurate and statistically significant U.S. population size and shape data” (“The national sizing survey,” 2003) that could benefit the apparel, automotive, aerospace, commercial airlines, furniture, ergonomics and health care industries. Data were collected from 12,000 subjects from all over the United States and representing six age groups ranging from 18-66+, four ethnic groups - Non-Hispanic white, Non-Hispanic black, Asian and Mexican Hispanic and Non-Mexican Hispanic and four weight categories ‘Quite overweight’, ‘Little overweight’, ‘Underweight’, and ‘Right weight’. Female Figure Identification Technique (FFIT) For Apparel
The software ‘Female Figure Identification
Technique (FFIT) for Apparel©’ was developed as a starting point for the representation of female figure shapes in a mathematical way (Simmons, 2002). The software was developed as a part of a doctoral dissertation, which aimed at creating “a methodology for characterization of body types/forms that would more appropriately replicate the diverse shapes of the American population (Simmons, 2002). The aim of the research was “to utilize software that can take 3D data and “sort” it into congruous and related shape categories (body or shape sort) based on measurements, proportion, and shape” (Simmons, 2002, p.3). The study resulted in development of preliminary subgroups for the female population that may aid in better fit of clothing after careful review of all previous studies done on somatotyping, body types (no study was conducted before FFIT for Apparel© using 3D body scan data) and by the expert knowledge of researchers who worked in the apparel field for more than thirty years. Six body measurements taken from the body scan data of women were used to predict the body shapes of women.
Nine Shapes Identified By The Software
The software classified the subjects into nine different body shapes. A description of the shapes and their distinction from the other shapes were as follows:

Article Designation: Refereed JTATM Volume 4, Issue 1,Summer 2004
7
Hourglass. A subject would fall into this shape category when there is a very small difference in the comparison of the circumferences of her bust and hips AND if the ratios of her bust-to-waist and hips-to-waist are about equal and significant (Simmons, 2002).
Bottom hourglass. A subject would fall into
this shape category if she has a larger hip circumference than bust circumference AND if the ratios of her bust-to-waist and hips-to-waist are significant enough to produce a definite waistline (Simmons, 2002).
Top hourglass. When a subject has a larger
bust circumference than hip circumference AND if the ratios of her bust-to-waist and hips-to-waist measures are significant enough to produce a definite waistline, then she would be classified into the top hourglass shape (Simmons, 2002). This subject would appear to be heavy in the bust as compared to the hips but still would have a defined waistline.
Spoon. This shape is based on the criteria
that if a subject had a larger circumferential difference in her hips and bust AND if her bust-to-waist ratio is lower than the Hourglass shape AND the high hip-to-waist ratio is great, then her shape would be spoon (Simmons, 2002).
Rectangle. A rectangular subject would have
her bust and hip measure fairly equal AND her bust-to-waist and hip-to-waist ratios low. She would not possess a clearly discernible waistline (Simmons, 2002).
Diamond. If the average of the subject’s
stomach, waist, and abdomen measures is more than her bust measure, then she would fall into the shape category of Diamond (Simmons, 2002). Several large rolls of flesh in the midsection of the body that protrude away from the body at the waist area would make this subject distinct.
Oval. An oval subject might have different
front view, but would be highly distinct when viewed from the side. The average of the subject’s stomach, waist, and abdomen measures
would be less than her bust measure (Simmons, 2002).
Triangle. If a subject had a larger hip circumference than her bust AND if the ratio of her hips-to-waist was small, then she would be a Triangle. The person with a Triangle shape would appear to be larger in the hips than the bust without having a defined waistline (Simmons, 2002).
Inverted Triangle. An inverted triangle subject would have a larger bust circumference than her hips AND a small bust-to-waist ratio (Simmons, 2002). Method of Validation
The validation process involved three
research objectives. The first objective of the study was to determine the capability of the FFIT© software in sorting a larger population into one of the nine shapes it is comprised of. This was attained by running a larger sample through the FFIT© software and analyzing the results of the software using cluster analysis. The second objective was to identify the degree of accuracy of the software in classifying the shapes and to verify whether the five body measurement ratios used in the software was used to accurately predict the body shapes better than random chance. This was attained by the statistical method of discriminant analysis. The third objective was to verify whether the nine shape groups identified in the software are statistically different – that is, whether any two shape groups are so similar in character that they can be grouped into one. To meet this research objective, the statistical method of multivariate analysis of variance (MANOVA) was used. Data Collection
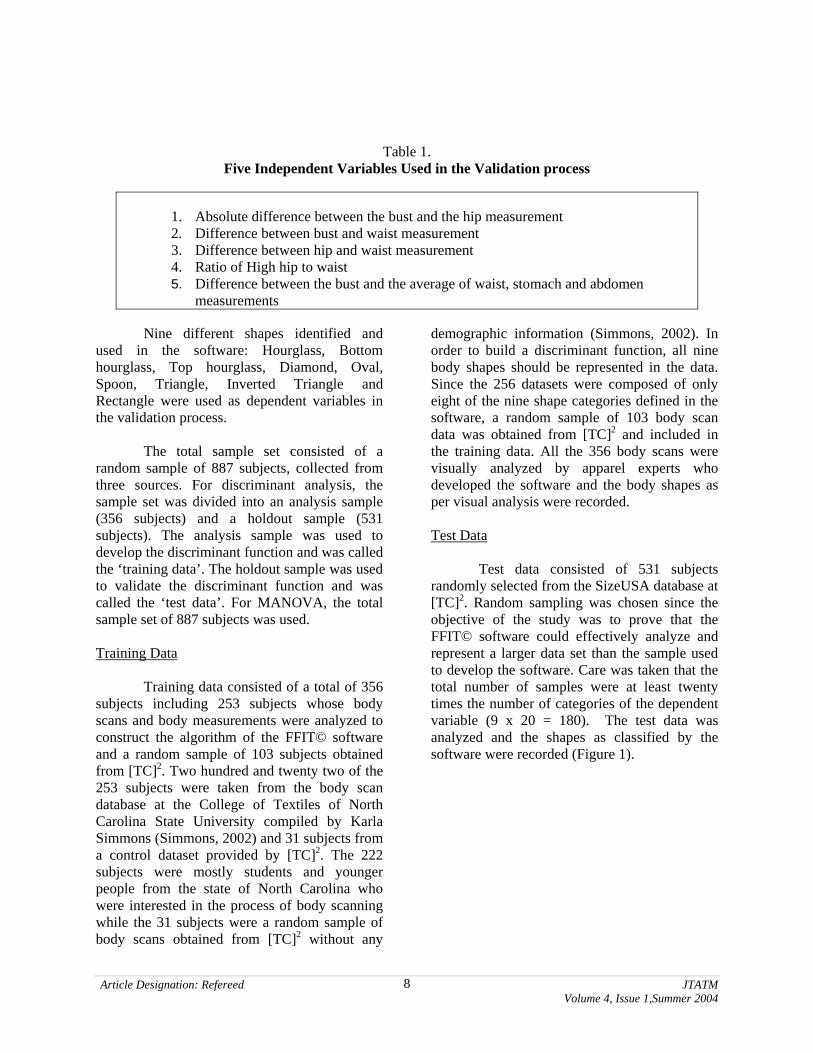
The body measurements used for shape classification were the bust, waist, hips, high hip, abdomen and stomach which were the measurements used in the FFIT© software to define the nine shape groups. A combination of mathematical differences and ratios of the six measurements were used (Table 1) in a precise order such that the subject would fall into one of the nine shapes based on their scan measurements.
Article Designation: Refereed JTATM Volume 4, Issue 1,Summer 2004
8
Table 1.
Five Independent Variables Used in the Validation process
1. Absolute difference between the bust and the hip measurement 2. Difference between bust and waist measurement 3. Difference between hip and waist measurement 4. Ratio of High hip to waist 5. Difference between the bust and the average of waist, stomach and abdomen
measurements
Nine different shapes identified and used in the software: Hourglass, Bottom hourglass, Top hourglass, Diamond, Oval, Spoon, Triangle, Inverted Triangle and Rectangle were used as dependent variables in the validation process.
The total sample set consisted of a
random sample of 887 subjects, collected from three sources. For discriminant analysis, the sample set was divided into an analysis sample (356 subjects) and a holdout sample (531 subjects). The analysis sample was used to develop the discriminant function and was called the ‘training data’. The holdout sample was used to validate the discriminant function and was called the ‘test data’. For MANOVA, the total sample set of 887 subjects was used.
Training Data
Training data consisted of a total of 356 subjects including 253 subjects whose body scans and body measurements were analyzed to construct the algorithm of the FFIT© software and a random sample of 103 subjects obtained from [TC]2. Two hundred and twenty two of the 253 subjects were taken from the body scan database at the College of Textiles of North Carolina State University compiled by Karla Simmons (Simmons, 2002) and 31 subjects from a control dataset provided by [TC]2. The 222 subjects were mostly students and younger people from the state of North Carolina who were interested in the process of body scanning while the 31 subjects were a random sample of body scans obtained from [TC]2 without any
demographic information (Simmons, 2002). In order to build a discriminant function, all nine body shapes should be represented in the data. Since the 256 datasets were composed of only eight of the nine shape categories defined in the software, a random sample of 103 body scan data was obtained from [TC]2 and included in the training data. All the 356 body scans were visually analyzed by apparel experts who developed the software and the body shapes as per visual analysis were recorded. Test Data
Test data consisted of 531 subjects randomly selected from the SizeUSA database at [TC]2. Random sampling was chosen since the objective of the study was to prove that the FFIT© software could effectively analyze and represent a larger data set than the sample used to develop the software. Care was taken that the total number of samples were at least twenty times the number of categories of the dependent variable (9 x 20 = 180). The test data was analyzed and the shapes as classified by the software were recorded (Figure 1).

Article Designation: Refereed JTATM Volume 4, Issue 1,Summer 2004
9
The uneven sample size in each shape can be attributed to the fact that the frequency of occurrence of those shapes in any given population is less. For example, a diamond shaped person is characterized by having several large rolls of flesh in the midsection of the body that protrudes away from the body at the waist area (Simmons, 2002). This description fits a
person who is exceedingly obese and the number of people falling into this category would not be the same as the number of people falling into the shape category of hourglass. It was verified that the group size of each shape category need not be similar to conduct the statistical analysis.
2055
15
59
162
73
9993
020406080
100120140160180
Bot
tom
Hou
rgla
ss
Hou
rgla
ss
Spoo
n
Rec
tang
le
Ova
l
Tria
ngle
Dia
mon
d
Inve
rted
Tria
ngle
Top
Hou
rgla
ss
Shape
Freq
uenc
y
Figure 1. Distribution of Shapes - Test Data Results Cluster Analysis
Cluster analysis was performed on the test data of 531 subjects to statistically confirm that the software could effectively classify a larger sample set. Statistical software JMP 5.0 was used to perform the cluster analysis. The test data of 531 subjects was run through the software and the shape classification was recorded. The results were checked for any data falling into a ‘no shape’ category and then cluster analysis was run on them using the five body measurement ratios to determine whether the number of clusters obtained were equal to the number of shapes in the software. It was found that none of the subjects from the test data fell into the no-shape category and the number of clusters obtained resembled the number of shapes identified in the software.
Discriminant Analysis
Using the results of visual analysis of body scans, a discriminant function was built that represented true shape classification using discriminant analysis. The discriminant function was used on a test sample and the percentage accuracy of the discriminant function with respect to the shapes obtained from the visual analysis of the test data was calculated. The test sample was run through the FFIT© software and the percentage accuracy of the software with respect to visual analysis was computed. The results of the discriminant function and the FFIT© software were then compared which would determine whether the software or the discriminant function was better. These results would give an answer to the second research objective of the study, which was to identify the degree of accuracy of the software in classifying the shapes. Then, the predictive accuracy of the discriminant function with respect to chance was

Article Designation: Refereed JTATM Volume 4, Issue 1,Summer 2004
10
compared with the obtained predictive accuracy of the discriminant function to verify whether the five body measurement ratios used in the software can be used to accurately predict the body shapes better than random chance. A hypothesis was formulated to verify this.
Hypothesis. The five body measurement ratios used in the software were better in accurately classifying the body shapes than random chance. Statistical Significance Wilks’ Lambda. The Wilks’ Lambda test examines the ‘residual discrimination’ in the system, or the ability of the variables to discriminate among the groups beyond the information that has been extracted by the previously computed functions (Klecka, 1980). Residual discrimination is measured by Wilks’ lambda, also called the U statistic (Klecka, 1980).
Since the data obtained was a sample and did not represent the whole population, it was essential to know the probability of the sampling process producing groups with the computed degree of discrimination, when in fact there were no group differences in the population. This process is called statistical significance and was essential when dealing with samples (Klecka, 1980). It was also essential that the sampling should be done on a random basis, and since our sampling procedure was random, the test of statistical significance – Wilks’ Lambda could be applied to the sample. Wilks’ Lambda represents the percent variance not explained and is a multivariate measure of group differences over several discriminating variables (Klecka, 1980). The multivariate statistics obtained from the discriminant analysis run yielded the results shown in the Table 2.
Table 2. Multivariate Statistics Obtained from the Discriminant Procedure
Statistic Value F Value Num DF Den DF Pr > F
Wilks’ Lambda 0.08 37.91 32 1270.2 < .0001 Pillai’s trace 1.72 32.57 32 1388 < .0001 Hotelling-Lawley trace 3.82 40.97 32 889.06 < .0001 Roy’s greatest root 1.79 77.50 8 347 < .0001
The larger the between groups dispersion, the smaller the value of Wilks’ Lambda and greater the implied significance (Hair et al., 1995). The lower value of lambda (0.08438471) indicates that the five discriminating variables were extremely effective in differentiating the nine groups of shapes. Assessing Overall Fit Since the level of significance of the discriminant function was significant, the next step was to ascertain the overall fit of the retained discriminant function. The assessment involved the following considerations:
1. The reason for developing classification matrices
2. Determination of cutting score
3. Construction of classification matrices
4. Standards for assessing classification accuracy (Hair et al., 1995)
Classification matrices. The Wilks’ Lambda statistic indicates that the discriminant function discriminated significantly, but did not quantify the predictive ability of the discriminant function. Classification matrices were constructed to determine the predictive ability of a discriminant function (Hair et al., 1995). In addition, the predictive accuracy of the discriminant function was measured by the hit ratio, obtained from the classification matrix. The classification matrix for the test data is given in the Table 3. The total number of

Article Designation: Refereed JTATM Volume 4, Issue 1,Summer 2004
11
subjects correctly classified by the discriminant function is reported on the diagonal of the matrix and the actual number of subjects who
fell into each shape (visual analysis) is listed in the right most column.
Table 3. Classification Matrix Showing the Percentage Accuracy of the Discriminant Function (Test data)
From Visual Shape
2 BH
D H IT O R S T TH TOTAL NO. OF
SUBJECTS BH 53
75.71 2 2.86
3 4.29
0 0.00
3 4.29
0 0.00
4 5.71
5 7.14
0 0.00
70
D 2 33.33
3 50.00
0 0.00
0 0.00
1 16.67
0 0.00
0 0.00
0 0.00
0 0.00
6
H 12 13.33
0 0.00
55 61.11
0 0.00
0 0.00
4 4.44
3 3.33
0 0.00
16 17.78
90
IT 0 0.00
0 0.00
0 0.00
7 100.00
0 0.00
0 0.00
0 0.00
0 0.00
0 0.00
7
O 1 1.23
6 7.41
2 2.47
4 4.94
42 51.85
19 23.46
1 1.23
6 7.41
0 0.00
81
R 1 0.65
0 0.00
6 3.92
9 5.88
9 5.88
123 80.39
2 1.31
1 0.65
2 1.31
153
S 10 11.24
6 6.74
7 7.87
0 0.00
8 8.99
5 5.62
50 56.18
3 3.37
0 0.00
89
T 1 6.25
2 12.5
0 0.00
0 0.00
9 56.25
0 0.00
0 0.00
4 25.0
0 0.00
16
TH 0 0.00
0 0.00
2 10.53
1 5.26
0 0.00
2 10.53
0 0.00
0 0.00
14 73.68
19
Total 80 19 75 21 72 153 60 19 32 531 Hit Ratio. The percentage accuracy of prediction of the discriminant function when compared to the visual analysis is calculated by the hit ratio. The hit ratio is calculated as: Hit ratio = [(53+3+55+7+42+123+50+4+14)/531] *100 = 66.10 % This indicated that the discriminant function was able to classify the body shapes correctly 66.1% of the times. ‘Maximum chance criterion’ and ‘Proportional chance criterion’. The predictive accuracy of the discriminant function by chance is measured by maximum chance criterion and proportional chance criterion and the values were compared with the hit ratio to check the
hypothesis. This also gave the acceptable level of predictive accuracy of the discriminant function. The first step to determine the acceptable level of predictive accuracy is the determination of percentage correctly classified by chance. Since the group sample sizes in our case are not equal, maximum chance criterion is based on the sample size of the largest group. The largest group with the maximum number of subjects in the test data was the rectangle shape with a maximum of 123 subjects out of 531 subjects. The percentage of subjects who fell into this group, i.e. the maximum chance criterion is given by (123 / 531) * 100 = 23.1638% correct classifications. The hit ratio of the discriminant function is 66.1%, which is more than the percentage accuracy by chance. This means that the hit ratio accurately predicts

Article Designation: Refereed JTATM Volume 4, Issue 1,Summer 2004
12
shapes better than chance. The hypothesis is accepted, that is, the five variables used in the software are better in accurately classifying the body shapes better than random chance. According to Hair et al. (1995), maximum chance criterion must be used when the objective of the discriminant analysis is to maximize the percentage correctly classified. Since our case had unequal sample size and we wanted to classify members of all groups, another chance model namely ‘Proportional chance criterion’ was used. The hit ratio of the discriminant function was higher than the proportional chance criterion, which suggests that the discriminant model is valid for the data. As a rule of thumb, Hair et al (1995) suggest that classification accuracy should be 25% more than the chance accuracy. This rule was satisfied in our case with the classification accuracy of 66.10%, which is well above the 25% level of the chance accuracy. Thus we conclude that the hit ratio of the discriminant function is acceptable using the chance models and the hypothesis was accepted. Press’s Q statistic. Press’s Q statistic was a comparison of correct classifications with
the total sample size and the number of groups. The value of Press’s Q statistic was compared with the chi-square value for 1 degree of freedom and if it exceeded the critical value at the desired significance level. Press’s Q = 1625.79. The critical value at a significance level of 0.01 is 6.63. Hence, the predictions were significantly better than chance criterion and the hypothesis was accepted. Was FFIT© software Better Than The Discriminant Function?
The next part of the second objective is
to assess whether the FFIT© software has better classification accuracy than the discriminant function developed from the visual analysis of the training data. The body scans of the test data were visually analyzed and the body shape results were recorded. The body shapes of the 531 subjects as per the software were then compared with the shapes of the visual analysis using frequency tables. The results of the frequency tables along with the results of the discriminant function obtained from the classification matrix are shown in the Table 4.
Table 4. Percentage Accuracy of FFIT© software and Discriminant Function in Classifying Each Body Shape With Respect to Visual Analysis (Test Data)
Discriminant function FFIT© software Shape No. of
subjects Percentage
accuracy No. of
subjects Percentage
accuracy
Total subjects
in test data Bottom
Hourglass 53 75.71 70 100 70
Diamond 3 50 2 33.33 6 Hourglass 55 61.11 90 100 90 Inverted Triangle
7 100 5 71.43 7
Oval 42 51.85 53 65.43 81 Rectangle 123 80.39 150 98.04 153
Spoon 50 56.18 73 82.02 89 Triangle 4 25 12 75 16
Top Hourglass
14 73.68 19 100 19
351 Hit ratio 66.10
474 Hit ratio 89.27
531

Article Designation: Refereed JTATM Volume 4, Issue 1,Summer 2004
13
Overall, the percentage accuracy of the
FFIT© software was better than the discriminant function. The hit ratio or the weighted average of the correctly classified people for the software was much higher than the discriminant function, which clearly indicated that the performance of the software was better than the discriminant function for the test data. The FFIT© software was better than the discriminant function in the classification of seven of the nine shape groups. This could be due to the fact that the FFIT for Apparel© software was built in such a way that it looks for a specific shape of a person before going to the next, while the statistical method looks for relationships between the variables in a random manner.
The percentage accuracy of the software
in classifying the shape ‘Diamond’ was low, which could be due to the fact that the number of samples for that shape was low. This could be because the diamond shape is rare and only abnormally corpulent people fall into this category. Hence the range of measurements for each individual falling into the category was wide and could lead to incorrect classification by the software. Thus, we conclude that the body shape classification algorithm of the FFIT© software is better than the statistical function developed from the visual analysis of the training dataset.
The second research objective, which was to determine the predictive accuracy of the software and to verify whether the five variables were better in correctly classifying the shapes better than random chance was attained by the values of hit ratio, maximum chance criterion and proportional chance criterion and Press’s Q statistic. They clearly indicate that the predictive accuracy of the software was better than the statistical model developed and thus the five variables were better in correctly classifying the shaper better than random chance. MANOVA Analysis
The third part of the research objective was to determine whether the nine body shapes differed significantly on the five body
measurements. This was evaluated by performing MANOVA analysis on the test data and checking whether the mean scores of the nine shape groups for each variable are statistically different. The total sample set of 887 subjects was used to conduct MANOVA. Hypothesis. The nine body types differ significantly on the five body measurements.
Since we would like to know the
differences of dependent measures across the groups as a whole, the type of multivariate question is an intrinsically multivariate question as defined by Hand and Taylor (Hair et al., 1995)
Criteria for significance testing. There are
several criteria to assess the multivariate differences across groups. The most commonly used test statistic for overall significance in MANOVA is Wilks’ Lambda. The larger the between-groups dispersion, the smaller the value of Wilks’ Lambda. The value of Wilks’ Lambda and other statistical criteria for significance testing taken from the SAS results is shown in the Table 5. It could be seen that the value of Wilks’ Lambda is very small, which indicates larger between-group dispersion.
Interpretation of the Results SAS code was written to perform MANOVA on the five variables and nine shape groupings for each data to test the hypotheses developed.
Hypothesis: The nine body shapes differ
significantly on the five body measurements. The hypothesis posits that the nine body shapes differ significantly across the five body measurement ratios. The results of the MANOVA analysis are shown in the Table 6. The results show that the mean scores for each shape for each variable differ significantly and the value of F is very large (Pr > F is very small) for all five variables. The hypothesis is supported and there is a significant difference between the nine shape groups based on the five body measurement ratios.

Article Designation: Refereed JTATM Volume 4, Issue 1,Summer 2004
14
Table 5. MANOVA test criteria and F approximations for the hypothesis of no overall shape effect
Statistic Value F Value Pr > F
Wilks’ Lambda 0.09 90.89 < 0.0001 Pillai’s Trace 1.63 75.70 < 0.0001 Hotelling-Lawley Trace 3.71 101.17 < 0.0001 Roy’s Greatest Root 1.77 194.39 < 0.0001
Table 6.
Mean Scores of the Nine Groups Across the Five Variables
Mean Scores for Variables F Value Pr > F
Bottom Hourglas
s
Hourglass
Top Hourglass
Oval Inverted Triangle
Diamond Rectangle Spoon Triangle
Abs (Bust-Waist)
117.21 < 0.001 6.88 8.93 10.29 4.66 6.06 5.05 6.70 6.68 3.60
Bust – Hips 169.85 < 0.001 -5.07 -1.93 2.60 -2.18 4.10 -6.20 -0.72 -4.73 -4.53
Hips – Waist 165.21 < 0.001 11.94 10.86 7.69 6.84 1.96 11.25 7.42 11.41 8.13
Highhip/Waist
106.49 < 0.001 1.14 1.15 1.15 1.12 1.02 1.14 1.12 1.23 1.12
Discussion
This research study checked the validity of the software ‘Female Figure Identification Technique (FFIT) for Apparel©’ developed at the College of Textiles of North Carolina State University using multivariate statistical methods.
The software ‘FFIT for Apparel©’ was
developed as a computer model to compare data from 3D body scans of individuals to categorize them by differences in body stance, proportions, and body angles that are significant factors in the fabrication of apparel shapes that fit the body well (Simmons, 2002). Thus, the software was developed with the aim of developing sizing standards that would reflect the body shapes of specific population and to aid in the process of apparel customization for fit. No other software has been developed to date to assess the body shape of women. Auburn University researchers developed a tool called ‘Body Shape Assessment Scale (BSAS)’ which has nine
scales to analyze the body build, body shape, hip shape, shoulder slope, front torso shape, buttocks shape, back curvature, posture, and bust prominence (Connell, 2003). This tool is in its elementary stage and the shapes identified in the tool are not clearly defined. Thus, the ‘FFIT for Apparel©’ software is unique in its kind with the nine shapes in the software potentially representing the population. To date, apparel manufacturers are provided with numbers from anthropometric surveys that make no real sense to the non-technical audience. The sizing standards developed from these surveys were based on one particular body shape (hourglass) and each size increase was proportional, while in reality, body sizes in the population do not necessarily increase proportionally. Hence it is essential to understand the body shape patterns in the population to meet customer needs. Apparel manufacturers who are looking at mass customization as their new marketing strategy can use this software to identify their customer base and customize their apparel. Customers,

Article Designation: Refereed JTATM Volume 4, Issue 1,Summer 2004
15
even though might know their sizes in general, do not know what the sizes really mean and have no idea about their body measurements. Hence, the output of the FFIT© software could be introduced as a meaningful new standard.
Visual Analysis of the Body Scans
As a requirement for the statistical methods, the body scans of the training data of 256 subjects and the test data of 531 subjects were analyzed visually by apparel experts who developed the FFIT© software to record the body shape of the subjects. The front and side view of each subject was analyzed, along with the body measurements. During this visual analysis, certain problems pertaining to the location of the measurements extracted by the body scan software, incorrect measurements due to loose sports gear worn during scanning and the
posture of the subject were observed. Traditional body measurements are based on landmarks on the body, which are often identified or located by palpitation, while the body scanner takes measurements without actually touching the body. This affects the percentage accuracy of measurements of the body scanner since certain body landmarks are difficult to identify using non-contact methods. This is one of the major reasons for incorrect locations of waist, stomach, and high hip measurements. Figure 2 shows a body scan with all the measurements used in the right location. But the measurements of body scans of all the test data were not taken at right location. Different problems encountered during the visual analysis were analyzed and it was determined that improvements in the body measurement extraction would definitely impact the classification accuracy.
Figure 2. Correct Location of Measurements used in the Study Crossover from One Shape To Another
In certain body scans, there was a crossover from one shape to another where the body measurement ratios of the subject fell out of range from those used in the software. The software used ratios of body measurements in combination with the differences in classifying the body shape. Hence, a subject who fell into
one shape category during visual analysis did not fall into that particular shape when calculations were applied on the body measurements. An example for this is shown in the Figure 3 where the subject was at a crossover point between hourglass and spoon categories. The front view of the body scan confirms that the subject fell into the shape category of spoon, but the high hip to waist ratio of the subject was

Article Designation: Refereed JTATM Volume 4, Issue 1,Summer 2004
16
at a crossover point that made the software classify her incorrectly as an hourglass. Since the software was developed for the sole purpose of garment fit, shape classification must be
based on not only the shape of the body, but also the fit of a garment on the body. The subject when fitted for a garment would certainly fall into spoon shape and not hourglass.
Figure 3. Crossover of shapes: Hourglass or spoon?
Figure 4 is another example of crossover, where the subject was classified into oval by visual analysis but rectangle by the software. When the body measurements are in such a proportion that the shape category is rectangle, the curves and folds in the body
would ideally classify this body as oval. When looked from the perspective of apparel fit, if this person were fitted for pants, the alignment of back darts in pants would make her an oval shaped person rather than a rectangle person.
Figure 4. Crossover of shapes: Rectangle or oval?

Article Designation: Refereed JTATM Volume 4, Issue 1,Summer 2004
17
Measurement Location Problems
In come cases, the measurement extraction software identified measurements either at a higher or lower location than they actually were. Waist, bust, high hip and abdomen measurements were mostly measured at the wrong location.
Location of the Waist Measurement.
The definition of waist in the Body Measurement Extraction Software was the girth measurement taken at a distance of 0-2.5 inches above the small of back (center back point) and
0 inches above or below the center front waist point and side waist points. Irrespective of the subject being long-waisted, normal-waisted or short-waisted, this was the only formula used to extract the waist measurement from all the body scans. For a subject with long waists, often the waist was measured at a much lower position than the original location of the waist and for a subject with a shorter waist, the waist was taken at a much higher location than the original. Examples of a subject with low waist measurement and high waist measurement are shown in the Figure 5 and 6.
Figure 5. Low waist measurement (left) Figure 6. High waist measurement
(right) Bad stomach measurement locations.
This was one of the major measurement problems found in many scans. Many subjects were classified into incorrect shape categories by the FFIT© software because their stomach measurement was taken almost on their bust. This was particularly observed in people who are very short-waisted. The definition of stomach in the measurement extraction file of the Body Measurement Software of [TC]2 body
scanner was the largest circumference between the upper limit (start at 33.3% from waist to shoulder) and the lower limit using front waist point (start at 0% from waist to shoulder). Hence, for a person with a very short waist, the measurement was taken on the bust or at the under-bust measurement location. An example of a scan with the stomach taken on the bust is shown in the Figure 7. This phenomenon was predominant in people who are over-weight.

Article Designation: Refereed JTATM Volume 4, Issue 1,Summer 2004
18
Figure 7. Stomach measurement on bust In some cases, the stomach
measurement was was taken at a lower position. This occurred when the waist was taken at a lower position than its correct position, since the
definition of stomach was dependent on the location of waist. An example is shown in the Figure 8.
Figure 8. Low Stomach Measurement
Highhip measurements. The high hip measurement was taken at a higher location than it should be in some cases as, shown in Figure 9. This is because of the high hip measurement definition: Find the largest circumference
between 75% and 100% of distance from crotch to waist. For this person, the crotch point was identified at the wrong location which has led to a wrong high hip measurement.

Article Designation: Refereed JTATM Volume 4, Issue 1,Summer 2004
19
Figure 9. Location of high hip measurement too high Body Proportionality and Body Posture of Subjects
Two peculiar cases of subjects whose body was not proportional on either sides of a central dividing line were encountered. These people had a distinct body posture that tended
towards one side of the body. Examples of this body postures and asymmetry is shown in the Figure 10 and Figure 11. The lack of symmetry of both sides of the body has led to the wrong shape classification.
Figure 10. Peculiar body postures Figure 11. Unsymmetrical body
proportions

Article Designation: Refereed JTATM Volume 4, Issue 1,Summer 2004
20
Clothes Impact on Measurements
The impact of the apparel worn during scanning was evident in many cases. The athletic shorts can make a mark that diverts the body measurement software for a lower waist point than the natural waist, while the sports bra may flatten the bust and cause reduction in bust size from the original. The subject in Figure 12
had her waist measurement taken at the wrong location because of the indentation made by the athletic gear on her body. Due to the issue of privacy, the subjects select the apparel they wear during scanning on their own. Even though they are instructed not to choose too tight or too loose apparel, this problem was not one the researcher could actively control.
Figure 12. Clothes impact on body measurement Oval and diamond shapes
Some subjects belonging to the diamond shape category fell into the category of oval when classified by the software. This could be because of the fact that the subject has large layers of fat rolling down from the middle section because of its weight and forms an oval shape in the abdominal area and the software classifies the subject into oval instead of diamond. This could be rectified by analysis of the software code and looking for any possible changes. Summary
The overall research thesis was successful in validating the software ‘FFIT for Apparel©’. The first objective of the research was to determine
the capability of the software in sorting a larger population into one of the nine shapes it is comprised of. The software was successful in classifying a random test sample of 531 subjects, and cluster analysis performed on the results proved nine clusters in the data, thus proving its capability to sort a larger population.
Discriminant analysis was performed to
assess the classification accuracy of the FFIT© software and compare it to the discriminant function developed from the results of visual analysis. The classification accuracy of the discriminant function developed from the training data set is 66.01% for the test dataset, while the classification accuracy of the FFIT© software is 89.27% for the test dataset. The predictive validity of the discriminant function is higher by itself, and the performance of the

Article Designation: Refereed JTATM Volume 4, Issue 1,Summer 2004
21
FFIT© software is better than the discriminant function.
The third objective of the research was to
identify whether the nine shape groups are statistically different. The results obtained from the MANOVA analysis found that the nine shape groups proposed in the software are significantly different and the five variables used by the software significantly influence the group membership (body shape). The software could be used on a larger random sample set, representing the general US population and expected to produce good classification accuracies.
The reasons for misclassification were partly
due to the extraction of the measurement at the wrong location and hence improving the measurement extraction files could greatly impact the classification accuracy of the software. Even though the most appropriate definitions of the body measurements were identified while developing the software, visual analysis of a larger sample set has created new challenges in the area of waist, stomach and high hip measurements. A possible solution to this problem that would help insure the extraction of measurements at the right location include having several definitions for a body measurement and finding the best definition for differing bodies by computing different combinations.
Future Research
The results of the research study have
uncovered new areas of research that could be of great commercial value. The nine body shapes identified by the software effectively represent the body types in the tested population of nearly 700 subjects. By testing the software on data representing a complete, nationwide population, the results could be the foundation for forming new sizing standards representing the current population.
If complete demographic information (e.g.
age, geographic location and race) were available, the relationship between these demographic factors and shape classification
could be analyzed. Using the results of such an analysis, new apparel sizing standards could be formed for specific segments of the population, which would be more accurate in meeting the needs of the specific markets.
Exploration of the relationship between
demographics and body shapes could also be used to calculate the proportion of existence of each shape in a given population. This will aid in non-clothing applications like designing aircraft seats, office spaces and other applications involving human design. The FFIT© software could be used along with airport scanning systems used for security to identify the body shape of a passenger and allot seats in the airplane according to the size of the passenger.
The nine shapes identified in the software
could be used in developing standard patterns for mass customization practices. Since the pattern alteration points for different body shapes are different, the nine shapes could successfully be used in the development of standardized patterns for the apparel industry.
The shapes identified by the software could be used to analyze different garment styles suitable for different body shapes. This could be a useful aid for the population to select garments that suit their body shape. At this point, the FFIT for Apparel©
software has endless possibilities that could be explored. Research work done on other important body characteristics that affect the fit of apparel and which gives an idea to the consumer about their garment fit is under completion at NC State University. This work could be added to FFIT© software, which then could be of commercial interest. This research thesis has proved the validity of the software and work on the measurement extraction would highly help in increasing its accuracy. REFERENCES
Abdel-Moty, E., & Khalil, T. M. (1986, March 19-21). Computer aided design of the sitting

Article Designation: Refereed JTATM Volume 4, Issue 1,Summer 2004
22
workplace, Proceedings of the 8th Annual Conference on computers and industrial engineering.
American Society of Testing and Materials (ASTM). (1995a). Standard Table of Body Measurements for Adult Female Misses Figure Type, Sizes 2-20. (Vol 07-02, Designation: D5585-95). West Conshohocken, PA: ASTM
Anderson, L.J., Brannon, E.L., Ulrich, P.V., Presley A.B., Woronka, D., Grasso, M., Stevenson, D. (2001). Understanding fitting preferences of female consumers: Development of an expert System to enhance accurate sizing selection. (Annual Rep. No. I98-A08) Wilmington, DE: National Textile Center. Armstrong, H. J. (1987). Pattern making for fashion design, New York: Harper & Row, Publishers.
CAESAR: 3D anthropometric database (n.d.). Retrieved June 15, 2003, from SAE International website http://www.sae.org/technicalcommittees/caesarhome.htm
Case, K., Xiao, D., Porter, J. M. (September 1995). Car Seat and Occupant Modeling using CAD. Retrieved June 15, 2003, from http://www.lboro.ac.uk/departments/mm/research/product-realisation/res_int/human/brite/brite.html
Comas, J. (1960). Biotypology and constitutional types. In Manual of Physical Anthropology. (pp.319-366). Illinois: Charles C. Thomas Publisher.
Computerized anthropometric research and design laboratory (CARD) (n.d.). Retrieved June 15, 2003 from Air force crew system interface division website http://www.hec.afrl.af.mil/HECP/Card1a.shtml
Connell, L. J., Ulrich, P., Knox, A., Hutton, G., Woronka, D., Ashdown, S. (2002). Body scan analysis for fit models based on body shape and posture analysis. (Annual Rep No. S01-AC27), Wilmington, DE: National Textile Center.
Douty, H. I. (1977). Visual somatometry in health related research. Journal of the Alabama Academy of Science. pp. 21-34.
Ergonomics: The science for better living and working. (n.d.). Retrieved June 15, 2003
from American Psychological Association website http://www.apa.org/ppo/issues/sergofact.html
Farrell-Beck, J. A., Pouliot, C. J. (September, 1983). Pant alteration by graphic somatometry techniques. Home Economics Research Journal, 12 (1), pp. 95-105.
Gazzuolo, E., DeLong, M., Lohr, S., LaBat, K., Bye, E. (1992). Predicting garment pattern dimensions from photographic and anthropometric data. Applied Ergonomics, 23(3), pp. 161-171.
Hair, J. F., Anderson, R. E., Tatham, R. L., Black, W. C. (1995). Multivariate data analysis with readings (4th ed.). Englewood Cliffs, New Jersey: Prentice Hall.
Heisey, F. L., Brown, P., Johnson, R. F. (1986). A mathematical analysis of the graphic somatometry method of pattern alteration. Home Economics Research Journal, 15(2), pp. 115-122.
Istook, C. L., Simmons, K. P., Devarajan, P. (November, 2002). Female figure identification technique (FFIT) for apparel. Proceedings of the IFFTI International Conference, Hong Kong.
Klecka, W. R. (1980). Discriminant analysis (Series: Quantitative applications in the social sciences). California: Sage Publications Inc.
LePechoux, B. (1998, September). Standard sizing and fit testing applied to women’s hosiery. Unpublished Doctoral A1 requirement paper, North Carolina State University, Raleigh.
O’Brien, R., & Sheldon, W. C. (1941). Women’s measurements for garment and pattern construction. Washington: United States Government Printing Office.
Salusso-Deonier, C. J. (1982). A method for classifying adult female body form variation in relation to the U. S. standard for apparel sizing. Unpublished doctoral dissertation, University of Minnesota, Minnesota.
Simmons, K. P. (2001, January). Body measurement techniques: a comparison of three-dimensional body scanning and physical anthropometric methods, Unpublished A1 paper, North Carolina State University, Raleigh.

Article Designation: Refereed JTATM Volume 4, Issue 1,Summer 2004
23
Simmons, K. P. (2002). Body Shape Analysis Using Three-Dimensional Body Scanning Technology, Unpublished doctoral dissertation, North Carolina State University, Raleigh.
The fit problem (n.d.) Retrieved May 23, 2003, from http://www.intellifit.com/fitproblem.htm The national sizing survey (n.d) Retrieved May 23, 2003 from http://www.sizeusa.com/info.html Treleaven, P. (n.d.). UK national sizing survey
using 3D body scanning. (Abstract). Retrieved June 15, 2003 from http://www.techexchange.com/thelibrary/UKArticle.html
U.S. Department of Commerce. (1970). National
Bureau of Standards Commercial Standard
PS42-70: Body measurements for the sizing of women’s patterns and apparel. Washington, DC: U.S. Government Printing Office.
Wick, J., & Drury, C. G. (15-17 April 1985). Postural change due to adaptations of a sewing workstation. The Ergonomics of working postures: Models, methods and cases, Proceedings of the First International Occupational Ergonomics Symposium, Zadar, Yugoslavia.
Workman, J. E., & Lentz, E. S. (2000). Measurement specifications for manufacturers’ prototype bodies. Clothing and Textile Research Journal, 18(2), 251-259.