Embed Size (px)
Citation preview

Lorini et al. Integrating Social Media into a Pan-European Flood Awareness System
Integrating Social Media into aPan-European Flood AwarenessSystem: A Multilingual Approach
Valerio LoriniEuropean Commission, Joint Research
Centre (JRC), Ispra, ItalyUniversitat Pompeu Fabra, Barcelona, Spain
Carlos CastilloUniversitat Pompeu Fabra, Barcelona, Spain
Francesco DottoriEuropean Commission, Joint Research
Centre (JRC), Ispra, [email protected]
Milan KalasKAJO, Bytca, Slovakia
Domenico NappoEuropean Commission, Joint Research
Centre (JRC), Ispra, [email protected]
Peter SalamonEuropean Commission, Joint Research
Centre (JRC), Ispra, [email protected]
ABSTRACT
This paper describes a prototype system that integrates social media analysis into the European Flood AwarenessSystem (EFAS). This integration allows the collection of social media data to be automatically triggered by floodrisk warnings determined by a hydro-meteorological model. Then, we adopt a multi-lingual approach to findflood-related messages by employing two state-of-the-art methodologies: language-agnostic word embeddingsand language-aligned word embeddings. Both approaches can be used to bootstrap a classifier of social mediamessages for a new language with little or no labeled data. Finally, we describe a method for selecting relevant andrepresentative messages and displaying them back in the interface of EFAS.
Keywords
Social Media, Disaster Risk Management, Flood Risk
INTRODUCTION
Overmillennia humans have developed villages and cities near water bodies, mainly for two reasons: (i) improvementsin agricultural yields due to yearly floods in fertile floodplains leaving nutrient-rich silt deposits behind; and (ii)people’s desire to live near coastlines and river valleys, often on wetlands and backfilling otherwise natural floodbuffers. Due to the closeness of human settlements to rivers and coasts, floods are the natural disasters with thegreatest damage potential and the ones that affect the greatest number of people (UN Office for the Coordination ofHumanitarian Affairs 2017).
According to recent studies, Global warming is linked to a substantial increase in flood risk over most countries inCentral and Western Europe, even if the temperature increases remain close to the lower estimates. For instance,flood peaks with magnitude as it happens once in 100 years, called ’return period’, are projected to double infrequency within the next three decades (Alfieri et al. 2015).1
1The return period of an event is the time span it would take to observe one such event on expectation.
CoRe Paper – Social Media in Crisis and ConflictsProceedings of the 16th ISCRAM Conference – València, Spain May 2019
Zeno Franco, José J. González and José H. Canós, eds..
arX
iv:1
904.
1087
6v1
[cs
.IR
] 2
4 A
pr 2
019

Lorini et al. Integrating Social Media into a Pan-European Flood Awareness System
In Europe, the Emergency Response Coordination Centre (ERCC), operating within the European Commission’sCivil Protection and Humanitarian Aid Operations department, was set up to support a fast and coordinatedresponse to disasters both inside and outside Europe using resources from the countries participating in the EUCivil Protection Mechanism. This centre monitors hazards and risks, collects and analyzes real-time information ondisasters, prepares plans for the deployment of experts, teams and equipment, and in general coordinates the EU’sdisaster response efforts.
The European Flood Awareness System (EFAS) provides real-time information and forecasts about floods to theERCC as well as to a series of partners including national and regional hydrological services. EFAS is part ofthe Copernicus Emergency Management Service (Copernicus EMS), and holds regularly updated flood-relatedinformation such as probabilistic medium-range flood forecasts (including short-range flash floods), seasonalforecasts, and impact assessments and early warnings.
Current flood hazard mapping methodologies, such as the one implemented in EFAS, have high scale spatialresolution capacity: 1× 1 kilometer resolution globally and 100× 100 meter resolution in Europe (Dottori, Salamon,et al. 2016). This combined with state-of-the-art forecasting models provide detailed information about the riskassociated with a flood in terms of likelihood, magnitude, timing, and impact (Dottori, Kalas, Salamon, et al. 2017).
Due to nature of floods phenomena and its dynamics, it is important that satellites can monitor the flood extentduring the flood peak, therefore early warnings are important to allow sufficient lead time for requesting satellitemappings of the area at risk (Dottori, Kalas, Lorini, et al. 2017).
Over the past decade, social media has emerged as a relevant information source during disasters, promptingresearchers from diverse areas to converge on this domain (Castillo 2016; Palen and Anderson 2016). Social mediaanalysis has demonstrated the potential to provide timely, precious information about the spatial (Brouwer et al.2017; Restrepo-Estrada et al. 2018) and temporal (Vieweg et al. 2014) development of a crisis, as well as supportingthe identification of key disaster-related events (Musaev et al. 2015). Although the value of social media analysisin providing timely data and methods for the analysis of natural hazards has been recognized in previous work,comparatively much less attention has been given to how to integrate social media in a seamless, reliable way withtools for disaster forecasting and monitoring.
Since the geographical domain of EFAS products covers an area where population speaks more than 27 languages,we focused on a multi-lingual system. We therefore use representation of words as vectors in order to exploitprobabilistic functions to infer similarities between words, know as word embeddings(Pennington et al. 2014).
Our research fills this gap by describing the integration of social media monitoring into a flood monitoring andforecasting platform, enriching hydro-meteorological information with reports from the public.
We developed software for EFAS named Social Media for Flood Risk (SMFR) which provides near-real-timeinformation collected from social media about flood risks and impacts, including examples of messages in socialmedia about it. Figure 1 represents the conceptual schema of SMFRâĂŹs components, part of which is described inthis paper, and their integration.
Our main contributions are:
• We integrate social media data collection into the European Flood Awareness System (EFAS) based on EFASforecasts. Whenever EFAS rapid risk assessment identifies heightened risk of floods in a certain area, wetrigger data collection from social media (in our case, Twitter) respecting API limitations while dealing withthe possibility of various events happening at the same time. A similar mechanism is already in use fortriggering pre-tasking of satellite image acquisition in Copernicus EMS
• We describe a methodology that requires a minimal amount of manual intervention for each additionallanguage, and demonstrate it with four languages being used to bootstrap a classifier for a fifth language. Thismethodology is based on Convolutional Neural Networks and its multi-lingual capabilities stem from usingeither language-agnostic word embeddings, where vectors representing sentences are not dependent on asingle language, or multi-lingual word embeddings (Conneau et al. 2017).
• We describe an aggregation and selection module that can select representative messages for an area in whichflood risk has been predicted.
• We integrate SMFR into EFAS and demonstrate it during the recent floods affecting Calabria, Italy, in earlyOctober 2018. Note that we decided to present only one case for the sake of clarity and conciseness, howeverSMFR has been tested with additional real cases.
CoRe Paper – Social Media in Crisis and ConflictsProceedings of the 16th ISCRAM Conference – València, Spain May 2019
Zeno Franco, José J. González and José H. Canós, eds..

Lorini et al. Integrating Social Media into a Pan-European Flood Awareness System
Figure 1. Schema of SMFR components
The remainder of this paper is organized as follows: the next section presents related work; then, three technicalsections describe the methods for on-demand data collection, multi-lingual classification, and aggregation andselection. Finally, we present experimental results, including a case study, followed by our conclusions and futurework.
RELATED WORK
Background: European Flood Awareness System (EFAS)
EFAS is part of the Copernicus Emergency Management Systems, and serves the ERCC and EU member states’Civil Protection agencies with forecasts of flood risks. It covers the European Union as well as several neighbouringareas that are relevant from the perspective of flood risk and EU policies (e.g. all countries of the Danube riverbasin). EFAS provides information based on weather forecasts2 and hydrological ensemble predictions obtained byan hydrological model simulations, therefore subjected to uncertainty. For being exploited at its maximum potentialit should offer additional supporting information that could be used for prioritizing resources and interventions.EFAS already includes products that go in that direction. For instance pre-tasking satellite mappings is triggered inadvance integrating socio-economic data (population, infrastructures, economic losses fused as impact indicators)with flood magnitude and probability (likelihood)(Dottori, Kalas, Lorini, et al. 2017).EFAS forecasts have good accuracy level which is constantly monitored3, but Crisis are only declared, formalisedand managed by the local authorities and it’s up to them to decide what to do with the data provided. The new layerpresented helps in the near real time confirmation of floods for areas where a high flood risk was forecasted. TheSMFR layer includes a set of representative tweets and a dot distribution map of social media messages related tofloods.
Combining authoritative and non-authoritative data
A recent trend in research on social media on disaster has been to study methodologies for combining non-authoritative and authoritative data in risk assessment. The non-authoritative data are reports generated by thepublic, typically posts in social media platforms. The authoritative data comes from various sensors includingmeteorological and hydrological ones as well as physical models for creating forecasts with this data. In previouswork, these data have been combined in various ways.Musaev et al. (2015) describe the LITMUS platform, which collects and filters messages about landslides fromvarious social media platforms and geo-locates them to merge reported events with data from physical sensorsreferring to the same location.
2EFAS inputs are based on the Ensemble Prediction System from the European Center for Medium Range Weather Forecast (ECMWF)which consists of 51 ensemble member.
3publicly available at https://www.efas.eu/validation-and-skill-scores
CoRe Paper – Social Media in Crisis and ConflictsProceedings of the 16th ISCRAM Conference – València, Spain May 2019
Zeno Franco, José J. González and José H. Canós, eds..

Lorini et al. Integrating Social Media into a Pan-European Flood Awareness System
Brouwer et al. (2017) use social media combined with authoritative data to define probabilistic and deterministicflood-extent maps. Information gathered from the public is used to make inferences about rainfall, contributingto interpolate coarse-grained data at a the same resolution as a Local Drainage Direction (LDD) map, in order todetermine water levels for different cells.
Restrepo-Estrada et al. (2018) use a transformation function for creating a proxy variable for rainfall by analyzingkeywords-filtered geo-located social media messages and rainfall measurements from authoritative sources. Theproxy variable is incorporated in a hydrological model for stream-flow estimation.
Our work differs from the previous ones in important ways. First, we do not filter social media posts by flood-relatedkeywords, but rather according to the location of a possible flood based on forecasts from the EFAS system. Second,we aggregate data using a geocode standard for referencing the subdivisions of countries for statistical purposes,known as Nomenclature of Territorial Units for Statistics(EC 2016). Its granularity is identified by levels, the higherthe level, the higher the granularity. In our work we used level 2 (NUTS-2) as the main subdivision. Third, wecover a large area by automatically processing content in several languages. The goal of our system is to confirmand bring more detail to the outcomes of an hydrological model.
Multi-lingual classification of social media postings
SMFR is designed to work across multiple languages. The main processing that we do to messages is to determinewhether they are relevant to flood risks/impacts or not. This is done through supervised classification, which requireslabeled data. However, to work across multiple languages in practice requires to be able to classify messages inlanguages for which we may not have labeled data yet.
Past research addressed cross-lingual bootstrapping of classifiers for natural disasters detection on twitter (Middletonet al. 2013) relying on automatic translation to use available models. Previous works, such as Li et al. (2018) hasshown how an approach based on word embeddings works better than a simpler method based on bag-of-wordswhen generalization is critical, including our case which requires generalizing across languages. Khare et al. (2018)built a statistical-semantic classification model with semantics extracted from BabelNet and DBpedia and comparedrelevancy classifiers with datasets translated into a single language, as well as with cross-lingual datasets. Theyhave shown how adding semantics increases cross-lingual classification accuracy.
Our work, in contrast, does not require semantic resources, we only leverage on word embeddings for multi-lingualmodelling as demonstrated by Luong et al. (2015). Indeed, we present and demonstrate two different ways in whichword embeddings can be used to perform multi-lingual classification: using language-agnostic word embeddingslearnt from a multi-lingual corpus (Pennington et al. 2014), and using multi-lingual word embeddings that arealigned across languages (Conneau et al. 2017). In both cases, we can use labeled data in a set of known languagesto bootstrap a classifier for a new language for which no labels are available.
ON-DEMAND DATA COLLECTION
The data collection should ideally achieve high recall, capturing a large fraction of the relevant information, while atthe same time having high precision, avoiding irrelevant information. Both goals usually enter into conflict andtrade-offs are necessary. Previous research has described extensively how data collection from Twitter is done(see, e.g., Imran, Castillo, Diaz, et al. 2015), in this section we focus on the specific aspects of our system, whichperforms on-demand data collection.
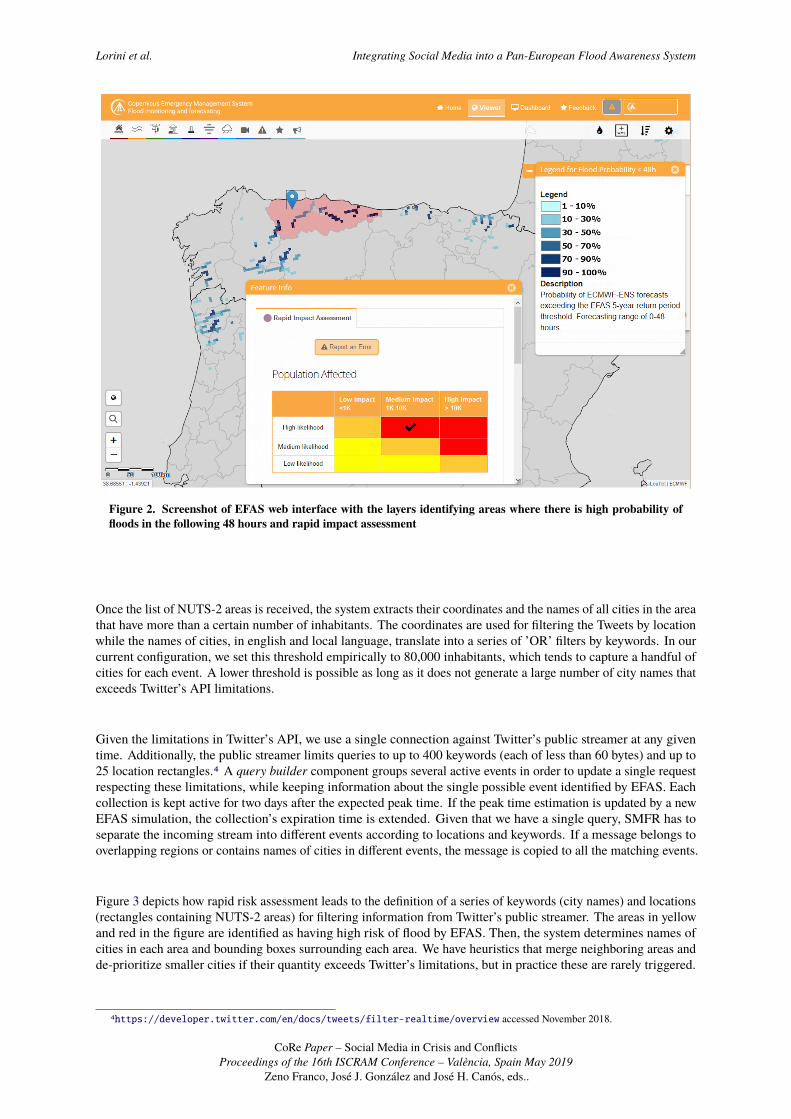
The key element of our data collection is its triggering mechanism which is done dynamically according to floodforecasts. EFAS runs two simulations per day, identifying NUTS-2 areas (typically regions or provinces) wherethere is a high probability of floods impacts in the following 48 hours as shown in figure 2.
CoRe Paper – Social Media in Crisis and ConflictsProceedings of the 16th ISCRAM Conference – València, Spain May 2019
Zeno Franco, José J. González and José H. Canós, eds..
Lorini et al. Integrating Social Media into a Pan-European Flood Awareness System
Figure 2. Screenshot of EFAS web interface with the layers identifying areas where there is high probability offloods in the following 48 hours and rapid impact assessment
Once the list of NUTS-2 areas is received, the system extracts their coordinates and the names of all cities in the areathat have more than a certain number of inhabitants. The coordinates are used for filtering the Tweets by locationwhile the names of cities, in english and local language, translate into a series of ’OR’ filters by keywords. In ourcurrent configuration, we set this threshold empirically to 80,000 inhabitants, which tends to capture a handful ofcities for each event. A lower threshold is possible as long as it does not generate a large number of city names thatexceeds Twitter’s API limitations.
Given the limitations in Twitter’s API, we use a single connection against Twitter’s public streamer at any giventime. Additionally, the public streamer limits queries to up to 400 keywords (each of less than 60 bytes) and up to25 location rectangles.4 A query builder component groups several active events in order to update a single requestrespecting these limitations, while keeping information about the single possible event identified by EFAS. Eachcollection is kept active for two days after the expected peak time. If the peak time estimation is updated by a newEFAS simulation, the collection’s expiration time is extended. Given that we have a single query, SMFR has toseparate the incoming stream into different events according to locations and keywords. If a message belongs tooverlapping regions or contains names of cities in different events, the message is copied to all the matching events.
Figure 3 depicts how rapid risk assessment leads to the definition of a series of keywords (city names) and locations(rectangles containing NUTS-2 areas) for filtering information from Twitter’s public streamer. The areas in yellowand red in the figure are identified as having high risk of flood by EFAS. Then, the system determines names ofcities in each area and bounding boxes surrounding each area. We have heuristics that merge neighboring areas andde-prioritize smaller cities if their quantity exceeds Twitter’s limitations, but in practice these are rarely triggered.
4https://developer.twitter.com/en/docs/tweets/filter-realtime/overview accessed November 2018.
CoRe Paper – Social Media in Crisis and ConflictsProceedings of the 16th ISCRAM Conference – València, Spain May 2019
Zeno Franco, José J. González and José H. Canós, eds..

Lorini et al. Integrating Social Media into a Pan-European Flood Awareness System
Figure 3. Example depicting areas in which EFAS forecasts high risk, which appear in yellow and red color. Eacharea defines a set of keywords, which are names of cities, and locations, which are bounding boxes (rectangles).These keywords and locations are used to gather information from Twitter.
MULTI-LINGUAL CLASSIFICATION
The setting used was supervised binary classification. The positive class comprised all messages indicating that “aflood has just happened or is about to happen” while the negative class included all other messages.
Training data was labeled using crowdsourcing platform GetHybrid (https://gethybrid.io/). The amount oflabeled data comprises over 7,000 annotated messages, each one annotated by three annotators independently. Fourtraining datasets were created, containing labeled tweets in German, English, Spanish, and French. Each languageincludes between 1,200 and 2,300 annotated messages, as shown in Table 1 (column “TL” for Total Labeled) in thesection describing the experiments. This amount of data is typical in automatic classification tasks (Imran, Castillo,Diaz, et al. 2015).
Convolutional Neural Networks
We tested a number of learning algorithms, including Support Vector Machines (Joachims 1999), which have beenshown to be effective for a number of general text classification tasks, and Random Forests, which have been shownto be effective specifically for classifying crisis-related Twitter messages (Imran, Castillo, Lucas, et al. 2014). Inboth cases, we represented messages as bag of word unigrams and bigrams, and the performance was better thansimpler methods such as a naïve Bayes classifier or a decision tree.
A comparatively newer approach for text classification that has proven to be quite effective is the use of ConvolutionalNeural Networks (CNN). These have been employed for a number of tasks including sentiment analysis (Severynand Moschitti 2015).
There are four main operations in every Convolutional Neural Network:(i) Convolution; (ii) Non Linearity, RectifiedLinear Unit (ReLU); (iii) Pooling or Sub Sampling;(iv) Classification (Fully Connected Layer). The primarypurpose of (i) Convolution is to extract features from the input using a filter smaller in size than the original input.The second (ii) operation ReLU replaces all negative values in the feature map by zero. The (iii) Pooling operation, max pooling in our case, reduces dimensionality by taking the largest element from the rectified feature mapwithin a neighborhood. The (iv) Classification operations, after a series of iteration of the (ii) and (iii) then uses thehigher-level features identified to deter a class using several fully connected perceptrons layers.
A Support Vector Machine (SVM) is a classifier defined by a separation hyperplane. Input of the algorithm is thelabeled training data, while its output is an optimal hyperplane which places new data into distinct classes.
CoRe Paper – Social Media in Crisis and ConflictsProceedings of the 16th ISCRAM Conference – València, Spain May 2019
Zeno Franco, José J. González and José H. Canós, eds..

Lorini et al. Integrating Social Media into a Pan-European Flood Awareness System
Random forest classifiers infer a series of decision trees from randomly selected subset of the labeled data. Theresults are then passed through different decision trees to finally classify the test data.
The specific architecture we used is described in the next section; using it, we performed various experiments using10-20 epochs of training (passes over the entire training set in randomised order).
The results were similar in performance to the SVM and Random Forests. However, manual error analysis showedthat qualitatively these errors were different. While in the case of SVM and Random Forests a misclassification,such as a false positive, is usually the result of a word marking flood relevance (e.g., "flood") used in a completelydifferent context (e.g., "my timeline is flooded with messages"), in the case of the neural network we used amisclassification was often semantically related to floods, such as a message referring to the effects of other naturaldisasters. The lesson learned from these experiments was that neural networks are better in this problem at capturingsemantic characteristics that are relevant for our task of distinguishing flood-related messages.
Neural Network Architecture
Current implementations of convolutional neural networks for text processing tasks tend to have a similar architecture.They consist of an input layer, a word embedding layer, a series of convolutional and max pooling layers, a denselayer, and an output layer (Liao 2016).
The input layer holds a padded sequence of words with a maximum length S = 100 words, which is more thansufficient for tweets considering their maximum length is 280 characters.
The word embedding layer converts every word into a low-dimensional vector, typically in the order of a few hundreddimensions (e.g., D = 200 or D = 300). We used two sources of pre-trained word embeddings, as described inthe next section. For each pre-trained word embedding, we considered two configurations-ups: one in which theparameters of the pre-trained word embedding were fixed, i.e., not modifiable while training the neural network,and one in which they were part of the optimization process, i.e., modifiable while training. In our experiments,best results were obtained when these parameters were fixed, probably because the amount of flood-specific datathat we are using for training is small in comparison with the corpora used to create these word embeddings. Theresults we report on this paper use fixed word embeddings.
The convolution layers collect several word embeddings representing adjacent words and “summarize” them into asingle vector. The main parameter for the convolutions is the width C, which is how many adjacent words to takeinto account. In the text "flood warning due to heavy rain" using C = 5, there are two possible convolutions: “floodwarning due to heavy” and “warning due to heavy rain.” The parameter C is determined considering what is theeffect of the context on the meaning of a word, and C = 5 is a typical value. We did not observe any increase inperformance with a larger value of C, while a smaller value of C may lose contextual information.
The max pooling layer collect a series of m disjoint convolutions as input, and generate a vector of dimension d < Das output. The max pooling step operates differently from the convolution layers in the sense that the windows ituses are disjoint, i.e., non-overlapping. The purpose of this layer is to reduce the dimensionality of the network forcomputational purposes and to reduce the chances of overfitting. In our case we used m = 5 and d = 128, which aretypical parameters used in text classification.
The final layer is a densely-connected (complete) layer. All the neurons in the last max pooling layer are connectedto all the neurons in this dense layer, and all the neurons in this dense layer are connected to the two output neurons.One of the two output neurons should activate when the example is positive (i.e., a message indicating that a floodhas just happened or is about to happen), and the other output neuron should activate when the example is negative(i.e., the message does not indicate that a flood has just happened or is about to happen).
Word Embeddings for Multi-Lingual Classification
The usage of word embeddings allows to incorporate multi-lingual capabilities in two ways: by using language-agnostic word embeddings and by using language-aligned word embeddings.
Our source of language-agnostic word embeddings is GloVe (Pennington et al. 2014), which are vectors ofdimensionality 200 obtained from a large corpus of tweets containing 27 × 109 tokens (1.2 million of them unique).While these word embeddings were not developed for multi-lingual tasks, they do incorporate any word present ona tweet in a language-agnostic manner.
Our source of language-alignedword embeddings isMUSE (Conneau et al. 2017), which are vectors of dimensionality300 obtained from various snapshots of Wikipedia in various languages. For each language, vectors for the 200,000
CoRe Paper – Social Media in Crisis and ConflictsProceedings of the 16th ISCRAM Conference – València, Spain May 2019
Zeno Franco, José J. González and José H. Canós, eds..

Lorini et al. Integrating Social Media into a Pan-European Flood Awareness System
most frequent tokens are provided, and these vectors have been aligned across languages using parallel lists of tensof thousands of words. In the resulting embeddings, two words with the same meaning in different languages aremapped to similar vectors.
In our experiments, presented on the next section, both pre-trained sets of vectors allow to transfer an automaticclassifier learnt with labeled data from one language (or a set of languages) into another language with no newlabeled data (“cold start”) or with a limited amount of labeled data (“warm start”).
AGGREGATION AND SELECTION
In our integration with EFAS, flood risk is established by an hydro-meteorological model and our task is to addcomplementary information that brings a better understanding of the situation on the ground. Relevant messagesare mapped to NUTS-2 areas (Nomenclature of Territorial Units for Statistics, Level 2) either by using explicitcoordinates which are rarely present in tweets, or more often, via a text-based geocoder. Geocoding deals withmessages that do not include explicit geographical coordinates, but mention a place name such as landmark orcity. Geocoding uses a Named Entity Recognition tagger to obtain possible locations in a text considering thesyntax of the message. It uses a gazetteer in a large database of place names with their corresponding geographicalcoordinates, and finally it uses a neural networks to infer the correct country and correct gazetteer entry for thoseplaces. We used a library named Mordecai (Halterman 2017) which extracts place names from a piece of text,resolve them to the correct place, and return their coordinates and structured geographic information.
Messages are aggregated at the level of an event, but also at the level of each NUTS-2 area. In both cases, one keyoperation is to select a representative sub-set of messages. We do this operation by using the following efficientheuristic based on de-duplication and text centrality:
1. Select up to 5,000 tweets having at least a 90% probability of being flood-related; if there are more than5,000 tweets, select the ones with the highest probability
2. Compute similarities between these tweets
(a) Consider only pairs having probabilities of being flood-related that differ at most by 0.0001, exploitingthe fact that near-duplicate tweets will be given the same probability by the neural network
(b) Compute edit distance and use it to compute normalized similarity: 1 − `(m1,m2)/(|m1 | + |m2 |) where`(m1,m2) is the edit distance between the two messages and |m1 | + |m2 | the sum of their lengths.
(c) If the normalized similarity is greater than 0.8, use the timestamps of the tweets to mark the newer tweetas a duplicate of the older tweet
3. Sort all unique tweets by their multiplicity, i.e., by the number of duplicates they have, and keep the top 100
4. For these tweets, compute all pair-wise similarities using the same formula as above, and add the similaritiesfor every tweet; this is the centrality of the tweet.
Step 1 of the heuristic has the goal of removing messages that are irrelevant. Step 2 removes near-duplicates whichare redundant, but keeps track of how many near-duplicates a tweet has, for the purposes of using redundancy as asignal of importance. Step 3 applies a well-known lexical centrality heuristic (Erkan and Radev 2004), in which asalient message is one that has content in common with many other messages.
Figure 4 shows a first deployment of SMFR on EFAS web interface, it describes how the areas and their mostrelevant tweets are presented to EFAS users. The NUTS-2 area can be grey (low activity), orange (medium activity)or red (high activity) according to the ratio between numbers of annotated tweets. The triggering that lead to thecreation of the collection depicted can be seen in figure 2
EXPERIMENTAL RESULTS
We describe two types of experimental results. First, we perform experiments to test the performance of themultilingual-classifier, comparing it with a mono-lingual classifier. Second, we show a real example of an actualflood event, describing the performance of the on-demand collector, of a multi-lingual classifier that does not uselabeled data from the target language, and of the aggregation and selection method.
CoRe Paper – Social Media in Crisis and ConflictsProceedings of the 16th ISCRAM Conference – València, Spain May 2019
Zeno Franco, José J. González and José H. Canós, eds..

Lorini et al. Integrating Social Media into a Pan-European Flood Awareness System
Figure 4. Screenshot of EFAS web interface with the layer identifying areas where there is high tweet activity andtheir most representative tweets on the right side. The basemap has been darkened for better visualization
Multi-Lingual Classifier
The multi-lingual classifier provides a solution for bootstrapping classifiers in new languages based on labeled datafor other languages. The aim of the experiments is to compare the classifiers trained with and without labeled datafor a specific target language. Performing this evaluation, nevertheless, requires having labeled data to measureeffectiveness parameters.
For these experiments we use four labeled sets of flood-related tweets in German (DE), English (EN), Spanish (ES)and French (FR). These were labeled by crowdsourcing workers via crowdsourcing as previously described; thequestion the annotators had to answer was “is this message indicating that a flood is happening or about to happen?”Hence, positive examples are the ones that are related to flood risk and impact, and negative examples are the onesthat are not.
For each language and word-embedding source we performed three experiments: mono-lingual, cold-start, andwarm-start. We used two thirds of the labeled data for training the classifiers and the remaining third for testing. Wekeep the testing portion fixed across experiments.
In the mono-lingual experiment we simply use labeled data in one language to predict the label for messages in thesame language. In the cold-start experiment we train a classifier for a new language using only labeled data forother languages; for instance for automatically labeling tweets in Spanish, we use a classifier trained on labeled datafor English, German, and French. In the warm-start experiment we use a set-up similar to the one of the cold-startexperiment, but we add a limited number of messages (300) labeled in the target language. Each experiment is doneonce using GloVe embeddings and once using MUSE embeddings. We report precision, recall, and F-measure foreach experimental setup in Table 1.
Table 1 reports values for Precision (P) , Recall (R) and F-measure. We also include the total number of tweetsmanually labeled by crowdsourcing workers (TL) and its percentage of positive (Pos.) tweets. Collections forGerman, English, Spanish, and French consider tweets posted during floods happening in the last two years inGermany, the UK, Spain and Mexico, and France respectively. Hence, the number of labeled tweets and thepercentage of positive examples differ across languages.
All the results show the same pattern: the mono-lingual classifier performs best, as expected; the cold-start classifier(which does not use any labeled data in the target language) suffers from a loss mostly of precision, but also of recall;
CoRe Paper – Social Media in Crisis and ConflictsProceedings of the 16th ISCRAM Conference – València, Spain May 2019
Zeno Franco, José J. González and José H. Canós, eds..

Lorini et al. Integrating Social Media into a Pan-European Flood Awareness System
Table 1. Classification results for four languages (German, English, Spanish, and French). TL indicates the totalnumber of labeled messages, while Pos. indicates the percentage of those who were labeled as flood-related. P,R, and F indicate Precision, Recall, and F-Measure respectively. We report the performance of a mono-lingualclassifier, of a cross-language classifier with “cold start” (uses no training data in the target language), and of across-language classifier with “warm start” (uses 300 labeled items in the target language).
Glove embeddings MUSE embeddingsmono-lingual cold-start warm-start mono-lingual cold-start warm-start
TL Pos. P R F P R F P R F P R F P R F P R F
DE 2356 46% 0.95 0.82 0.87 0.59 0.85 0.70 0.93 0.8 0.86 0.88 0.85 0.87 0.54 0.82 0.65 0.89 0.80 0.84EN 1999 20% 0.79 0.63 0.70 0.59 0.49 0.54 0.67 0.51 0.58 0.64 0.68 0.66 0.33 0.50 0.40 0.58 0.28 0.38ES 1592 48% 0.80 0.78 0.79 0.61 0.75 0.67 0.71 0.83 0.77 0.70 0.84 0.77 0.62 0.69 0.65 0.68 0.89 0.77FR 1248 40% 0.74 0.72 0.73 0.50 0.46 0.48 0.62 0.77 0.69 0.69 0.75 0.72 0.44 0.86 0.58 0.59 0.72 0.65
and the warm-start classifier (which involves annotating a small number of tweets in the target language) has betterperformance than the cold-start classifier both in terms of precision and recall. Indeed, the warm-start classifieroften achieves an F-measure that is comparable to the one of the mono-lingual classifier. Regarding the choice ofword embeddings, results suggest that the performance using GloVe or MUSE embeddings are comparable.
In general, considering the combination of the information from the classification with the known locations fromthe EFAS forecasts, the classification performance is sufficient to extract representative tweets from an event and tomap approximately the affected locations, as we demonstrate next.
Case Study: Calabria Floods in October 2018
In early October 2018, floods affected the region of Calabria in southern Italy. At least 2 people died in flashflooding after severe weather which peaked on October 5th. A mother and her seven year old son, who were sweptaway by flood waters in their car, were found in a river near Lamezia Terme, between the towns of San Pietro aMaida and San Pietro Lametino in Calabria. Other areas of Calabria were also hit by flooding and landslides.
Several families were forced to evacuate their homes and people were rescued after they climbed onto the rooftopsof houses to escape the flooding.5 Italian news agency ANSA, stated that the Ponte delle Grazie bridge on provincialhighway 19 in the area collapsed during the storms (Redazione ANSA 2018). Vigili del Fuoco, ItalyâĂŹs NationalFirefighters Corps, reported major flooding in Ciro Marina, Petilia de Policastro, Strongoli, Cotronei and Isola diCapo Rizzuto. As shown in Figure 5 (a) more than 300 mm of rain fell in 3 days (Schiaroli 2018).
EFAS forecasted a potential flood in the Calabria NUTS-2 area on the 4th of October with a predicted peak time ofthe event for the following day. As planned, SMFR triggered a collection with a duration of 2 days that was laterextended for an additional day due to persistence of the signal from EFAS forecasts. We analyzed the collectiononce it was stopped, at midnight on the 7th of October, after collecting 14,347 tweets.
In order to confirm what emerged from experiments in the previous section, we trained two classifiers for messagesin Italian, the first (cold-start) using only labeled data in German, English, Spanish, and French, and the second(warm-start) adding 300 manually labeled tweets in Italian from the collected dataset. For brevity we present resultsobtained using the GloVe embeddings (results using MUSE embeddings are similar).
In Figures 5 (b) and (c) we depict the position of geo-located tweets annotated by the cold-start and warm-startclassifier respectively. Tweets have been filtered using a relevance to flood (label predicted) greater or equal to 0.8.We include the tweets geolocated within the bounding box used for triggering the collection, resulting in 2,847tweets for the cold-start scenario against 3,857 for the warm-start scenario. For visualization purposes, tweetsgeo-located to the exact same location are randomly scattered by a small amount in the map.
Figure 5 confirms the results from the experiments, in the sense that both cold-start and warm-start classifiers areable to classify relevant tweets, with an advantage for the warm-start classifier in the sense that it identifies morerelevant tweets and has better coverage of the areas affected by heavy rainfall. This suggests that the cold-startmethod can provide a first approximation for identifying an ongoing event, while the warm-start method yieldsmore precise and relevant tweets.
Finally, Table 2 shows samples of tweets that have been selected as the most representative for this event, followingthe heuristic described previously, and taking as input the tweets found relevant using the cold-start and warm-startmethods. We can see that in the cold-start scenario the most representative tweets are relevant to the event considered.However, the warm-start scenario gives more informative messages. While tweets selected by the cold-start classifier
5Data provided by floodlist.com, which is a EU-supported project providing reports on past floods.
CoRe Paper – Social Media in Crisis and ConflictsProceedings of the 16th ISCRAM Conference – València, Spain May 2019
Zeno Franco, José J. González and José H. Canós, eds..

Lorini et al. Integrating Social Media into a Pan-European Flood Awareness System
(a) Rainfall (b) Tweets, cold start (c) Tweets, warm start
Figure 5. Comparison of (a) rainfall, (b) tweets located by cold-start model, and (c) tweets located by warm-startmodel. Data from floods in Calabria, Italy, 2-5 October 2018. Tweets falling in the same location are randomlyscattered for visualization purposes.
are relevant, they mostly just confirm the event as reported in the news; in constrast, the tweets selected in thewarm-start case identify a message from the Italian Prime minister as the most representative (“I follow with concernthe evolution of events ...”) and include information about damages and casualties due to the flood.
Table 2. Representative tweets selected by cold-start and warm-start. Conf. is the confidence of the classifier. Mult.the multiplicity (number of near-duplicates of the tweet). Cent. is the centrality (number of closely related but notduplicate tweets).
Cold-start
Conf. Mult. Cent. Text (first ∼10 words)
1.0 87 89 Second flood in Calabria in 40 days. Devastation and 2 casualties ...(Seconda inondazione in Calabria in soli 40 giorni. Devastazione e 2 vittime ...)
1.0 11 93 Bad weather in Calabria, the kennel is flooded ...(Maltempo in Calabria, il canile e 'sommerso dall' acqua ...)
1.0 7 94 Bad weather: Red alert in Calabria today and in Puglia tomorrow ...(Maltempo: oggi allerta rossa in Calabria e domani in Puglia ...)
1.0 5 97 Meteo, panic in Calabria: streams flooding roads. Rescuers using rubber boats ...(Meteo, caos in Calabria: torrenti esondati e strade allagate. Soccorsi in gommone ...)
1.0 5 87 Bad weather in Calabria, missing mother and her two sons found dead ...(Maltempo Calabria, trovati morti mamma e due bimbi dispersi ...)
Warm-start
Conf. Mult. Cent. Text (first ∼10 words)
1.0 194 76 I follow with concern the evolution of events in #Calabria ...(Seguo con apprensione l ' evolversi degli eventi in #Calabria ...)
1.0 194 88 Water bomb in Calabria, among the upset in the population ...(Bomba d ' acqua in Calabria, tra la popolazione sconvolta ...)
1.0 14 46 # breakingnews Bad weather Calabria: a woman and one of her son found dead. ...(#ultimora Maltempo Calabria: morta una donna e suo figlio, disperso il fratello ...)
1.0 23 98 Bad weather in Calabria, mom and son found dead, missing 2yrs old brother ...(Maltempo in Calabria, morti mamma e figlio: sic erca il fratellino di 2 anni ...)
1.0 8 94 Bad weather, nigthmarish night in Calabria, Civil Protection: “High risk” ...(Maltempo, notte da incubo in Calabria, Protezione civile: “rischio vittime” ...)
CoRe Paper – Social Media in Crisis and ConflictsProceedings of the 16th ISCRAM Conference – València, Spain May 2019
Zeno Franco, José J. González and José H. Canós, eds..
Lorini et al. Integrating Social Media into a Pan-European Flood Awareness System
CONCLUSIONS AND FUTURE WORK
We have described how to integrate social media into the European Flood Awareness System (EFAS) to providevaluable signals augmenting flood risk information provided by this platform, by finding potentially relevant andrepresentative messages from flood-affected areas in the languages spoken in those areas. Our work provides asolution and methodology for integrating flood modeling and evidence from the ground in real-time for severalcountries, potentially providing information from local witnesses or local media to first responders. This uniquecombination of hydrological simulation forecasting and an automatic, immediate monitoring of the extent of theevent through social media without necessity to manually translating information, allows to shorten the responsetime, which is extremely precious in the very early stages of a flood. Moreover, during the development of an event,collected messages could be valuable to international rescue coordinators such as ERCC because they provideinsights about the local response, about whether alerts that have been issued by authorities, and about some ofthe concerns that those affected by a flood or a flood alert may have. The research also highlighted the need forhigh-recall data collection in which data in multiple languages is captured, and provided a methodology for dealingwith a new language, by bootstrapping a classifier with similar languages for which labeled data is available, usingeither language-agnostic or language-aligned word embeddings. Additionally, it was clear during the developmentof the project that naturally occurring data (i.e., actual messages posted during a flood in a particular country) arenecessary to build an accurate classifier and aggregator.
Limitations. Due to the nature of EFAS and its geographical domain (pan-European) we focused on languagespoken in the region, therefore we only tested the methodology proposed for indoeuropean languages. Theperformance with other languages remains to be studied.
At the time of writing, the described system is still in testing phase. After a period of internal evaluation, SMFRwill become operational and its results will be disseminated among EFAS Partners.
Future Work
As future research activities, one can envision a global system comprising dozens of languages used to augment theGlobal Flood Awareness System (GloFAS; http://www.globalfloods.eu/). One can also envision further steps in thedirection of using social media as a data source that can feed into a predictive model, using it not only for confirmingknown flood risks, but also for detecting new ones, particularly in areas where digital devices are prevalent butmeteorological stations and other physical sensors are scarce in comparison.
Reproducibility. Datasets and code for the experiments described on this paper will be available for researchpurposes at https://bitbucket.org/lorinivalerio/iscram_2019/.
ACKNOWLEDGMENTS
This job has been funded by an Exploratory Research grant made available by the Joint Research Centre of theEuropean Commission. Thanks to Gabriele Mantovani Banella and Sasa Vranic for helping in the development ofweb layers and web services for the integration of SMFR into the existing EFAS/GloFAS systems. Castillo thanksLa Caixa project LCF/PR/PR16/11110009 for partial support.
REFERENCES
Alfieri, L., Burek, P., Feyen, L., and Forzieri, G. (2015). “Global warming increases the frequency of river floods inEurope”. In: Hydrology and Earth System Sciences Discussions 12, pp. 1119–1152.
Brouwer, T., Eilander, D., Loenen, A. van, Booij, M. J., Wijnberg, K. M., Verkade, J. S., and Wagemaker, J. (2017).“Probabilistic flood extent estimates from social media flood observations”. en. In: Natural Hazards and EarthSystem Sciences 17.5, pp. 735–747.
Castillo, C. (2016). Big Crisis Data.Conneau, A., Lample, G., Ranzato, M., Denoyer, L., and Jégou, H. (2017). “Word Translation Without ParallelData”. en. In: arXiv:1710.04087 [cs].
Dottori, F., Kalas, M., Lorini, V., Wania, A., Pappenberger, F., Salamon, P., Ramos, M. H., Cloke, H., and Castillo, C.(2017). “Satellites, tweets, forecasts: the future of flood disaster management?” In: EGU General AssemblyConference Abstracts. Vol. 19, p. 13129.
Dottori, F., Kalas, M., Salamon, P., Bianchi, A., Alfieri, L., and Feyen, L. (2017). “An operational procedure for rapidflood risk assessment in Europe”. English. In: Natural Hazards and Earth System Sciences 17.7, pp. 1111–1126.
CoRe Paper – Social Media in Crisis and ConflictsProceedings of the 16th ISCRAM Conference – València, Spain May 2019
Zeno Franco, José J. González and José H. Canós, eds..

Lorini et al. Integrating Social Media into a Pan-European Flood Awareness System
Dottori, F., Salamon, P., Bianchi, A., Alfieri, L., Hirpa, F. A., and Feyen, L. (2016). “Development and evaluation ofa framework for global flood hazard mapping”. In: Advances in Water Resources 94, pp. 87–102.
EC (2016). Nomenclature of Territorial Units for Statistics. https://ec.europa.eu/eurostat/web/nuts/background/.
Erkan, G. and Radev, D. R. (2004). “Lexrank: Graph-based lexical centrality as salience in text summarization”. In:Journal of artificial intelligence research 22, pp. 457–479.
Halterman, A. (2017). “Mordecai: Full Text Geoparsing and Event Geocoding”. In: The Journal of Open SourceSoftware 2.9.
Imran, M., Castillo, C., Diaz, F., and Vieweg, S. (2015). “Processing social media messages in mass emergency: Asurvey”. In: ACM Computing Surveys (CSUR) 47.4, p. 67.
Imran, M., Castillo, C., Lucas, J., Meier, P., and Vieweg, S. (2014). “AIDR: Artificial intelligence for disasterresponse”. In: Proceedings of the 23rd International Conference on World Wide Web. ACM, pp. 159–162.
Joachims, T. (1999). “Svmlight: Support vector machine”. In: SVM-Light Support Vector Machine http://svmlight.joachims. org/, University of Dortmund 19.4.
Khare, P., Burel, G., Maynard, D., and Alani, H. (2018). “Cross-Lingual Classification of Crisis Data”. en. In: TheSemantic Web – ISWC 2018. Ed. by D. Vrandečić, K. Bontcheva, M. C. Suárez-Figueroa, V. Presutti, I. Celino,M. Sabou, L.-A. Kaffee, and E. Simperl. Vol. 11136. Cham: Springer International Publishing, pp. 617–633.
Li, H., Caragea, D., Li, X., and Caragea, C. (2018). “Comparison of Word Embeddings and Sentence Encodings asGeneralized Representations for Crisis Tweet Classification Tasks”. en. In: New Zealand, p. 13.
Liao,R. (2016).Convolutional TextClassifier.https://richliao.github.io/supervised/classification/2016/11/26/textclassifier-convolutional/.
Luong, T., Pham, H., and Manning, C. D. (2015). “Bilingual Word Representations with Monolingual Qualityin Mind”. In: Proceedings of the 1st Workshop on Vector Space Modeling for Natural Language Processing.Proceedings of the 1st Workshop on Vector Space Modeling for Natural Language Processing. Denver, Colorado:Association for Computational Linguistics, pp. 151–159.
Middleton, S. E., Zielinski, A., Tokarchuk, L. N., and Wang, X. (2013). “Social-media text mining and networkanalysis to support decision support for natural crisis management”. In: ISCRAM 2013. In collab. with S. E.Middleton, A. Zielinski, L. N. Tokarchuk, and X. Wang.
Musaev, A., Wang, D., and Pu, C. (2015). “LITMUS: AMulti-Service Composition System for Landslide Detection”.en. In: IEEE Transactions on Services Computing 8.5, pp. 715–726.
Palen, L. and Anderson, K. M. (2016). “Crisis informatics—New data for extraordinary times”. In: Science 353.6296,pp. 224–225.
Pennington, J., Socher, R., andManning, C. (2014). “GloVe: Global vectors for word representation”. In: Proceedingsof the 2014 conference on empirical methods in natural language processing (EMNLP), pp. 1532–1543.
Redazione ANSA (2018). Calabria Bad weather 201810. http://www.ansa.it/english/news/2018/10/05/mum- child- dead- as- extreme- weather- batters- south_dd387479- 55cb- 4249- ba69-09862501bef2.html/.
Restrepo-Estrada, C., Andrade, S. C. de, Abe, N., Fava, M. C., Mendiondo, E. M., and Albuquerque, J. P. de(2018). “Geo-social media as a proxy for hydrometeorological data for streamflow estimation and to improveflood monitoring”. en. In: Computers & Geosciences 111, pp. 148–158.
Schiaroli, R. (2018). Alluvione Calabria 201810. https://www.centrometeoitaliano.it/notizie-meteo/alluvione-calabria-2018-caduti-oltre-300-millimetri-di-pioggia-dal-2-al-5-ottobre-8-10-2018-67267/.
Severyn, A. and Moschitti, A. (2015). “Twitter sentiment analysis with deep convolutional neural networks”. In:Proceedings of the 38th International ACM SIGIR Conference on Research and Development in InformationRetrieval. ACM, pp. 959–962.
UN Office for the Coordination of Humanitarian Affairs (2017). “World Humanitarian Data and Trends”. In:Vieweg, S., Castillo, C., and Imran, M. (2014). “Integrating Social Media Communications into the RapidAssessment of Sudden Onset Disasters”. en. In: Social Informatics. Ed. by L. M. Aiello and D. McFarland.Vol. 8851. Cham: Springer International Publishing, pp. 444–461.
CoRe Paper – Social Media in Crisis and ConflictsProceedings of the 16th ISCRAM Conference – València, Spain May 2019
Zeno Franco, José J. González and José H. Canós, eds..