Embed Size (px)
Citation preview


VADILAL INDUSTRIES Q4 & FY17 Results Presentation

\ 28
Disclaimer
Certain statements in this document may be forward-looking statements. Such
forward-looking statements are subject to certain risks and uncertainties, like
regulatory changes, local political or economic developments, and many other
factors that could cause our actual results to differ materially from those
contemplated by the relevant forward-looking statements. Vadilal Industries will
not be in any way responsible for any action taken based on such statements and
undertakes no obligation to publicly update these forward looking statements to
reflect subsequent events or circumstances.
2

\ 28
Table of Contents
3
Q4 & FY17 Financial Performance
Financial Performance Trends
Vadilal Industries Overview
Outlook
04
10
15
25

Q4 & FY17 Performance

\ 28
Chairman’s Message
5
“We have delivered a stable operating and financial performance for the year under review despite some recent headwinds including currency demonetization that impacted consumer demand over a part of last year. We continue to see expansion in consumption of personalized packs and contribution to ice cream volumes is now about 69% of total sales. The exports business is seeing positive trends as our brand and products are gaining acceptance from the Indian diaspora. Revenue and margin contribution from exports is fully reflected in the consolidated reporting for the full financial year. We have seen increasing input costs that have affected margins. To manage the impact, we have increased product prices and efficiently managed raw material inventory. Stronger demand for our ice creams in the current summer season is expected to once again rationalize inventories. Our investments in technology and market penetration are also allowing us to closely monitor and expand returns on investments on the distribution network. We will continue to invest in expanding the distribution network this year and plan to have an installed base of 45,000 POS refrigerators at ice cream retail outlets across 16 Indian states. In addition, our export initiatives are supported by a growing base of distribution. In the last two years, we have also managed growth on significantly reduced debt and we will continue to focus on improving our debt leverage and focus on cash flow generation. We are on the path to build a strong Vadilal brand that is the consumer’s choice in India and targeted overseas markets.”
Commenting on Q4 & FY17 performance, Mr. Rajesh Gandhi, Chairman and Managing Director, Vadilal Industries Limited (VIL) said:

\ 28
Financials – Q4 & FY17 Performance
6
92.7 99.7
456.4 482.3
Q4 FY16 Q4 FY17 FY16 FY17
Revenue
Standalone financials in Rs. Crore
81.1 90.3
404.8 438.7
Q4 FY16 Q4 FY17 FY16 FY17
Ice Cream
11.3 9.2
51.1 43.1
Q4 FY16 Q4 FY17 FY16 FY17
Processed Foods
• In FY17, Revenues have improved by 5.7% y-o-y growth on account of 8.4% y-o-y higher revenues in Ice Cream business driven by 1.5% volume and 4.05% value.
• Revenues from Processed Foods division were subdued due to discontinuation of some lower margin products.

\ 28
Financials – Q4 & FY17 Performance
7
5.5 1.6
56.1 55.6
Q4 F
Y16
Q4 F
Y17
FY
16
FY
17
Ice Cream - PBIT
-1.7
-3.8
-6.6 -7.7
Q4
FY
16
Q4
FY
17
FY
16
FY
17
Processed Foods - PBIT
• PBIT of Ice Cream Business was stable y-o-y.
• The Company has undertaken an 4.5% price increase to offset the high input costs.
• Focus on expanding distribution across the country and in lucrative export markets to support growth prospects .
• Ice cream exports, which have been receiving encouraging demand, also utilize the common channel developed for foods business.
Standalone financials in Rs. Crore
\ 28
Financials – Q4 & FY17 Performance
8
6.3
-0.7
56.3 58.9
Q4 F
Y16
Q4 F
Y17
FY
16
FY
17
EBITDA
-3.1 -7.0
14.4 16.3
Q4F
Y16
Q4F
Y17
FY
16
FY
17
PAT
• Operating margins for FY17 were stable.
– Higher contribution from impulse purchases and individualized packs in Ice Creams division now contribute 72% by value.
– Impact of expanded organizational base .
• Continue to focus on debt reduction. Overall debt as on March 31st 2017 was stable at Rs. 151.5 crore compared to Rs. 148.3 crore as on March 31st 2016.
• Finance costs in FY17 lower by 27.8% y-o-y at Rs. 15.5 crore as compared to Rs. 21.4 crore in FY16.
• PAT for FY17 increased by 13.8% y-o-y on account higher Ice Cream sales leading to better utilization, improved product mix and lower finance costs.
Standalone financials in Rs. Crore

\ 28
Marketing initiatives – Thrust towards Premiumization
• Parineeti Chopra has been appointed brand ambassador for Vadilal over three years.
• Unveiled new products endorsed by the brand ambassador, with the expanded range being evaluated on an ongoing basis.
9

Financials Performance
Trends

\ 28
Financials Performance Trends
11
236.5 285.8 330.1 371.7 403.4 456.4 482.3
FY11 FY12 FY13 FY14 FY15 FY16 FY17
Revenue
38.9 48.1
60.2 73.9
62.3 51.1 43.1
FY11 FY12 FY13 FY14 FY15 FY16 FY17
Processed Foods
198.8 236.0 265.5 294.0
344.3 404.8 438.7
FY11 FY12 FY13 FY14 FY15 FY16 FY17
Ice Cream
Standalone financials in Rs. cr

\ 28
Financials Performance Trends
12
Consumer behavior is transitioning with increasing acceptance for western desserts. With improving consumer sentiment and stable input costs VIL is likely to maintain its growth trajectory. VIL is now reaping benefits of substantial investments in capacity, technology, brand and distribution. As volumes enhance, existing capacity gets utilized more efficiently and margins which were depressed in the past are improving.
25.1 36.8 40.5 39.1 40.9
56.3 58.9
0
20
40
60
80
FY
11
FY
12
FY
13
FY
14
FY
15
FY
16
FY
17
EBITDA
5.1 6.3 6.0
1.4 1.9
14.4 16.3
0
5
10
15
20
FY
11
FY
12
FY
13
FY
14
FY
15
FY
16
FY
17
PAT
Standalone financials in Rs. cr
\ 28
Financials Performance Trends – Balance Sheet
13
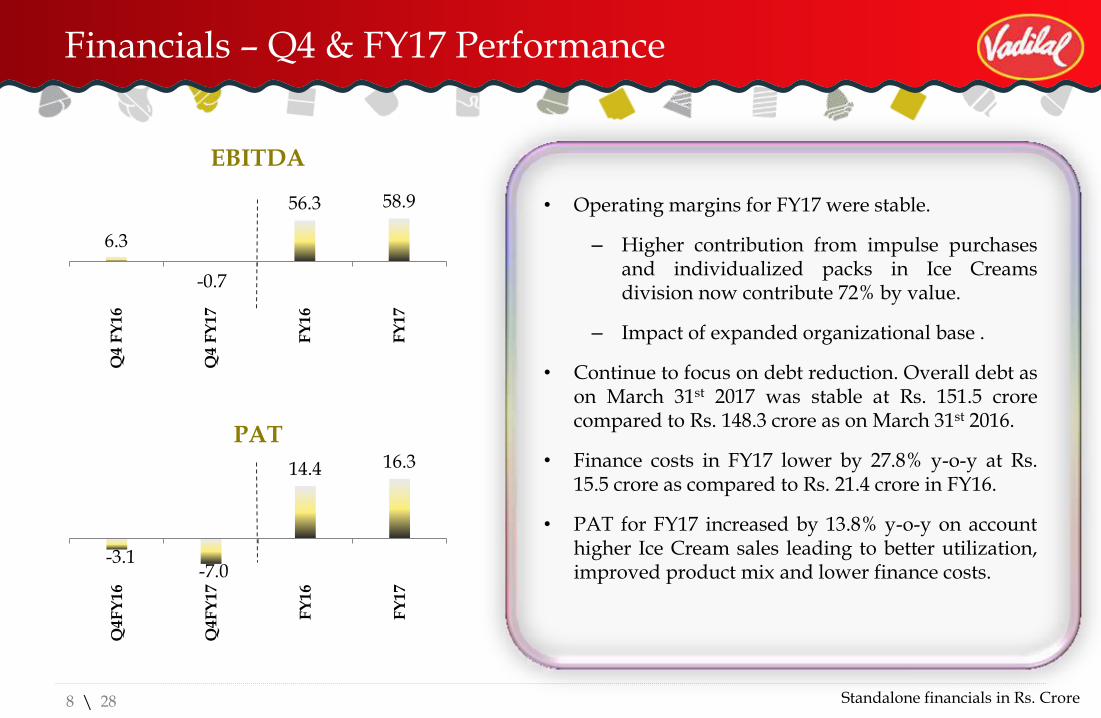
231.2
224.9 224.0
230.1
FY14 FY15 FY16 FY17
Net Fixed Assets
19.6 18.1 17 13.34
FY14 FY15 FY16 FY17
Other Non-Current Assets
15.2 16.5 21.6 21.6
FY14 FY15 FY16 FY17
Other Non-Current Liabilities
115.1 115.1 128.1 144.4
FY14 FY15 FY16 FY17
Networth
205.0 180.2
148.3 151.5
FY14 FY15 FY16 FY17
Debt
84.5 68.8
56..0 73.7
FY14 FY15 FY16 FY17
Net Current Assets
Standalone financials in Rs. cr
Lia
bil
itie
s A
ssets

\ 28
Financials Performance Trends – Cash Flows
14
56.6 51.7
62.2
28.5
FY14 FY15 FY16 FY17
Operating Cash flow
23.0
41.3
51.8
9.4
FY14 FY15 FY16 FY17
Free Cash Flow
Standalone financials in Rs. cr
• Inventory up by Rs.30 crore
• Interest down by Rs.5 crore to Rs. 15.5 crore in FY17
• Capex up by Rs.10 crore y-o-y

Vadilal Industries Overview
\ 28
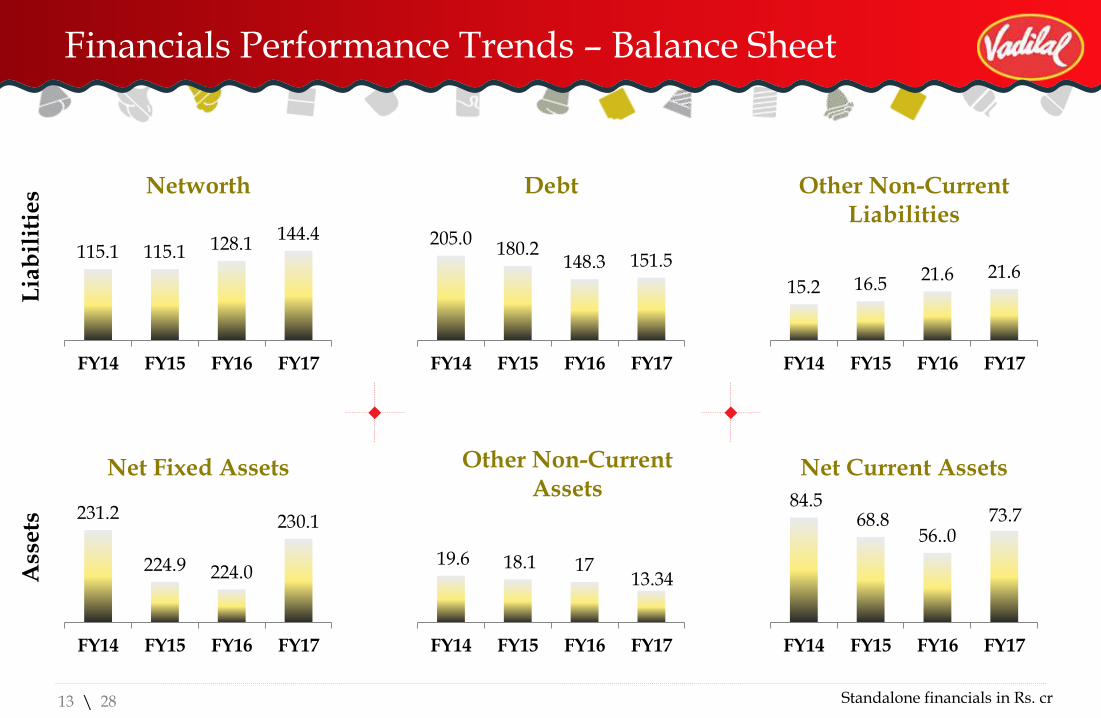
Overview
16
• Currently managed by fourth generation promoter family
• Selected India’s most trusted ice cream brand in 2013 and 2014 by the Brand Trust Report
• Top 3 ice-cream brand in the country, 150+ flavors
• 300 SKU’s of cones, candies, bars, ice lollies, cups, family packs, economy packs
• Leadership in Gujarat, Rajasthan, UP, Uttarakhand, Haryana and Chandigarh
• 16 states, 61 CNF’s, over 1200 distributors, 290 distribution vehicles, 45,000 +retail outlets
• Products reach 45 countries across four continents
• 70% contribution from exports in processed foods segment
\ 28
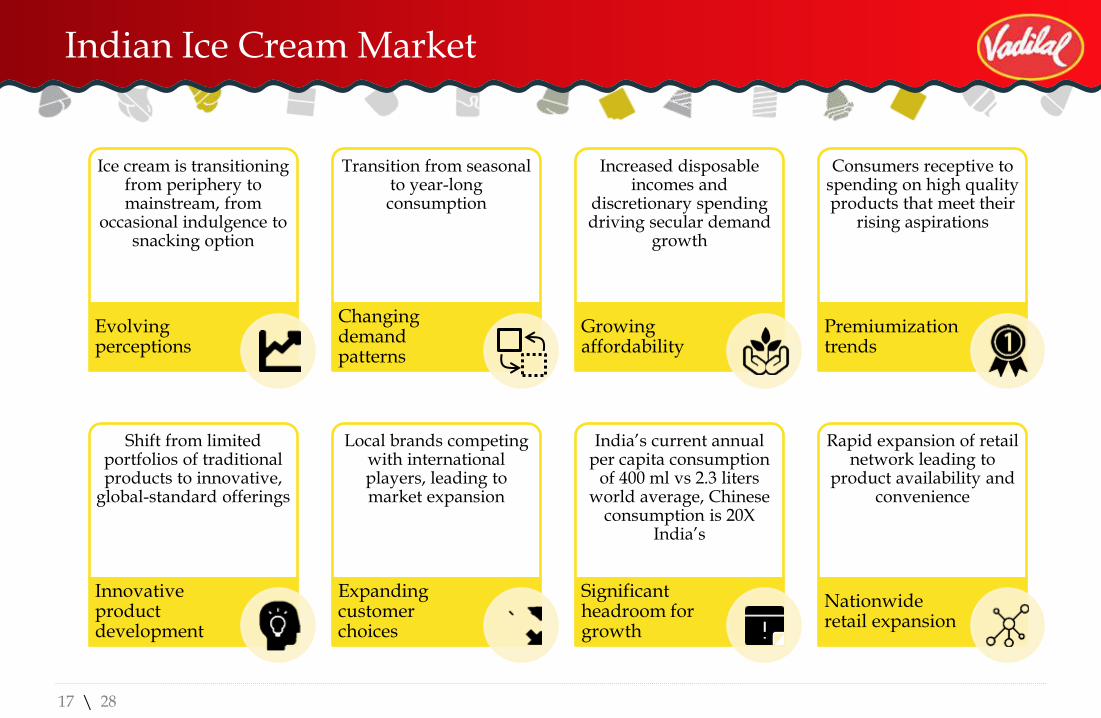
Indian Ice Cream Market
17
Ice cream is transitioning from periphery to mainstream, from
occasional indulgence to snacking option
Evolving perceptions
Transition from seasonal to year-long consumption
Changing demand patterns
Increased disposable incomes and
discretionary spending driving secular demand
growth
Growing affordability
Consumers receptive to spending on high quality products that meet their
rising aspirations
Premiumization trends
Shift from limited portfolios of traditional products to innovative,
global-standard offerings
Innovative product development
Local brands competing with international players, leading to market expansion
Expanding customer choices
India’s current annual per capita consumption
of 400 ml vs 2.3 liters world average, Chinese
consumption is 20X India’s
Significant headroom for growth
Rapid expansion of retail network leading to
product availability and convenience
Nationwide retail expansion
\ 28
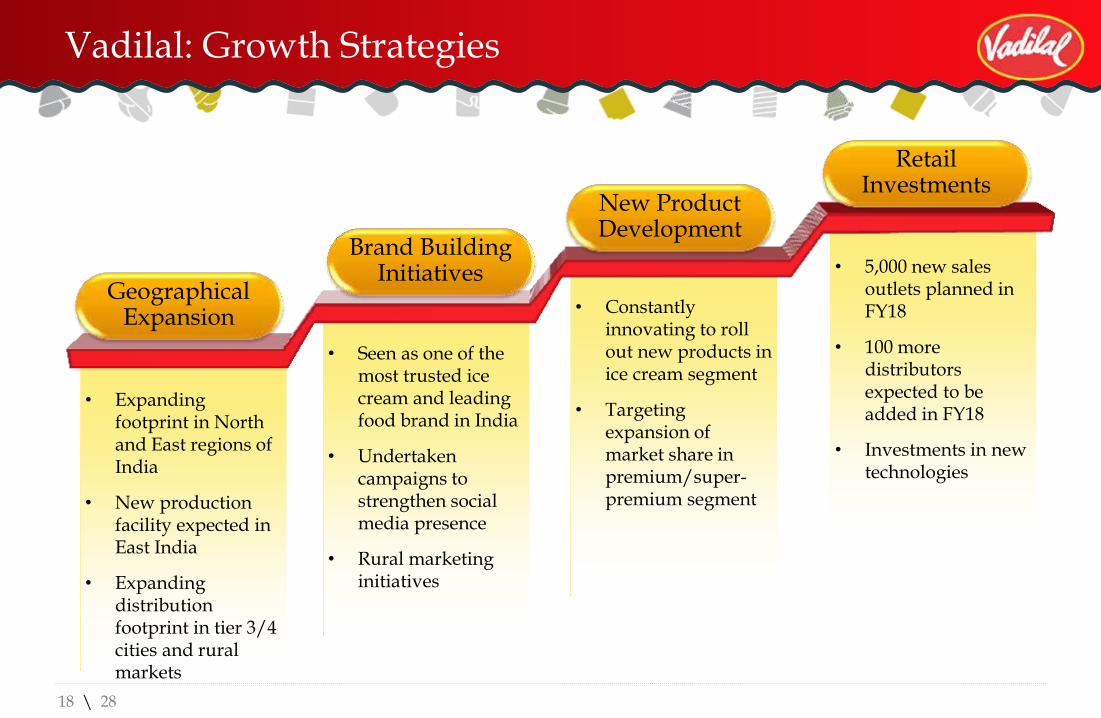
• Expanding footprint in North and East regions of India
• New production facility expected in East India
• Expanding distribution footprint in tier 3/4 cities and rural markets
• Constantly innovating to roll out new products in ice cream segment
• Targeting expansion of market share in premium/super-premium segment
• 5,000 new sales outlets planned in FY18
• 100 more distributors expected to be added in FY18
• Investments in new technologies
• Seen as one of the most trusted ice cream and leading food brand in India
• Undertaken campaigns to strengthen social media presence
• Rural marketing initiatives
Vadilal: Growth Strategies
18
Geographical Expansion
Brand Building Initiatives
New Product Development
Retail Investments
\ 28
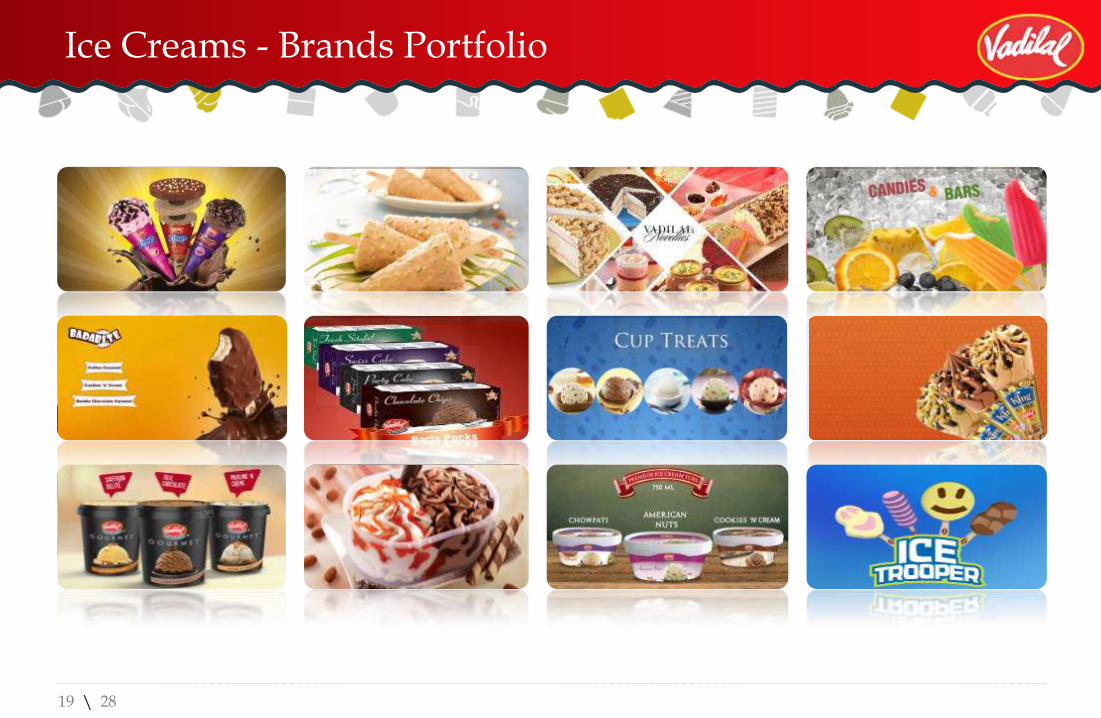
Ice Creams - Brands Portfolio
19

\ 28
Processed Foods Business
• Global business selling to 45 countries in four continents
• Strong distribution to Indian diaspora, being further developed
with new product launches
• Expanded export markets from 12 SKU’s supplied to seven
countries in 1991 to 100+ SKU’s to 45 countries currently
• Expanded domestic market from 18 SKU’s sold in Gujarat in
2000 to 75+ SKU’s available in five Indian states currently
– Vadilal Quick Treat brand has expanded presence to
Maharashtra/Mumbai
• Aggressively expanding frozen food line, exited from low
margin, mango pulp business
20
\ 28
Processed Foods - Brands Portfolio
21
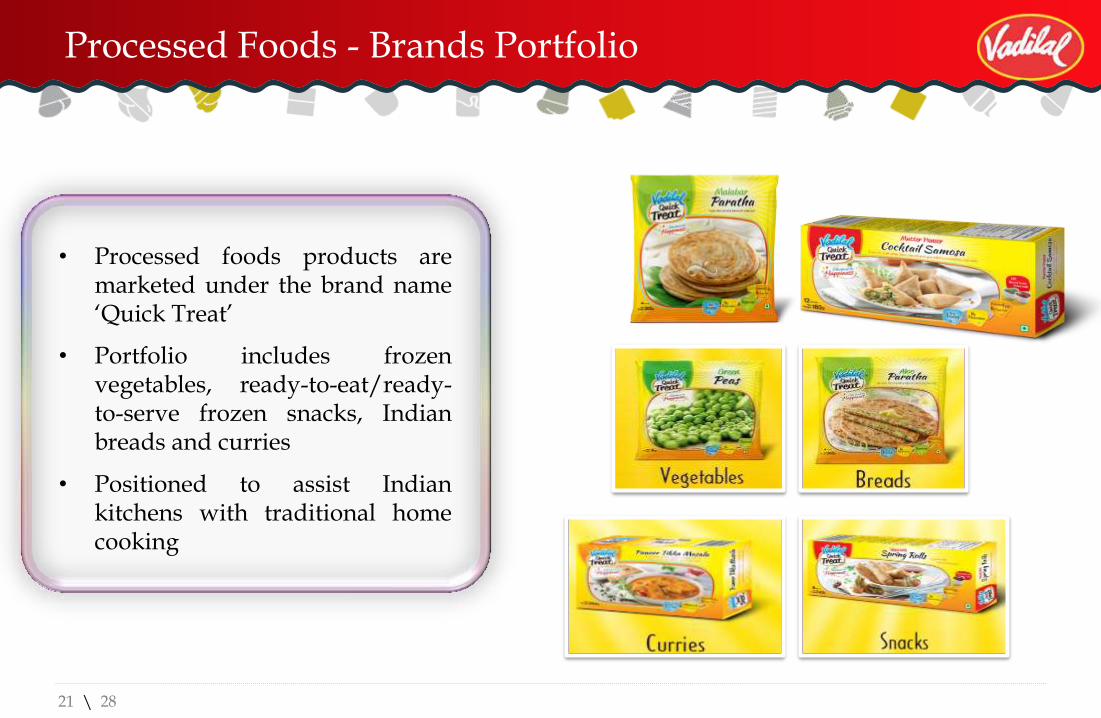
• Processed foods products are marketed under the brand name ‘Quick Treat’
• Portfolio includes frozen vegetables, ready-to-eat/ready-to-serve frozen snacks, Indian breads and curries
• Positioned to assist Indian kitchens with traditional home cooking

\ 28
Production Facilities
• Capacity expanded from 270,000 liters per day to 380,000 liters per day over the past few years
• Current production on automated processes “untouched by hand”, manual intervention only at packaging stage
• Focus on branded portfolio in Processed Foods Business
• No major capital expenditure anticipated on capacity enhancement for FY18
22
Facilities Capacity Production Certification
Bareilly 150,000 liters per day Ice cream ISO-22000:2005
Dharampur 33,000 kgs per day Processed foods ISO-22000:2005 and BRC : Issue 6
Pundhra 230,000 liters per day Ice cream ISO-22000:2005 and BRC : Issue 6
\ 28
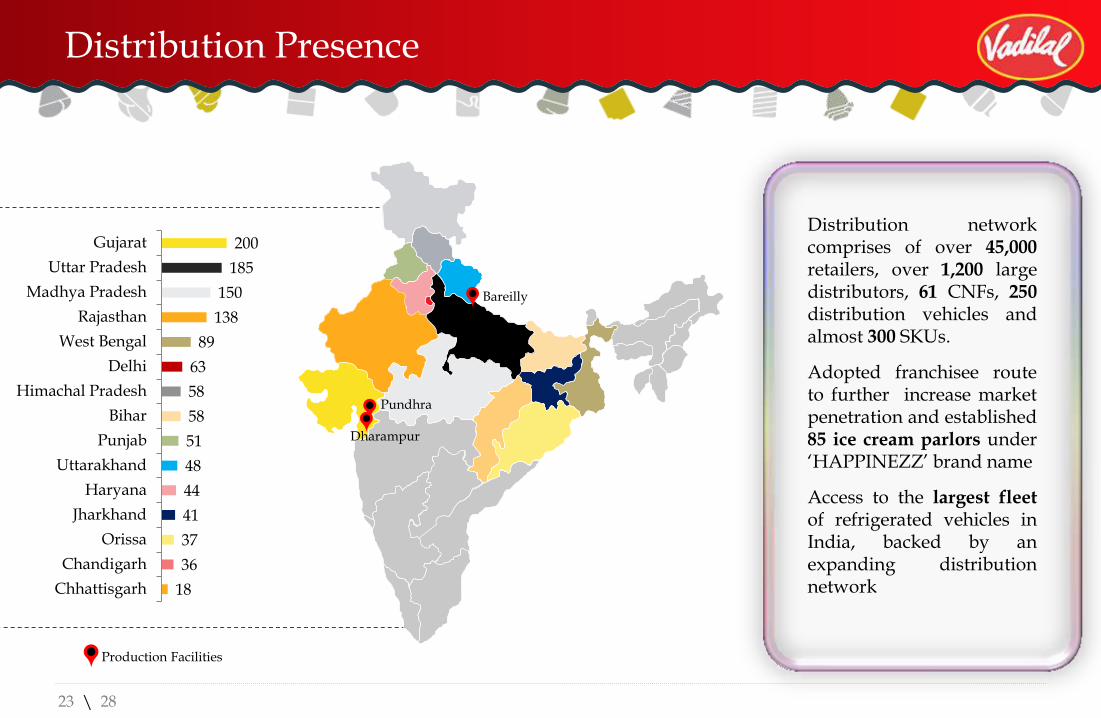
Distribution Presence
23
Distribution network comprises of over 45,000 retailers, over 1,200 large distributors, 61 CNFs, 250 distribution vehicles and almost 300 SKUs.
Adopted franchisee route to further increase market penetration and established 85 ice cream parlors under ‘HAPPINEZZ’ brand name
Access to the largest fleet of refrigerated vehicles in India, backed by an expanding distribution network
Production Facilities
Bareilly
Pundhra
Dharampur
18
36
37
41
44
48
51
58
58
63
89
138
150
185
200
Chhattisgarh
Chandigarh
Orissa
Jharkhand
Haryana
Uttarakhand
Punjab
Bihar
Himachal Pradesh
Delhi
West Bengal
Rajasthan
Madhya Pradesh
Uttar Pradesh
Gujarat
\ 28
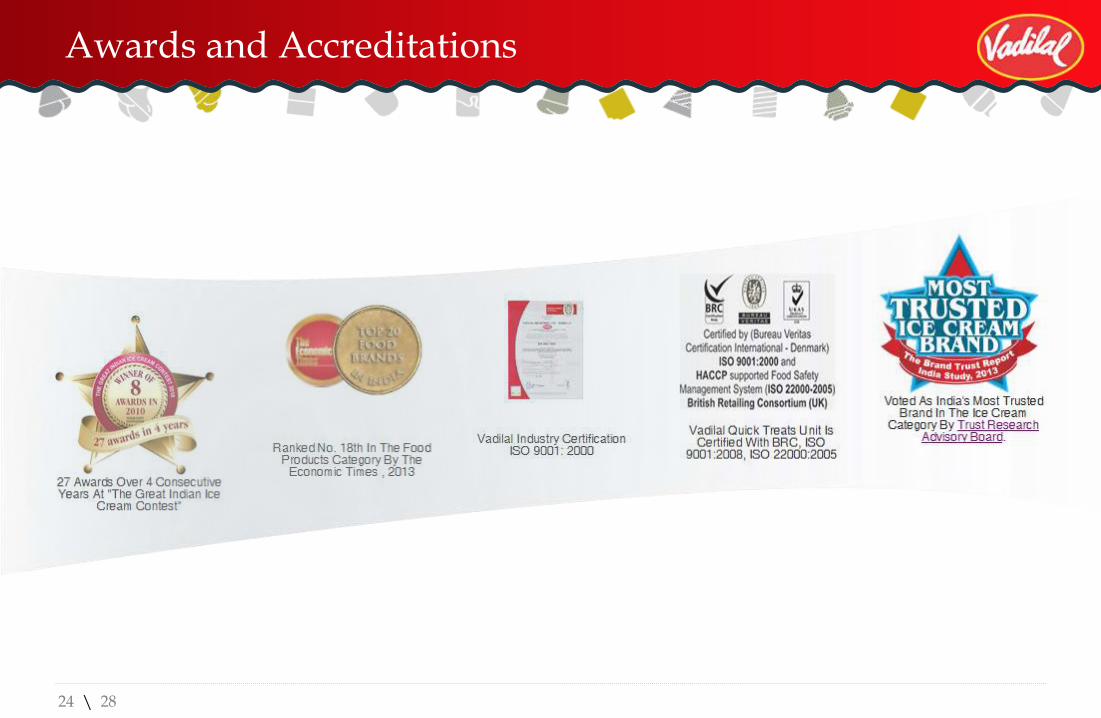
Awards and Accreditations
24

Outlook

\ 28
Planned Initiatives
26
Product Strategies
Focus on higher value products and targeting optimal margins –
higher sales of individualized packs and stable input and
distribution costs
Sales & Marketing push – accelerating new product
development and increasing spend on promotional activities
Expanding Presence
Presence across 16 states, 61 CNF’s, over 1,000+ distributors, 250 distribution vehicles, over
45,000 retail outlets
Increasing penetration – moving from passive to aggressive
business strategy to derive benefit from improving consumer
behavior
Supply Chain Initiatives
Aggressive expansion of sales generating assets/cold supply
chain – annual planned addition of ~5,000 deep freezers
Augmenting distribution management system that will allow micro-control over ROI from each business area and
point of sale unit
Over the last six years, ~Rs. 200 crore has been invested to expand capacity and related infrastructure,
planned initiatives to further leverage this investments

\ 28
Contact Us
27
6/5/2017 28
THANK YOU