Embed Size (px)
DESCRIPTION
YTD Land Sales Data. Real Estate Sales information for Summit County, Colorado; Including the local towns of Breckenridge, Frisco, Copper, Dillon, Silverthorne and Keystone.
Citation preview
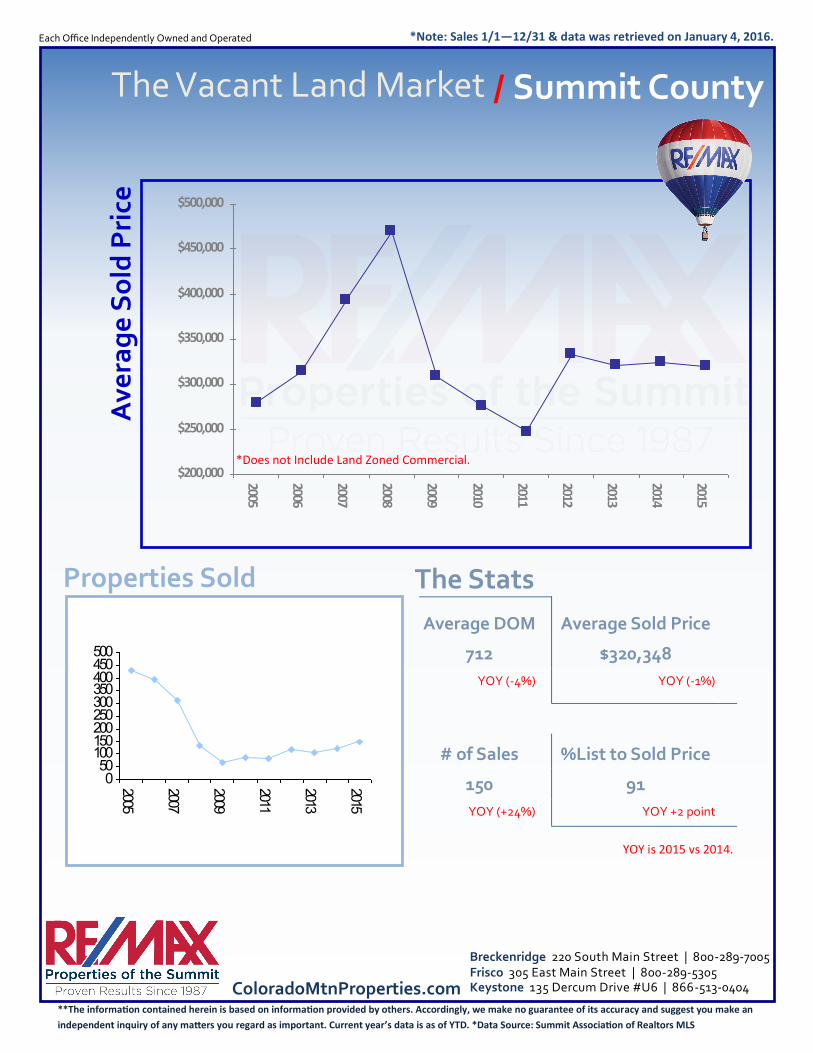
Summit County The Vacant Land Market /
Each Office Independently Owned and Operated
Frisco 305 East Main Street | 800-289-5305 Breckenridge 220 South Main Street | 800-289-7005
Keystone 135 Dercum Drive #U6 | 866-513-0404
**The information contained herein is based on information provided by others. Accordingly, we make no guarantee of its accuracy and suggest you make an
independent inquiry of any matters you regard as important. Current year’s data is as of YTD. *Data Source: Summit Association of Realtors MLS
ColoradoMtnProperties.com
Average DOM Average Sold Price
712 $320,348
YOY (-4%) YOY (-1%)
# of Sales %List to Sold Price
150 91
YOY (+24%) YOY +2 point
YOY is 2015 vs 2014.
Ave
rag
e S
old
Pri
ce
Properties Sold
050100150200250300350400450500
2005
2007
2009
2011
2013
2015$200,000
$250,000
$300,000
$350,000
$400,000
$450,000
$500,000
2005
2006
2007
2008
2009
2010
2011
2012
2013
2014
2015
The Stats
*Note: Sales 1/1—12/31 & data was retrieved on January 4, 2016.
*Does not Include Land Zoned Commercial.