Embed Size (px)
Citation preview

U\4 V/5r0 u CHlves OFtIIO7'
0091,le
~ s~-z

MaterialsResearch
Laboratory, One Science Road Area Code 512
I n c. Glenwood, Illinois 60425 * Locai telephone 755.8760* Chicago telephone 785-4020 U
CRACK ARREST TOUGHNESS OF 4140, 1340 AND 4340 STEEL
For
U. S. Armament Research and Development Command
Contract No. DAAK-10-80-C-0287
(MRL No. 792) pU
By UE. J. Ripling and P. B. Crosley
; ~~~~~November 11981 •.:••_-3-•
LL a
__ h3. ICJ,
Noveber q81 U 2i~~atecC'vmP=L
C-3 0

MaterialsResearch
Laboratory, One Science Road , Area Code 512
I n c /Glenwood, Illinois 60425 # Local telephone 755-8760# Chicago telephone 785-4020
CRACK ARREST TOUG-iNESS OF 4140, 1340 AND 4340 STEEL
For
U. S. Army Armament Research and Developmeit Command
Contract No. DAAK-10-80-C-0287
(MRL No. 792)
By
E. J. Ripling and P. B. Crosiey
November 1981

MaterialsResearch
L aboratorvInc
CRACK ARREST TOUGHNESS OF 4140, 1340 AND 4340 STEEL
For
U. S. Army Armament Research and Development Command
Contract No. DAI '-10-80-C-0287
(MRL No. 792)
By
E. J. Ripling and P. B. Crosley
November 1981 , ('cieS
*Ila /o

Maler iaisResearch
Laooratory,Inc
1.0 Introduction
Armament materials are generally used in structures that are
rapidly loaded, and, of course, this service condition must be con-
sidered when evaluating their fracture properties. Collecting initia-
tion toughness data at very high loading rates is difficult, however,
because of test machine and load cell vibrati'n. These problems can
be avoided by measuring crack arrest toughness, K rather than
rapid initiation toughness, because K is thought to represent theI! alower limit of toughness that is obtained with continuously increasing
loading rates.
In an earlier study, the crack arrest fracture toughness of
4140 and 4340 steel was measured as a function of yield strength and
(4)test temperature . The yield strength was varied over the range
of 140 to 180 ksi, and the temperature from -65 to +165F, the rangesof most interest for armament materials. Both materials were evalu-
ated with full-thick specimens using one-inch thick plates. In this
thickness, 4340 through hardens, while 4140 does not, so that the
toughness difference reported for these two materials was a result of
both composition and microstructure differences. The present study
was undertaken to add 1340 steel to the comparison. However, to
I avoid having mixed microstructures, the 1340 and two new heats of
1 4140 steel were heat treated in thinner sections so that they woud be
martensitic through their thickness.,
2.0 Materials and Heat Treatment
Two plates of 4140 were purchased, one 3/4 inch, and the
other ½ inch, thick. A plate of ½ inch thick 1340 was also supplied
by the Bethlehem Steel Company.
All plates were heat treated in 6 inch by 6 inch blanks as fol-
I lows: Normalize 16001F, 1 hr; Austenitize 15500F, 1 hr; oil quench
-:r
I

MaterialsRr7 (,,.,rch
150-175 0 F; and temper 4140 at 800OF and 1340 at 4nI0F, 1 hr. Spe-
cimen blanks were then retempered as needed to obtain the required
yield strengths.
3.0 Material Characterization
3.1 Chemical Composition and Microstructure
The chemical composition of the plates is shown in Table 1,
and their microstructures in Fig. 1. Unlike the case for the one inch
thick 4140 used in the earlier study, these heat treated blanks had a
uniform microstructure (and hardness) through the thickness.
3.2 Tensile Properties
In order to determine the tempering temperatures to be used
for obtaining the required values of yield strength, tensile specimen
blanks of the 4140 steel blanks were tempered at temperatures between
800 and 1100'F, and the 1340 steel blanks at temperatures between 700
amd 11001F. Tensile specimens (0.357 inch dia., in the TL orienta-
tion) were machined from the blanks and tested at room temperature.
These results are shown in Figs. 2, 3 and 4, and Tables 2 and 3.
The data show that for yield strengths of 140, 160 and 180 ksi, respec-
tively, the 4140 should be tempered at 950, 1000 and 11001F, and the
1340 at 750, 825 and 925 0F.
Because toughness tests were to be run at -65 and 165 0 F, as
well as room temperature, tensile tests were run at these temperatures
as well, Tables 4 and 5 and Figs. 5 to 8.
4.0 Crack Arrest Fracture Toughness Tests
In the earlier study on 4140 and 4340, specimens having three
different in-plane dimensions were used. Since this demor strated the
specimen insensitivity of the test, only one specimen shard was used in
IF- the present study for both the ½ and 3/4 inch thick specimens. The
specimen dimensions are shown in Fig. 9. The knife-edge had to be
modified from that used in ASTM Standard E399 so that the arms of the
j -2-

MaterialsResearch
LatoratoryInc
"displacement gage would be trapped. The modified knife edges are
also shown in Fig. 9.
All of the toughness data collected on " rogram are shown
in Tables 6 and 7.
4.1 Toughness vs. Test Temperature
The crack arrest toughness of 4140 in both thicknesses, and
1340 in ½ inch thickness is shown in Figs. 10 and 11 with yield strength
as the parameter. The 4340 data collected on one inch thick specimens
in the earlier study ere also plotted in this same fashion in Fig. 12.
If the data in these three charts are to be compared, it is necessary to
know whether or not they are all plane-strain values. In the present
proposed ASTM Standard on Crack Arrest Fracture Toughness Testing,
the size requirement for plane strain cracking is:
B 2 1.25 [K (a + o)12a ys 0
where
B = critical specimen dimensions (in this .ase thickness)
ays = yield strength
o = 30 ksi0
Hence for 140 ksi yield strength steel tested at 165 0F, at which tempera-
ture its yield strength ., 130 ksi, the maximum value of K that can bea
measured for 1, 3/4 and one inch specimens are 101, 124 and 143 ksi-in 2 ,
respectively. This would suggest that all the data shown in Figs. 10
to 12 are plane strain with the exception of the 3 inch thick, 140 yield
strength data on 4140. Even for this material, the 2 and 314 inch data
overlap so that all data will be treated as plane-strain value- throughout
this report.*
it might be mentioned that a few I inch thick CCA specimen
tests were made on 4140 in the earlier study, and in general
Ka was higher for the ½ inch thick than the one inch thick
specimens. The reason for this is not apparent at this time.
-3-

MaterialsResearch
Le.0oratoryinc
The most pronounced feature of these data is the well defined
toughness peak that separates the transition and super-transition tem-
peratures for 4140 steel. The occurrence of a transition temperature
for both 4140 and 4340 had been reported previously; however, the
pronounced peak that requires a decrease in toughness with incre2:sng
temperature was not found in the early program.
The fracture surfaces of the 4140 specimens were examined in a
scanning electron microscope, and as shown on the 160 yield strength
chart of Fig. 10, at the highest sub-transition temperature the fracture
was primarily cleavage and at the lowest super-transition temperature,
it was primarily dimpled rupture. These fracture surtices are shown
in Fig. 13. There is little question that the transition temperature is
a result of a change in fracture mechanism.
The toughness of 1340 is far less dependent on test temperature
than either 4140 or 4340. (Compare Fig. 11 with Figs. 10 and 12.)
This is a result of the fact that even at super-transition temperatures,
the toughness is moderate, e.g., all the 160 ksi yield strength speci-
mens showed primarily dimpled rupture in s-ite of the fact that K was1
aonly about 50 ksi-in 2 At the highest yield strength, where there was
a significant effect of test temperature on Kat the fracture appearance
did change from mainly cleavage to almost all dimpled rupture, as indi-
cated in Fig. 11, and shown by the photographs in Fig. 14.
4.2 Toughness Comparisons
The toughness of the three steels are compared in Figs. 15, 16
and 17, as a function of yield strength with test temperature as the
parameter. For all test temperatures and streng,.h levels, the 4340 is
markedly tougher than the cther two. The 4140 is also tougher than
the 1340, and atyield strengths of 140 and 160 ksi, the difference in the
two ,teels is large. However, as the strength is increased to 180 ksi,
t this difference becomes less pronounced, ard on testing at 165 and -651F,the toughness of the two steels overlaps.
•-4 IAI-

Mate-ralsResearch
LaooratoryInc
5.0 Effect of Side Grooves
In making crack arrest toughness :;ts, side grooves are added
to the specimen to insure that the crack front is straight at the time of
arrest. This is important for two reason-,: (1) only straight cracks can
be analyzed by presently available two-dimensional stress analyses, and
(2) if the crack front shape changes as the crack extends, then K a will
be a function of La, as is the case with Kc
The need for a straight crack front to allow for a two-di. -%)-a!
analysis of the specimen could be avoided, of course, by defining L,'
lengths in terms of an "effective length", and this can be done by the
use of a compliance technique. Because thiN is an important first step
in developing an arrest test without side groo.es, preliminary tests of
this nature have been conducted and are described in the Appendix.
The manner in which the crack front shape changes with crack
extension is a far more complex problem. The run-arrest event in Ka-testing is usually started with a straight machined notch. Hence, the
full crack front exper;ences the same value of K, and since the stress
state is essentially constanL over the width of the notch plane, the crack
propagates with a reasonably straight front. In the absence of side
grooves, the edges of the crack front near the specimen surface can
experience no greater constraint than plane stress. Hence, the crack
tends to tunnel. The amount of tunneling will depend on the material
thickness, and the difference between the metal's plane stress and plane
strain toughness, which, in turn, is expected to be a function of both
the type of material and test temperature.
When a crack tunnels, the surface uncracked ligaments act as
closing forces on the expanding crack so that the presence of side
grooves should be expected to lead to conservative values of Ka. The
level of conservatism is expected to depend on the type of crack that
occurs in the structure that the specimen is modeling. For example,
if part-through cracks are expected, then Ka with side grooves is not
at all conservative, if long-running through cracks are expected, the
specimen data nay be unrealistically conservative. In order to measure
-5--

ateaaienlesearch)orator)
trP:
this level of conservatism, Ka tests without side grooves were run to
compare with Ka values measured with side grooved CCA tests. Two
types of specimens were used: TDCB and CCA.
5.1 Comparative Tests
The TDCB specimen is ideally suited for making crack arrest
:ests in the absence of side grooves because the problem of determ.ning
the crack length at arrest is avoided. Hence, room temperature tests
were run, as a function of yield strength on f inch thick 4,40 pla~es
"sing the specimen whose dimensions are shown in Fig. 18. It is im-
portant to note that the machined starter notch in this test series had
a 0.002 inch radius. Single tests were run on specimens having yield
sdrengths of 140, 160 and 180 ksi. These results are compared with
CCA speciman tests with side grooves in the top chart of Fig. 19. It
is obvi, us that the TDCB specimens without side grooves, but sharp
starter notches, and the CCA specimens with side grooves produced al-
most identical results.
Testing Lhe TDCB specimens at room temperature with sharp
notch starters encouraged small crack jumps. A second series of tests
was also run in which an attempt was made to encourage larger crack
jumps. Unside-grooved CC" specimens were used for this series (al-
though the test results are expected to be independent of specimen
type). These specimens used a 0.00 inch starter notch radius, how-
ever, and were tested at -65 0 F. The lower test temperature in con-
junction with the more blunt starter notch, did, indeed, encourage
larger crack jumps, but essentially all the crack extension occurred by
tunneling. The plane stress surface matprial essentially remained pin-
ned so that formally calculated Ka values were quite high, even if the
center-plane crack length was used, as shown in the bottom chart of
Fig. 19.
To be certain that the different behaviors shown by the top
and bottom charts in Fig. 19 were not the result of using TDCB vs.
-6-

•& •'..c" atc,'
In,,
CCA specimens, one CCA specimen with an 0.002 inch radius crack
starter was tested at room temperature. As shown in Fig. 19 top,
K cbtained on this specimen was the same as that obtained on theC
TDCB specimens.
Hence, it must be concluded, at least on the basis of this
limited amount of data, that for short crack jumps, the presence or
absence of side: grooves does not significantly change K . For long
running cracks, on the other hand, Ka data collected on side-grooved
spE-cimens is conservative.
fi.G Conclusions
The plane strain crack arrest fracture toughness of 4140 and
1340, both in a fully Martensite condition, were measured over a yield
strength range of 240 to 180 ksi, and a test temperature range of -U5
to 165°F. These results were compared with each other and with the
data collected earlier on 4340. The 4340 was found to be far tougher
than the other two alloys at all yield strengths and test temperatures.
The 4140 was tougher than the 1340, but the difference was less as the
yield strength increased.
-7-
7-- - - -- _-

- Mdtea's -;
e e a, cLaco' ato". f
Table 1
CHEMICAL COMPOSITION OF TEST PLATES
Place C Mn Si P S Cr Mo
3/4 inch 4140(B plate) 0.43 0.89 0.29 0.008 0.016 0.96 0.24
½ inch 4140(C plate) 0.41 0.86 0.27 0.010 0.014 0.91 0.24
Limits for AISI-SAE 0.38 0.75 0.15 0.035 0.040 0.80 0.15(from ASM Hand- 0.43 1.00 0.30 max max 1.10 0.25book, Vol. 1)
½ inch 1340(D plate) 0.42 1.65 0.21 0.017 0.022
Limits for AISI-SAE 0.38 1.60 0.15 0.035 0.040(fro'n ASM Hand- 0.43 1.90 0.30 max maxbook, Vnl. 1
I-- -

tiiaieria:sResearch
Lacoratoryinc
Table 2
TENSILE PROPERTIES OF 4140 STEEL AT ROOM TEMPERATURE(0.357 inch dia. specimens, TL orientation)
Tempering Tensile YieldTemp. Specimen Strength Strength
(OF) No. (ksi) (ksi) b e %b RA
½ inch thick
1100 C-13 149.8 136.3 14.3 41.71100 C-14 149.3 137.4 15.4 43.11050 C-11 161.8 151.2 12.9 39.4
1050 C-12 163.7 152.9 12.9 39.1
800 C-9 224.4 209.9 7.9 27.3800 C-10 224.7 209.6 7.5 27.6
1000 C-21 170.6 160.4 12.1 39.51000 C-22 170.1 160.5 12.1 38.6
900 C-3 196.1 185.0 10.4 35,2900 C-4 196.6 185.2 9.6 33.4
800 C-I 226.2 211.2 7.5 28.8800 C-2 224.3 208.8 6.4 24.9
3/4 inch thick
1100 B-13 153.4 138.7 13.0 40.01100 B-14 153.4 138.7 13.0 40.0
1050 B-11 169.1 156.0 11.0 36.11050 B-12 168.6 155.4 11.0 37.2
800 B-9 231.6 216.7 6.5 23.5800 B-10 230.8 214.4 6.0 21.5
1000 B -21 177.1 165.3 10.5 35.21000 B-22 177.4 162.8 10.5 33.9
900 B-3 202.7 189.3 9.0 30.9900 B-4 203.9 190.7 8.5 30.5
800 B-1 228.8 211.3 7.5 25.1800 B-2 228.8 210.3 7.5 25.6
-9-

Mate-,alsResearch
LaboratoryInc
Table 3
TENSILE PROPERTIES OF 1340 STEEL AT ROOM TEMPERATURE(0.357 inch dia. specimens, TL orientation)
Tempering Tensile YieldTemp. Specimen Strength Strength
(0 F) No. (ksi) (ksi) 0 e 00 RA
1100 D-15 127.5 113.0 16.8 41.21100 D-16 127.6 112.2 16.8 40.7
1050 D-13 134.6 119.7 14.6 38.81050 D-14 135.0 121.0 15.7 40.0
i000 D-9 142.3 128.7 14.3 37.51000 D-10 142.1 128.2 13.9 39.2
950 D-7 146.8 133.4 12.1 38.0950 D-8 148.5 134.0 12.5 36.6
900 D-5 160.0 146.6 11.8 35.5900 D-6 158.0 146.5 10.4 34.3
800 D-3 176.5 165.4 9.6 31.6800 D-4 176.1 164.4 9.6 31.6
750 D-23 199.6 185.5 7.9 28.3750 D-24 200.2 185.2 7.5 24.0
"700 D-25 214.0 196.2 7.1 23.6700 D-26 212.9 193.7 7.' 24.0
-10-

Materials"Resedf cn
,. anoratO, •,
Inc
Table 4
TENSILE PROPERTIES OF 1340 LTEEL AT -65 AND +165F(0.357 inch dia. specimens, TL orientation)
Tempering Tensile YieldTemp. Specimen Strength Strength
(OF) No. (ksi) (ksi) o e % RA
-651F Testing Temperature
925 D-19 166.8 151.1 11.8 31.6925 D-20 166.8 151.0 13.2 35.3
825 D-17 184.8 169.2 10.7 28.8825 D--18 184.4 169.7 10.7 32.1
750 D-27 207.5 191.5 8.9 28.8750 D-28 207.9 191.4 9.6 27.1
+165 0 D Testing Temperature
925 D-41 145.1 131.0 16.1 55.6925 D-42 145.5 132.9 16.8 57.4
825 D-39 169.0 151.6 12.9 47.0825 D-40 164.8 148.2 15.4 57.5
750 D-29 187.0 168.4 7.9 25.9750 D-30 189.4 168.4 7.9 27.3
-11-

MaterialsResearch
Laboratory.Inc
S.....Table 5
TENSILE PROPERTIES OF 4140 STEEL AT -65 AND +165 0 F(0.357 inch dia. specimens, TL orientation)
Tempering Tensile YieldTemp. Spec. Strength Strength
(0F) No. (ksi) (ksi) e -o RA
-65OF Testing Temperatures
1100 C 69 159.3 146.6 15.7 42.0
1100 C 70 159.6 144.3 16.1 40.6
1000 C 66 178.4 168.6 14.3 37.2
i 000 C 67 178.8 168.2 13.2 36.3
950 C 62 191.5 182.7 12.1 33.9
950 C 63 193.4 183.7 12.1 34.3
+1651F Testing Temperatures
1100 C 71 144.0 131.3 15.0 43.9
1100 C 72 144.6 132.9 14.3 4 5
1000 C 68 164.3 152.6 12.9 40.0
950 C 64 179.3 166.6 10.7 35.7
950 C 65 180.3 165.9 10.7 34.3
-12-

MaterialsResearch
LaboratoryInc
Table 6
CRACK ARREST FRACTURE TOUGHNESS OF 4140 STEEL
CCA Specimens, WV 2.25 inch. BN/B = 75, T-L Direction
-- inch thick
Yield Test K KSpec. Strength Temp. a of,0No. ksi OF in. in. ksi-in• ksi-in"
C 15 ,60 RT 0.802 1.570 131.2 75.3C 16 160 RT 0.789 1.560 149.0 80.8C 17 150 RT 0.781 1.567 157.1 84.2C 18 150 RT 0.786 1.630 157.6 79.8C 19 135 RT 0.789 1.407 171.1 107.9C 20 140 0 0.816 1.M84 135.4 124.1C 26 180 RT 0.805 1.080 86.2 80.0C 30 160 0 0.815 1.228 111.1 87.6C 36 180 165 0.772 1.764 139.6 61.3C 37 180 -65 0.775 1.632 89.2 46.8C 38 180 250 0.776 1.621 131.4 67.5C 40 160 165 0.778 1.730 162.4 73.9C 41 160 -65 0.795 1.799 120.9 54.1C 4,! 160 250 0.775 1.722 160.5 71.2C 44 140 165 0.779 1.324 197.3 132.6C 45 140 0 0.000 1.108 0.0 126.1C 46 140 165 0.775 1.210 167.2 136.1C 5 200 RT 0.768 1.250 76.7 55.0C 50 160 330 0.792 1.671 150.9 74.1C 51 160 -150 0.820 1.567 64.8 1414. 7C 52 160 0 0.823 1.264 119.6 91.8C 7 185 RT 0.762 1.439 106.8 63.5C 8 185 RT 0.762 1.504 120.9 66.1C 54 180 0 0.734 1.154 115.5 83.8C 55 180 75 0.724 1.289 103.7 77.2C 56 180 0 0.734 1.173 109.8 79.3C 57 180 150 0.733 1.251 107.6 75.1C 60 140 -65 0.732 1.060 162.7 135.6
3/4 inch thick
B 5 210 RT 0.780 1.379 77.7 50.8B 6 210 RT 0.762 1.304 75.9 52.5B 8 190 RT 0.772 1.277 97.7 70.0B 15 160 RT 0.786 1.444 134.9 84.0B 16 160 RT 0.784 1.442 131.3 81.6B 17 155 RT 0.787 1.475 153.6 91.'.B 18 155 RT 0.785 1.523 151.6 86.0B 19 140 RT 0.790 1.243 182.0 137.9B 20 140 RT 0.785 1.323 164.4 116.4
-13-

MatenalsResearch
Latora~torvInc
Table 7
CRACK ARREST FRACTURE TOUGHNESS OF 1340 STEEL(½ inch thick)
CCA specimens, W = 2.25 inch, BN/B = .75, T-L Direction
Yield Test a K
Spec. Strength Temp. 0 f 0 fNo. ksi OF in. in. ksi-in" ksi-in2
D 1 135 RT 0.786 1.666 144.9 72.0D 2 135 RT 0.787 1.652 131.5 65.8D 22 180 RT 0.774 1.427 80.3 51.3D 31 140 RT 0.750 1.573 143.5 74.5D 32 140 RT 0.750 1.580 133.3 68.3D 33 140 -65 0.769 1.519 101.9 63.0D 34 140 -65 0.774 1.404 100.4 64.9D 35 160 RT 0.766 1.461 80.8 48.1D 36 160 RT 0.775 1.315 88.6 60.4D 37 160 -65 0.775 1.632 89.2 46.8D 38 160 -65 0.772 1.601 86.0 46.5D 45 180 165 0.766 1.341 84.7 55.8D 46 180 165 0.761 1.306 89.5 62.7D 47 160 165 0.763 1.485 89.9 54.8D 48 160 165 0.762 1.372 84.4 55.7D 49 140 165 0.759 1.369 110.5 71.9D 50 140 165 0.760 1.270 98.5 71.6D 51 180 -65 0.792 1.005 46.8 45.9D 52 180 -150 0.797 1.199 41.2 37.4D 53 180 75 0.793 1.247 67.7 52.4D 54 180 0 0.798 1.272 59.2 44.8D 55 160 250 0.798 1.781 123.4 56.6D 56 160 330 0.794 1.808 117.7 51.5
A-14-

Sto.
i
",, -° ½1,=r-..,
B r , _,,• .•,-A --
ýk ,Awn
"" - . ', r,.
4N
B%
C
II
t A4~
N r,
Fig. 1 Microstructure of heats B (4140 - 3/14 inchn thick),C (41410 - 2 inch thick) and D (1340 - -inch thick)
after normalize, quench and temper. (1500X, nital etch.)
-15-
''r
240 ,1..... I..
220
Ln 200
z. 18
160 0 Tensile
-4+ Yield
140
120 I ! i
50 V
+ Reduction in Area
40 0 Elongation
LLJLi
30
20l--
S 10 - -J• J
0 I ....... L _i
700 800 900 1000 1100 1200
TEMPERING TEMP. (F)
Fig. 2 Tensile properties of 3/4 inch thick 4140 steel (B plate) at roomtemperature as a function of tempering temperature.
-16-

240 F . ... ..... T. .. .1. . .I"
22 -
u• 200
2: 1801-• -•
1--
2: 0SIbO + -I-- 0 Tensile
+ Yield
120
50 - I
+ Reduction in Area
40 - 0 Elongation t 9:
U +
30+
20
U 0)
10
0 II I . I.
700 800 900 1000 1100 1200
TEMPERING TEMP. IF)
Fig. 3 Tensile properties of I inch thick 4140 steel (plate C) at roomtemperature as a function of tempering temperature.
-17-

220 T TTTl\ ,.
200K \ _j
2 180k
z
U 14 0 TensieleKi
20 Yield +1213* , i'
+ Reduction in Area
V 0 Elongation +A +
0U 0 */ -I
z +
£20
Uj
112020
600 700 800 900 1000 1100 1200TEMPERING TEMP. (F)
Fig. 4 Tensile properties of I inch thick 1340 steel (plate D) at roomtemperature as a function of tempering temperature.
-18-

220(
0-. 200
180
7- \0"
z 160 0-"0 Tensile
+Lf•
140 + Yield
120 I__
60
+ Reduction in Area50
z 4O E0ongationLUl
J 40
0- I I +
600 700 800 900 1000 1100
TEMPERING TEMP. (F)
Fig. 5 Tensile properties of ½ inch thick 1340 steel (plate D) at -65Fas a function of tempering temperature.
-19-

220
200
1808
"IYild+z 160
F- +
ILn
140 - Tensile
+ Yield
1201
-- Reduction
50 in Area--- 0 Elonga- +
Lu tion
w 40IL!
30
20I--
01 I I I I ..600 700 800 900 1000 1100
TEMPERING TEMP. (F)
Fig. 6 Tensile properties of ½ inch thick 1340 steel (plate D) at 1651F asa function of tempering temperature.
-20-

220
200-- 8
In-- 180 \
40
z 160 aj LkU
0 Tensile
140:140 -Yield
120 I
50
+ Reduction in Area + -
40 +Z 0 ElongationLJ
U-
30
20-_
I-'--- 28 -
_10
0 II I I
700 800 900 1000 1100 1200
TEMPERING TEMP. (F)
Fig. 7 Tensile properties of ½ inch thick 4140 steel (plate C) at -65 Fas m function of tempering temperature.
-21-

__W- 7 - 7f-
220
200
In 2: 0
LD0z 160
o Tensile +
140 * Yield
120o I I I
501I + Reduction in Ares
40 +z OElongation
I..,-J
U 0
13 0 i
'1lii 700 800 900 1000 1100 120 0
TEMPERING TEMP. (F)Fig. 8 Tensile properties of I inch thick 4140 steel (plate C) at 1651F
as a function of tempering temperature.
-22-

Nw .25W
_ - --ILI - 2H -
D
__ __ Gage line
I L
-- t -W = 2.250
W - a = 1.463
D = 0.750 + 0.005 - 0.000
2H = 2.700L = 2.700
BN/B = 0.75
t = 0.113
Knife edge(All dimensions inches)
Fig. 9 Dimensions of compact crack arrest (CCA) test specimen.
-23-

160
140 0 x0
S~8120-12-- Y.S. = 140 ksi
c3 1001I!!I ,c 120i I I I ILn
Ln 120
o 0.5 INCH PLATEc 100 x 0.75 INCH PLATE
Dimpled ->0ruptureLrl
U-1, 80 -z °40 I
10
S60 Y.S. 160 ksi
t-"0n Cleavage
40I I I II-200 0-100 0 10 20 0 0
a 40 "SIr_
CC
U 0
Y.S. = 180 ksi
-20 -10 0 100 200 300 400
TEST TEMPERATURE (DEG F)
Fig. 10 Crack arrest fracture toughness of 4140 steel as a functionof test temperature ( 0. 05 and 0. 75 inch thick plate).
-24-

80 I 0[
60
z- 40
0 Y.S. = 140 ksiu'i
•n 20 I I I i i
80 I I
60 0Ln 0
LD 40 Dimpled0• rupture
Y.S. = 160 ksi
-' I I20•"80
DimpledLU • rupturecr_5a 60
0 0Cleavage and40 dimpled rupture
Mainly cleavage Y.S. = 180 ksi
20 I I I-200 -100 0 100 200 300 400
TEST TEMPERRTURE (DEG F)
Fig. 11 Crack arrest fracture toughness of 1340 steel as a function oftest temperature (0.5 inch thick plate).
-25-

140 0 o
120 0
100 I0 Y.S. = 140 ksi
c3 80
Ln 140
0 o0
cl: 120
Ltn 100LnIZLO• Y.S. 160 ksi
C 80 0iF-
C 101 -,--- ~ - o oIL- .L..-o ILiJ
80 0
CC0 7
60 Y.S. 180 ksi
40 L~040 ' L I I I I . i
-200 -100 0 100 200" 300 400
TEST TEMPERRTURE (DEG F)
Fig. 12 Crack arrest fracture toughness of 41340 ..teel as a functionof test temperature (1 inch thick plate)(
-26-

rr-
IIWAI
200X200N
,t;~-1 AF
200X 2000X
Fig. 13 Fracture appearance of 4140O steel (160 ksi yield strength)Top: Test at O0 F; Bottom: Test at -65 0 F.
-2 7-

C 0>
F 0 g 4 Fatr perneo0I
3 0 s el1 8 s ilstegh .M0
Fg. Top Fracture apestartc 7of
Bottom: test at 165OF
C MF

160
140Z +
C3m 120U,\
'"ý 100
z 8LD-.3 AA0
60Ln
40
Uc +165F Tests
U - 4340 (1 inch)20 - -+ 4140 (1 inch)
A 1340 (314 inch)
0 I I I I120 140 160 180 200 220
YIELD STRENGTH (K51)
Fig. 15 Comparison of the crack arrest toughness of the three steelswhen tested at +165 0 F.
-29-

160
140 xI-
0n 120
LflxiL +
-O \X"2:z z 80- + +lC:) x'•
A60- A
in
ACr_
40-U Room Temperature Tests
0 4340 (1 inch)20 X 4140 (3/4 inch)
-[+4140 (½inch)A 1340 (½ inch)
120 140 160 180 200 220
YIELD STRENGTH (KSI)
Fig. 16 Comparison of the crack arrest toughness of the three steels
when tested at room temperature.
-30-

160
"140
zt--I 0
c3 120.1
"100 0
U.1z 80
Ln
20:
c- 40%Z
U"
cc -65F Tests
U - O 4340 (1 inch)2a -- + 4140 (½ inch)
-A 1340 (314 inch)
0 I I I I120 140 160 180 200 220
TIELO 5TRENGTH (KSI)
Fig. 17 Comparison of the crack arrest toughness of the three steelswhen tested at -65 0 F.
-31-

_ _ -
H 3HH3
--•L 1.
-4I i ~ L3
L -4
D = 0.500 + 0.005 - 0.000
H1 = 0.5 H2 = 1.00 H3 = 2.00
L1 = 0.42 L2 = 1.04 L3 = 2.70 L4 = 6.00
(All dimensions, inches)
Fig. 18 Dimensions of tapered double cantilever beam (TDCB)specimen.
-32-

160-
1403 CCA w/side grooves
A- TDCB w/o side grooves
L CCA wlo side grooves
120
100
"0 -z 80 o 0
0 0
c• 8.n, 60
I-.I
In"-" 40
c- 160
S140 +LU
S120CD I-" +
I--" +
In 100Ll
+ CCA w/side grooves
CE 80] 0 CCA w/o side grooves
Ucr"n,.U 60-
0
40 - I 7120 140 160 180 200
.YIELD STRENGTH (KSI)
Fig. 19 Comparison of K with and without side grooves.aTop: room temperature tests.Bottom: -65 tests.
-33-

MaterialsResearch
Laboratory,Inc.
v References
1. E. J. Ripling, J. H. Mulherin and P. B. Crosley, "Crack
Arrest Toughness of Two high Strength Steels (AISI 4140
and AISI 4340). To be published in AST Met. Trans.
2. P. P. Milella, C. W. Marschall and A. R. Rosenfield, "A
Method to Obtain Crack-Opening Force in Transverse-
Wedge Loading," to be published.
-34-

MaterialsResearch
Laboratory,Inc.
7.0 Appendix (Non-Optical Methods for Measuring Crack Lengths)
If unside-grooved CCA specimens are to be used for measuring
Ka, some method is needed to define the length of tunneled cracks.
The most promising method for doing this is to make a measurement
from which an "effective crack length" can be implied. Two techniques
were evaluated for measuring effective crack length: one, a double dis-
placement method, and the other, a technique suggested by Milella for
calculating wedge friction, from which the cpening load can be calculated.
7.1 Double Displacement Method
In order to evaluate the double displacement method, the speci-
men was modified by adding two holes at -0.3W, i.e., in the direction
away from the specimen mouth, as shown in Fig. A-i. Two aluminum
specimens of this type were prepared, one with side grooves, and the
other without. The specimens were incrementally saw cut along their
centerplane, and the ratio of thv displacements at -0.3W (V 1 ) to mouth
opening displacement ..0.25W, (Vo) was measured as a function of saw cut
length (a/W). A plot of these data are shown in Fig. A-2. The data
from the two specimens combined gave a standarC' error in a/W of 0.0240
when the data were represented by a second order polynomial. For in
arrested crack length of a/W - 0.6, this standard error in crack length
produced an error in Ka of about five percent.
In a second test series, the two displacements V1 and V were
measured on the specimens used to evaluate Ka by the standard method.For these tests, the crack lengths at initiation (a 0 ) and arrest (af) were
measured at the completion of the test. The accuracy of the relation-
ship between the ratio V1/V and a and af was then determined by
comparing the second order polynomial fit developed in Fig. A-2 with
these measured crack lengths, Fig. A-3. In spite of the fact that al-
most all of the measured crack lengths lie above the curve, a double
displacement technique might be an adequate method for measuring effec-
tive crack lengths.
-35-
I

MaterialsResearch
Laboratory.,Inc.
7"2 Milella Method for Calculating Wedge Frictior. and,
Hence, Compl~ance 21
In the absence of friction a plot of wedging force versus wedge
travel would follow the same line when the wedge is extracted as when
it is pushed into the specimen. When the wedging force is opposed
by friction, however, there are separate curves fý,, pushing and for
extracting the wedge, as shown in Fig A-4 (a). As proposed by
Milella, this behavior can be analyzed to calculate the coefficient of
friction between the wedge a'nd the split pins. Referring to the force
diagrams in Fig. A-4b, it can be seen that the difference between the
"pushing" and "extracting" curves in Fig. A-L4. is a simple con -uence
of the change in the direction of the friction forces. A force balance
can be made to obtain an expression for the coefficient of friction, g.
This gives
= A -(A 2 -1)½ (A-I)
where
A = F F2 )1 2 iF
and where a is the wedge half-angle and F and F are the forces12indicated in Fig. A-4 (a). For pushing the wedge, the specimen
opening load, P, is related to the wedging force, F, by the equation
P =½F (tana LA-2)tan a + p
In the present work the friction analysis was used to calculate
crack length. The calculation is based on the fact that there is a
unique value of the ratio, V /P, at a given crack length; or equh -
lently given a value of Ve/P, the crack length can be inferred. Values
of the coefficient of friction were obtained through eq. (A-1) from
loading-unloading sequences carried out before and after the test;
-36-

-:p
MaterialsRese-.Arch
Laboratory.Inc
that is, with the machine notched uncracked specimen and with the
specimen containing the arrested crack. Measurement of the wedging
load and opening displacement at the crack initiation point and at the
crack arrest point were used with eq. (A-2) to determine the ratio of
V /P ccrresponding respectively to the original machined notch length0
and the arrested crack length. Earlier measurements of V 0 /P as a
function of a/W could then be consulted to calculate values of a/W* from
the test-derived values of V /P.0
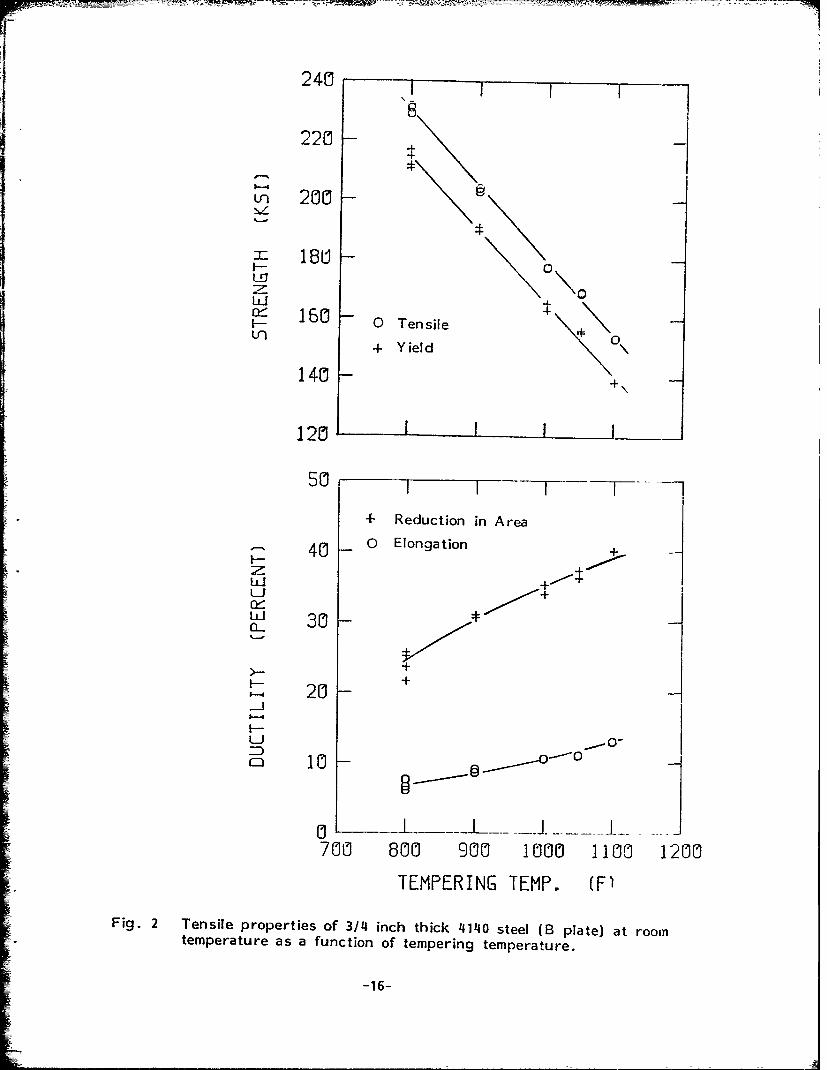
The results obtained are plotted in Fig. A-5. The initial
slot lengths were all close to a/W = 0.35, but the values inferred from
the friction analysis centered about a/W = 0.4, and ranged nearly from
0.35 to 0.45. This difference probably results from the fact that
there is some plastic flow developed at the crack tip when the wedge
is cycled. For the arrested cracks the friction analysis estimated
a/W values that were lower than the actual measured ones. Unfortun-
ately, the friction forces were not evaluated for the saw-cut specimens
so that the amount of error attributed to the physical crack length
measurements cannot be obtained.
For calculational purposes, the experimental results relating
a/W and V /P were fitted with the following mathematical0
expression:
a/W = 0.218226 + 6.50462 x - 28.5645 x 2 + 54.6405 x 3
- 43.7041 x4 + 14.712 x5
where
x = EBV /P0
-37-

MaterialsResearch
Laboratory.Inc
7.3 Conclusions
The test results discussed above suggest that the double
displacement technique, at least, has promise for evaluating effective
crack length. Unfortunately, the Milella method was not used on
the saw-cut specimens, so that this method was not adequately
evaluated.
When either method, double displacement, or friction was
used to evaluate effective crack length, .he implied value of a was
always shorter than the directly measured one (see Figs. A-3 and A-5).
This suggests that the method now used for measuring arrested crack
lengths should be re-examined.
-38-

W .25W
0. A
w.3wT
Knife edges for measuringdisplacement at 0.3W
Fig. A-1 Specimen modif-c.ation and knife edges for measuringdisplacement at 0.3W.
-39-

.9o Side groove (Spec. 4)+ No side groove (Spec. 3)
0
-7 0
r- - 6
- O +N .6CE +
0 +
0 + a/W =0.4020 -1.0813 (VV2 2
.4 + 3.5780 (Vl/V
±0.0240
.3
.2 I I I IS.2 ,.3 .4 .5 .6 .7
RATIO VMU M/V(O)
Fig. A-2 Sawed-crack length as a function of the displacement ratioVIIV0 (V1 at -0.3W; V at + 0.25W).
-40-

.8
7 -o0
.73 00Cr 00
00416 0 o
00
.5
.4
o o
.3
.2 I I.2 .3 .4 .5 .6 .7
RRTIO V(1)/V(O)
Fig. A-3 Comparison of actual values of a/W with curve developedin Fig. 2 using double displacement.
-41-

F1
SPushing FUL - - F2LL
Extracting
Wedge Travel
(a) Wedging force versus wedge motion on pushingand extracting the wedge in the presence offriction.
)F F
F 2
-• • ( F nF Fn)Fn 2
Push ing Extracting F 0 2
(b) Force diagrams for pushing and extractingwedge.
Fig. A-4 Analysis of friction forces in wedging.
"-42-
SI
I.8 I
0 0
00.7 0 0
0
00 0/o
0
X .6 0C E 0CE 0-- 0
.4.0
.3 V-I I ! !.3 .4 .5 .6 .7 .8
CALCULRTED R/W
Fig. A-5 Comparison of actual and calculated crack lengths using theMilella friction calculation.
-43-

FILMEI
DIOI