Embed Size (px)
Citation preview

Vehicle4 Energy Services (V4ES) Evaluation for
Upscaling and Transnational potential
Subtitle: Assessing the potential of further roll-out of 8 differing V4(ES) solutions
This report is the result of analysing, researching, and evaluating efforts related to the SEEV4-City
project and addresses multiple project related tasks and deliverables, namely:
3.3a, 4.4h, 5.3, 5.4 and aspects of 5.5.
Authors: Esther van Bergen, Jorden van der Hoogt (Cenex Nederland), Richard Kotter, Edward Bentley
(Northumbria University), Jos Warmerdam (Amsterdam University of Applied Sciences), Chris Rimmer
(Cenex UK) and Bert Herteleer (KU Leuven)
Date: July 2020
Document control
Version Date Authors Approved Comment
V1.0 20/07/2020 EvB, JvdH, RK, EB, JW,
CR, BH
EvB Internal release SEEV4-City
V1.1 20/11/2020 EvB, JvdH EvB Final version for public release.
Processed final partner
feedback.

SEEV4-City: Final Report V4ES Evaluation for Upscaling and Transnational potential
Executive Summary
This report is intended to collect, present, and evaluate the various solutions applied in individual
operational pilots for their (upscaling and transnational transfer) potential, in terms of opportunities and
barriers, over the short and long(er)-term. This is done by identifying the main characteristics of the
solutions and sites and the relevant influencing factors at different local (dimension) contexts.
The analysis provides insights in barriers but also opportunities and conditions for success across four
main dimensions that make up the local context landscape. We consider two main roll-out scenarios:
1. Upscaling within the boundaries of the country where the operational pilot (OP) took place
2. Transnational Transfer relates to the potential for transferring a (V4)ES solution to any of the other
three (project) countries
There are several aspects within the four main dimensions that are cross-cutting for all four countries,
either because EU legislation lies at its roots, or because market conditions are fairly similar for certain
influencing factors in those dimension.
Ultimately, both Smart Charging and V2X market are still in their relevant infancies. The solutions applied
in various SEEV4-City pilots are relatively straightforward and simple in ‘smartness’. This helps the
potential for adoption but may not always be the optimal solution yet. The Peak shaving or load/demand
shifting solutions are viable options to reduce costs for different stakeholders in the (electricity) supply
chain. The market is likely to mature and become much smarter in coming 5 – 10 years. This also includes
the evolvement (or spin-offs) of the solutions applied in SEEV4-_City as well. At least in the coming
(approximately) 5 years Smart Charging appears to have the better financial business case and potential
for large scale roll-out with less (impactful) bottlenecks, but looking at longer term V2X holds its potential
to play a significant role in the energy transition.
A common denominator as primary barriers relates to existing regulation, standards readiness and limited
market availability of either hardware or service offerings.
SEEV4-City has published a significant collection of varying reports, many taking a specific focus. For more
detailed information on, for example a particular solution at one of the OPs or more in-depth policy
evaluation, please look into these additional reports. They can be found through the Interreg NSR or
project specific website, or one of the partners of the project would be glad to provide them.
SEEV4-City: Final Report V4ES Evaluation for Upscaling and Transnational potential
3
Table of Contents
EXECUTIVE SUMMARY ................................................................................................................................. 2
GLOSSARY .................................................................................................................................................... 5
1 INTRODUCTION ............................................................................................................................. 7
2 EVALUATION APPROACH .............................................................................................................. 9
2.1 Identified new (Vehicle4) Energy Services ................................................................................. 9
2.2 Roll-out scenarios and local context landscape ...................................................................... 10
2.3 Potential-indicator explained ................................................................................................... 11
3 COUNTRY EVALUATIONS: BARRIERS AND OPPORTUNITIES LANDSCAPE ............................... 12
3.1 Cross-cutting ............................................................................................................................... 12
3.2 Belgium ........................................................................................................................................ 14
3.3 Norway ........................................................................................................................................ 16
3.4 The Netherlands ......................................................................................................................... 18
3.5 United Kingdom .......................................................................................................................... 20
4 UPSCALING AND TRANSNATIONAL TRANSFER: SMART CHARGING ...................................... 25
4.1 Smart Charging with Static ‘Flexible Power’ Profile (Amsterdam City ‘Flexpower’) ............ 25 4.1.1 Service description ................................................................................................................................... 25 4.1.2 Upscaling potential in the Netherlands ................................................................................................ 25 4.1.3 Transnational transfer potential ............................................................................................................ 26 4.1.4 (V4)ES potential – Summary and Score Card ....................................................................................... 28
4.2 Smart Charging with dynamic demand management (Amsterdam JC ArenA) .................... 29 4.2.1 Service description ................................................................................................................................... 29 4.2.2 Upscaling potential in The Netherlands................................................................................................ 29 4.2.3 Transnational transfer potential ............................................................................................................ 30 4.2.4 (V4)ES potential – Summary and Score Card ....................................................................................... 32
4.3 Smart Charging by Peak shaving with static battery (Oslo Vulkan parking garage) .......... 33 4.3.1 Service description ................................................................................................................................... 33 4.3.2 Upscaling potential in Norway ............................................................................................................... 33 4.3.3 Transnational transfer potential ............................................................................................................ 34 4.3.4 (V4)ES potential – Summary and Score Card ....................................................................................... 35
4.4 Smart (solar) Charging of e-bikes as car replacement (Kortrijk sports centre) ................... 36 4.4.1 Service description ................................................................................................................................... 36 4.4.2 Upscaling potential in Belgium .............................................................................................................. 36 4.4.3 Transnational transfer potential ............................................................................................................ 37 4.4.4 ((V4)ES potential – Summary and Score Card...................................................................................... 39
5 UPSCALING AND TRANSNATIONAL TRANSFER: V2X ................................................................ 40
5.1 Vehicle2Home – EV energy to Home, single household (Loughborough) ............................. 40

SEEV4-City: Final Report V4ES Evaluation for Upscaling and Transnational potential
4
5.1.1 Service description ................................................................................................................................... 40 5.1.2 Upscaling potential in the United Kingdom ......................................................................................... 40 5.1.3 Transnational transfer potential ............................................................................................................ 41 5.1.4 ((V4)ES potential – Summary and Score Card...................................................................................... 43
5.2 Vehicle2Building – EV energy to building (Leicester City Hall) ............................................... 44 5.2.1 Service description ................................................................................................................................... 44 5.2.2 Upscaling potential in the United Kingdom ......................................................................................... 44 5.2.3 Transnational transfer potential ............................................................................................................ 45 5.2.4 ((V4)ES potential – Summary and Score Card...................................................................................... 47
5.3 Vehicle2Grid – EV energy to Grid, single household (Burton-upon-Trent) ............................ 48 5.3.1 Service description ................................................................................................................................... 48 5.3.2 Upscaling potential in the United-Kingdom ......................................................................................... 48 5.3.3 Transnational transfer potential ............................................................................................................ 49 5.3.4 ((V4)ES potential – Summary and Score Card...................................................................................... 50
6 UPSCALING AND TRANSNATIONAL TRANSFER: ENERGY TRADING ....................................... 51
6.1 Energy Trading – FCR with Battery Storage (Amsterdam – JC ArenA) ................................... 51 6.1.1 Service description ................................................................................................................................... 51 6.1.2 Upscaling potential in the Netherlands ................................................................................................ 51 6.1.3 Transnational transfer potential ............................................................................................................ 52 6.1.4 (V4)ES potential – Summary and Score Card ....................................................................................... 53
7 CONCLUSIONS AND RECOMMENDATIONS ............................................................................... 54
8 REFERENCES ................................................................................................................................. 56
SEEV4-City: Final Report V4ES Evaluation for Upscaling and Transnational potential
5
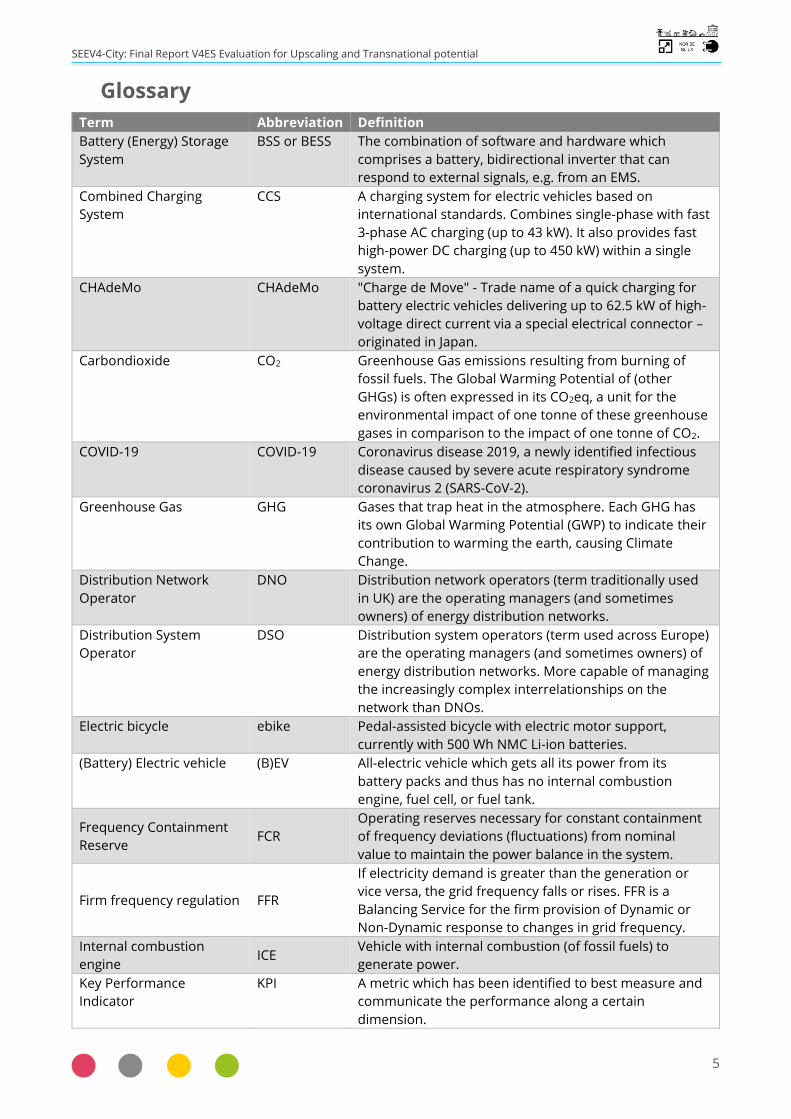
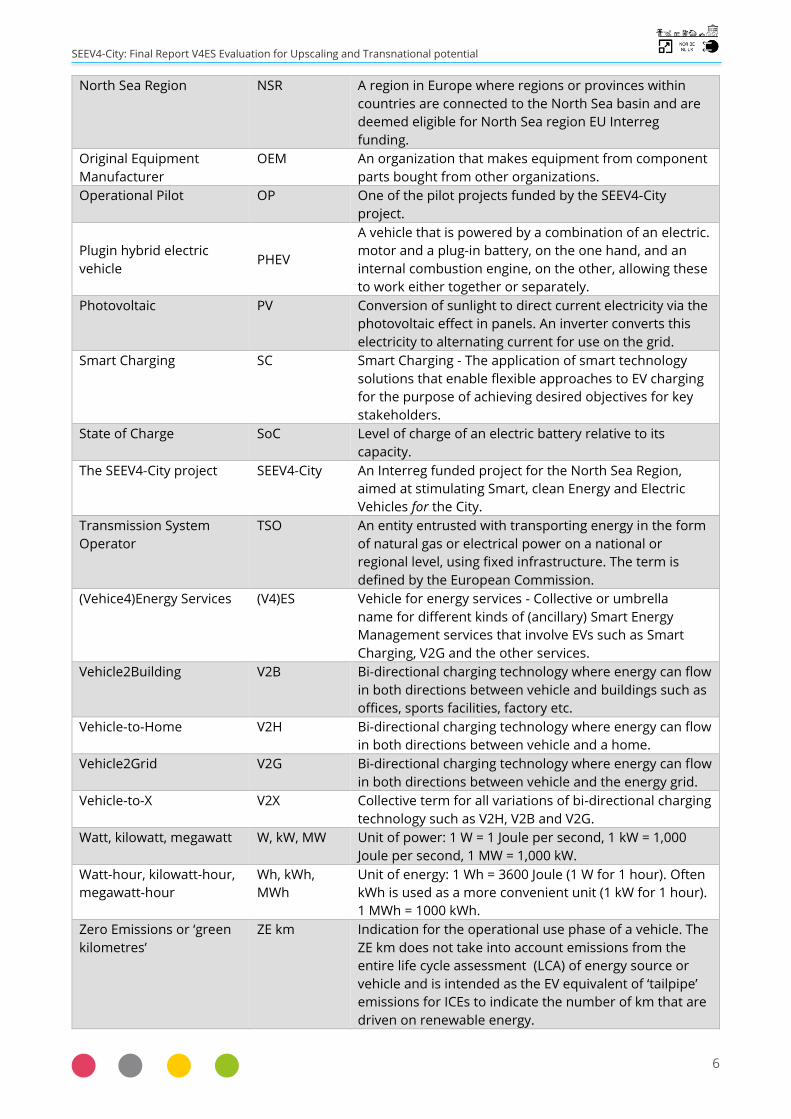
Glossary
Term Abbreviation Definition
Battery (Energy) Storage
System
BSS or BESS The combination of software and hardware which
comprises a battery, bidirectional inverter that can
respond to external signals, e.g. from an EMS.
Combined Charging
System
CCS A charging system for electric vehicles based on
international standards. Combines single-phase with fast
3-phase AC charging (up to 43 kW). It also provides fast
high-power DC charging (up to 450 kW) within a single
system.
CHAdeMo CHAdeMo "Charge de Move" - Trade name of a quick charging for
battery electric vehicles delivering up to 62.5 kW of high-
voltage direct current via a special electrical connector –
originated in Japan.
Carbondioxide CO2 Greenhouse Gas emissions resulting from burning of
fossil fuels. The Global Warming Potential of (other
GHGs) is often expressed in its CO2eq, a unit for the
environmental impact of one tonne of these greenhouse
gases in comparison to the impact of one tonne of CO2.
COVID-19 COVID-19 Coronavirus disease 2019, a newly identified infectious
disease caused by severe acute respiratory syndrome
coronavirus 2 (SARS-CoV-2).
Greenhouse Gas GHG Gases that trap heat in the atmosphere. Each GHG has
its own Global Warming Potential (GWP) to indicate their
contribution to warming the earth, causing Climate
Change.
Distribution Network
Operator
DNO Distribution network operators (term traditionally used
in UK) are the operating managers (and sometimes
owners) of energy distribution networks.
Distribution System
Operator
DSO Distribution system operators (term used across Europe)
are the operating managers (and sometimes owners) of
energy distribution networks. More capable of managing
the increasingly complex interrelationships on the
network than DNOs.
Electric bicycle ebike Pedal-assisted bicycle with electric motor support,
currently with 500 Wh NMC Li-ion batteries.
(Battery) Electric vehicle (B)EV All-electric vehicle which gets all its power from its
battery packs and thus has no internal combustion
engine, fuel cell, or fuel tank.
Frequency Containment
Reserve FCR
Operating reserves necessary for constant containment
of frequency deviations (fluctuations) from nominal
value to maintain the power balance in the system.
Firm frequency regulation FFR
If electricity demand is greater than the generation or
vice versa, the grid frequency falls or rises. FFR is a
Balancing Service for the firm provision of Dynamic or
Non-Dynamic response to changes in grid frequency.
Internal combustion
engine ICE
Vehicle with internal combustion (of fossil fuels) to
generate power.
Key Performance
Indicator
KPI A metric which has been identified to best measure and
communicate the performance along a certain
dimension.
SEEV4-City: Final Report V4ES Evaluation for Upscaling and Transnational potential
6
North Sea Region NSR A region in Europe where regions or provinces within
countries are connected to the North Sea basin and are
deemed eligible for North Sea region EU Interreg
funding.
Original Equipment
Manufacturer
OEM An organization that makes equipment from component
parts bought from other organizations.
Operational Pilot OP One of the pilot projects funded by the SEEV4-City
project.
Plugin hybrid electric
vehicle PHEV
A vehicle that is powered by a combination of an electric.
motor and a plug-in battery, on the one hand, and an
internal combustion engine, on the other, allowing these
to work either together or separately.
Photovoltaic PV Conversion of sunlight to direct current electricity via the
photovoltaic effect in panels. An inverter converts this
electricity to alternating current for use on the grid.
Smart Charging SC Smart Charging - The application of smart technology
solutions that enable flexible approaches to EV charging
for the purpose of achieving desired objectives for key
stakeholders.
State of Charge SoC Level of charge of an electric battery relative to its
capacity.
The SEEV4-City project SEEV4-City An Interreg funded project for the North Sea Region,
aimed at stimulating Smart, clean Energy and Electric
Vehicles for the City.
Transmission System
Operator
TSO An entity entrusted with transporting energy in the form
of natural gas or electrical power on a national or
regional level, using fixed infrastructure. The term is
defined by the European Commission.
(Vehice4)Energy Services (V4)ES Vehicle for energy services - Collective or umbrella
name for different kinds of (ancillary) Smart Energy
Management services that involve EVs such as Smart
Charging, V2G and the other services.
Vehicle2Building V2B Bi-directional charging technology where energy can flow
in both directions between vehicle and buildings such as
offices, sports facilities, factory etc.
Vehicle-to-Home V2H Bi-directional charging technology where energy can flow
in both directions between vehicle and a home.
Vehicle2Grid V2G Bi-directional charging technology where energy can flow
in both directions between vehicle and the energy grid.
Vehicle-to-X V2X Collective term for all variations of bi-directional charging
technology such as V2H, V2B and V2G.
Watt, kilowatt, megawatt W, kW, MW Unit of power: 1 W = 1 Joule per second, 1 kW = 1,000
Joule per second, 1 MW = 1,000 kW.
Watt-hour, kilowatt-hour,
megawatt-hour
Wh, kWh,
MWh
Unit of energy: 1 Wh = 3600 Joule (1 W for 1 hour). Often
kWh is used as a more convenient unit (1 kW for 1 hour).
1 MWh = 1000 kWh.
Zero Emissions or ‘green
kilometres’
ZE km Indication for the operational use phase of a vehicle. The
ZE km does not take into account emissions from the
entire life cycle assessment (LCA) of energy source or
vehicle and is intended as the EV equivalent of ‘tailpipe’
emissions for ICEs to indicate the number of km that are
driven on renewable energy.

SEEV4-City: Final Report V4ES Evaluation for Upscaling and Transnational potential
7
SEEV4-City: Final Report V4ES Evaluation for Upscaling and Transnational potential
8
1 Introduction
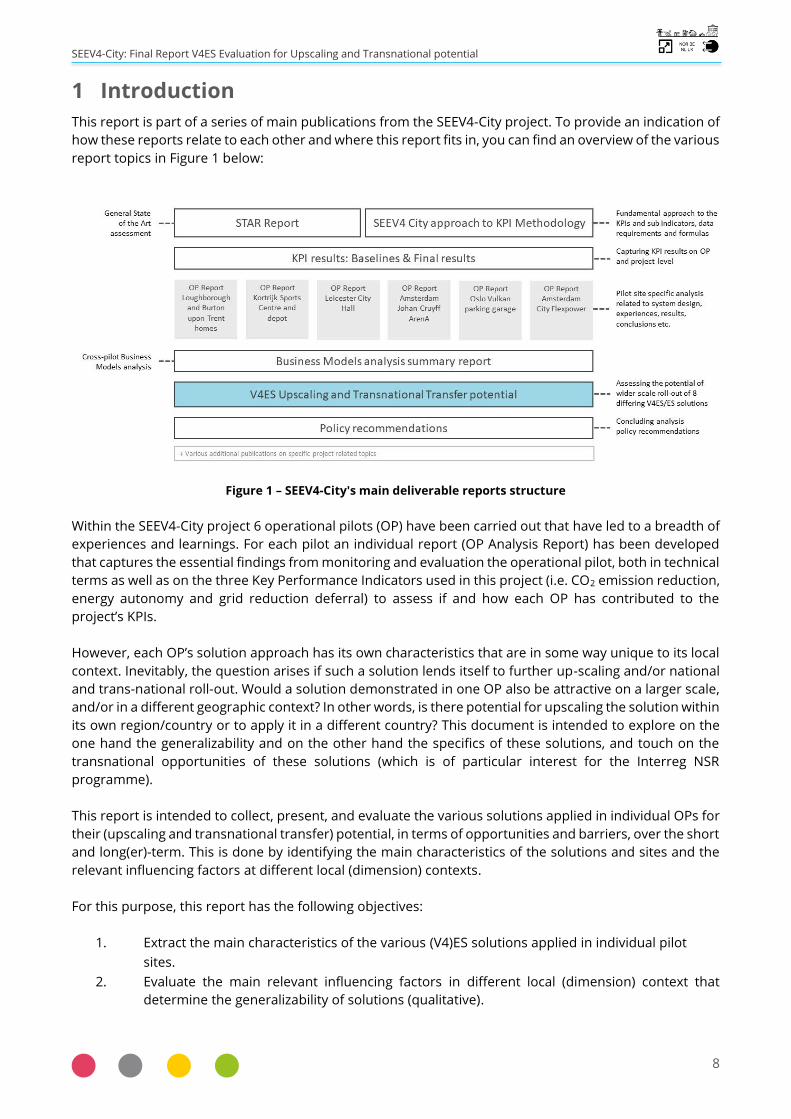
This report is part of a series of main publications from the SEEV4-City project. To provide an indication of
how these reports relate to each other and where this report fits in, you can find an overview of the various
report topics in Figure 1 below:
Figure 1 – SEEV4-City's main deliverable reports structure
Within the SEEV4-City project 6 operational pilots (OP) have been carried out that have led to a breadth of
experiences and learnings. For each pilot an individual report (OP Analysis Report) has been developed
that captures the essential findings from monitoring and evaluation the operational pilot, both in technical
terms as well as on the three Key Performance Indicators used in this project (i.e. CO2 emission reduction,
energy autonomy and grid reduction deferral) to assess if and how each OP has contributed to the
project’s KPIs.
However, each OP’s solution approach has its own characteristics that are in some way unique to its local
context. Inevitably, the question arises if such a solution lends itself to further up-scaling and/or national
and trans-national roll-out. Would a solution demonstrated in one OP also be attractive on a larger scale,
and/or in a different geographic context? In other words, is there potential for upscaling the solution within
its own region/country or to apply it in a different country? This document is intended to explore on the
one hand the generalizability and on the other hand the specifics of these solutions, and touch on the
transnational opportunities of these solutions (which is of particular interest for the Interreg NSR
programme).
This report is intended to collect, present, and evaluate the various solutions applied in individual OPs for
their (upscaling and transnational transfer) potential, in terms of opportunities and barriers, over the short
and long(er)-term. This is done by identifying the main characteristics of the solutions and sites and the
relevant influencing factors at different local (dimension) contexts.
For this purpose, this report has the following objectives:
1. Extract the main characteristics of the various (V4)ES solutions applied in individual pilot
sites.
2. Evaluate the main relevant influencing factors in different local (dimension) context that
determine the generalizability of solutions (qualitative).
SEEV4-City: Final Report V4ES Evaluation for Upscaling and Transnational potential
9
3. Explore upscaling and (transnational) transfer potential of the (V4)ES solutions given the
relevant influencing factors (where possible based on fundamental quantitative context)
4. Compile and summarize cross-pilot conclusions and recommendations to capitalize on
upscaling/transfer opportunities in ‘should be’ circumstances.
This report highlights the potential on a regional/national and ultimately international level. In section 3
we provide a summary the local landscape with regards to the four dimensions identified to have impact
on the (V4)ES services that have been developed within the SEEV4-City project. The Upscaling and
Transnational transfer potential evaluations of each service is explored in more detail in sections 4 (smart
charging), 5 (V2X) and 6 (energy), followed by the identification of Key Conclusions and Recommendations
in section 7.
This report is part of SEEV4-City’s Work Package 4 (Operational Pilots Implementation and Coordination)
but also links to Work Package 3 (Intelligence (Data analysis, monitoring and simulation) Work Package 5
(Policy and Business Case) covering (aspects of) tasks 4.4h, 3.3a, 5.3 and 5.4 and 5.5.
SEEV4-City: Final Report V4ES Evaluation for Upscaling and Transnational potential
10
2 Evaluation approach
Central to this report is the concept of how well the (V4)ES solutions demonstrated in the OPs can be
scaled up and/or transferred to contexts in other countries, considering influencing factors relating to
regulation, energy markets, development of renewable energy (RE), storage and electric vehicles (EVs) and
EVSE (electric vehicle supply equipment) etc, of different local context
The SEEV4-City partners in the project were keen to undertake a qualitative and quantitative analysis that
would offer an in-depth assessment considering each individual influencing factor to analyse how it
impacts a (Vehicle4) Energy Service’ potential on a detailed (and highly quantified) level. After determining
the amount of effort and time this would require the project partners had to conclude the project’s
timeline did not allow for such a detailed analysis. However, it was possible to perform an evaluation that
considers these influencing factors on a qualitative level. Therefore, the evaluation provided in this report
consists of a primarily qualitative approach, providing information about the potential by indicative means
accompanied with an impact profile of the relevant influencing factors (possible barriers and enabling
conditions).
The value of this effort lies in the utilisation of the lessons and insights that can be extracted from the
project’s activities, combined with additional relevant research. This has allowed the project partners to
perform an evaluation that provides a solid foundation for those who wish to delve deeper into the details
of individual influencing factors for specific local situations, as well as provide insights of cross-cutting
commonalities useful for further adoption in individual projects as well as for policy and SUMEPs
(Sustainable Urban Mobility and Energy Plans) development.
2.1 Identified new (Vehicle4) Energy Services
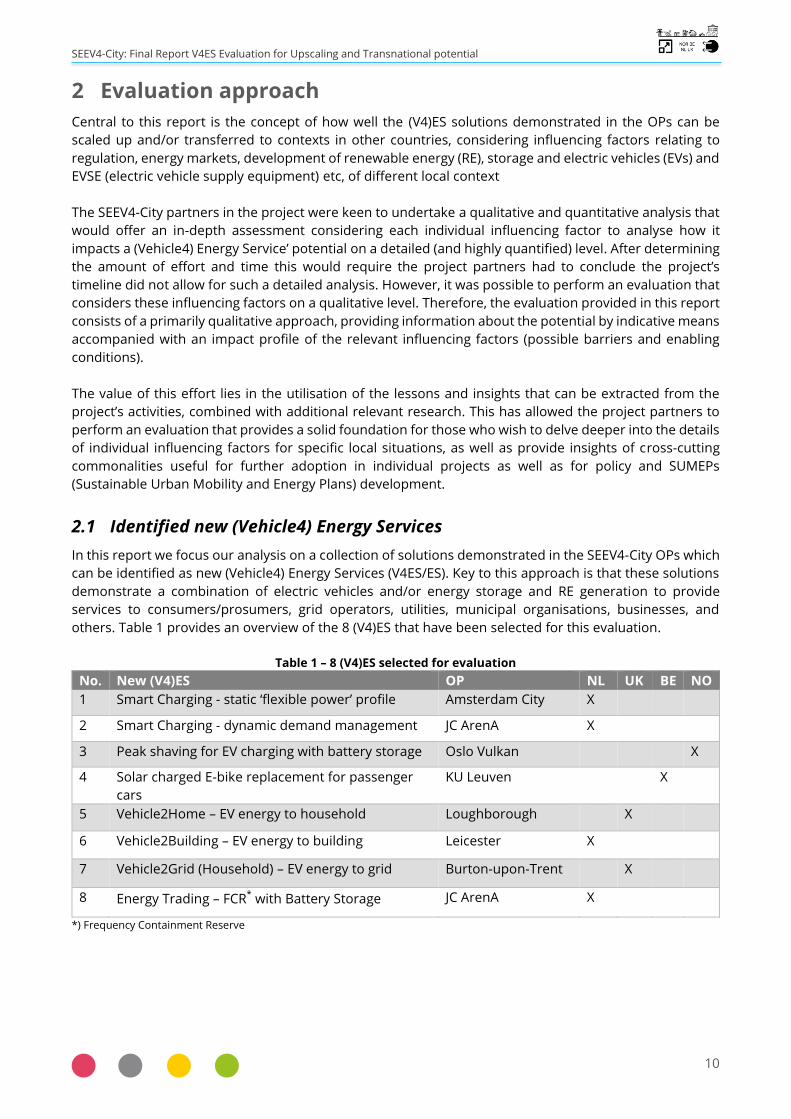
In this report we focus our analysis on a collection of solutions demonstrated in the SEEV4-City OPs which
can be identified as new (Vehicle4) Energy Services (V4ES/ES). Key to this approach is that these solutions
demonstrate a combination of electric vehicles and/or energy storage and RE generation to provide
services to consumers/prosumers, grid operators, utilities, municipal organisations, businesses, and
others. Table 1 provides an overview of the 8 (V4)ES that have been selected for this evaluation.
Table 1 – 8 (V4)ES selected for evaluation
No. New (V4)ES OP NL UK BE NO
1 Smart Charging - static ‘flexible power’ profile Amsterdam City X
2 Smart Charging - dynamic demand management JC ArenA X
3 Peak shaving for EV charging with battery storage Oslo Vulkan X
4 Solar charged E-bike replacement for passenger
cars
KU Leuven X
5 Vehicle2Home – EV energy to household Loughborough X
6 Vehicle2Building – EV energy to building Leicester X
7 Vehicle2Grid (Household) – EV energy to grid Burton-upon-Trent X
8 Energy Trading – FCR* with Battery Storage JC ArenA X
*) Frequency Containment Reserve

SEEV4-City: Final Report V4ES Evaluation for Upscaling and Transnational potential
11
2.2 Roll-out scenarios and local context landscape
The analysis provides insights in barriers but also opportunities and conditions for success. We consider
two main roll-out scenarios:
3. Upscaling considers the potential of the particular V4ES/ES beyond the current scale but within the
boundaries of the same country (i.e. to what extent could a particular solution be rolled out across
the county); and also looks at a 5 to 10-year future-horizon, considering the possibility of expected
or recommended changes compared to the current (short-term) situation.
4. Transnational Transfer relates to the potential for transferring a (V4)ES solution to any of the other
three (project) countries outside the country where the OP itself is located. (i.e. to what extent
would a (V4)ES like Flexpower also be an attractive proposition in the UK, Belgium or Norway).
In general, from analysing the individual OPs and discussions with partners regarding the scope (width
and depth) of factors that are of influence and impact the viability of upscaling and transferring solutions
the partners were able to identify the following four main dimensions:
(i) Regulatory context
(ii) Energy market and grid infrastructure
(iii) Automotive market: EV, charging infrastructure provision and operation
(iv) Customer or ‘prosumer’ related aspects
Both scenarios will be explored with a qualitative evaluation, often complemented with a quantitative data
that underpin the conclusions and assessments. Table 2 shows a non-exhaustive list of the influencing
factors. In evaluating the potential for the individual V4ES this list can be used to make a qualitative
assessment of possible opportunities, barriers, and conditions under which and to what level the
particular V4ES is likely to be successful in the two mentioned scenarios. For the transnationality transfer
only the directly involved NSR-countries within this project were assessed (Netherlands, UK, Belgium, and
Norway). Sections 4, 5 and 6 provides a qualitative assessment of the large(r) scale roll-out of the different
(V4)ES solutions demonstrated in the six SEEV4-city OPs.
Table 2 – Assessed dimensions and corresponding influencing factors
Dimension Examples of influencing factors considered
Regulatory context
Energy taxation schemes
Emissions / subsidy schemes
Standardisation
Energy market and grid infrastructure
Price structures
Barriers/opportunities energy trading
Renewables size
Battery storage
Grid stability
Age and future-readiness
Automotive market
EV penetration and growth expectations
Popular EV models (V2G compatible)
Customer / prosumers aspects
SEEV4-City: Final Report V4ES Evaluation for Upscaling and Transnational potential
12
State of awareness/ acceptance, possible market-segments, drivers
2.3 Potential-indicator explained
The various partners involved had some debate as to how to rate and express the potential of a solution
resulting from evaluating above dimensions and related influencing factors. Any change in the number of
(context-related) variables within any of the influencing factors can significantly impact the potential of an
individual service. Expressing the evaluation outcomes in expected market-shares or percentage of
adoption (both considered options) would not only require a massive undertaking of assessing and rating
different ‘change’ pathways (requiring quantitative analysis on much more detailed levels) with a high risk
of missing access to specific data, it would also mean the output provided could soon become outdated
and less useful.
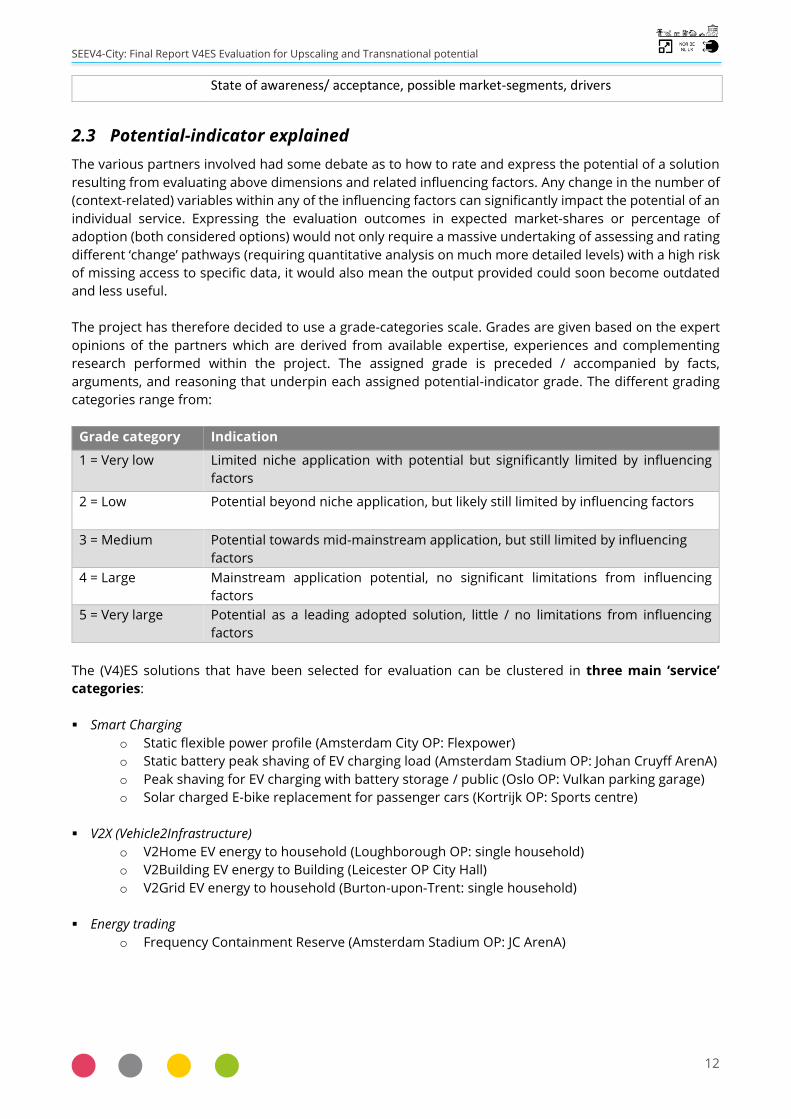
The project has therefore decided to use a grade-categories scale. Grades are given based on the expert
opinions of the partners which are derived from available expertise, experiences and complementing
research performed within the project. The assigned grade is preceded / accompanied by facts,
arguments, and reasoning that underpin each assigned potential-indicator grade. The different grading
categories range from:
Grade category Indication
1 = Very low Limited niche application with potential but significantly limited by influencing
factors
2 = Low Potential beyond niche application, but likely still limited by influencing factors
3 = Medium Potential towards mid-mainstream application, but still limited by influencing
factors
4 = Large Mainstream application potential, no significant limitations from influencing
factors
5 = Very large Potential as a leading adopted solution, little / no limitations from influencing
factors
The (V4)ES solutions that have been selected for evaluation can be clustered in three main ‘service’
categories:
Smart Charging
o Static flexible power profile (Amsterdam City OP: Flexpower)
o Static battery peak shaving of EV charging load (Amsterdam Stadium OP: Johan Cruyff ArenA)
o Peak shaving for EV charging with battery storage / public (Oslo OP: Vulkan parking garage)
o Solar charged E-bike replacement for passenger cars (Kortrijk OP: Sports centre)
V2X (Vehicle2Infrastructure)
o V2Home EV energy to household (Loughborough OP: single household)
o V2Building EV energy to Building (Leicester OP City Hall)
o V2Grid EV energy to household (Burton-upon-Trent: single household)
Energy trading
o Frequency Containment Reserve (Amsterdam Stadium OP: JC ArenA)
SEEV4-City: Final Report V4ES Evaluation for Upscaling and Transnational potential
13
3 Country evaluations: barriers and opportunities landscape
3.1 Cross-cutting
Electricity prices in all other NSR countries are in (at least in part) determined by peak demand, either
directly reflected in consumption tariffs or indirectly in costs resulting from capacity (that must be
sufficient to absorb such peaks), or both. Solutions that help to reduce these peaks make economic sense,
but the financial business case may vary per location. Since the grids of the countries participating in
SEEV4-City (Norway, Belgium, The Netherlands, United Kingdom) and Germany are connected, any
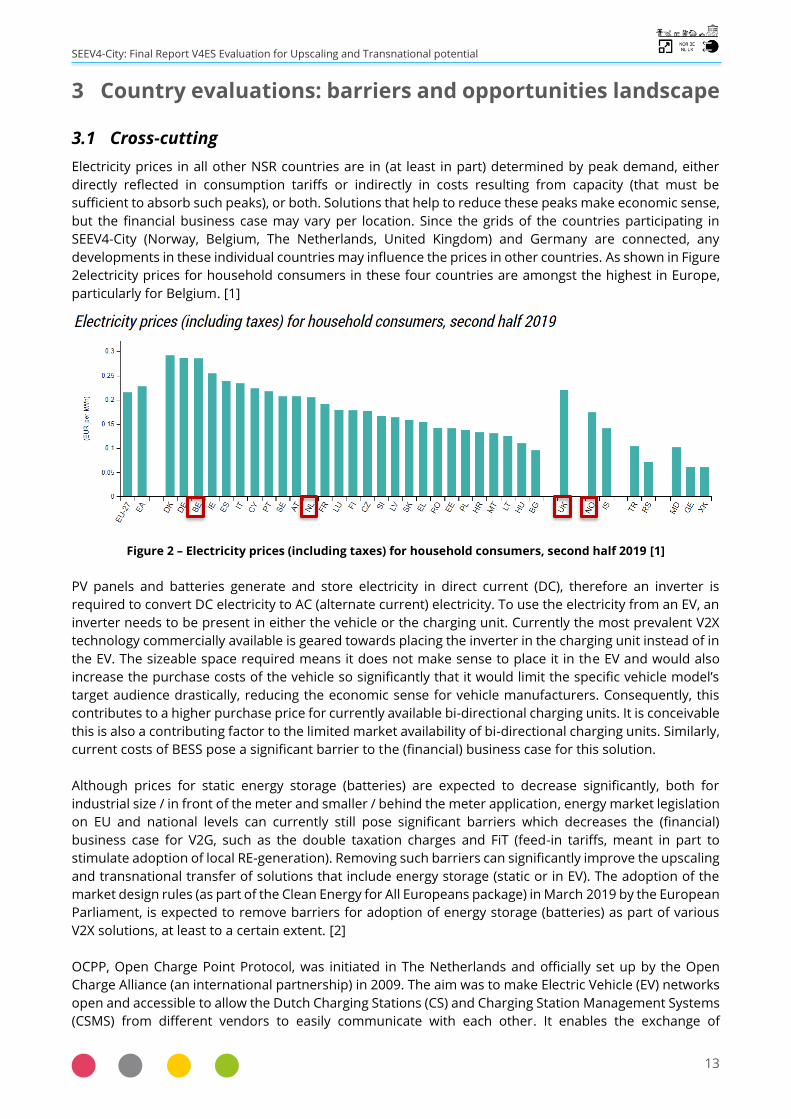
developments in these individual countries may influence the prices in other countries. As shown in Figure
2electricity prices for household consumers in these four countries are amongst the highest in Europe,
particularly for Belgium. [1]
Figure 2 – Electricity prices (including taxes) for household consumers, second half 2019 [1]
PV panels and batteries generate and store electricity in direct current (DC), therefore an inverter is
required to convert DC electricity to AC (alternate current) electricity. To use the electricity from an EV, an
inverter needs to be present in either the vehicle or the charging unit. Currently the most prevalent V2X
technology commercially available is geared towards placing the inverter in the charging unit instead of in
the EV. The sizeable space required means it does not make sense to place it in the EV and would also
increase the purchase costs of the vehicle so significantly that it would limit the specific vehicle model’s
target audience drastically, reducing the economic sense for vehicle manufacturers. Consequently, this
contributes to a higher purchase price for currently available bi-directional charging units. It is conceivable
this is also a contributing factor to the limited market availability of bi-directional charging units. Similarly,
current costs of BESS pose a significant barrier to the (financial) business case for this solution.
Although prices for static energy storage (batteries) are expected to decrease significantly, both for
industrial size / in front of the meter and smaller / behind the meter application, energy market legislation
on EU and national levels can currently still pose significant barriers which decreases the (financial)
business case for V2G, such as the double taxation charges and FiT (feed-in tariffs, meant in part to
stimulate adoption of local RE-generation). Removing such barriers can significantly improve the upscaling
and transnational transfer of solutions that include energy storage (static or in EV). The adoption of the
market design rules (as part of the Clean Energy for All Europeans package) in March 2019 by the European
Parliament, is expected to remove barriers for adoption of energy storage (batteries) as part of various
V2X solutions, at least to a certain extent. [2]
OCPP, Open Charge Point Protocol, was initiated in The Netherlands and officially set up by the Open
Charge Alliance (an international partnership) in 2009. The aim was to make Electric Vehicle (EV) networks
open and accessible to allow the Dutch Charging Stations (CS) and Charging Station Management Systems
(CSMS) from different vendors to easily communicate with each other. It enables the exchange of
SEEV4-City: Final Report V4ES Evaluation for Upscaling and Transnational potential
14
information with other interfaces, thus improving interoperability [3]. OCPP has currently become the de
facto protocol standard for charging infrastructure but its adoption varies some across the different
countries depending on which charge point vendors are active on the market. As for the four countries
where the SEEV4-City project pilots took place, adoption rate may differ slightly, but because many of the
same vendors are operating across all four countries the differences are near-negligible. Open Charge
Alliance has indicated bi-directional power flow (V2G/X) is on the agenda in coming years. [4]
Currently, to conduct Vehicle2Home services, a CHAdeMO-compliant vehicle is needed, which is mostly
likely to be a Nissan Leaf. There are only a limited number of bi-directional compatible electric vehicles
available on the market today. Currently these are the BEVs Nissan Leaf and NV200 van and the PHEV
Mitsubishi Outlander. Renault has been embarking on custom trials for their ZOE (focusing on AC bi-
directional) but these are not yet commercially available. Many vehicle manufacturers have indicated they
are exploring the possibility of facilitating bi-directional charging for future models, which is a positive
sign, but in no way a guarantee for coming years as there is no clear ‘market-decision’ yet towards either
AC or DC based technology for the vehicle nor the charging units. Nissan’s recent models seem to forego
the traditional CHAdeMO DC in favour of CCS (Combined Charging System) for European releases,
indicating a potential focus shift from CHAdeMo to CCE in the future. Likewise, early 2029 CharIN
published their 2025 roadmap for grid integration (for V2H, V2G) of charging systems based on the
Combined Charging System (CCS) [5]. All in all, it looks like the industry is moving to CCS as a standard.
Still, the bi-directional functionality is yet under development, and there are limited compatible EVs
available on the market today. Fortunately, the first bi-directional chargers carrying both the CHAdeMo
and the CCS connector have entered the public domain [6]. These are indication that in the EV and
charging unit market will converge into a more standardised market and an increase availability of
compatible models. The general EV manufacturers’ positions on warranty provision for V2X is currently
unclear. Products may also need vehicle manufacturer approval to maintain warranty for the car battery.
In a similar fashion to compatibility of EV models, the availability of bi-directional chargers is limited as
well, although there has been a significant growth in the number of choices available on the market since
inception of the SEEV4-City project.
The EU Energy Performance of Buildings Directive [7], and the resulting national policies, does also set
some requirements (depending on size of the parking facility, new or existing and differentiating between
residential and non-residential) for preparations of (future) charging infrastructure. However, it does not
yet include or clarify criteria for ‘smartness’ or compatibility with EU charging connector standards. The
ability to control the charging process is crucial for integrating high numbers of EVs into the electricity
system and contributes to optimising the energy use of buildings. EV growth trends are and will in many
regions exceed the need of these minimal requirements.
The EV market growth trends of recent years are set to continue, resulting in a steeply increasing electrified
fleet in all countries and is set to expand beyond the passenger cars to vans, buses, and trucks as well. At
the time of writing, it is not yet clear how different countries and cities within these four countries will
make structural changes to mobility and energy provision as a result from the COVID-19 crisis.
Nevertheless, a marked shift in public opinion towards low-carbon (and zero-emission) mobility and
energy generation is expected, as the air quality improvements due to COVID-19 lockdowns have
convincingly demonstrated that drastic changes are possible and provide results. As such, an acceleration
of plans developed at different governmental scales (cities, regions or provinces, countries, Europe-wide,
such as the Green New Deal [8] is likely to occur, such as increasing the amount of cycle paths in a city, or
restricting the movement of cars and trucks in city centres through tailpipe emission taxes or permits.
With European legislation recognizing the key role energy storage can play for the grid energy trading
services will continue to grow and will likely evolve into a collection of different services. The FCR market
is becoming more interconnected with a regional project dedicated to a common market for procurement
and exchange of FCR for Europe’s CSA (Continental Synchronous Area - also known as the Synchronous

SEEV4-City: Final Report V4ES Evaluation for Upscaling and Transnational potential
15
Grid of Continental Europe). The initiative currently involves ten Transmission System Operators (TSOs)
from seven countries within this ‘CSA’. These are the TSOs from Austria (APG), Belgium (Elia), Switzerland
(Swissgrid), Germany (50Hertz, Amprion, TenneT DE, TransnetBW), France (RTE), The Netherlands (TenneT
NL) and Western Denmark (Energinet) to join. [9]
Europe can currently meet its daily demand for FCR and the joint auction contributes to some additional
stabilization across those markets, but the capacity to transfer between countries is still limited. Export
limits to the grid and core (auction) shares of each participating country must be still respected and
remaining missing volumes must still be procured locally. National grids in all countries will continue to
have a need for grid balancing with rising RE generation and growth in electricity demand (with a
significant part contributed by the rise of EV charging resulting from steep growth of the (PH)EV market
share). Although the need will continue to exist, recently the FCR market did see a slowdown [10] indicating
the frequency containment reserve (FCR) markets are showing some saturation in former leading regions
such as the UK and Germany. This drove down the price for FCR services, providing less earnings to those
offering the services, but simultaneously lowering costs of balancing grid, which is good news to TSOs and
consumers. The FCR market (and related markets such as energy storage market) is still growing in
maturity, knowledge in both the energy sector and policy makers is still evolving. Legislation and resulting
requirements are expected to change with it.
Of the four countries, Belgium and particularly The Netherlands have the highest degree of bicycle and
ebike ownership, appropriate infrastructure and cycling culture. However, popularity of ebikes has
massively increased in recent years across all countries. More than market, regulatory and technological
changes and developments, cultural changes and infrastructure modifications are needed for increased
ebike ownership and thus the need and potential of ebike charging stations. In terms of regulations ebikes
(up to 25 km/h) and speed pedelecs (up to 45 km/h) are classified differently under EU legislation. Speed
pedelecs are classified as a type of moped and therefore a numberplate, helmet and drivers’ licence are
required. Beyond this regulation (such as where they can ride) is still somewhat unclear. Charging of ebikes
is done using a separate charger which charges from a standard wall plug, with a typical power draw <200
W. For smart charging, this means that either the wall plugs or the chargers need to be controlled. No
common ebike charging standard (comparable to the OCPP for EV charging) exists, with each ebike battery
having its own proprietary charging protocol and charging cables/pins. In a sense, the ebike and ebike
charging market is similar to the smartphone market before 2009, when the European Commission
pushed smartphone manufacturers to use a common external power supply charging protocol. As smart
charging is a relatively new area for the bicycle market, a broader dialogue with the market should help
stimulate that incentive.
While ebikes are not cheap with prices ranging between €1,000 and €4,000 (up to €9,000 for speed
pedelecs capable of reaching 45 km/h), there is the potential they could compete with cars for those that
are debating to opt for/keep a car but find the biking distance too far for a ‘normal’ bike. A willingness to
invest a similar amount as the purchase price of the ebike (needed to perform the necessary engineering,
business development and rollout for docking/charging stations) is considered to be limited to companies
with (large) fleets of ebikes using the same charging protocol and performing the required engineering to
allow smart charging of ebikes.
3.2 Belgium
The uptake of EVs in Belgium is expected to grow significantly from its low base of approximately 15,000-
20,000 BEVs (i.e. battery electric vehicles, thus excluding hybrid vehicles) in 2019 [11], to more than
700,000 [12] by 2030. An estimation made in February 2020 using Chargepoint.com database, there were
around 2,029 charge points in Flanders, 47 in Brussels and 101 in Wallonia [13] by end of 2019.
As is the case for the UK, the limited availability and higher purchase cost of V2G chargers compared to
unidirectional chargers, as well as the uncertain developments in the prevailing technology in coming

SEEV4-City: Final Report V4ES Evaluation for Upscaling and Transnational potential
16
years, complicates the business case and therefore the likelihood of deployment in the short term.
Ultimately, the EV-uptake growth in Belgium may end up being well timed as the market for bi-directional
chargers becomes more diverse and the questions surrounding the prevailing technology settles.
Similarly, uptake of battery storage systems in businesses and residences for behind-the-meter
applications in Belgium will be hampered in the short term by the still-high purchase costs of batteries on
the one hand, and regulatory reform on the other. Changes to billing structures are expected to kick in
from 2022 at the earliest [14]. Absent subsidy support schemes or strong market development which
reduces purchase costs, similar to what has been done in Germany for home energy storage systems,
make the short-term potential for behind-the-meter batteries lower than EVs with V2G.
Nuclear energy has traditionally had an important position in the Belgian energy mix. In 2018 however
unavailability among various nuclear generation units has resulted in a significant drop from 50% to 35%
in 2018 and even as low as only 15% in October 2018. Imports account for 22% of 2018's energy mix and
Renewable energy generation grew by 18% in comparison with 2017 [15]. The ratio of nuclear largely
rebounded again to 48.8% in 2019 but plans to phase out nuclear from 2025 are still ongoing. With post
coal phase-out in 2016 and incumbent nuclear phase-out in 2025, Belgium is facing a base-load capacity
vacuum. Growth in renewable energy is not likely to fill this and would still require solutions for its
intermittent nature. Gas is expected to replace nuclear power base-load capacity from 2025 and
renewable power (excluding hydro ower) is also expected to double its capacity from 9.5 GW in 2019 to
reach 18.1 GW by 2030 [16]. However, Smart Charging solutions, including for V2H and V2G are expected
to be able to provide a contribution to the solution for Belgium’s future electricity grid [17]. Wallonian
energy regulator ‘Commission wallonne pour l'Energie’ (CWaPE) announced a grid fee will be applied to
energy ‘prosumers' as of early October 2020. The tariff will be determined by electricity distribution
network operators and will apply to all prosumers, regardless of the energy production technology used.
Although the charge will be reimbursed by the government until 2022, when only 54% will be given back,
from 2024, generators will have to pay the fee in full [18]. A similar charge has been applied in the Flemish
part of Belgium since July 2015, where it is linked to generation capacity.
The age of the Belgian electricity grid results in the fact that there have been (and still are) issues for
charging EVs. In Brussels, for example, 80% of the grid still runs on 230V. Particularly for fast(er) charging
this is an issue. Although this is less so (around 30-40% on average) in other Flemish cities like Antwerp,
Mechelen and Gent and other areas in Flanders, still approximately a third of the Flemish grid in the
ground does not have a neutral conductor. Some EVs recognize this and refuse to charge. In newer EV
models this seems to have been resolved. It is logical to reason this, in part, explains why the adoption of
EVs and implementation of Charging units is lagging noticeably compared to the other three NSR countries
[19] [20]. The ratio (except for inner-city areas) of homes that include a private parking garage or driveway
is relatively high, which means here the charging of EVs should be less of an issue, particularly when
charging at night.
On 1st January 2019, there were 4,552,745 buildings in Belgium [21], of which around 3.5-3.8 million are
estimated residential houses and flats (apartments) for both Flanders [22] and Wallonia (estimated). With
nearly 38% of these being detached and almost 40% being semi-detached or townhouses [23], these
dwelling types are most suited for V2H application. Although in urbanised areas, a high ratio of residents
lives in apartment buildings. Approximately 22% of Belgians live in flats and apartment complexes, a
percentage which has grown significantly in recent years, not only in the main cities, but in smaller
municipalities as well. Taking into account the requirements for charging infrastructure preparations for
any parking facilities in such apartment buildings these are likely to become an interesting marketing
segment for similar solutions, particularly when these sites provide opportunities for roof or otherwise
dedicated PV generation.
The roll-out of smart meters is ongoing in Belgium. People with photovoltaic panels and holders of a
budget meter have priority for the installation of a digital meter until the end of 2022. In Wallonia, the

SEEV4-City: Final Report V4ES Evaluation for Upscaling and Transnational potential
17
initial objective was to equip 80% of households with a digital meter by 2034, but the government appears
to have lowered its targets. As of April 2020, the future plans of digital meters in Brussels is still unclear.
There are currently no time-of-use tariffs or other dynamic pricing schemes available for end-user in
Belgium, except for:
fixed or variable contracts where variable contracts base monthly or quarterly consumption costs
on market prices over that timeperiod.
the peak/off-peak tariff scheme. In most cases, peak periods for electricity are from 7 am to 10
pm on weekdays (Monday to Friday) while off-peak periods are from 10 pm to 7 am on weekdays
(Monday to Friday) and the weekend. But there may be some variation across different regions.
DNO and Electricity suppliers are exploring how such services could take shape, as is shown by Fluvius
[24], but timelines are uncertain. In 2019, ahead of national government elections, Fluvius also published
a set of (policy) recommendations in light of new and future developments for utilities. It includes a
recommendation for a smart capacity tariff aimed at reducing local capacity peak reduction which would
reward consumers for smart use of the available capacity. They also plead for a change in policy for the
current practice of passing on grid investment costs (related to the energy transition) to the electricity bill.
This significantly increases the cost-component of grid costs on the bill and diminishes the stimulus for
renewable energy [25]. They argue that electricity is the energy carrier of the future for many purposes
and therefore should no longer be passed on through the consumer’s electricity bill but by other means,
or at least be decoupled from the electricity bill.
A study performed by Powerdale about the profile of the Belgian EV-driver provides some interesting
insights, such as that currently 83,5% of the EVs are company owned (but 46% of them would buy the
same car if they were purchasing a privately-owned car), that 50% of EV-drivers own photovoltaic solar
panels and 70% of e-drivers are interested in a car with V2G technology. [26]
The main benefit of ebikes comes from their very low energy need per km, even more so in combination
with smart (solar) charging, which overall results in a large drop in CO2 emissions by replacing an ICEV (a
nearly -97% CO2 decrease per km driven). In practice, the direct energy impact of the ebike charging
station on energy autonomy and grid investment deferral will be very limited given the limited power
draw, yet the CO2 savings can be large for commuting distances of up to (around) 25 km each way per
working day. That same limited power draw, however, also means that ebikes will demand significantly
less from any installed PV, allowing for more to be used for other purposes.
The ebike market in Belgium is large, at approximately 50% of all bicycles sold (500,000 total per year).
Within Belgium, Flanders sees approximately 16% of all trips (leisure and work-related) done using a
bicycle, with high (e)bicycle ownership: there is approximately 1 bicycle per adult. Additionally, attention
to health impacts due to transport emissions is increasing, both on the end-user side and the authorities.
Many cities (medium to large) are considering or implementing policies with the aim of curbing the
emissions as well as stimulate other means of transport than the (ICE) vehicles. Currently, a single OEM
dominates the market for (solar-based) smart charging of ebikes in Belgium. The remainder of the ebike
(charging) market is fragmented.
In Flanders, many companies provide financial support to employees by reimbursing some of the costs
for commuting with their own car, the so-called “kilometre reimbursement”. These costs include
insurance, maintenance costs, etc. To promote commuting by bicycle, the government allows companies
to give a bicycle support allowance of 0.24 €/km in 2020. One of the biggest constraints about this bicycle
salary top-up scheme is that the employer is not obliged to give a bicycle top-up in the same manner as
the car kilometre reimbursement and can limit it in various ways and as a consequence it can no longer
compete with the other benefits that cars provide, such as flexibility in transporting more goods or
passengers, protection from the elements, compared with the active mobility benefits of cycling to work.
This suggest that the policy instruments currently in use in Flanders are neither conducive to stimulating
active personal mobility (bicycles, ebikes or walking), nor helpful in reducing CO2 emissions and air
SEEV4-City: Final Report V4ES Evaluation for Upscaling and Transnational potential
18
pollution due to transport. Research by Attentia shows that the average commute of Belgian company car
drivers has shrunk from 29 km in 2012 to 23 km in 2018. [27]
3.3 Norway
The Norwegian Parliament has decided on a national goal that all new cars sold by 2025 should be zero-
emission (electric or hydrogen). To date, mid 2020, there are around 290,000 BEVs and 130,000 PHEVs on
the road in Norway. In March 2020, just ahead of major COVID-19 impacts across Europe, a market share
of 55.9 % [28] of all Norwegian new registrations was achieved. The Nissan Leaf was Norway's best-selling
new passenger car model in 2018 but other (new) models are increasing in popularity, such as the Tesla
Model 3, Volkswagen e-Golf, Audi e-Tron, Hyundai Kona, Renault Zoe, BMW i3, Kia Soul, Hyundai Ioniq and
the Nissan E-nv200. The speed of the transition is closely related to policy instruments and a wide range
of incentives. The current Government has decided to keep the incentives for zero-emission cars until the
end of 2021 when they may be adjusted parallel with the market development [29]. On the other hand,
Norway has a different approach to public charging in comparison to, for example the Netherlands,
approximating around 13,000 public charges, many fast chargers among them.
A Norwegian survey of BEV and PHEVs owners by Figenbaum and Kolbenstvedt in 2016 [30] identified the
type of users, their vehicle use, their purchase motivation and how they rated this transport technology
compared to ICE vehicles. EV owners are found to be typically younger, with more children and vehicles,
with a higher share of being employed, and with longer work trips than other groups. BEVs are overall and
on weekdays used more, but less on holidays. BEV users manage their everyday driving without significant
issues, as only 6% aborted their trips and 83% never abandoned their planned trips – and improved EV
charging infrastructure could reduce the remaining service issues by half. PHEVs were driven for 55% of
the kilometres in electric mode and for 63% whilst on work journeys. Reduced operational cost and
environmental considerations motivate EV purchasers, as do incentives such as the free toll roads in the
case of BEV users.
The Norwegian central grid, and electricity generation, distribution and transmission is mature, but
evolving. The energy mix of the electricity grid is noteworthy different from other countries, with 98
percent of the electricity production come from renewable energy sources. Hydropower is the source of
most of the production [31]. The amount of PV installed in Norway is logically comparative low to other
countries due to its grid already nearing 100% renewable. Norway did reach 120 MW of solar generation
capacity at the end of 2019, according to figures released by Norwegian solar industry body the
Solenergiklyngen. 51 MW of this of new solar capacity was added last year, of which 35% was made up by
residential systems. This clearly indicates PV is on the rise.
Grid outages / blackouts can happen in Norway, but are rare, including Oslo, although there are some
localized areas where there is no spare capacity for growth. Norway needs a strong flexible grid for
international and national capacity to balance out grid stress. Norwegian authorities are aiming for a
higher share of solar and wind vis-à-vis the currently about 93.7% [32] share of hydropower generated
electricity to facilitate expected growth in electricity demand as well as providing alternatives for
hydropower in drier winters. This will require more solutions to balance the grid. Either through energy
storage, peak shaving or stimulate the spread in charging behaviour across the day.
Electricity prices in Norway are relatively low. Price composition in the recent past, and most likely in the
future are higher in or after drier winters since less hydropower is generated. The way the electricity price
is composed of (changed in 2019) consist of 3 parts: the basic energy/power cost, a contribution towards
maintenance and development of systems known as the Grid rent, and an additional taxation which
includes a CO2 tax. The wide-scale smart meter roll-out is advanced. This, combined with factors such as
the high percentage of local hydropower generated electricity, favoured the introduction and broad
acceptance of Real-Time Pricing. Currently, around 71% of households and 88% of SME und small
industries chose RTP tariffs. Around 27% of the households chose dynamic Time of use tariff and only 2%
SEEV4-City: Final Report V4ES Evaluation for Upscaling and Transnational potential
19
fixed price tariffs [33]. V2G, in terms of exporting to the grid, has regulatory barriers since the energy
regulator's control of the design of the electricity markets does not yet allow aggregated services to bid in
the electricity markets. Currently Norway lacks a specific policy framework for V2G and would be treated
in the same way as solar feed-in to the grid.
There are 2,610,040 dwellings in Norway, 49% of which are detached houses [34]. These dwelling types
are most suited for V2H application. Although in urbanised areas, a high ratio of residents lives in
apartment buildings or townhouses, for example 61% of Oslo residents are currently living in multiple-
family buildings (apartments or townhouses).
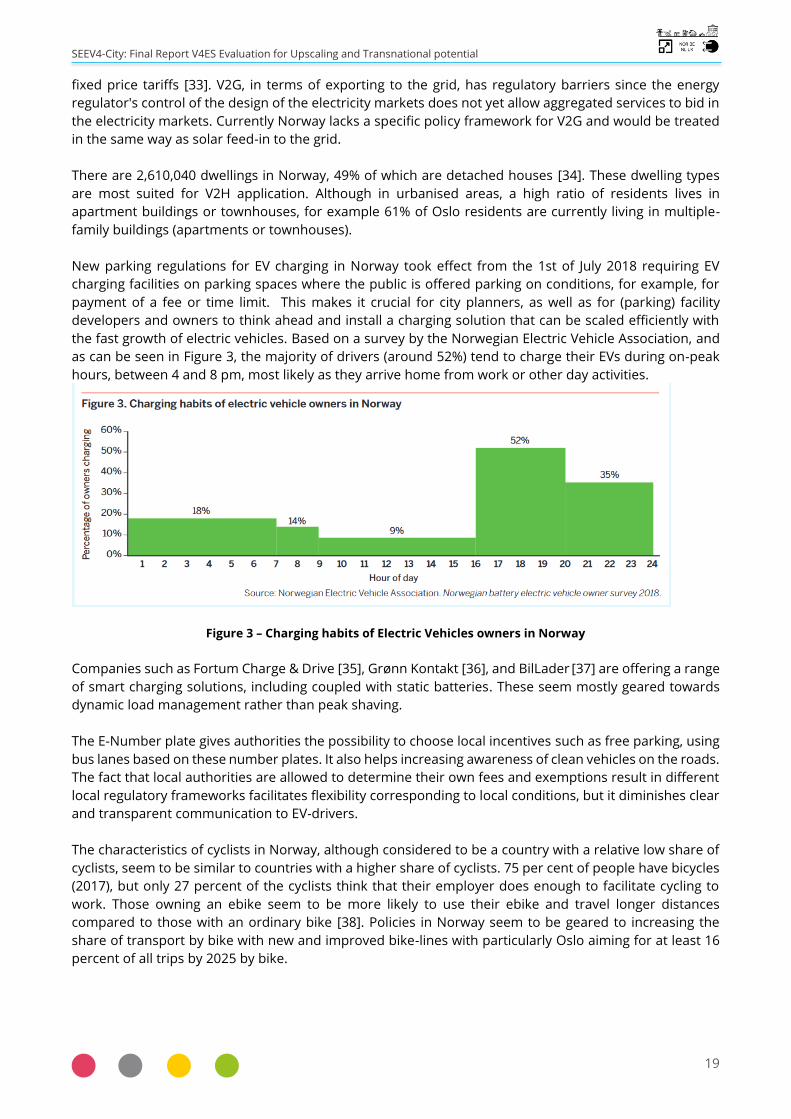
New parking regulations for EV charging in Norway took effect from the 1st of July 2018 requiring EV
charging facilities on parking spaces where the public is offered parking on conditions, for example, for
payment of a fee or time limit. This makes it crucial for city planners, as well as for (parking) facility
developers and owners to think ahead and install a charging solution that can be scaled efficiently with
the fast growth of electric vehicles. Based on a survey by the Norwegian Electric Vehicle Association, and
as can be seen in Figure 3, the majority of drivers (around 52%) tend to charge their EVs during on-peak
hours, between 4 and 8 pm, most likely as they arrive home from work or other day activities.
Figure 3 – Charging habits of Electric Vehicles owners in Norway
Companies such as Fortum Charge & Drive [35], Grønn Kontakt [36], and BilLader [37] are offering a range
of smart charging solutions, including coupled with static batteries. These seem mostly geared towards
dynamic load management rather than peak shaving.
The E-Number plate gives authorities the possibility to choose local incentives such as free parking, using
bus lanes based on these number plates. It also helps increasing awareness of clean vehicles on the roads.
The fact that local authorities are allowed to determine their own fees and exemptions result in different
local regulatory frameworks facilitates flexibility corresponding to local conditions, but it diminishes clear
and transparent communication to EV-drivers.
The characteristics of cyclists in Norway, although considered to be a country with a relative low share of
cyclists, seem to be similar to countries with a higher share of cyclists. 75 per cent of people have bicycles
(2017), but only 27 percent of the cyclists think that their employer does enough to facilitate cycling to
work. Those owning an ebike seem to be more likely to use their ebike and travel longer distances
compared to those with an ordinary bike [38]. Policies in Norway seem to be geared to increasing the
share of transport by bike with new and improved bike-lines with particularly Oslo aiming for at least 16
percent of all trips by 2025 by bike.
SEEV4-City: Final Report V4ES Evaluation for Upscaling and Transnational potential
20
3.4 The Netherlands
The Netherlands is seen internationally as a significant player in the field of electric mobility. When it
comes to charging infrastructure, it was ranked the country with the highest density of charge points
globally [39]. The total amount of BEVs in The Netherlands has reached 131,000 as of August 2020, with
an additional 102.431 PHEVs. Growth estimations of EVs in the Netherlands could reach >1,9 million EVs
on the road in 2030. There are 59.860 (semi)public charge points and 1.463 fast chargers. The number of
private charge points is a bit less clear, but the last estimate indicates around 100,000 [40].
OCPP, Open Charge Point Protocol was initiated in The Netherlands by the Open Charge Alliance in 2009
and its adoption by the market went fast in The Netherlands, followed quickly by other countries. Even
though protocol for V2G is anticipated in coming years [41] interoperability remains a challenge and
warrants close attention. Relatively speaking The Netherlands has also been host to a relatively high
number of V2X initiatives, but the high purchase costs for bi-directional charging units as well as battery
storage devices (for further optimisation of supply and demand) compared to unidirectional chargers are
considerable. These are substantial inhibiting factors for smart(er) charging solutions such as
Vehicl2Home, -Building or -Grid, as implemented in various SEEV4-City pilots.
Currently there are fixed versus flexible tariff options, but the flexible price structuring is still limited to
day/night tariffs and is determined based on the capacity of the connection, not allowing for flexibility in
offering capacity availability. This long-standing regulation originally implemented to ensure equal pricing
for customers is under review, as it is a significant inhibitor for accommodating for and achieving full
potential the growth in EVs can give. It may be revised in coming years, but until such moment, it does
limit the potential for several solutions applied in the Netherlands as there is little flexibility in offering
compensation in the business models, which in turn impacts the financial business case and ROI. The
Dutch net-metering scheme (‘salderingsregeling’) for home/building owners with PV-systems is set to
change as of 2023 to with the aim of being eliminated step by step, which is expected to accelerate the
market for home storage systems.
Historically for The Netherlands the share of coal and (in particular) natural gas has been high. A policy
change [42] will likely require The Netherlands to import gas at least initially. Still, it has already resulted
in a significant growth-spurt for renewable energy, increasing production to account for 18 percent of
electricity consumption in the Netherlands in 2019, compared to 15 percent in 2018 [43].
Much of the electricity network in the Netherlands was designed several decades ago, obviously without
taking into consideration EVs. Although the electricity grid in The Netherlands is considered to be mature
and has been operating steadily (with relatively little outages) for the past decades there is a significant
age to the grid and with growing demand for electricity, capacity is becoming more of an issue in various
regions and locations. Additionally, the demand growth is expected to rise much more because of factors
such as the further digitisation of society (demand by ICT – The Netherlands, Amsterdam and Northern
provinces in particular, are known as data centre hotspots) and the demand from EVs. Dutch DSOs are
identifying increasing limitations to the remaining capacity for growth, as indicated by one of the Dutch
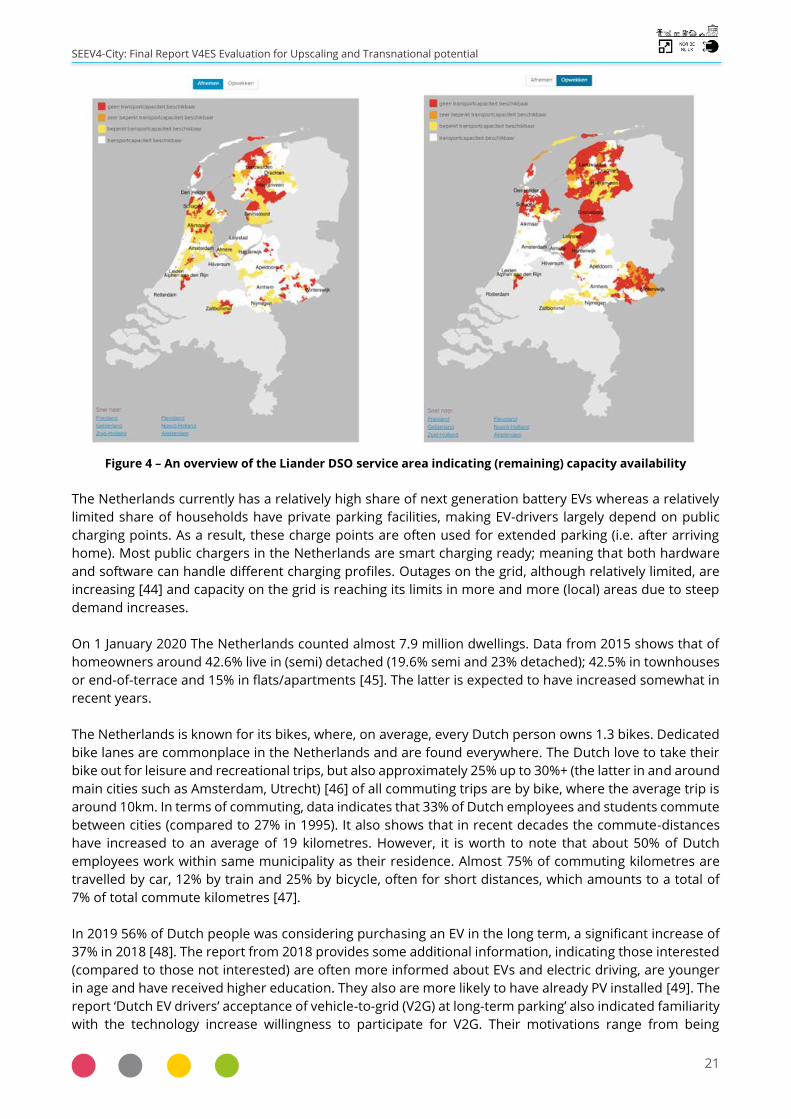
DSOs in Figure 4 below. Here, yellow indicates limited capacity availability, and red means no additional
capacity available. With significantly more renewable generation planned and growing demand, the grid
is increasingly reaching critical mass. Grid investments are expensive but are increasingly likely to be
considered financially beneficial (in the longer term), from the main grid infrastructure down to the local
grid connection capacity.
SEEV4-City: Final Report V4ES Evaluation for Upscaling and Transnational potential
21
Figure 4 – An overview of the Liander DSO service area indicating (remaining) capacity availability
The Netherlands currently has a relatively high share of next generation battery EVs whereas a relatively
limited share of households have private parking facilities, making EV-drivers largely depend on public
charging points. As a result, these charge points are often used for extended parking (i.e. after arriving
home). Most public chargers in the Netherlands are smart charging ready; meaning that both hardware
and software can handle different charging profiles. Outages on the grid, although relatively limited, are
increasing [44] and capacity on the grid is reaching its limits in more and more (local) areas due to steep
demand increases.
On 1 January 2020 The Netherlands counted almost 7.9 million dwellings. Data from 2015 shows that of
homeowners around 42.6% live in (semi) detached (19.6% semi and 23% detached); 42.5% in townhouses
or end-of-terrace and 15% in flats/apartments [45]. The latter is expected to have increased somewhat in
recent years.
The Netherlands is known for its bikes, where, on average, every Dutch person owns 1.3 bikes. Dedicated
bike lanes are commonplace in the Netherlands and are found everywhere. The Dutch love to take their
bike out for leisure and recreational trips, but also approximately 25% up to 30%+ (the latter in and around
main cities such as Amsterdam, Utrecht) [46] of all commuting trips are by bike, where the average trip is
around 10km. In terms of commuting, data indicates that 33% of Dutch employees and students commute
between cities (compared to 27% in 1995). It also shows that in recent decades the commute-distances
have increased to an average of 19 kilometres. However, it is worth to note that about 50% of Dutch
employees work within same municipality as their residence. Almost 75% of commuting kilometres are
travelled by car, 12% by train and 25% by bicycle, often for short distances, which amounts to a total of
7% of total commute kilometres [47].
In 2019 56% of Dutch people was considering purchasing an EV in the long term, a significant increase of
37% in 2018 [48]. The report from 2018 provides some additional information, indicating those interested
(compared to those not interested) are often more informed about EVs and electric driving, are younger
in age and have received higher education. They also are more likely to have already PV installed [49]. The
report ‘Dutch EV drivers’ acceptance of vehicle-to-grid (V2G) at long-term parking’ also indicated familiarity
with the technology increase willingness to participate for V2G. Their motivations range from being

SEEV4-City: Final Report V4ES Evaluation for Upscaling and Transnational potential
22
compensated to knowing they are contributing to solutions for societal challenges (environmental and
relieving grid stress). Requirements ranged from accurate and transparent communication and relatively
smooth integration with their ‘normal’ (EV) use patterns [50]. The number of commercially available
services entering the Dutch market appear higher than the other three NSR countries within SEEV4-City.
From a regulatory perspective, however, Vehicle2Grid is likely to suffer from double taxation. The current
‘salderingsregeling’ scheme is scheduled to be scaled down, starting in 2023 and ending altogether in
2031. Although, bottom line, this means the prosumer receives less for each kWh it delivers back to the
grid, it does have the potential to make self-consumption (and V2H/G) more attractive.
3.5 United Kingdom
In the United Kingdom around 30,000 charge points (incl. approximately 11,000 public) and various
subsidy schemes (such as for municipalities) are put in place to keep up with rising (B)EV popularity. The
UK is amongst the top growth countries in Europe in number of EVs. Figure 5 below shows the number of
electric vehicles registered in the UK – at the end of August 2020 there were almost 340,000 plug-in
vehicles with 142,273 BEVs and 196,800 PHEVs registered. Last year saw the biggest annual increase in
number of registrations, with more than 72,000 electric vehicles registered showing a growth of 22% on
2018. This year, despite the coronavirus impact, it is already surpassing last year’s growth rate [51].
Figure 5 – Cumulative number of plug-in vehicles registered in the UK (2012 to date)
Around 27,000 Leafs have been sold in the UK, meaning that with the right charging equipment, many of
these cars could participate in Vehicle2Home services. However, as with all other countries, it also
illustrates the lack of availability of V2G compatible EV models, relatively steep purchase costs and (for the
longer term) uncertainty which direction the market in bidirectional charging technology is headed in
coming years (e.g. AC vs DC). Vehicle2Home services are governed under the UK’s Distribution Network
Code, part G99, which requires a pre-installation application and potential post-installation checks, which
can be an inhibiting factor as it restricts the range from which a customer may choose.
For the UK the average energy mix of electricity in 2019 was around 241 g/kWh [52] with (natural) gas
making up over half of this. There was high growth of RES till around 2016, followed by a relative steep
decline of new PV additions (all types) for several years following [53]. However, wind and solar have been
on the rise again, particularly due to large (wind and solar PV farms), as can be seen in Figure 6, and
analysis indicates half of UK’s electricity could be renewable by 2025. UK ambitions have been set high
with a pledge, and was signed into law in 2019, a target for net zero-emission by 100% relative to 1990
levels by 2050. The UK sets a Carbon budget every five years. This sets a statutory cap on total GHG
emissions, which should not be exceeded. In order to meet the commitments corresponding policies are

SEEV4-City: Final Report V4ES Evaluation for Upscaling and Transnational potential
23
required, but to date no noteworthy (new) policy introductions then have been implemented since its
pledge. To date, 282 Local authorities as well as the UK government have declared a climate emergency
with the aim of formalising political commitment and acknowledging (local, national) authorities need to
act. UK’s Sixth Carbon Budget, now planned to be set by December 2020 (some delay occurred due to
COVID-19), should reflect the new net-zero emission targets. Expectations are new policies, budgets and
action plans will follow. Most likely, these will be aligned with Green Recovery plans following the COVID-
19 outbreak and effects from Brexit.
Figure 6 – Data from National Grid updates every 30 minutes - midday energy mix indication on 27 May 2020
Most recent statistics by DECC (Department of Energy and Climate Change) from 2016 showed that there
were 800,000 homes with solar PV electricity panels. The Solar Trade Association [54] indicates that,
following the closure of the FIT scheme, there is no longer any mechanism for comprehensively tracking
new deployment of rooftop solar PV in the UK. A recent subsidy cut for domestic solar in 2019 seems to
have resulted [55] in a dramatic growth-drop, indicating growth for domestic roof PV slowed significantly.
STA forecasts do indicate renewed growth increase in their 2030 outlook, rebounding from the trough of
2017-18, and shows promising signs of subsidy-free growth. This recovery has been enabled by input cost
decreases; growing demand for decarbonisation from local and regional governments, businesses, and
households; and by increasing investor confidence in merchant renewable energy assets. The median cost
of a 4kW installation has reduced from £20,000 in 2010 to £6,856. This represents a 66% drop in median
installation cost since 2010 [56]. Despite subsidy cuts, up to 4 GW of new capacity has been deployed
annually in recent years, but developers at all scales from domestic rooftops to utility scale ground-mount
systems must contend with extremely congested electricity networks, onerous planning processes, and a
lack of routes to market for exported generation, and regulatory complexity and uncertainty. Deploying
the levels of solar required for achieving the UK’s legally-binding 2050 Net Zero target however, will require
a significant change in policy to enable achieving this ambition [57]. This is particularly the case should UK
wish to stimulate domestic roof PV in both private and public sector housing. Additionally, when upgrading
and/or ensuring the proper grid connection is in place for bi-directional charging, the local distribution
network may place restrictions on the power rating of the charger to ensure stability of the local grid. If
the grid is constrained, the customer may be requested to pay for a connection upgrade to support the
expected increase in incoming supply. Although for Vehicle2Home there is no expectation of export, the
exporting power will still be evaluated.
In 2015, government announced its intention to end Feed in Tariffs (FIT) scheme for new entrants in March
2019, which has been taken into effect [58]. Following the closure, the government has since recognised
the need to pay small-scale renewable energy generators for the electricity they export to the grid. So, the

SEEV4-City: Final Report V4ES Evaluation for Upscaling and Transnational potential
24
Department for Business, Energy and Industrial Strategy (BEIS) introduced the Smart Export Guarantee
(SEG) which came into effect on 1 January 2020. Anyone already receiving the preceding Feed-in Tariff on
their existing installation, remained unaffected by the launch of the Smart Export Guarantee. A customer
cannot receive both a Feed-in tariff and SEG payments, although one can choose to opt out of the previous
Feed-in Tariff scheme and receive SEG payments instead. SEG payments are not linked to other financial
support around renewable energy installations [59].
Under the SEG scheme, all licenced energy suppliers with 150,000 or more customers must provide at
least one Smart Export Guarantee tariff, including for Solar PV systems up to 5MW. For smaller suppliers
it is on a voluntary basis. The STA states it considers a fair average price between 5p and 6p/kWh (where
prices may vary at different times of the day and night, for example). However, the UK government has
only obligated electricity supply companies to buy power from ‘prosumers’ at a price above zero.
Regardless, many electricity suppliers are currently offering prices very similar to STA's suggested 'fair
average price', averaging slightly lower between 4.5 and 5p. The STA website lists the current tariff deals
available. To access a smart export tariff under the Smart Export Guarantee, there is a requirement to
provide evidence your installation is MCS (or equivalent) certified. Currently, all offers allow for solar, solar
and storage and storage installations to receive payments for any exported electricity – without additional
requirements. However, this is not a legal requirement, so it will be up to the electricity supplier offering
the tariff, firstly, as to whether they will reward power exporting from a storage unit as part of their offering
and secondly, how they want to go about this. [60]
In 2019 there were some 24.4 million homes in the UK [61]. The great majority of these were in England.
The UK housing stock is dominated by houses, with over half (52%) of homes being conjoined (built in
terraces or in pairs) and just under one fifth (18%) being detached. Just over a fifth (21%) of UK dwellings
are flats. Within the UK, there are subtle differences between the housing stocks of the four nations [62].
Figure 7 – Dwelling types by UK nations, 2017
A PWC report [63] from 2018 showed that 78% of UK homeowners have access to off-street parking.
Certainly not all have access to individual (roof) space for PV panels, but the ratio of the different dwelling
types across the UK indicate a relative high portion of housing types with suitable characteristics for the
combination of PV and bi-directional charging of EVs; i.e. dedicated roof space and private parking, but
depending on the exact local situation, there may also be other options to utilise shared parking and space
suitable for PV (or other means for local RE generation). These numbers showcase a significant
opportunity for the application of V2H/V2G.
SEEV4-City: Final Report V4ES Evaluation for Upscaling and Transnational potential
25
Currently, the most common purpose of Vehicle2Home in the UK is to reduce electricity bills by balancing
differential tariffs or costs within the dwelling. In terms of the market size, over 3.5 million (electricity)
meters in the UK are so-called ‘economy 7’, which allow two electricity rates to be measured. Mostly this
is a cheap night rate between midnight and 7am, and a more expensive daytime date Other, more
dynamic (i.e. changing in response to certain system conditions) time of use tariff schemes were
introduced starting in 2017 but are still are relatively new concept. Energy Savings Trust [64] states that in
particular “owners of electric vehicles could benefit massively from a time of use tariff.” According to a
2018 survey by Smart Energy GB [65], of 52% UK respondents indicated they are aware of the time-of-use
tariff concept, a third of respondents claim that they are currently on a time-of-use tariff. Smart Energy
GB concludes that it is unlikely that the proportion of people making use of a time-of-use tariff is this high
(35 per cent of those aware). The most recent nationwide study conducted in 2012 estimates 13 per cent
of people are enrolled in a legacy Economy 7 tariff. This figure is expected to have declined as suppliers
have moved away from Economy 7 metering to offer smart meters. Taken together with the number of
homes having PV installed, we estimate between 12-17% of homes currently have varying costs of
electricity due to their import tariff or self-generated energy.
The Smart Energy GB study lists five main smart time varying tariff designs: Static time-of-use; Dynamic
time-of-use; Real-time pricing; Critical peak pricing; Critical peak rebates or peak time rebates. The
difference between respondents believing they were using time-of-use tariffs and the more likely
percentage suggests that there is some confusion amongst the public as to what a time-of-use tariff is,
and if they are on one. The fact energy suppliers are offering prices very similar to STA's suggested 'fair
average price' can be considered as a sign that the sector recognises the value of attracting customers to
participate in smart energy solutions. Deals are specific to each household and could involve generation
and supply being metered, be time limited and have other conditions. This increases complexity for
consumers which could form a potential bottleneck for further adoption and achieving the most potential
out of these offerings. However, nine in ten of those surveyed are in the market for flexible energy tariffs
if they lead to cheaper bills. Almost seven in ten think the concept of time-of-use tariffs becomes more
appealing if they knew it was better for the environment and 6 in 10 if they knew it helped to reduce strain
on the energy network. This indicates that Vehicle2Home non-financial aspects can also be a motivation
as well as benefit households. Looking to the KPIs from this project, the use of the vehicle battery as a
storage facility can increase energy autonomy, as was seen in the Loughborough OP (KPI 2). This can allow
electricity generated on-site to be more effectively used and thus the overall carbon intensity of the
household will be reduced (KPI 1). Additionally, grid investment is theoretically avoided if the
Vehicle2Home system is optimised to limit import and export to and from the grid, although these will be
small when considered on a single household level (KPI 3).
Ebikes sales have been surging in popularity in the UK in recent years, with sales expected to top £16bn
in revenue by 2023. A report from Deloitte found that ebike sales between 2020 and 2023 would be, in
effect, outstripping sales of electric cars (by 6 times) [66]. But bike lanes are far from commonplace and
often lagging maintenance to help facilitate a comfortable and safe commute.
SEEV4-City: Final Report V4ES Evaluation for Upscaling and Transnational potential
26
4 Upscaling and transnational transfer: Smart Charging
4.1 Smart Charging with Static ‘Flexible Power’ Profile (Amsterdam City
‘Flexpower’)
4.1.1 Service description
In the OP of the City of Amsterdam a flexible power profile was applied for smart charging on public
charging points. The V4(ES) service itself can be characterized as a collection of software and services
applied on smart-charge ready charging stations providing:
Flexpower uses open smart charging protocols, such as OCPP.
Static profile - so no dynamic changes; at least in Flexpower 1; A slightly more dynamic profile is
explored in Flexpower 2. Flexpower 1 existed of 52 smart charging units with six static smart
charging profiles whereas Flexpower 2 was an upgrade to 432 smart charging units and is a bit
more sophisticated:
o the 24h grid capacity is forecasted by the DNO, translated to the open charge point protocol
and sent to the charge points.
o Flexible power (so the level of power is varied, with more power during sunny periods (using
day-ahead forecast, not real-time), with reduced power levels during peak hours and increased
power levels (during off-peak hours).
Public charging stations (but technically the solution could also be applied on private chargers).
No consumer input included (e.g. consumer charging preferences, such as expected departure
hour, are not used).
The main proposition of the Flexpower charging profile is that grid upgrades are prevented by lower
charging speeds during peak hours, while enabling higher matching with renewable energy generation
during increased power during daytime. Although it is mainly targeted for public charging infrastructure,
it can also be applied to semi-public or even large private parking facilities, such as those dedicated for
large or multiple offices (although peak-demand profiles will differ).
4.1.2 Upscaling potential in the Netherlands
The expected rise of EVs in the Netherlands will further increase the urgency of applying smart charging
profiles such as Flexpower. The main advantage of Flexpower 2 being that it is a relatively simple option,
without additional complexity of real-time steering and associated transaction costs. However, the pilot
was faced with current requirements of a heavier grid connection (adding annual grid connection costs of
around €600,-). For most smart charging initiatives the transparency to consumers is a concern, as actual
charging speeds are not transparent for the EV driver, Flexpower has the advantage of offering a relatively
transparent profile that can be shared with consumer beforehand1; but is currently limited since it does
not provide EV drivers with an override button in case their expected charging duration is cut short(er)
and urgency to charge increases. Yet, in the scope of the pilot, by far, most sessions (around 95%) could
complete charging before being disconnected, limiting EV-drivers being negatively affected. Analysis of
the (V4)ES indicates EV-users were not avoiding charging stations where flexible charging is applied.
The variations in available charging currents for different charging station in different
streets/neighbourhoods as well as the embedded charger in the vehicle is something the Flexpower pilot
had to consider. For the solution they opted for setting the maximum power available to 11 kW
(230 V x16 A x3) if a single vehicle is connected or 8.6 kW (230 V x12.5 A x3) in case of dual occupancy.
1 Note that actual transparency is hard to achieve for most smart charging pilots as this also depends on the speed of the charger in
the vehicle as well as the effects of possible double occupancy on a charging station.
SEEV4-City: Final Report V4ES Evaluation for Upscaling and Transnational potential
27
In the Netherlands, many EV-drivers largely depend on public charging points. Most of these are smart
charging ready; meaning that both hardware and software can handle different charging profiles. Analysis
(using growth-modelling) showed that the grid load increase was noticeably larger for the reference
stations compared to those using Flexpower, indicating a continued benefit of using such a solution. Grid
operators will benefit from this relatively simple smart charging scheme that does not involve sourcing
real time data and making frequent decisions in charging levels. This may be more common for future
potentially anticipated step for Flexpower (possibly adding solar; but also based on a day-ahead
estimation).
There are several reasons however why large-scale upscaling of Flexpower in the Netherlands may be
limited. Current legislation does not allow for offering dynamic price-structures for grid connection and
usage, limiting options for financial incentives for by exemption or compensation and reduces the
business case of Flexpower significantly. Allowing exemptions from these costs for smart charging
solutions such as Flexpower are being explored (in discussions with the national government) but
currently remains a bottleneck for broad application. If this legislation bottleneck can be resolved it would
likely remove the need to invest in heavier grid connections for many site owners, which improves the
business case for this V4ES significantly.
For areas where on average parking is used for extended parking stops (for example overnight parking
compared to short stays at supermarkets) a (V4)ES solution using ‘flexible power’ for charging EVs is a
viable solution, particularly to improve the utilisation rate of the electrical network. With a relatively low
rate of households having access to private parking facilities adds to the potential for this solution across
the Netherlands.
The number of competing smart charging programs is increasing rapidly (mostly by commercial parties).
The propositions in these smart charging services differ significantly for instance in terms of dynamic
nature, optimization goals (grid impact, renewable energy, energy costs) and have different technical
requirements (in terms of hardware, middleware and software). A detailed comparison between these
practices goes beyond the scope of this study, but this growth in maturity and acceptance of more dynamic
smart charging programs (Flexpower or otherwise) will also be a large determining factor of its potential
in 5 to 10 years.
Flexpower’s simple design and ease of operation still makes it very attractive and it could maintain its
scaling potential as an additional (or fall-back) profile option for days or situations where a (primarily used)
dynamic profile is less desirable.
4.1.3 Transnational transfer potential
The rate of available private parking facilities for householders are notably larger in countries such as UK
and Norway compared to availability and use of on street/(semi)public charging compared to the
Netherlands. Relevant here is the share of public charging in the total charging mix. For example, Norway
has a relatively high share of private charging and fast charging, slow public charging is much less
prominent.
Both UK and Norway especially have a comparable high EV market share and similar growth pattern to
the Netherlands. Big difference is the number of available public charging units. Penetration of EVs and
charging infrastructure may currently be considerably lower in Belgium [67] [68], however both trends
and ambitions indicate a steep growth in coming years. Belgian parking facilities are more comparable to
those in the Netherlands than for the UK and Norway, although there is a higher share of (semi) detached
dwellings which also have private off-street parking.
SEEV4-City: Final Report V4ES Evaluation for Upscaling and Transnational potential
28
Despite parking facilities profiles differing in primarily Norway and UK, the EV penetration rates in these
countries still make them important markets to explore the opportunities of smart charging. For example,
in Norway a smart charging schemes like Flexpower may be less viable because of the relative smaller
portion of slow public charging facilities but can still be a useful and easy to adopt solution on a more
individual location level, particularly where load capacity is a limiting factor. Belgian parties (from policy
makers to parking facilities and energy suppliers) could be well positioned to take learnings from solutions
for a relatively faster roll-out. If the growth rates for Belgium are in line with the ambitions, solutions such
as Flexpower offer a low adoption threshold, which can result in a more rapid roll-out.
Although the concerns of reducing peak loads in (public) charging infrastructures do occur in other
countries such as Norway, UK and Belgium, a noteworthy limiting factor at this moment is the level at
which public chargers are smart charging ready. As such the Flexpower project provides valuable learnings
on the conditions for rolling out public charging infrastructures in other countries and the requirements
to ensure the possibilities of applying smart charging. A necessary condition for success for Flexpower is
the price premium to be paid for grid enforcement to allow higher than normal power during off peak
hours. The potential for Flexpower is higher in countries where the marginal costs of grid enforcements
is low.
Legislation that allows for (and an energy market which is willing and able to offer) tariff and pricing
structure flexibilities will largely determine the potential for Flexpower or emerging (future) smart charging
services. In the three other countries legislation does not (yet) allow such flexibilities or are in their
infancies. Therefore, the current legislation on and availability (including transparency and understanding
of) dynamic price-structures in the three other NSR countries are also limiting the potential. However,
changes seem to be (in some degree) considered or a topic of discussion on all countries. For example,
the Flemish regulator for electricity and gas markets, VREG has been engaging in consultations with
stakeholders [69] to change components and calculation methods of the electricity bill. In the UK
legislation and the energy market seems to be furthest advanced, yet the awareness and correct
understanding of these amongst the general public is still low.
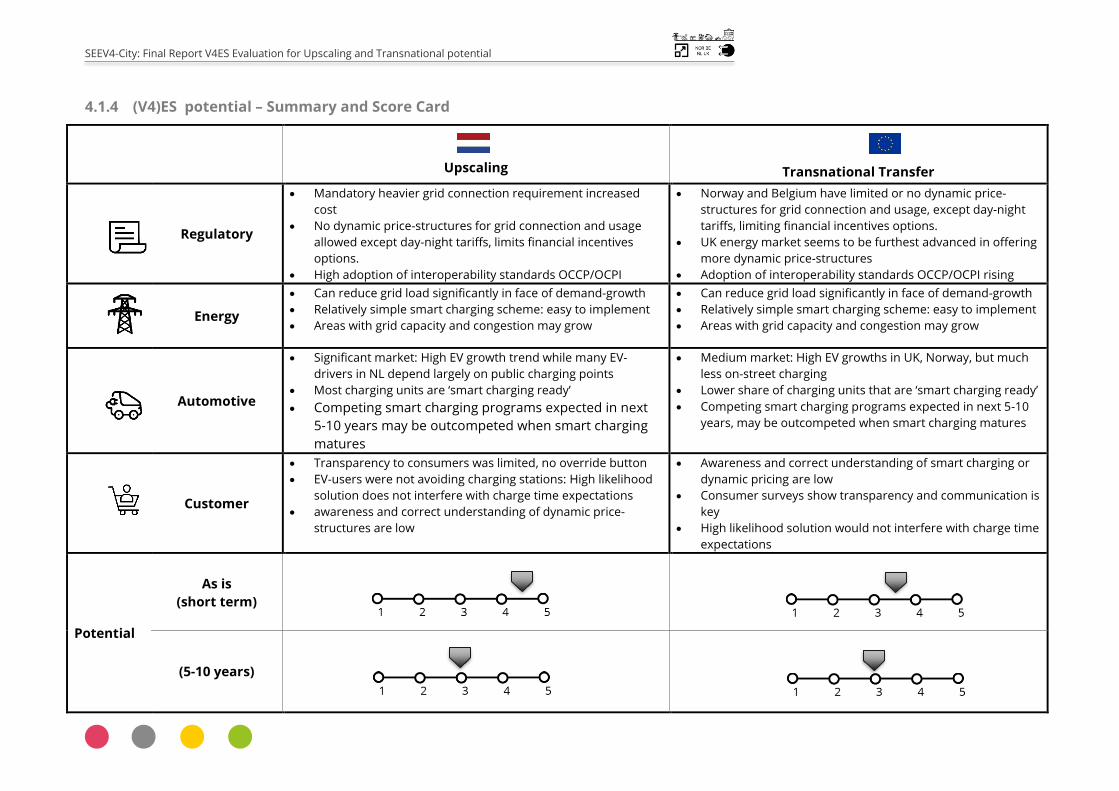
SEEV4-City: Final Report V4ES Evaluation for Upscaling and Transnational potential
4.1.4 (V4)ES potential – Summary and Score Card
Upscaling
Transnational Transfer
Regulatory
Mandatory heavier grid connection requirement increased
cost
No dynamic price-structures for grid connection and usage
allowed except day-night tariffs, limits financial incentives
options.
High adoption of interoperability standards OCCP/OCPI
Norway and Belgium have limited or no dynamic price-
structures for grid connection and usage, except day-night
tariffs, limiting financial incentives options.
UK energy market seems to be furthest advanced in offering
more dynamic price-structures
Adoption of interoperability standards OCCP/OCPI rising
Energy
Can reduce grid load significantly in face of demand-growth
Relatively simple smart charging scheme: easy to implement
Areas with grid capacity and congestion may grow
Can reduce grid load significantly in face of demand-growth
Relatively simple smart charging scheme: easy to implement
Areas with grid capacity and congestion may grow
Automotive
Significant market: High EV growth trend while many EV-
drivers in NL depend largely on public charging points
Most charging units are ‘smart charging ready’
Competing smart charging programs expected in next
5-10 years may be outcompeted when smart charging
matures
Medium market: High EV growths in UK, Norway, but much
less on-street charging
Lower share of charging units that are ‘smart charging ready’
Competing smart charging programs expected in next 5-10
years, may be outcompeted when smart charging matures
Customer
Transparency to consumers was limited, no override button
EV-users were not avoiding charging stations: High likelihood
solution does not interfere with charge time expectations
awareness and correct understanding of dynamic price-
structures are low
Awareness and correct understanding of smart charging or
dynamic pricing are low
Consumer surveys show transparency and communication is
key
High likelihood solution would not interfere with charge time
expectations
Potential
As is
(short term)
(5-10 years)

SEEV4-City: Final Report V4ES Evaluation for Upscaling and Transnational potential
4.2 Smart Charging with dynamic demand management (Amsterdam JC ArenA)
4.2.1 Service description
The Johan Cruijff ArenA (JC ArenA) is a big events location in Amsterdam, where national and international
football matches, concerts and music festivals take place for up to 68,000 visitors. The JC ArenA presents
a complex testbed for innovative energy services, with a consumption of electricity comparable to a district
of 2700 households. Thanks to the 1 MWp solar installation on the roof of the venue, the JC ArenA already
produces around 8% of the electricity it needs, the rest is by certified regional wind energy.
In the JC Arena OP a first pilot has started with 14 EV chargers of 22 kW each, all connected to one central
distribution point. Without smart charging, the peak load could be 14 * 22 = 308 kW when all chargers are
fully utilised. This peak will not occur often, however, a smart management system is developed and
installed so the peak limit can be set flexible. The local energy infrastructure is designed for a max of 210 A
(145 kW). The achieved cost reduction is in the order of 15 k€, mainly on local cabling as grid capacity is
more than enough in the JC Arena. It became clear that there are two unique selling points for this V4ES:
1. Installation costs and grid investment: Dynamic (Charging) Demand Management provides
opportunities of substantial savings on installation costs and, in cases where the local grid is
relatively weak enough, on grid investment.
2. Electricity prices: Dynamic (Charging) Demand Management can also provide economic benefits
to companies that have flexible energy tariffs (varying from day/night tariffs to real time trading
prices) by shifting charging sessions to more favourable tariff hours.
This V4ES is applied with the following characteristics:
Dynamic power management, by reducing power levels when demand surpasses a certain power
level.
Semi-public parking facility with charging stations.
Charging hubs with >10 charging stations.
4.2.2 Upscaling potential in The Netherlands
A key aspect of the JC ArenA pilot is that it has adopted multiple (vehicle4) energy services, in effect it is a
real living lab environment where several technological solutions exist together. This makes particularly
interesting as it shows that locations do not have to necessarily chose between one or the other. It does
of course mean additional attention needs to be paid to safeguard how different services co-exist and
operate (in parallel or complementary to each other). Appointing one person or party responsible for
coordinating the design, implementation and management of the system (also when solutions are
adopted incrementally), is highly beneficial and recommended to capture the most potential of each
individual service as well as the combined package. We are aware that copying the combination of these
services to the exact detail is not likely in terms of upscaling it to other locations, be it in The Netherlands
or elsewhere. However, we identified significant overlap related to the various influencing factors, even if
the impact of these may vary per solution.
A growing share of organisations are not only seeking zero-emission vehicles but are also actively pursuing
more sustainable fleet management in the instalment of charging infrastructure to facilitate the transition
to an all-electric fleet. In theory a large share of these charging sites are possible candidates of applying
Dynamic (Charging) Demand Management as was adopted at JC ArenA and is particularly suitable for
public and private organizations with electric vehicles parked and charging for a several hours at their
premises. The larger the fleet is, the more attractive this service becomes.
SEEV4-City: Final Report V4ES Evaluation for Upscaling and Transnational potential
31
i. where a larger amounts of chargers are clustered on one grid connection
ii. where the grid connection is likely in need of being enforced, and
iii. fleets with a large amount and/or share of EVs (e.g. >10)
iv. receive a large number of EVs from visitors charging for several hours on end (e.g. >10)
A slightly different target group is (private) charging infrastructure in apartment complexes. With the
growing amount of EVs also requiring charging opportunities in these buildings, the added demand can
add to instalment costs, necessity for grid enforcement due to increased peak demands. It is unclear how
big this market is; given the known complexities with installing large-scale charging infrastructure in
private buildings this market is likely to be much smaller than the fleet-owner market in the short term;
and would be mostly applicable in urban areas. EV growth trends are and quite possibly exceed the
minimal requirements in regulatory context, such as those resulting from the EU Energy Performance of
Buildings Directive, which means city planners, architects, project developers and investors would do well
to consider these trends in the stages of design and individual business case assessments. This will
significantly improve the potential and ease of adopting smart charging solutions such as applied at JC
Arena.
Annual grid connection costs are higher for the 3x35 A grid connection compared to the regular 3x25 A
for public charging stations. These tariff groups differ considerably between grid operators in the
Netherlands. The price premium of the 3x35 A grid connection can mount up to €400-€700 per charging
station (with 2 sockets) on an annual basis. For the Netherlands there are fixed versus flexible tariff
options, but the flexible price structuring is still limited to day/night tariffs. These current regulatory and
market limitations to real-time or otherwise dynamic pricing structures limit the potential and flexibility in
cost, load and/or environmental impact optimisation. With indications this may change over the space of
5 to 10 years, the potential for type of V4ES is likely to increase.
The solution developed by the ArenA and The Mobility House can be applied to abovementioned market
segments. Yet, similar solutions have been developed by companies such as Allego, EV Box and
NewMotion (as part of Shell). Given the potential value of providing smart charging services for fleet
owners and public organisations with large fleets it is highly likely that this (type of) V4ES will have a large
market share in the Netherlands in the coming years. There is however a large variety in the type of
services provided (e.g. dynamic versus static charging, battery storage excluded/included, trading on
energy market yes/no etc) and the types of organizations where these different solutions make the most
sense. The partners in the ArenA are likely to further develop their proposition for the Dutch market;
where the proposition may also include developing the relevant algorithms that can be used by charge
point operators.
As such, this pilot has led to key knowledge in terms of operating conditions for applying this dynamic
charging demand management in an operational pilot. This can be applied both for similar or augmented
services to B2B clients or through regular CPOs. With current growth figures of the number of semi-public
chargers in the Netherlands may rise to 100,000 by 2025 for which a substantial share is likely suitable for
applying this type of V4ES. But given the expected variety of similar services it will likely ‘share’ the market
with these different solutions.

SEEV4-City: Final Report V4ES Evaluation for Upscaling and Transnational potential
32
4.2.3 Transnational transfer potential
Similar to The Netherlands, the need for smart solutions for charging infrastructure and its connection
requirements will increase for locations with parking facilities in the other three NSR countries, and in fact
most other countries as well. The solution applied in JC ArenA has a higher potential in countries with high
EV penetration rates (e.g. Norway) and/or size of the EV market (in absolute numbers; UK). Although
growth and ratio of EV and charging infrastructure differs for Belgium, there is still a shared trend,
especially viewed over the longer term, in 5 to 10 years’ time. This service is particularly suited for fleets
of cars and locations where (electric) vehicle parking with a significant base load, around 10 vehicles or
more, which are parked for several hours on end. There may be particular grid characteristics in the NSR
countries that favour the use of this service, particularly age and/or (remaining capacity) weakness of the
grid.
There are some barriers that limit the potential of applying this Dynamic Charging Demand Management
also in other (NSR) countries. A possible barrier lies in the application of open protocols such as OCPP as
this solution is targeted for visitors making the interoperability of these charging stations much more
urgent. As in the Netherlands, current regulatory and market availability limitations (with a slight exception
of the UK) to real-time or otherwise dynamic pricing structures limit the potential and flexibility in cost,
load and/or environmental impact optimisation. With indications this may change over the space of 5 to
10 years across the board, which would diminish such barriers, the potential for type of V4ES is likely to
increase.
Despite some variations in the geographic spread, there are sufficient similarity in the market segments,
specifically for the urbanised areas and cities, to expect that the pattern of market development and
growth will be comparable for the coming years. The fact that many of the service suppliers are active in
all four countries and the expected EV growth curve across these countries (even if for Belgium the
timeline may slightly deviate) will play a key role in the attractiveness of Dynamic Charging Demand
Management, as well as the sheer market size for this type of smart charging solution. Meaning it can be
expected that a variety of similar but different dynamic power management solutions will become
available on the market. For example, when (regulatory) barriers for flexible pricing structures are
decreased or removed altogether, the (charging) service market may utilise this flexibility to develop
charging services to EV-drivers to steer and manage charging demand.
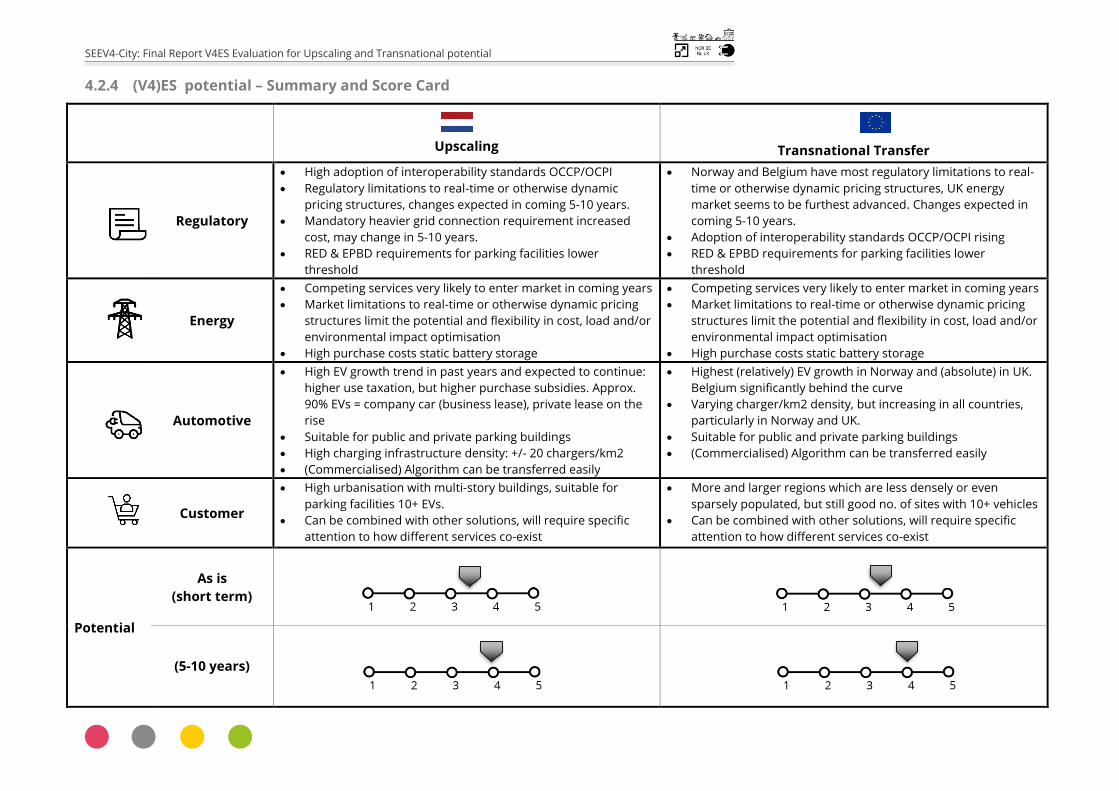
SEEV4-City: Final Report V4ES Evaluation for Upscaling and Transnational potential
4.2.4 (V4)ES potential – Summary and Score Card
Upscaling
Transnational Transfer
Regulatory
High adoption of interoperability standards OCCP/OCPI
Regulatory limitations to real-time or otherwise dynamic
pricing structures, changes expected in coming 5-10 years.
Mandatory heavier grid connection requirement increased
cost, may change in 5-10 years.
RED & EPBD requirements for parking facilities lower
threshold
Norway and Belgium have most regulatory limitations to real-
time or otherwise dynamic pricing structures, UK energy
market seems to be furthest advanced. Changes expected in
coming 5-10 years.
Adoption of interoperability standards OCCP/OCPI rising
RED & EPBD requirements for parking facilities lower
threshold
Energy
Competing services very likely to enter market in coming years
Market limitations to real-time or otherwise dynamic pricing
structures limit the potential and flexibility in cost, load and/or
environmental impact optimisation
High purchase costs static battery storage
Competing services very likely to enter market in coming years
Market limitations to real-time or otherwise dynamic pricing
structures limit the potential and flexibility in cost, load and/or
environmental impact optimisation
High purchase costs static battery storage
Automotive
High EV growth trend in past years and expected to continue:
higher use taxation, but higher purchase subsidies. Approx.
90% EVs = company car (business lease), private lease on the
rise
Suitable for public and private parking buildings
High charging infrastructure density: +/- 20 chargers/km2
(Commercialised) Algorithm can be transferred easily
Highest (relatively) EV growth in Norway and (absolute) in UK.
Belgium significantly behind the curve
Varying charger/km2 density, but increasing in all countries,
particularly in Norway and UK.
Suitable for public and private parking buildings
(Commercialised) Algorithm can be transferred easily
Customer
High urbanisation with multi-story buildings, suitable for
parking facilities 10+ EVs.
Can be combined with other solutions, will require specific
attention to how different services co-exist
More and larger regions which are less densely or even
sparsely populated, but still good no. of sites with 10+ vehicles
Can be combined with other solutions, will require specific
attention to how different services co-exist
Potential
As is
(short term)
(5-10 years)
SEEV4-City: Final Report V4ES Evaluation for Upscaling and Transnational potential
4.3 Smart Charging by Peak shaving with static battery (Oslo Vulkan parking
garage)
4.3.1 Service description
The Oslo Vulkan operational pilot, representing the vehicle-to-street/neighbourhood (V2N) scale, is a large
parking garage relatively near the inner centre serving the mixed-used Vulkan estate. There are 450 spaces
in the parking garage (Vulkan P-hus), with 102 of them reserved for EVs (about 22.7% of the total). The
Oslo Vulkan car park location has all the characteristics of the expected fusion between building, energy
and transport sectors in the (near) future. In the case of the solution applied as part of the pilot, this is
Peak Shaving of EV Charging infrastructure electricity demand from the grid by way of a EV charging
infrastructure connected with a phase balancing inverter and a battery (energy) stationary storage (BESS).
The BESS is pre-programmed to discharge to the collective EV charging infrastructure above a set power
demand threshold (within a DC nano-grid) and charging from the central grid at another (much lower)
power demand threshold. The amount of energy stored is limited (app. 50 kWh). The EV charging
infrastructure serves both residents, professional users (such as taxi’s and Car2Go) and rental companies,
as well as general public drivers.
The peak shaving algorithm uses two thresholds, one charging threshold and one discharging threshold. The
static battery will react to the total power and current consumption from both the DC and the AC chargers
collectively. If total import power for this exceeds the discharging power threshold, the static battery will
start to discharge to the EV chargers. If the imported power is below the charge threshold set, the static
battery will charge from the grid. Thus, the peak shaving is based on real-time measurements of the EV
charging infrastructure’s power consumption. This seemed to be the best way you could use the relatively
small capacity of the battery since the EV charging consumption in the parking garage has increased
significantly over the last years (to approximately 300 kW per h and 3,000 kWh per day prior to COVID-19
on a weekday).
Although the pilot’s duration proved to be too short for demonstrable grid deferral within the pilot's
timeframe, projections based upon measured trends and, under the assumptions of a full use of the BESS
and a linear increase of EV charging infrastructure demand, do show worthwhile results for potential grid
deferral delay. Using an estimated EV increase rate of 10% and estimation of increased power demand of
12% (in line with the increasing penetration of EVs in Oslo), analysis showed that the BESS system, by
carrying out peak shaving of 50 kW, is capable of postponing the need for system reinforcement to mid-
2023 (which translates to approximately 3 years). In order to increase the deferral of necessary grid
investments beyond 2023, the capacity of the BESS (stationary battery and the inverter) has to be
increased in order to provide the same potential effectiveness as the current BESS (or better).
4.3.2 Upscaling potential in Norway
Grid outages / blackouts can happen in Norway, but are still rare, including Oslo, although there are some
localized areas where there is no spare capacity for growth. Based on research and analysis for the pilot,
the premise of the peak shaving solution applied in Vulkan parking garage may therefore have significant
potential for upscaling, however some changes or alternate approaches would be recommended such as
static battery sizing matching any (projected) increased power/electricity demand, a tight integration
between the static battery and the EV charging infrastructure (including prediction / management
software ) and an additional ‘line of defence’ to reduce power provided to chargers / charging connections
at peak demand period.
Norway has a relatively low number of on-street public charge points per EVs (approximately 13,000) but
has many fast chargers among them. It also has a high ratio of private charging facilities, mostly dedicated
SEEV4-City: Final Report V4ES Evaluation for Upscaling and Transnational potential
35
to (semi) detached houses or indoor apartment building parking garage. Given this profile, the spread of
(collective) charging load and peak-shaving could also be viable option at other public locations. Taking
into account the indications of how EV-drivers in Norway use and charge their cars, there is potential to
consider locations such as parking facilities at employer premises and other places where people converge
during the day (sports facilities, recreational, shopping, train stations etc.). This will prevent grid congestion
or stress or avoid additional cost for installing new cables. In those cases, peak shaving (with a static
battery) could be cost-effective from day one.
The change in electricity pricing structure in Norway results in a higher share of the prices for end
consumers (which includes the service industries such as for EV charging) and is based on peak power
measurements and consumption. This means reducing peak power demand is making more sense to
lower electricity costs. Therefore the (economic) logic for peak shaving has increased. However, relative
low electricity prices (compared to income levels) and a relative uniform network tariff across the day and
year, means consumers do not receive any price signals about when to charge their EVs. This weakens the
incentive for smart charging. An additional barrier are the current costs for BESS (as used in this solution
to peak shave load demand) pose a significant barrier to the (financial) business case for this solution.
4.3.3 Transnational transfer potential
The Netherlands has the highest charging infrastructure market maturity and high EV penetration (but
lower market share than Norway). The relatively high share of (semi) public charge points in The
Netherlands indicate a very different approach to public charging than Norway. The United Kingdom sits
between these countries in terms of public charge points and, of all four NSR countries, the highest
(absolute) number of EVs. The uptake of EVs and charging infrastructure maturity in Belgium is lagging
but trends with similar growth curves can be expected in next 5 to 10 years. Although the ranking may
differ slightly per country, the popularity of various EV models in all three other NSR countries are quite
similar.
As in the Norway, current regulatory and market availability limitations (with a slight exception of the UK)
for real-time or otherwise dynamic pricing structures limit the potential and flexibility in cost, load and/or
environmental impact (the latter more relevant in other NSR countries than for Norway) optimisation.
With indications this may change over the space of 5 to 10 years across the board, which would diminish
such barriers, the potential for type of V4ES is likely to increase. The price structure in Belgium consists of
distribution costs, with peak & off-peak tariffs; fixed transmission costs; energy consumption tariffs (peak
and off-peak or via energy market tariffs) and some additional taxes and fees. For Belgium, the peak
demand charges are levied on both distribution and the transmission component of electricity. In The
Netherlands the tariff structure consists of a fixed transmission tariff, a fixed distribution capacity tariff
and a consumption tariff(s). Many suppliers offer a 'double-tariff' option, which means they apply different
rates for consumption in daytime hours versus night-time hours, but these timeslots may vary per region
or supplier. In some regions, consumers at household level (and small commercial) have the option to
choose for fixed rate per kWh (regardless of what the actual price on the energy market is) over a set
contract period or to opt for a variable tariff, where the costs per kWh can fluctuate and any difference
between actual costs and monthly contributions paid is settled on an annual basis.
National legislation derived from the European Union RED and EPBD (directives) are relevant to all (NSR)
countries. This includes the UK given its own ambitions for a low-carbon economy and decarbonisation
plan for transport [70] and a recent consultation launch on proposed legislation for electric vehicle (EV)
charging infrastructure in residential and commercial buildings in England, and aims to transpose the
requirements of the EU Energy Performance of Buildings Directive into UK legislation. These legislative
developments correlate with locations where EVs congregate such as street-parking and public/ private
parking facilities (at shopping malls, venues, workplaces or apartment complexes, for example) and will
therefore play a significant role in the height and times of consumption peaks.

SEEV4-City: Final Report V4ES Evaluation for Upscaling and Transnational potential
36
Similar to Norway, current costs for BESS (as used in this solution to peak shave load demand) pose a
significant barrier to the (financial) business case for this solution.
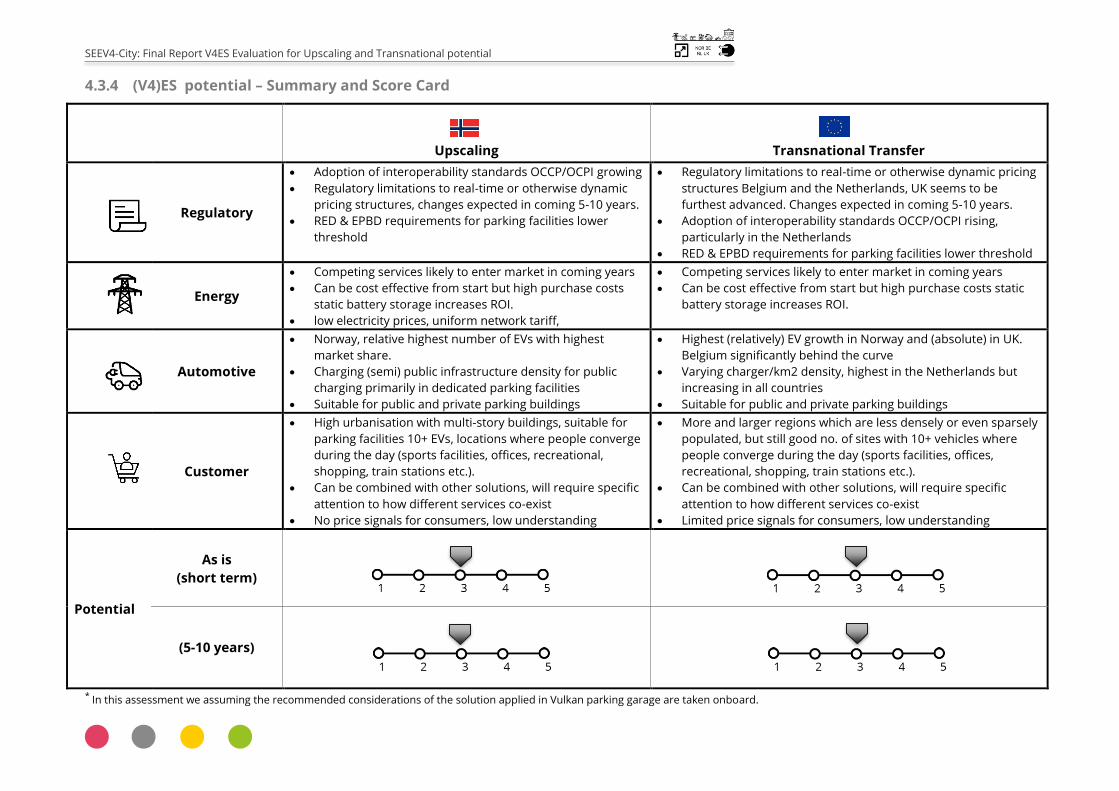
SEEV4-City: Final Report V4ES Evaluation for Upscaling and Transnational potential
4.3.4 (V4)ES potential – Summary and Score Card
Upscaling
Transnational Transfer
Regulatory
Adoption of interoperability standards OCCP/OCPI growing
Regulatory limitations to real-time or otherwise dynamic
pricing structures, changes expected in coming 5-10 years.
RED & EPBD requirements for parking facilities lower
threshold
Regulatory limitations to real-time or otherwise dynamic pricing
structures Belgium and the Netherlands, UK seems to be
furthest advanced. Changes expected in coming 5-10 years.
Adoption of interoperability standards OCCP/OCPI rising,
particularly in the Netherlands
RED & EPBD requirements for parking facilities lower threshold
Energy
Competing services likely to enter market in coming years
Can be cost effective from start but high purchase costs
static battery storage increases ROI.
low electricity prices, uniform network tariff,
Competing services likely to enter market in coming years
Can be cost effective from start but high purchase costs static
battery storage increases ROI.
Automotive
Norway, relative highest number of EVs with highest
market share.
Charging (semi) public infrastructure density for public
charging primarily in dedicated parking facilities
Suitable for public and private parking buildings
Highest (relatively) EV growth in Norway and (absolute) in UK.
Belgium significantly behind the curve
Varying charger/km2 density, highest in the Netherlands but
increasing in all countries
Suitable for public and private parking buildings
Customer
High urbanisation with multi-story buildings, suitable for
parking facilities 10+ EVs, locations where people converge
during the day (sports facilities, offices, recreational,
shopping, train stations etc.).
Can be combined with other solutions, will require specific
attention to how different services co-exist
No price signals for consumers, low understanding
More and larger regions which are less densely or even sparsely
populated, but still good no. of sites with 10+ vehicles where
people converge during the day (sports facilities, offices,
recreational, shopping, train stations etc.).
Can be combined with other solutions, will require specific
attention to how different services co-exist
Limited price signals for consumers, low understanding
Potential
As is
(short term)
(5-10 years)
* In this assessment we assuming the recommended considerations of the solution applied in Vulkan parking garage are taken onboard.
SEEV4-City: Final Report V4ES Evaluation for Upscaling and Transnational potential
4.4 Smart (solar) Charging of e-bikes as car replacement (Kortrijk sports centre)
4.4.1 Service description
Amongst all the services across the 6 SEEV4-City pilots dedicated to cars, one pilot also took a chance on
developing a service involving ebikes. As part of the Kortrijk OP, the existing flexible universal ebike
charging station (set up through the Ulive project, which ran from January 2018 – December 2019) was
upgraded with additional smart charging functionalities. The ebike charging station has two main
functions: docking (parking and theft prevention) and ebike battery charging.
The ebike charging station, able to service up to three ebikes, is capable of providing individual charging
set-points for each individual ebike. This is based on the ebike’s State of Charge (SOC), the remaining time
to charge and the indicated desired amount of range. Additional inputs used to schedule charging are
i. the EPEX Spot price (day-ahead hourly price data),
ii. the total load at the Kortrijk Depot and the PV generation, and
iii. the allowable maximum power draw, as determined by the Kortrijk OP Energy Management
System.
Of all variables used to smart charge the ebike, primary priority is given to ensuring that the ebike has the
desired amount of range at the scheduled departure time.
Upon arrival by an employee at the Kortrijk Depot (e.g. in the morning), s/he registers the ebike with the
charging station via an Android App. The ebike is registered in the App via a QR code scan, subsequently
the selected charger is registered in the App via a QR code scan, which pairs the ebike with the charger.
Based on this, the charging station can set the appropriate charging set-points. The user is asked via the
Android App how much cycling range is needed, the expected time of departure (which can be brought
forward ad hoc) and expected weather conditions, i.e. how windy it is (windier days result in higher SOC
requirements for charging to be complete). Depending on these inputs, an estimation of the degrees of
freedom for charging is made when to apply ‘dumb’ charging and when to apply smart charging. The
blended smart charging algorithm prioritises self-consumption charging (solar charging) during moments
of PV production. For days with low PV generation and thus limited or no PV export to the grid, the decision
to charge is based on selecting the cheapest hours within the known schedule of EPEX SPOT prices. Once
the ebike reaches 80% SOC, a push message appears in the App, notifying the user of the SOC state; the
ebike continues charging if this has been set. The user can disconnect the ebike from the charging station
at any time via the App, if required.
4.4.2 Upscaling potential in Belgium
The ebike market in Belgium is large, at approximately 50% of all bicycles sold (500,000 total per year).
Within Belgium, Flanders sees approximately 16% of all trips (leisure and work-related) done using a
bicycle, with high (e)bicycle ownership: there is approximately 1 bicycle per adult. Additionally, attention
to health impacts due to transport emissions is increasing, both on the end-user side and the authorities.
Many cities (medium to large) are considering or implementing policies with the aim of curbing the
emissions as well as stimulate other means of transport than the (ICE) vehicles. Currently, a single OEM
dominates the market for (solar-based) smart charging of ebikes.
The remainder of the ebike (charging) market is fragmented. Charging of ebikes is done using a separate
charger which charges from a standard wall plug, with a typical power draw <200 W. For smart charging,
this means that either the wall plugs need to be controlled, or the chargers. No common ebike charging
standard exists, with each ebike battery having its own proprietary charging protocol and charging
cables/pins. In a sense, the ebike and ebike charging market is similar to the smartphone market before
2009, when the European Commission pushed smartphone manufacturers to use a common external
power supply charging protocol.
SEEV4-City: Final Report V4ES Evaluation for Upscaling and Transnational potential
39
While ebikes are not cheap with prices in Belgium ranging between €1,000 and €4,000 (up to €9,000 for
speed pedelecs capable of reaching 45 km/h), there is the potential they could compete with cars for those
that are debating to opt for/keep a car but find the biking distance too far for a ‘normal’ bike. The
willingness to invest similar amounts to perform the necessary engineering, business development and
rollout for docking/charging stations is currently limited.
The potential for a culture and modal shift towards increased active transport (walking, cycling with bikes
or ebikes) is relatively high, due to the confluence of factors:
Increased awareness of health impacts of air pollution due to car traffic;
Increased awareness around the health impacts of active/inactive lifestyles;
Increased interest in active mobility as a hedge against traffic time losses;
Improvements in cycling infrastructure;
Financial support for cycling to work: employees can get a tax-free subsidy per km cycled between
home and the office, of up to €0.24/km.
With the covid-19 crisis and its impact on people’s willingness to use public transport, a further
increase in (personal) active transport is envisaged.
The market domination for ebike smart charging causes a technical-commercial limitation since it has no
incentive to open up the charging protocol and risk a lucrative market and presents a main issue for the
upscaling potential of (solar-based) smart charging of ebikes. The commercial factors around standardised
ebike charging and thus the potential for smart charging originate in the fragmented ebike market, and
their relative cost. Consequently, the upscaling potential as-is is likely to be limited to companies with
(large) fleets of ebikes using the same charging protocol and have (access to resources) that can perform
the required engineering to allow smart charging of ebikes.
In the longer term, there is a significant upscaling potential in Belgium, as cycling to work further takes off
for takes off for health and punctuality reasons, building from the high ownership and interest base.
Interest from companies will likely be focused on improving their energy autonomy first, with CO2 savings
from employee modal shift (from cars to ebikes) the next step. For example, at BASF in Antwerp, currently
600 of the 3000 employees cycle to work with a speed pedelec (a pedal-assisted ebike capable of reaching
45 km/h), whereas there are ebike sharing/rental initiatives such as Bluebike who offer rental ebikes at
most major train stations in Belgium.
While the potential for upscaling is large in Belgium, it will very likely be tempered or slowed down until
the technical charging protocols are homogenised, or significant investments are done by large companies
or ebike fleet owners.
4.4.3 Transnational transfer potential
The market conditions for the other three NSR countries are mostly similar, although there are some
differences per country regarding (e)bike use and ownership. For example, The Netherlands is known for
its bikes, where, on average, every Dutch person owns 1.3 bikes. The Dutch love to take their bike out for
leisure and recreational trips, but also approximately 25% up to 30%+ (the latter in and around main cities
such as Amsterdam, Utrecht) [46] of all commuting trips are by bike, where the average trip is around
10km. The characteristics of cyclists in Norway, although considered to be a country with a relative low
share of cyclists, seem to be similar to countries with a higher share of cyclists. 75 per cent of people have
bicycles (2017), but only 27 percent of the cyclists think that their employer does enough to facilitate
cycling to work. Those owning an ebike seem to be more likely to use their ebike and travel longer
distances compared to those with an ordinary bike [38]. Policies in Norway seem to be geared to
increasing the share of transport by bike with new and improved bike-lines with particularly Oslo aiming
for at least 16 percent of all trips by 2025 by bike. Ebikes are also surging in popularity in the UK, with
sales expected to top £16bn in revenue by 2023. A report from Deloitte found that ebike sales between

SEEV4-City: Final Report V4ES Evaluation for Upscaling and Transnational potential
40
2020 and 2023 would be six times that of electric cars sold over the next decade, even outstripping sales
of electric cars [66]. Again, the necessary infrastructure geared towards smart charging is still
underdeveloped or does not seem to be much on the radar for market providers nor policy makers or
employers.
Transnational potential is relatively high, with a significant growth for ebikes in recent years as well as
expected in upcoming years, creating potential for (partial) car replacement for commuting.
But there are also similar preconditions (or barriers) as for Belgium:
1. Universal charging protocol and charging cables/pins finalised.
2. High interest and/or pre-existing cycling user base.
Potential is thus at least equally high for The Netherlands, and somewhat lower for the United Kingdon
and Norway (the latter especially due to weather, although there are examples from Finland showing that
this can be addressed too.) Equal to the situation in Belgium, harvesting the potential for transnational
adoption of such a smart (solar) charging is likely tempered or slowed down until the technical charging
protocols are homogenised, or significant investments are done by large companies or ebike fleet owners.
Stimulating the smart charging of ebikes as (part of) the energy transition and transportation ecosystem
will also require more attention to charging locations, for example facilities at mobility-hubs such as at
train stations or at employer sites, both from the perspective of charging infrastructure as well as safety
(anti-theft) measures. Similar standardisation to, for example, the OCPI for (car) BEVs across a wider
(European) region will help remove technical-commercial barriers and help facilitate a more level playing
field for the ebike and smart charging market.
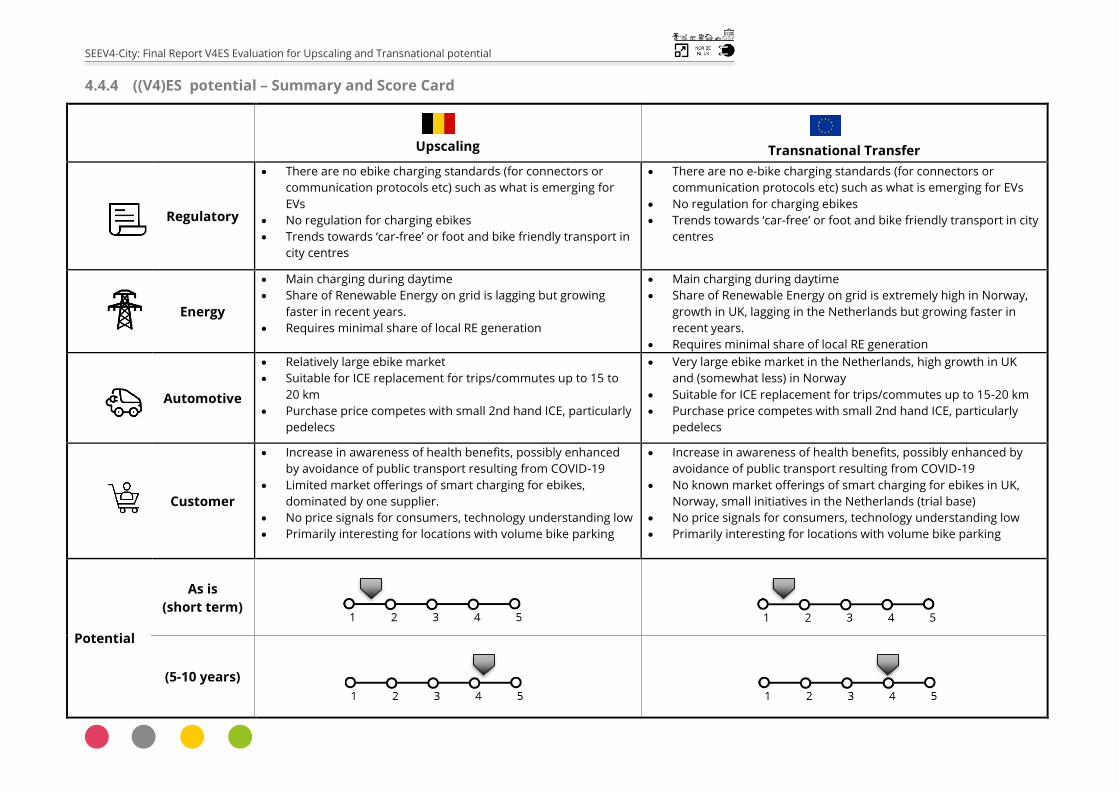
SEEV4-City: Final Report V4ES Evaluation for Upscaling and Transnational potential
4.4.4 ((V4)ES potential – Summary and Score Card
Upscaling
Transnational Transfer
Regulatory
There are no ebike charging standards (for connectors or
communication protocols etc) such as what is emerging for
EVs
No regulation for charging ebikes
Trends towards ‘car-free’ or foot and bike friendly transport in
city centres
There are no e-bike charging standards (for connectors or
communication protocols etc) such as what is emerging for EVs
No regulation for charging ebikes
Trends towards ‘car-free’ or foot and bike friendly transport in city
centres
Energy
Main charging during daytime
Share of Renewable Energy on grid is lagging but growing
faster in recent years.
Requires minimal share of local RE generation
Main charging during daytime
Share of Renewable Energy on grid is extremely high in Norway,
growth in UK, lagging in the Netherlands but growing faster in
recent years. Requires minimal share of local RE generation
Automotive
Relatively large ebike market
Suitable for ICE replacement for trips/commutes up to 15 to
20 km
Purchase price competes with small 2nd hand ICE, particularly
pedelecs
Very large ebike market in the Netherlands, high growth in UK
and (somewhat less) in Norway
Suitable for ICE replacement for trips/commutes up to 15-20 km
Purchase price competes with small 2nd hand ICE, particularly
pedelecs
Customer
Increase in awareness of health benefits, possibly enhanced
by avoidance of public transport resulting from COVID-19
Limited market offerings of smart charging for ebikes,
dominated by one supplier. No price signals for consumers, technology understanding low Primarily interesting for locations with volume bike parking
Increase in awareness of health benefits, possibly enhanced by
avoidance of public transport resulting from COVID-19
No known market offerings of smart charging for ebikes in UK,
Norway, small initiatives in the Netherlands (trial base)
No price signals for consumers, technology understanding low Primarily interesting for locations with volume bike parking
Potential
As is
(short term)
(5-10 years)
SEEV4-City: Final Report V4ES Evaluation for Upscaling and Transnational potential
5 Upscaling and transnational transfer: V2X
5.1 Vehicle2Home – EV energy to Home, single household (Loughborough)
5.1.1 Service description
In the Loughborough OP, a single household home was equipped with a smart energy system, combining
hardware and software from a number of suppliers. The 2 kWh battery (400 W fixed input/output) and
4 kWp solar panels were provided and operated by a technology company that bundles battery and solar
panel solutions to provide smart (renewable) energy management services to customers. The V2H
solution implemented at the Loughborough household aimed to demonstrate the benefit of better
integration of renewable energy generation and optimise the consumption of the locally generated
renewable energy in households. The system implemented at the Loughborough residence consisted of
the following characteristics:
Photovoltaic (PV) system (3.86 kWp);
Static battery for electric energy storage generated by the PV system (3 kWh);
Electric Vehicle which can discharge electric energy back to the house when plugged-in (4 kWh
Nissan Leaf);
Bi-directional charger (7.3 kW charge, discharge limited to 3.68 kW); and
Typical household electrical consumption (3-bedroom house)
This pilot took a first-of-its kind bi-directional charger demonstration and combined it into a sophisticated
home energy management system, delivering CO2 reductions, an increase in energy autonomy and
potential grid benefits, and contributing to the overall successful delivery of the SEEV4-city project KPIs.
5.1.2 Upscaling potential in the United Kingdom
Evaluations from the pilot confirm V2H is not just about achieving financial benefits. The pilot also clearly
indicated that households can also benefit in non-financial aspects, indicating a clear increase in energy
autonomy (being less grid-dependent) and reducing the overall carbon intensity of the household.
Additionally, grid investments can potentially be avoided through more comprehensive scale
implementation within the local grid area. A business model for a V4ES around V2H should include the
use of time of (grid) use tariff schemes with Feed-in-Tariff rates. The non-financial observations from this
project have been fed into a recent report by Cenex entitled ‘V2G: a fresh perspective’. [50]
The housing stock in the UK lends itself relatively well for Vehicle2Home services. Although no exact data
is available of the combination of terrace houses, semi- and detached houses that also feature private off-
street parking and space for PV, there is reason to believe UK holds an attractive share of the housing
stock that carry the characteristics most beneficial for V2H implementation.
There are however several barriers that prevent or limit the wide scale roll out of V2H across the UK. Due
to the current high purchase costs of bi-directional chargers (which also applies to static batteries) the
financial ROI is not attractive in the short term. There are also several other (some regulatory) factors
related to vehicle-discharging technologies that may restrict the technology choice for the customer: a
small and immature market (both vehicles and chargers), battery warranties, G-99 type-testing, suitability
to use in a domestic environment (likely single-phase 7 kW charger) and possible power rating restrictions
or required upgrade costs for a charger by the DNO.
In short, the limited market-choice availability with high purchase prices for bi-directional chargers as well
as static energy storage and grid tariff-related policies and structures currently result in an unattractive
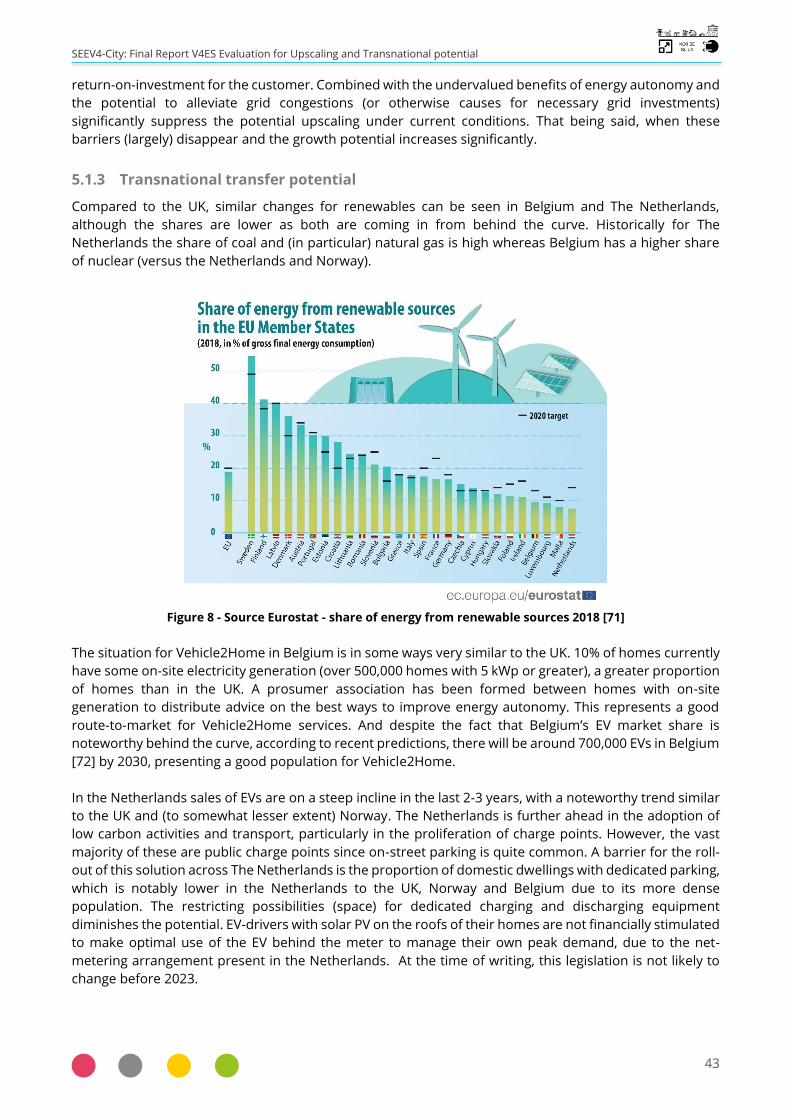
SEEV4-City: Final Report V4ES Evaluation for Upscaling and Transnational potential
43
return-on-investment for the customer. Combined with the undervalued benefits of energy autonomy and
the potential to alleviate grid congestions (or otherwise causes for necessary grid investments)
significantly suppress the potential upscaling under current conditions. That being said, when these
barriers (largely) disappear and the growth potential increases significantly.
5.1.3 Transnational transfer potential
Compared to the UK, similar changes for renewables can be seen in Belgium and The Netherlands,
although the shares are lower as both are coming in from behind the curve. Historically for The
Netherlands the share of coal and (in particular) natural gas is high whereas Belgium has a higher share
of nuclear (versus the Netherlands and Norway).
Figure 8 - Source Eurostat - share of energy from renewable sources 2018 [71]
The situation for Vehicle2Home in Belgium is in some ways very similar to the UK. 10% of homes currently
have some on-site electricity generation (over 500,000 homes with 5 kWp or greater), a greater proportion
of homes than in the UK. A prosumer association has been formed between homes with on-site
generation to distribute advice on the best ways to improve energy autonomy. This represents a good
route-to-market for Vehicle2Home services. And despite the fact that Belgium’s EV market share is
noteworthy behind the curve, according to recent predictions, there will be around 700,000 EVs in Belgium
[72] by 2030, presenting a good population for Vehicle2Home.
In the Netherlands sales of EVs are on a steep incline in the last 2-3 years, with a noteworthy trend similar
to the UK and (to somewhat lesser extent) Norway. The Netherlands is further ahead in the adoption of
low carbon activities and transport, particularly in the proliferation of charge points. However, the vast
majority of these are public charge points since on-street parking is quite common. A barrier for the roll-
out of this solution across The Netherlands is the proportion of domestic dwellings with dedicated parking,
which is notably lower in the Netherlands to the UK, Norway and Belgium due to its more dense
population. The restricting possibilities (space) for dedicated charging and discharging equipment
diminishes the potential. EV-drivers with solar PV on the roofs of their homes are not financially stimulated
to make optimal use of the EV behind the meter to manage their own peak demand, due to the net-
metering arrangement present in the Netherlands. At the time of writing, this legislation is not likely to
change before 2023.

SEEV4-City: Final Report V4ES Evaluation for Upscaling and Transnational potential
44
The situation for Vehicle2Home in Norway is more positive than for the UK, Belgium, and the Netherlands
in the short term. Norway has the world’s largest fleet of EVs per capita. Additionally, the Nissan Leaf is
Norway’s bestselling passenger car which increases the as-is potential for Vehicle2Home as this follows
the CHAdeMo standard. Some households take the Nordpol price directly, which gives them a variable
hour-by-hour tariff (albeit depressed somewhat by a high proportion of taxation), and an incentive for
Vehicle2Home services to manage their bills. On the other hand, the reduction of carbon intensity of
household consumption is not a strong driver for adoption of Vehicle2Home due to the already very low
carbon intensity of Norwegian electricity. There is not a very large deployment of solar PV panels with
historically limited policy stimulation from Norwegian Authorities, but this is changing. In Norway
customers face the same challenge as in other countries to find a commercial offering for V2H
Overall, it is judged that technically, the Vehicle2Home system can be easily transferred internationally but
it should be underlined that, as with the UK, the customers in all three countries will still need to find a
commercial offering which will allow Vehicle2Home.
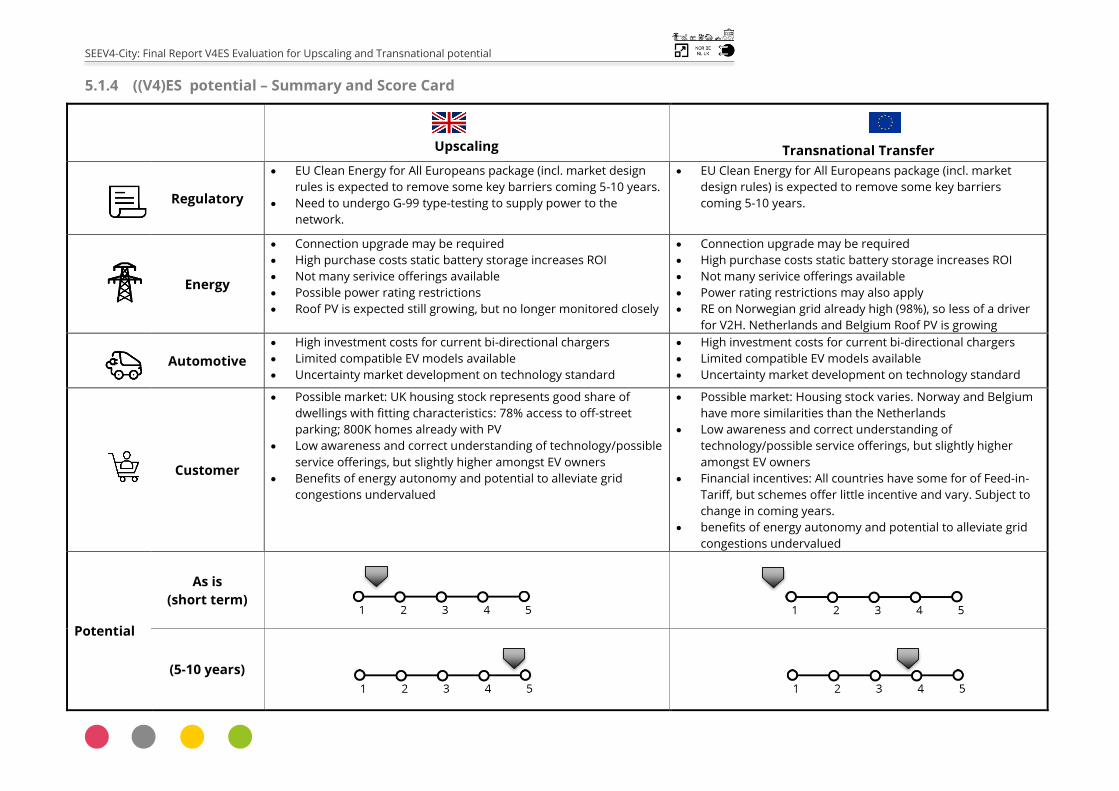
SEEV4-City: Final Report V4ES Evaluation for Upscaling and Transnational potential
5.1.4 ((V4)ES potential – Summary and Score Card
Upscaling
Transnational Transfer
Regulatory
EU Clean Energy for All Europeans package (incl. market design
rules is expected to remove some key barriers coming 5-10 years.
Need to undergo G-99 type-testing to supply power to the
network.
EU Clean Energy for All Europeans package (incl. market
design rules) is expected to remove some key barriers
coming 5-10 years.
Energy
Connection upgrade may be required
High purchase costs static battery storage increases ROI
Not many serivice offerings available
Possible power rating restrictions
Roof PV is expected still growing, but no longer monitored closely
Connection upgrade may be required
High purchase costs static battery storage increases ROI
Not many serivice offerings available
Power rating restrictions may also apply
RE on Norwegian grid already high (98%), so less of a driver
for V2H. Netherlands and Belgium Roof PV is growing
Automotive
High investment costs for current bi-directional chargers
Limited compatible EV models available
Uncertainty market development on technology standard
High investment costs for current bi-directional chargers
Limited compatible EV models available
Uncertainty market development on technology standard
Customer
Possible market: UK housing stock represents good share of
dwellings with fitting characteristics: 78% access to off-street
parking; 800K homes already with PV
Low awareness and correct understanding of technology/possible
service offerings, but slightly higher amongst EV owners
Benefits of energy autonomy and potential to alleviate grid
congestions undervalued
Possible market: Housing stock varies. Norway and Belgium
have more similarities than the Netherlands
Low awareness and correct understanding of
technology/possible service offerings, but slightly higher
amongst EV owners
Financial incentives: All countries have some for of Feed-in-
Tariff, but schemes offer little incentive and vary. Subject to
change in coming years.
benefits of energy autonomy and potential to alleviate grid
congestions undervalued
Potential
As is
(short term)
(5-10 years)
SEEV4-City: Final Report V4ES Evaluation for Upscaling and Transnational potential
5.2 Vehicle2Building – EV energy to building (Leicester City Hall)
5.2.1 Service description
A large council building in Leicester, its central HQ called City Hall, aims to link on site renewable energy
(PV) generation to electric vehicles (EVs) used by the Council staff. Leicester City Hall based staff are
utilising four EVs for their work and charging these, when possible, from local renewable energy (PV)
generation. The set-up for the Leicester City Hall OP, at the municipal office block in Leicester’s city centre
consists of a smart charging energy system with the following major properties:
23kWp rooftop Photovoltaic (PV) system;
4 x Nissan Leaf Electric Vehicles (EVs) which can be charged using electric energy partly provided
by the PV system;
4 x 7kW unidirectional Smart chargers with 5 x charging outlets; and
Baseline electrical consumption which always exceeded the maximum output of the PV system.
Due to circumstances the procurement process was delayed and halted for some time, but the tender
was published in the final stage of the project ensuring the solution will be implemented. Using the tender
criteria and having access to existing site data, the project was able to simulate and analyse the solution’s
performance at this location. The Vehicle2Building solution showed it exceeds its target for CO2, mostly as
result of ICE vehicle replacement. Because most of the PV generation is expected to be absorbed by the
energy use of the building, the ZE km increase did not meet its full target during the pilot run. However,
the connection capacity indicates there is room to increase the amount of PV which could be dedicated to
EV charging. Using existing data to assess the V2B in the model shows an achievable result of Energy
Autonomy for the site increases to 41%.
5.2.2 Upscaling potential in the United Kingdom
The most common purpose of Vehicle2Building is to reduce electricity bills by balancing differential tariffs
or costs within the building. Leicester City Hall daytime and night-time electricity costs are 14.5042 p/kWh
and 12.0202 p/kWh respectively. These are also the energy costs of charging the EVs from the Grid. There
is a capacity charge of 1.05 £/kVA. Accordingly, if PV or Grid energy were stored in the EVs the overall
electricity bill could be reduce, both directly and by reducing the measured peak consumption level. In
terms of the market size, there are some 1.8 million office/commercial/industrial buildings in the UK, many
of which have car parking spaces and can accommodate rooftop PV. Further possibilities are to utilise the
energy stored in the EV batteries (and possible add static energy storage) to increase Energy Autonomy,
reduce CO2 emissions and reduce the need for grid reinforcement particularly as the number of EVs to be
charged rises over time.
To conduct Vehicle2Building services, currently a CHAdeMO-compliant vehicle is needed, Leicester City
Hall utilises four Nissan Leaf EVs. Around 27,000 Leafs have been sold in the UK, meaning that with the
right charging equipment, many of these cars could participate in Vehicle2Building services, which in the
case of the recent types of Leaf does not invalidate the EV battery warranty.
Vehicle2Building services are governed under the UK’s Distribution Network Code, part G99, which
requires a pre-installation application and potential post-installation checks. As a minimum, the requisite
bi-directional charger must be G-99 type-tested, which restricts the range from which a customer may
choose. As examples, Nuvve offer the Nuvve PowerPortHigh-Power single phase AC Charging Station
EVSE-B-P1-H1 which operates 120-240 Vac at a maximum power of 19.2 kW; OVO offer model 170911A101
V2G which is a bi-directional 230 V single phase charger capable of 6 kW in each direction; Nichicon offer
the VCG-663CN3, a single phase 220/230 V 6 kW grid-connected V2H charger.

SEEV4-City: Final Report V4ES Evaluation for Upscaling and Transnational potential
47
The Vehicle2Building technology will need to be suited to use in an office building environment. This
means that it is likely to be a single-phase 7 kW charger. The local distribution network may place
restrictions on the power rating of the charger(s) to ensure stability of the local grid. If the grid is
constrained, the customer may be requested to pay for a connection upgrade to support the expected
increase in incoming supply. For V2B, there is no expectation of export, although the exporting power will
be evaluated in case some aspects of V2G such as FCR may be economic.
A V2B service for a site that is also open for public will need to consider developing a value proposition for
the EV-driver to entice their participation. This means the proposition should touch on themes that are of
most importance to them and embraces transparent communication etc. For V2B there is no expectation
of export, but in case V2G (for example as FCR or FFR (Firm Frequency Response)) is also being considered,
exporting power will need to be evaluated for any site.
As for Vehicle2Home, the main bottlenecks for V2B services relate to the current substantial capital cost
(and consequently the ROI) of the hardware, limited choice in the market and some debate as to which
direction technological developments are going. This will strongly hamper the short-term wider adoption
(and thus upscaling) of this type of solution. In the span of 5-10 years, the technology development
direction for bi-directional charging hardware will result in maturing of the market and is likely to reduce
the investment costs significantly (and possibly for energy storage as well). This would render the
proposition much more economically attractive.
5.2.3 Transnational transfer potential
In parallel to the upscaling potential for the UK, the transfer potential for Vehicle2Building is fairly similar
to Vehicle2Home in terms of market availability and maturity.
Although the Netherlands was ranked the country with the highest density of charge points globally and
is enjoying a high growth rate in EV sales, by far most of the charging infrastructure consists of
unidirectional chargers in the public domain. Similarly, bi-directional charging at private locations,
although no clear data exists, is expected to be low to (almost) nil. There are quite a number of trials and
pilots with bi-directional chargers, but most of these initiatives are geared towards V2G. Rooftop PV has
been significantly growing in recent years as well, for both residential and business locations. However,
proximity within the built environment due to its dense population may pose restrictions on available
space for dedicated charging and discharging equipment (at least considering the current average size of
charging hardware). Although there are certainly possible exceptions here, such as large business parks
with sizeable parking facilities (dedicated or shared amongst businesses) for employees and visitors, often
at the outskirts of or near motorways in and out of the larger cities and towns. Also, collaboration with
nearby commercial parking garages could provide opportunities for Vehicle2Building services. This, of
course, also applies to Belgium, and Norway, although there are more and larger parts of the country
(particularly in Norway) with significantly less populated areas. There may lie potential here for buildings
at train stations with parking facilities, for example. Also noteworthy is the limited share of roof PV (or
other onsite RE generation) in Norway, due to the 98% hydropower share of the grid, but recent growth
numbers indicate this will increase further in coming years.
Equal to the situation in the UK, some restrictions or required grid upgrades may apply, even if there is no
export to the grid. The local distribution network may place restrictions on the power rating of the
charger(s) to ensure stability of the local grid. If the grid is constrained, the customer may be requested to
pay for a local connection upgrade to support the expected increase in incoming supply. For V2B, there is
no expectation of export, although the exporting power will be evaluated in case some aspects of V2G
such as FCR may be economic.

SEEV4-City: Final Report V4ES Evaluation for Upscaling and Transnational potential
48
The level of awareness and correct understanding of the technology related to Vehicle2Building is still
relatively low amongst the general public in all countries. Although amongst EV-drivers this is notably
higher. If V2B adoption is to increase and also made available at sites where parking is open to the public,
raising this awareness will be necessary. As will be the development of any value proposition targeting
their participation, either through campaigns for the masses, or campaigns targeting known site-users.
Several polls, interviews, and surveys (such as in the UK, Belgium and NL) have indicated that simple and
transparent communication of the service (value proposition) is key as well. Though financial
compensation to participate is often mentioned, it is not necessarily the only reason for people to
participate, environmental reasons and contributing to grid support have been indicated as
considerations.
In the span of 5-10 years, the costs of the necessary hardware for bi-directional charging may well fall to
such a degree as to render the proposition much more economically attractive across all three countries.
Coupled with an increase of localised PV renewable energy generation, this would result in further
reduction of electricity costs as well as having the benefit of an increased level self-sufficiency and
increasing energy autonomy by reducing the dependence on external energy supply.

SEEV4-City: Final Report V4ES Evaluation for Upscaling and Transnational potential
5.2.4 ((V4)ES potential – Summary and Score Card
Upscaling
Transnational Transfer
Regulatory
EU Clean Energy for All Europeans package (incl. market
design rules is expected to remove some key barriers
coming 5-10 years.
Need to undergo G-99 type-testing to supply power to the
network.
Currently high chance of double taxation for electricity
exchange, particularly in the Netherlands.
EU Clean Energy for All Europeans package (incl. market
design rules) is expected to remove some key barriers in the
coming 5-10 years.
Energy
Connection upgrade may be required
High purchase costs static battery storage increases ROI
Not many service offerings available
Possible power rating restrictions
Roof PV is expected still growing, but no longer monitored
closely
Connection upgrade may be required
High purchase costs static battery storage increases ROI
Not many service offerings available
Power rating restrictions may also apply
RE on Norwegian grid already high (98%), so less of a driver
for V2H. Netherlands and Belgium Roof PV is growing
Automotive
High investment costs for current bi-directional chargers
Limited compatible EV models available
Uncertainty market development on technology standard
High investment costs for current bi-directional chargers
Limited compatible EV models available
Uncertainty market development on technology standard
Customer
Possible market: UK housing stock represents good share
of dwellings with fitting characteristics: 78% access to off-
street parking; 800K homes already with PV
Low awareness and correct understanding of
technology/possible service offerings, but slightly higher
amongst EV owners
Benefits of energy autonomy and potential to alleviate grid
congestions undervalued
Possible market: Housing stock varies. Norway and Belgium
have more similarities than the Netherlands
Low awareness and correct understanding of
technology/possible service offerings, but slightly higher
amongst EV owners
Benefits of energy autonomy and potential to alleviate grid
congestions undervalued
Potential
As is
(short term)
(5-10 years)

SEEV4-City: Final Report V4ES Evaluation for Upscaling and Transnational potential
5.3 Vehicle2Grid – EV energy to Grid, single household (Burton-upon-Trent)
5.3.1 Service description
The site for Burton-upon-Trent is quite similar to the location in Loughborough. The main difference is
that in Loughborough the service was dedicated to Vehicle2Home, whereas in Burton-upon-Trent the
solution focuses on Vehicle2Grid. This was the result of an initial Loughborough analysis recommendation
to consider Vehicle2Grid for additional value. Once it became clear the pilot was unable to continue at its
initial location, the project partners searched for a new site with relatively comparable characteristics.
Therefore, the solution applied in Burton-upon-Trent is considered as a follow-up of the Loughborough
pilot and has the following characteristics:
Photovoltaic (PV) system (3.86 kWp PV);
3 kWh stationary battery capable of 760 W variable input / output power;
Bi-directional charger (7.3 kW charge, DNO (Western Power Distribution) G99 Agreement limited
export power to 3.68 kW);
2018 40 kWh Nissan LEAF;
Commercial control system by Moixa;
A commercial V2G unit from energy supplier Ovo Energy as part of Sciurus project; and
A typical household electrical consumption (3-bedroom house)
This second stage of the pilot is also used for input to the Sciurus project which aims to deploy 1000 V2G
chargers with participants who own/lease a Nissan Leaf EV and includes the development of a grid
balancing platform to provide electrical support to grid operators during peak energy demand times.
Furthermore, it will explore and test commercial propositions to identify a viable long-term business
model. Finally, consumer behaviour and receptiveness will be measured to provide insights into EV
owners' attitudes and their response to V2G products and services. These explorations and tests will
exceed the timeframe of SEEV4-City and as such could not be included as part of SEEV4-City’s analysis
reports.
5.3.2 Upscaling potential in the United-Kingdom
Vehicle2Grid solutions often include a focus on opportunities to save money on electricity costs and
potentially earn revenue from exporting or providing grid services. The market conditions are similar to
what was reflected and highlighted for Vehicle2Home (5.1) and Vehicle2Building (5.2), requiring the same
vehicle types and suitability. In terms of possible market size similar dwellings and buildings would apply.
Vehicle2Grid services are governed under the UK’s Distribution Network Code, part G99, which requires a
pre-installation application and potential post-installation checks. As a minimum, the bi-directional
charger must be G-99 type-tested, which restricts the range from which a customer may choose. The
Vehicle2Grid technology will need to be suited to use in a domestic environment. This means that it very
likely to be a single-phase 7 kW charger, which will be restricting the technology choice for the customer.
The local distribution network may place restrictions on the power rating of the charger to ensure stability
of the local grid. If the grid is constrained, the customer may be requested to pay for a connection upgrade
to support the expected increase in incoming supply.
Main difference with V2H and V2B is of course the conditions that apply in the energy market as these will
have significant impact. Where the property has on-site generation, a restriction may be placed on the
export power, as was the case in the Loughborough phase 2 operational pilot. This will restrict the export
benefits from the system. In 2015, government announced its intention to end Feed in Tariffs (FIT) scheme,
often used for PV export to the grid, for new entrants in March 2019. As of January 2020, the Smart Export
Guarantee (SEG Scheme) took its place. Under the SEG Scheme the energy suppliers are, on average,
offering 4.5 and 5p/kWh. The SEG Scheme is not just restricted to PV export to grid, the combination with

SEEV4-City: Final Report V4ES Evaluation for Upscaling and Transnational potential
51
home or vehicle batteries (as energy storage) is also allowed, but it is up to the energy supplier if they are
offering any services that include these.
A number of commercial offerings are available for Vehicle2Grid in the UK, although the customer will still
need to find one which offers good value for money. Cenex estimates that the Vehicle2Grid value to a
house is around £300-400 per EV per year. Around 80% of this comes from altering the timing of the
vehicle charging (see Vehicle2Home), which is a much simpler and cheaper service. Customers may feel
that the additional 20% value from bi-directional charging may not be worth the additional complexity vs
costs and benefits for home-scale situations but would start to add up and provide more considerable
value for larger scale applications.
5.3.3 Transnational transfer potential
Although with some nuanced differences, such as the (currently) limited number of BEVs, the context for
Vehicle2Grid in Belgium is in many ways very similar to the UK and, again, also with similarities to what is
identified for Vehicle2Home. Belgian residential homes use a net-metering scheme which offsets
consumption with self-generation. This slightly increases the potential for Vehicle2Grid over the UK by
increasing the financial benefits for self-consumption. Belgium is also home to a prosumer association to
distribute advice on the best ways to improve energy autonomy. This represents a good route-to-market
for Vehicle2Grid services. There are also barriers to note, however. In Brussels, it is necessary to change
the meter to an A+/A- digital meter. In Flanders and Wallonia, there is no need to change the meter,
although it is possible in Flanders. Financial incentives for net-metering or self-consumption are only up
to 5 kW in Brussels, whereas most Vehicle2Home systems are rated at 7.3 or 10 kW. Legislative changes
are being considered to move all exporting homes onto a prosumer-tariff, rather than net-metering, which
would reduce the financial incentives for Vehicle2Grid. Finally, the minimum bid size for Frequency
Containment Reserve (FCR) is 1 MW, presenting a barrier to entry for small providers.
As can be expected, a same level of similarities applies for the Netherland, including what has been
mentioned under V2H/V2B in sections 5.1 and 5.2). Even though the majority of the relatively high number
of charge points are on-street, public chargers, there are a number of Grid services products active and
available in the Dutch market with greater clarity than those available in the UK market (i.e. FCR). Renault
has already started Vehicle2Grid trials, using its Zoe EV, which broadens the possibilities beyond simply
vehicles with CHAdeMo (i.e. Nissan Leafs).
Extra bottlenecks can also be seen. It is likely that energy moved through the EV battery is liable for
taxation, leading to a situation where a Vehicle2Grid solution suffers from double taxation. Here too, as is
the case in Belgium, the minimum bid size for Frequency Containment Reserve (FCR) is 1MW, presenting
a barrier for entry for smaller providers. Higher capacity connections which are better for Vehicle2Grid
are notably more expensive than lower capacity connections and often required.
In Norway the market for capacity-services is relatively small due to the high level of hydropower
generation (although for the drier winter periods can still provide value), reducing the transnational
transfer potential somewhat, despite high penetration of Vehicle2Grid-compatible vehicles. There is a risk
of double-taxation as the energy is consumed and released, but this is likely to be addressed soon in
upcoming legislative changes. There is currently no specific V2G policy-enabling framework in place in
Norway, which means exporting to the grid from the vehicle would currently be treated exactly like solar
being fed to the grid. Norway has a market-based system, which is very likely to continue. Short term
aggregated storage markets could be developed within that, with new regulation that also addresses the
issue of double prosumer taxation. Norway overall may not have a need (yet) for RES stored energy in
front of the meter (due to hydropower, some of which can be stored) but it does need a strong flexible
grid for international and national capacity to balance out grid stress. The Norwegian distribution network
is made of many small operators, making the value of Vehicle2Grid vary significantly according to place
and operator, and not all seem sufficiently prepared for this technology. The Nordic region seems less

SEEV4-City: Final Report V4ES Evaluation for Upscaling and Transnational potential
52
likely to see the same solar PV boom other countries are experiencing. However, as with V2H, its share of
single-family homes with good dedicated (off-street) parking (on the outskirts or outside the city centres
like Oslo) is much higher than say in The Netherlands. Considering the high share of renewables on the
Norwegian grid the key drivers for V2G is likely to be as a means to alleviate any grid stress or, for the
individual homeowner, to save/earn money by selling excess electricity. Electricity prices in Norway are
relatively low but prosumers can still reduce their own total grid bill significantly. Savings vary depending
on the tariff structure and level of the local DSO.

SEEV4-City: Final Report V4ES Evaluation for Upscaling and Transnational potential
5.3.4 ((V4)ES potential – Summary and Score Card
Upscaling
Transnational Transfer
Regulatory
EU Clean Energy for All Europeans package (incl. market design
rules is expected to remove some key barriers coming 5-10 years.
Need to undergo G-99 type-testing to supply power to the
network.
Currently high chance of double taxation for electricity exchange,
particularly in the Netherlands.
EU Clean Energy for All Europeans package (incl. market design
rules) is expected to remove some key barriers coming 5-10
years.
Energy
Connection upgrade may be required
High purchase costs static battery storage increases ROI
Not many service offerings available
Possible power rating restrictions
Roof PV growth assumed, but no longer closely monitored
Connection upgrade may be required
High purchase costs static battery storage increases ROI
Not many service offerings available, some in NL
Power rating restrictions may also apply
RE on Norwegian grid already high (98%), so less of a driver for
V2H. Netherlands and Belgium Roof PV is growing
Automotive
High investment costs for current bi-directional chargers
Limited compatible EV models available
Uncertainty market development on technology standard
High investment costs for current bi-directional chargers
Limited compatible EV models available
Uncertainty market development on technology standard
Customer
Possible market: UK housing stock represents good share of
dwellings with fitting characteristics: 78% access to off-street
parking; 800k homes already with PV
Low awareness and correct understanding of technology/possible
service offerings, but slightly higher amongst EV owners
Financial incentive only comes from Feed-in-Tariff or Smart
Export Guarantee (SEG) applies
Benefits of energy autonomy and potential to alleviate grid
congestions undervalued
Possible market: Housing stock varies. Norway and Belgium have
more similarities than the Netherlands
Low awareness and correct understanding of technology/possible
service offerings, but slightly higher amongst EV owners
Financial incentives: All countries have some form of Feed-in-
Tariff, but schemes offer little incentive and vary. Subject to
change in coming years.
Benefits of energy autonomy and potential to alleviate grid
congestions undervalued
Potential
As is
(short
term)
(5-10 years)
SEEV4-City: Final Report V4ES Evaluation for Upscaling and Transnational potential
6 Upscaling and transnational transfer: Energy Trading
6.1 Energy Trading – FCR with Battery Storage (Amsterdam – JC ArenA)
6.1.1 Service description
The Johan Cruijff ArenA is located in the southern part of Amsterdam and is the home base of football
club Ajax. The Dutch national team also plays international matches in the stadium. Concerts and dance
parties regularly supplement the calendar of events. The seat capacity is 55,000 and during concerts up
to 68,000 visitors are possible. The total building size is approximately 60,000 m2. The 1 MWp PV system
provides about 8% of the yearly electric energy demand (857 MWh PV production, and total electricity
demand was 8610 MWh in 2017), and the rest of the electricity demand is made green by buying wind
energy from a wind park in the north of the province. For the heat demand the JC ArenA is connected to
the district heating system of the Diemen power plant, and cold is coming from a nearby lake. During
events, the total electric power demand peaks at 3 MW. Diesel generators of 0.7 MW total are on site for
back-up power of the most essential functions during power outages. With the new 3 MW/2.8 MWh battery
energy storage system more back-up power is available.
The 2.8 MWh static battery of the JC Arena is mainly used for FCR services to stabilise the frequency in the
electricity grid. For this, they have a contract with the Dutch TSO Tennet. With the battery they can deliver
3 MW of power, and this power has to be available for the full 24 hours in a day. During these days the
battery cannot be used for other purposes. As a result, on days with big events, the battery is used as
back-up power and cannot be used for FCR. This means JC ArenA uses the battery for about 330 days per
year for FCR availability. Tennet is paying for this service, and as the prices are set on a daily auction, they
vary per day.
6.1.2 Upscaling potential in the Netherlands
As the share of renewable power systems increases, with their weather dependent profiles, more systems
are needed to stabilize the frequency of the grid. However, there is limit in the amount of power that is
needed for FCR. This varies per year but is about 100 - 115 MW for the Netherlands [73]. As FCR prices are
set on an auction (through a European procurement initiative, see Conclusions Energy Trading paragraph)
and there are more parties offering their services, market prices are now decreasing compared to the
earlier steep rise. This impacts the business case for parties offering this service. Additionally, minimum
bid size for Frequency Containment Reserve (FCR) is 1MW, targeting mostly medium to large actors.
The need for these kinds of balancing services will remain. For example, costs for congestion management
in the Netherlands increased to €61 million in 2019 (+12%). January 2019 saw the launch of a new Dutch
market platform called GOPACS, a joint initiative between several Dutch TSOs and DSOs to address
capacity shortages and grid congestion with the aim to increase reliability and affordability of the Dutch
electricity grid [74].
FCR services are expected to reach a ceiling platform in the Netherlands at some point. When this occurs
will depend largely on the level of congestion and growth in the FCR market, and to a certain extend the
(EV) battery markets. If the situation arises where supply of FCR services (consistently) exceeds demand,
this will have a significant impact on any prices and will consequently impact the return on investment
time, meaning supplying parties may be selected to provide the service at limited occasions, and the
chosen business model. But currently there is still room for growth. In the Netherlands there are sufficient
locations (spread geographically) with similar or comparable characteristics to JC Arena where a collection
of site-related (local) partners can embark on a similar initiative. Bearing in mind that the minimum bid
size for Frequency Containment Reserve (FCR) is 1MW, this does present a barrier for entry by smaller

SEEV4-City: Final Report V4ES Evaluation for Upscaling and Transnational potential
55
providers, for example from residential V2G. It would likely require creating and/or partnering with
(energy) cooperatives to act as an intermediary. An additional barrier for both residential and non-
residential in V2G involvement for FCR (as JC Arena is targeting in future) is the currently limited market
availability of V2G compatible EV models as well as limited choice in bi-directional charger suppliers (and
their high purchase costs).
Those considering developing and adopting this service may find this acceptable, particularly when it is
being considered as one part of a portfolio of services using the system’s hardware. In other words, if it is
adopted in combination with other uses. In effect taking the approach of ‘value stacking’, which is what is
being done at JC ArenA, for example by combining it with the use as back-up power function during
football matches or concerts. But of course, you cannot offer the battery for FCR while simultaneously
having it standby as back-up energy service. Although dedicating battery to FCR may appear to make sense
to maximise its revenue on the market, long term potential is likely through value stacking, i.e. as part of
a portfolio of solutions. That being said, the increased complexity of combining such services and multiple
business models using the same system hardware, will require serious time and effort to find the right
mix and balance, quite possibly forming a barrier for some. Then again, herein lies the true nature of
innovation.
6.1.3 Transnational transfer potential
Despite some differences in share of renewable energy on the grid and the rate of growth for EVs, the
context for FCR for the other NSR countries is quite similar to the Netherlands. As of December 2019,
Belgium is also participating in the European FCR procurement initiative, but Norway and UK have not.
However, both countries acknowledge and aim at increasing cooperation to enhance the European-wide
grid balancing efforts.
Due to the large similarities to the context of The Netherlands the potential for growth is therefore
estimated with similar grades for the NSR countries. These countries (including France and Germany) may
be in an excellent position to export knowledge and services to countries outside the NSR.
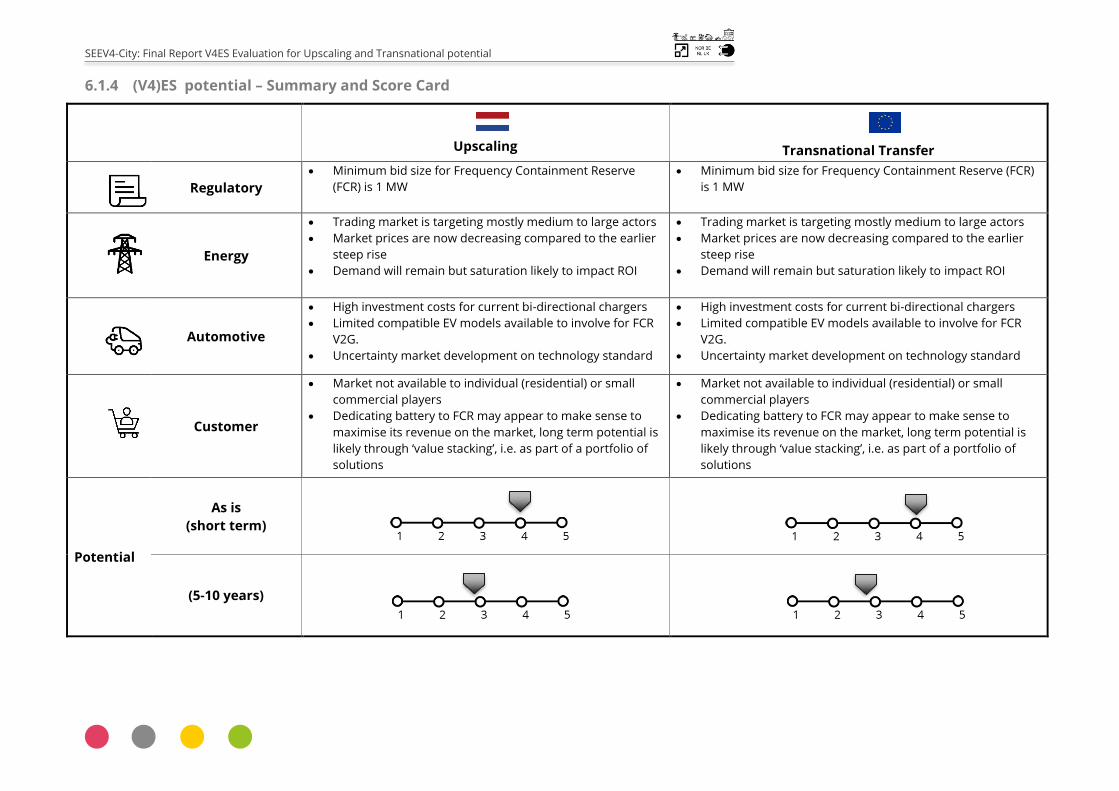
SEEV4-City: Final Report V4ES Evaluation for Upscaling and Transnational potential
6.1.4 (V4)ES potential – Summary and Score Card
Upscaling
Transnational Transfer
Regulatory
Minimum bid size for Frequency Containment Reserve
(FCR) is 1 MW
Minimum bid size for Frequency Containment Reserve (FCR)
is 1 MW
Energy
Trading market is targeting mostly medium to large actors
Market prices are now decreasing compared to the earlier
steep rise
Demand will remain but saturation likely to impact ROI
Trading market is targeting mostly medium to large actors
Market prices are now decreasing compared to the earlier
steep rise
Demand will remain but saturation likely to impact ROI
Automotive
High investment costs for current bi-directional chargers
Limited compatible EV models available to involve for FCR
V2G.
Uncertainty market development on technology standard
High investment costs for current bi-directional chargers
Limited compatible EV models available to involve for FCR
V2G.
Uncertainty market development on technology standard
Customer
Market not available to individual (residential) or small
commercial players
Dedicating battery to FCR may appear to make sense to
maximise its revenue on the market, long term potential is
likely through ‘value stacking’, i.e. as part of a portfolio of
solutions
Market not available to individual (residential) or small
commercial players
Dedicating battery to FCR may appear to make sense to
maximise its revenue on the market, long term potential is
likely through ‘value stacking’, i.e. as part of a portfolio of
solutions
Potential
As is
(short term)
(5-10 years)
SEEV4-City: Final Report V4ES Evaluation for Upscaling and Transnational potential
7 Conclusions and recommendations
Smart Charging
Peak shaving or load/demand shifting solutions are viable options to reduce costs for different
stakeholders in the (electricity) supply chain, either to reduce consumption costs resulting from peak
consumption or to reduce or avoid the need of any (local or national) grid (connection) investments. But
a common denominator in terms of primary barrier are existing regulation. It would be recommended to
adjust legislation which would allow differentiated price structures in order to create more freedom for
service supplier to incentivize EV drivers and other customers to charge more smartly; and grid operators
to accept flexible power profiles such as Flexpower against reduced grid connection costs. Flexibility to
allow a fit-for-purpose at local context levels are key.
Smart Charging market is in its relevant infancy. The solutions applied in various SEEV4-City pilots are
relatively straightforward and simple in ‘smartness’. The market is likely to mature and become much
smarter in coming 5 – 10 years. However, this does not necessarily mean the current solutions will become
entirely ‘outdated’ or be superseded by other ‘smarter’ services. It may continue to have a place amongst
or in combination with other available smart charging solutions. Additionally, the current (V4)ES solutions
as applied in SEEV4-City may evolve themselves. There is added value in integrating static battery and local
(behind the meter) generation as an integral part of solutions. A holistic approach to a site’s systems design
at an early stage (also considering future growth) will help maximise full potential benefits.
V2X
To enhance the potential for any of the V2X services the market for both bi-directional charging units and
compatible EV models has to be stimulated, both to drive down purchase cost as well as to great the
(charging infrastructure and fleet) volumes necessary to reap the full benefits of their potential. The
market for bi-directional charging units and (compatible) EV models appears to be somewhat in limbo.
There is uncertainty about which direction developments will take and thus what will be the prevalent
technology (CHAdeMo vs CCS / AC vs DC).
Industry appears to be moving to CCS as a standard. But the bi-directional functionality is still under
development with standardisation bodies and not expected before 2025. Fortunately, the first bi-
directional chargers carrying both the CHAdeMo and the CCS connector have entered the public domain
[6]. These are indication that the EV and charging unit market will converge into a more standardised
market and an increase availability of compatible models. Longer term effectiveness will also require
vehicle manufactures to allow V2G operation (at least through approved hardware or optimisation
methodologies) within the vehicle warranties. Policymakers, standards organisations and OEMS can work
more closely together to speed up the process to remove availability and policy limitations.
Smart Charging vs V2X
At least in the coming (approximately) 5 years Smart Charging appears to have the better financial
business case and potential for large scale roll-out with less (impactful) bottlenecks, but looking at longer
term V2X holds its potential to play a significant role in the energy transition, particularly when the focus
is not solely on financial benefits (such as for FCR with V2G and battery storage), but also awarding the
contribution it can bring to help address societal challenges such as local RE consumption and relieving
grid capacity issues and (local) congestions. Some current regulatory barriers (such as on double taxation)
and maturity of the bi-directional charging market will need to be addressed.
FCR Energy trading
FCR as ‘stand-alone service’ may have a limited hype-cycle and could be evening out in coming (5 – 10)
years, but its value to the electricity grid and energy market is expected to remain, particularly when
combined with other services (as part of value stacking of solutions). From the perspective of (V4)ES, it is
expected that earnings from FCR will become less and less the primary objective for investments. It can
SEEV4-City: Final Report V4ES Evaluation for Upscaling and Transnational potential
58
be an interesting addition when considering investments for PV and static storage (or bi-directional
chargers at sites where, at certain times, a large stationary fleet of vehicles is parked to provide energy
storage), making it part of a collated portfolio of (V4)ES which play a significant role within local smart
energy grids.
Ebikes on the radar
Ebikes (and speed pedelecs) may well turn out to be an underestimated force of power for smart charging.
The main benefit of ebikes comes from their very low energy need per km, even more so in combination
with smart (solar) charging, which overall results in a large drop in CO2 emissions by replacing an ICE
vehicle (a nearly -97% CO2 decrease per km driven). In practice, the direct energy impact of the ebike
charging station on energy autonomy and grid investment deferral will be very limited given the limited
power draw, yet the CO2 savings can be large for commuting distances. That same limited power draw,
however, also means that ebikes will demand significantly less from any installed PV than EVs will, leaving
for more energy available to be used by other devises on or near the site. Therefore, a smart charging
solution for ebikes can play a significant role in emission reductions, but the necessary infrastructure
geared towards smart charging is still underdeveloped or does not seem to be much on the radar for
market providers nor policy makers or employers. Standardisation and the formulation of specific policy
criteria or guidelines is necessary.
Smart solution-design decisions
While costs per kWh for Li-ion batteries do drop rapidly with increasing size, the initial investment outlay
is still so significant that batteries are not yet a worthwhile investment when used for a single solution. By
value stacking (providing value to different markets and market participants from the same battery over
varying time scales), the business model for storage of electrical energy can be improved, for example
when additional frequency support can be offered. It is also recommended that design decisions (and
consequential investment requirements) are made based on expected growth scenarios. Despite the
relatively high costs of static battery storage, investing in larger capacity or ensuring a solution can absorb
(modular) battery expansion could be the smarter choice.
Engage the consumer
Consumer is important stakeholder. Surveys in different countries all indicate that transparency about the
solution and a clear understandable communication is deemed very important for the willingness to adopt
or participate, particularly for V2X. It is recommended to include them as key stakeholder for development
in policies and in business models in all stages. Once implemented, it also pays to communicate benefits
for EV drivers. For example, when taxi drivers learned that the Flexpower charging units are capable of
charging with more power outside peak demand periods during the day they started enquiring at the
municipality office about where they could find these charging units.
Dedicated research to assess wide potential
This exercise, assessing the upscaling and transnational transfer potential of smart charging and V2X
solutions, was a (small) part of the overall SEEV4-City project. This meant that the project partners had to
limit the depth and detail in which this analysis could be done. Ideally the partners would have preferred
to spend a more time to uncover the potential in more detail and in a much more quantitative manner.
There are, however, many influencing factors within each if the four context dimensions (the local
landscape) that can impact the likelihood of adoption or return on investment in different types of sites
and warrant much more in-depth research with access to more concrete data for different regions. It
would allow for a much more detailed analysis to assess the potential of solutions in varying settings. The
SEEV4-City project would recommend national or EU funding bodies, such as national governments or
programmes like Interreg NSR to facilitate dedicated in-depth research on this specific research question.

SEEV4-City: Final Report V4ES Evaluation for Upscaling and Transnational potential
59
8 References
[1] Eurostat, “Electricity price statistics,” 2020. [Online]. Available:
https://ec.europa.eu/eurostat/statistics-explained/index.php/Electricity_price_statistics.
[2] Eurostat, “Clean Energy for All Europeans: Commission welcomes European Parliament's adoption
of new electricity market design proposals,” 2019. [Online]. Available:
https://ec.europa.eu/commission/presscorner/detail/en/IP_19_1836.
[3] Opencharge alliance, “BACKGROUND OPEN CHARGE ALLIANCE,” [Online]. Available:
https://www.openchargealliance.org/about-us/background/.
[4] L. Driesen, “Communication protocols,” 2020. [Online]. Available: https://www.itf-
oecd.org/sites/default/files/docs/low-zero-emission-electric-heavy-duty-vehicles-communication-
protocols.pdf.
[5] CharinEV, “Grid Integration Levels,” [Online]. Available:
https://www.charinev.org/fileadmin/Downloads/Papers_and_Regulations/CharIN_Levels_Grid_Inte
gration.pdf.
[6] Venema Technisch bedrijf B.V., “Opening V2G laadplein met direct solar in Lelystad,” 2020. [Online].
Available: https://venematech.nl/v2g-laadtechniek/opening-v2g-laadplein-met-direct-solar-in-
lelystad-de-volgende-stap-naar-een-100-groen-energie-systeem/.
[7] Eur-Lex, [Online]. Available: https://eur-lex.europa.eu/legal-
content/EN/TXT/?uri=uriserv%3AOJ.L_.2018.156.01.0075.01.ENG.
[8] European Commission, “A European Green Deal,” [Online]. Available:
https://ec.europa.eu/info/strategy/priorities-2019-2024/european-green-deal_en.
[9] ENTSO-E, “Frequency Containment Reserves (FCR),” [Online]. Available:
https://www.entsoe.eu/network_codes/eb/fcr/.
[10] Energy-Storage.news, “Energy storage in Europe: Big things expected despite 2019 slowdown,”
2020. [Online]. Available: https://www.energy-storage.news/news/energy-storage-in-europe-big-
things-expected-despited-2019-slowdown.
[11] StatBel, [Online]. Available:
https://statbel.fgov.be/sites/default/files/files/documents/mobiliteit/1.1%20Verkeer/1.1.2%20Voer
tuigenparkallen%20en%20-slachtoffers/veh_parc_2019_nl.xls.
[12] Vreg, [Online]. Available: https://www.vreg.be/sites/default/files/Tariefmethodologie/2021-
2024/publieke_toelichting_consultatie_tm_21-24.pdf.
[13] Autonieuws.be, “België en elektrisch rijden: de vraag van de kip of het ei,” 2020. [Online]. Available:
https://www.autonieuws.be/uitlaat/5144-belgie-en-elektrisch-rijden-de-vraag-van-de-kip-of-het-ei.
[14] Vreg, “Tariefmethodologie 21-24,” [Online]. Available:
https://www.vreg.be/sites/default/files/Tariefmethodologie/2021-
2024/publieke_toelichting_consultatie_tm_21-24.pdf.
[15] Elia Group, “Elia releases its figures on Belgium's 2018 energy mix,” 2019. [Online]. Available:
https://www.elia.be/en/news/press-releases/2019/01/20190118_press-release-elia-releases-its-
figures-on-belgiums-2018-energy-mix.
[16] Power-Technology, “Gas and renewable set to dominate Belgian power generation,” 2019. [Online].
Available: https://www.power-technology.com/comment/gas-and-renewable-set-to-dominate-
power/.
[17] SSB, “Vehicle-to-Grid: Impacts on the electricity market and consumer cost of electric vehicles,”
2019. [Online]. Available: https://www.ssb.no/en/forskning/discussion-papers/vehicle-to-grid-
impacts-on-the-electricity-market-and-consumer-cost-of-electric-vehicles.
SEEV4-City: Final Report V4ES Evaluation for Upscaling and Transnational potential
60
[18] PV-magazine, “Wallonia’s prosumer grid fee comes into force,” 2020. [Online]. Available:
https://www.pv-magazine.com/2020/09/29/wallonias-prosumer-grid-fee-comes-into-force/.
[19] HLN, “Oud elektriciteitsnet maakt laden van sommige e-wagens (bijna) onmogelijk,” [Online].
Available: https://www.hln.be/de-krant/oud-elektriciteitsnet-maakt-laden-van-sommige-e-wagens-
bijna-onmogelijk~aef13151/.
[20] VRT, “Is ons elektriciteitsnet geschikt voor laadpalen van auto’s? In Brussel is dat een probleem, in
Vlaanderen minder,” [Online]. Available: https://www.vrt.be/vrtnws/nl/2020/01/17/is-ons-
elektriciteitsnet-geschikt-voor-laadpalen-van-elektrische/.
[21] StatBel, “4,573,099 buildings in Belgium,” [Online]. Available:
https://statbel.fgov.be/en/themes/housing/building-stock.
[22] Statistiek Vlaanderen, “Woningvoorraad,” [Online]. Available:
https://www.statistiekvlaanderen.be/nl/woningvoorraad.
[23] Statista, “Distribution of the population in Belgium as of 2016, by dwelling type,” [Online]. Available:
https://www.statista.com/statistics/536534/distribution-of-the-population-in-belgium-by-dwelling-
type/.
[24] Fluvius, “Spitsdagen 2020,” [Online]. Available: https://www.fluvius.be/sites/fluvius/files/2020-
03/spitsdagen-2020.pdf.
[25] Fluvius, “12 adviezen voor de Vlaamse nutsvoorzieningen in de komende legislatuur,” [Online].
Available: https://over.fluvius.be/sites/fluvius/files/2019-06/fluvius-memorandum-2019.pdf.
[26] Powerdale, “Meet the Belgian e-driver,” [Online]. Available:
https://www.powerdale.com/sites/default/files/2019-10/PWD_19_09_RU_InfoGr_A4_2delig.pdf.
[27] FleetEurope, “Average Belgian company car commute shrinks to 23 km,” [Online]. Available:
https://www.fleeteurope.com/en/maas/belgium/features/average-belgian-company-car-
commute-shrinks-23-km.
[28] Electrive, “Norway: Electric cars take 55.9% market share in March,” [Online]. Available:
https://www.electrive.com/2020/04/03/norway-electric-cars-take-55-9-market-share-in-march/.
[29] Elbil, “Norwegian EV policy,” [Online]. Available: https://elbil.no/english/norwegian-ev-policy/.
[30] E. Figenbaum and M. Kolbenstvedt, “Learning from Norwegian Battery Electric and Plug-in Hybrid
Vehicle users – Results from a survey of vehicle owners,” [Online]. Available:
https://www.toi.no/publications/learning-from-norwegian-battery-electric-and-plug-in-hybrid-
vehicle-users-results-from-a-survey-of-vehicle-owners-article33869-29.html.
[31] Norwegian Government, “Renewable energy production in Norway,” [Online]. Available:
https://www.regjeringen.no/en/topics/energy/renewable-energy/renewable-energy-production-in-
norway/id2343462/.
[32] Statistics Norway, “Electricity,” [Online]. Available: https://www.ssb.no/en/energi-og-
industri/statistikker/elektrisitet.
[33] Sil Boeve; Jenny Cherkasky; Marian Bons; Henrik Schult, “Dynamic electricity prices,” [Online].
Available: https://asset-ec.eu/wp-content/uploads/2018/10/Dynamic-electricity-prices.pdf.
[34] Statistics Norway, “Dwellings,” April 2020. [Online]. Available: https://www.ssb.no/en/bygg-bolig-og-
eiendom/statistikker/boligstat.
[35] Fortum, [Online]. Available: https://www.fortum.com/media/2017/06/charge-drive-smart-
solutions-e-mobilit.
[36] Gronn Kontakt, [Online]. Available: https://gronnkontakt.no/english .
[37] The Explorer, “Smart charging for multiple electric vehicles,” [Online]. Available:
https://www.theexplorer.no/solutions/smart-charging-for-multiple-electric-vehicles/ .
[38] S. Nordengen, D. C. Ruther, A. Riiser, L. B. Andersen and A. Solbraa, “Correlates of Commuter Cycling
in Three Norwegian Counties,” 2019. [Online]. Available:
https://www.ncbi.nlm.nih.gov/pmc/articles/PMC6887986/.

SEEV4-City: Final Report V4ES Evaluation for Upscaling and Transnational potential
61
[39] KPMG, “Autonomous Vehicles readiness index,” [Online]. Available:
https://assets.kpmg/content/dam/kpmg/nz/pdf/February/Autonomous_Vehicles_Report_2018.pdf.
.
[40] E-drivers.com, “AANTAL LAADPALEN IN NEDERLAND HOUDT GELIJKE TRED MET AANTAL EV’S,” 2019.
[Online]. Available: https://e-drivers.com/aantal-laadpalen-nederland-gelijke-tred-aantal-evs/ .
[41] International Transport Forum, [Online]. Available: https://www.itf-
oecd.org/sites/default/files/docs/low-zero-emission-electric-heavy-duty-vehicles-communication-
protocols.pdf p19.
[42] Eerste kamer, “Wet verbod op kolen bij elektriciteitsproductie,” [Online]. Available:
https://www.eerstekamer.nl/wetsvoorstel/35167_wet_verbod_op_kolen_bij.
[43] CBS, “Productie groene elektriciteit in stroomversnelling,” 2020. [Online]. Available:
https://www.cbs.nl/nl-nl/nieuws/2020/10/productie-groene-elektriciteit-in-stroomversnelling.
[44] Net beheer Nederland, “Betrouwbaarheid van elektriciteitsnetten,” 2018. [Online]. Available:
https://www.netbeheernederland.nl/_upload/Files/Betrouwbaarheid_elektriciteitsnetten_in_Neder
land_2018_150.pdf.
[45] CBS, “Vier op de tien huishoudens wonen in een rijtjeshuis,” 2016. [Online]. Available:
https://www.cbs.nl/nl-nl/nieuws/2016/14/vier-op-de-tien-huishoudens-wonen-in-een-rijtjeshuis.
[46] CBS, “4 procent lopend naar het werk,” 2018. [Online]. Available: https://www.cbs.nl/nl-
nl/nieuws/2018/14/4-procent-lopend-naar-het-werk.
[47] CBS, [Online]. Available: https://www.cbs.nl/nl-nl/maatschappij/verkeer-en-vervoer/transport-en-
mobiliteit/mobiliteit/personenmobiliteit/categorie-personenmobiliteit/personenmobiliteit-van-en-
naar-het-werk.
[48] ANWB, “De Elektrisch Rijden Monitor 2019,” 2019. [Online]. Available:
https://www.anwb.nl/belangenbehartiging/duurzaam/elektrisch-rijden-monitor-2019.
[49] Anwb, “Elektrisch Rijden Monitor 2018,” [Online]. Available:
https://www.anwb.nl/binaries/content/assets/anwb/pdf/belangenbehartiging/mobiliteit/rapport-
erm-def.pdf.
[50] K. v. Heuveln, “Dutch EV drivers’ acceptance of vehicle-to-grid (V2G) at long-term parking,” 2020.
[Online]. Available: https://cenexgroup.nl/2020/02/27/dutch-ev-drivers-acceptance-of-vehicle-to-
grid-v2g-at-long-term-parking/.
[51] Zap-map, “EV Charging Stats 2020,” [Online]. Available: https://www.zap-map.com/statistics/.
[52] electricityinfo.org, “Real Time British Electricity Fuel Mix,” [Online]. Available:
http://electricityinfo.org/real-time-british-electricity-supply/.
[53] Solar power Europe, “https://www.solarpowereurope.org/wp-content/uploads/2018/09/Global-
Market-Outlook-2018-2022.pdf,” [Online]. Available: https://www.solarpowereurope.org/wp-
content/uploads/2018/09/Global-Market-Outlook-2018-2022.pdf.
[54] Solar-trade, [Online]. Available: https://www.solar-trade.org.uk.
[55] J. Ambrose, “Home solar panel installations fall by 94% as subsidies cut,” [Online]. Available:
https://www.theguardian.com/environment/2019/jun/05/home-solar-panel-installations-fall-by-
94-as-subsidies-cut.
[56] Green business watch, “UK Domestic Solar Panel Costs and Returns 2019,” [Online]. Available:
https://greenbusinesswatch.co.uk/uk-domestic-solar-panel-costs-and-returns-2019.
[57] Solar-trade, “40 GW by 2030? The UK solar PV market outlook,” 2019. [Online]. Available:
https://www.solar-trade.org.uk/wp-content/uploads/2019/11/STA-2030-Deployment-forecast-
final.pdf.
[58] UK Government, “Consultation on the Feed-in Tariffs Scheme,” 2018. [Online]. Available:
https://assets.publishing.service.gov.uk/government/uploads/system/uploads/attachment_data/fil
e/727193/IA_for_FITs_closure.pdf.
SEEV4-City: Final Report V4ES Evaluation for Upscaling and Transnational potential
62
[59] Energysavingtrust.org, “Smart Export Guarantee,” [Online]. Available:
https://energysavingtrust.org.uk/renewable-energy/electricity/solar-panels/smart-export-
guarantee-and-feed-tariffs.
[60] Solar-trade, “Smart Export Guarantee,” [Online]. Available: https://www.solar-
trade.org.uk/resource-centre/advice-tips-for-households/smart-export-guarantee/.
[61] Statista, “Number of dwellings in England from 2001 to 2019,” [Online]. Available:
https://www.statista.com/statistics/232302/number-of-dwellings-in-england/.
[62] Bre trust, “The Housing Stock of The United Kingdom,” [Online]. Available:
https://files.bregroup.com/bretrust/The-Housing-Stock-of-the-United-Kingdom_Report_BRE-
Trust.pdf.
[63] PWC, “Powering ahead! Making sense of businessmodels in electric vehicle charging,” 2018.
[Online]. Available: https://www.pwc.co.uk/power-utilities/assets/powering-ahead-ev-charging-
infrastructure.pdf.
[64] Energysavingtrust, “Time of use tariffs: all you need to know,” 2020. [Online]. Available:
https://energysavingtrust.org.uk/blog/time-use-tariffs-all-you-need-know.
[65] Smartenergygb, “New research reveals consumer interest in time-of-use tariffs,” 2019. [Online].
Available: https://www.smartenergygb.org/en/resources/press-centre/press-releases-folder/time-
of-use-tariffs.
[66] Deloitte, “2020 predictions for UK Technology, Media and Telecommunications,” [Online]. Available:
https://www2.deloitte.com/content/dam/Deloitte/uk/Documents/technology-media-
telecommunications/uk-deloitte-technology-media-telecommunications-predictions-2020.pdf.
[67] Statbel, [Online]. Available:
https://statbel.fgov.be/sites/default/files/files/documents/mobiliteit/1.1%20Verkeer/1.1.2%20Voer
tuigenparkallen%20en%20-slachtoffers/veh_parc_2019_nl.xls.
[68] Fleet, “Dossier Laadpalen | Hoeveel, waar en wat kost dat?,” 2019. [Online]. Available:
https://www.fleet.be/dossier-laadpalen-hoeveel-waar-en-wat-kost-dat/.
[69] Vreg, [Online]. Available: https://www.vreg.be/nl/document/cons-2020-03.
[70] Energysavingtrust, “New transport decarbonisation plan – 2050 zero emissions target,” [Online].
Available: https://energysavingtrust.org.uk/new-transport-decarbonisation-plan-2050-zero-
emissions-target/.
[71] Eurostat, “Renewable energy statistics,” [Online]. Available: https://ec.europa.eu/eurostat/statistics-
explained/index.php/Renewable_energy_statistics.
[72] Vreg, [Online]. Available: https://www.vreg.be/sites/default/files/Tariefmethodologie/2021-
2024/publieke_toelichting_consultatie_tm_21-24.pdf.
[73] Tennet, “Ondersteunende diensten,” [Online]. Available:
https://www.tennet.eu/nl/elektriciteitsmarkt/ondersteunende-diensten/.
[74] Gopacs, [Online]. Available: https://gopacs.eu.