Embed Size (px)
Citation preview

v Q3 2021 revenue
October 12, 2021
Lou
is Vu
itton

v
This document may contain certain forward looking statements which are based on estimations and forecasts. By their nature, these forward looking
statements are subject to important risks and uncertainties and factors beyond our control or ability to predict, in particular those described in LVMH’s
Universal Registration Document which is available on the website (www.lvmh.com). These forward looking statements should not be considered as a
guarantee of future performance, the actual results could differ materially from those expressed or implied by them. The forward looking statements
only reflect LVMH’s views as of the date of this document, and LVMH does not undertake to revise or update these forward looking statements. The
forward looking statements should be used with caution and circumspection and in no event can LVMH and its Management be held responsible for
any investment or other decision based upon such statements. The information in this document does not constitute an offer to sell or an invitation to
buy shares in LVMH or an invitation or inducement to engage in any other investment activities.
Disclaimer2

v
+ 40%ORGANIC REVENUE
GROWTHfor 9M 2021 vs 2020
Strong rebound in the context of emerging from the health crisis
Strong rebound since the beginning of the year.
Sustained revenue growth in Asia and the United States and gradual recovery in
Europe
Successful integration of Tiffany, which has
performed extremely well
since its acquisition
Record revenuefor Fashion & Leather Goods
Q3 2021 revenue3
+ 11% vs 2019
All business groups contributed to
Q3 organic growth versus 2020

v
Record 9 months revenue in 2021
9 months evolution of revenue (in million of euros)
Q3 2021 revenue4
+ 40% vs 2020
+ 10% vs 2020- 4% vs 2020
+ 46% vs 2020
Organic growth
Structure impact
Currency effect
+ 11% organic growth vs 2019
+ 15% reported growth vs 2019

v
Q3 trends comparable to H1 trends
Quarterly organic revenue change (%)
Q3 2021 revenue5
2020 vs 2019
2021 vs 2020
+ 8%
+ 14%
+ 11%
2021 vs 2019
+ 40%
+ 20%
+ 53%
+ 84%
+ 30%
- 21%
- 7%
- 28%
- 38%
- 17%
9M 2021
Q3 2021
H1 2021
Q2 2021
Q1 2021
9M 2020
Q3 2020
H1 2020
Q2 2020
Q1 2020
+ 11%
+ 11%
Q1 2021
Q2 2021
H1 2021
Q3 2021
9M 2021

v
Balanced geographic revenue mix
9 months 2021 revenue breakdown by region (in % of total revenue)
Q3 2021 revenue6
44.2 bn€
REVENUE
UNTED STATES (inc. Hawaii)
25% of total revenue
vs. 24 % over 9M 2020vs. 23 % over 9M 2019
ASIA (excl. Japan)
36% of total revenue
vs. 34 % over 9M 2020vs. 31 % over 9M 2019
JAPAN
7% of total revenue
vs. 7 % over 9M 2020vs. 7 % over 9M 2019
OTHER MARKETS
11% of total revenue
vs. 12 % over 9M 2020vs. 12 % over 9M 2019
EUROPE (excl. France)
15% of total revenue
vs. 16 % over 9M 2020vs. 19 % over 9M 2019
FRANCE
6% of total revenue
vs. 7 % over 9M 2020vs. 8 % over 9M 2019

v
Asia and US, strongest performing regions; Europe improving
Quarterly revenue change by region, organic change versus same period of 2019
Q3 2021 revenue7
2021 vs 2019
+ 15%
- 3%
+ 26%
- 18%
+ 31%
- 4%
+ 34%
- 15%
+ 23%
- 3%
+ 30%
- 16%
+ 22%
- 6%
+ 26%
- 6%
23%
-4%
29%
-13%
United States (excl. Hawaï) Japan Asia (excl. Japan) Europe
Q1 2021 Q2 2021 H1 2021 Q3 2021 9M 2021

v
Wines & Spirits
Q3 2021 revenue8
Ch
âte
au
d’Y
qu
em
BUSINESS GROUPS
REVIEW
v
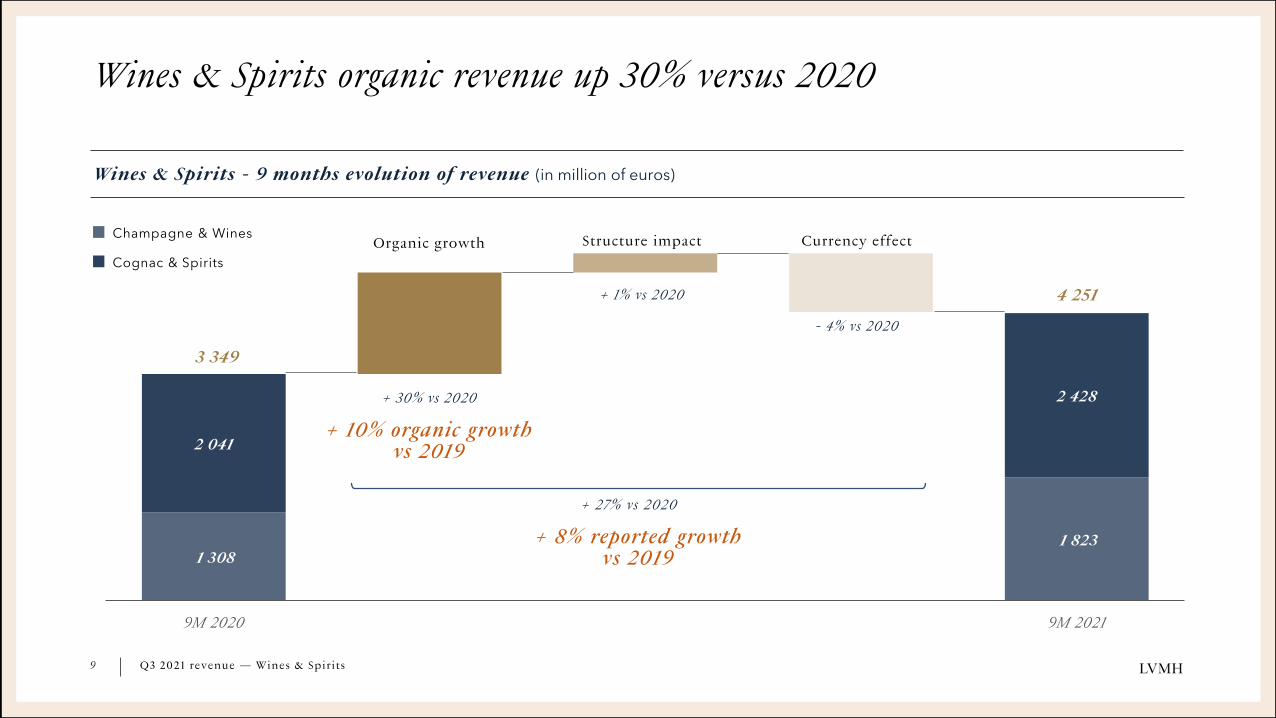
1 308 1 823
2 041
2 428
9M 2020 9M 2021
Wines & Spirits organic revenue up 30% versus 2020
Wines & Spirits - 9 months evolution of revenue (in million of euros)
Q3 2021 revenue — Wines & Spirits9
+ 30% vs 2020
+ 1% vs 2020
- 4% vs 2020
Champagne & Wines
Cognac & Spirits
3 349
4 251
+ 27% vs 2020
+ 10% organic growth vs 2019
+ 8% reported growthvs 2019
Organic growth Structure impact Currency effect

v
Growth versus 2019 gradually normalizing
Wines & Spirits - Quarterly evolution of organic revenue change
Q3 2021 revenue — Wines & Spirits1 0
+ 30%
+ 10%
+ 44%
+ 55%
+ 36%
- 15%
- 3%
- 23%
- 33%
- 14%
9M 2021
Q3 2021
H1 2021
Q2 2021
Q1 2021
9M 2020
Q3 2020
H1 2020
Q2 2020
Q1 2020
+ 17%
+ 7%
+ 12%
2021 vs 2019
+ 7%
+ 10%
Q1 2021
Q2 2021
H1 2021
Q3 2021
9M 2021
2020 vs 2019
2021 vs 2020

v
Sustained demand in the United States and strong rebound in China
Q3 2021 revenue — Wines & Spirits1 1
+ 4%
VOLUME HENNESSY
vs 9M 2019
Cognac & SpiritsContinued rapid growth despite tight supply
⎯ Hennessy: steady demand in Q3 vs 2020, while supply constraints remain
⎯ Mix improvement vs 2020 coupled with continued positive price impact
⎯ Strong recovery in China; Q3 positively impacted by restocking in
anticipation of earlier Mid Autumn Festival vs last year
⎯ Rapid growth of Glenmorangie and Ardbeg
+ 7%
VOLUME CHAMPAGNE
vs 9M 2019
Champagne & WinesSustained growth in Q3 in key markets
⎯ Strong recovery in champagne demand in the US as well as Europe which
benefited in Q3 from reopening of restaurants and gradual return of tourism
⎯ Japan, South-East Asia and Travel Retail still suffering from Covid situation
⎯ Success of recently launched Chandon Garden Spritz sparkling wine
⎯ Solid momentum of Château d’Esclans
⎯ First time integration in Q3 of Armand de Brignac, 50% of which was acquired
following partnership with Shawn JAY-Z Carter

v
Fashion & Leather Goods
Q3 2021 revenue1 2
Ch
ristian
Dio
r Co
utu
re
BUSINESS GROUPS
REVIEW

v
Fashion & Leather Goods organic revenue up 57% versus 2020
Fashion & Leather Goods - 9 months evolution of revenue (in million of euros)
Q3 2021 revenue — Fashion & Leather Goods1 3
Organic growth Currency effect
+ 57% vs 2020
- 4% vs 2020
+ 53% vs 2020
+ 38% organic growth vs 2019
+ 34% reported growthvs 2019
Structure impact
0% vs 2020
v
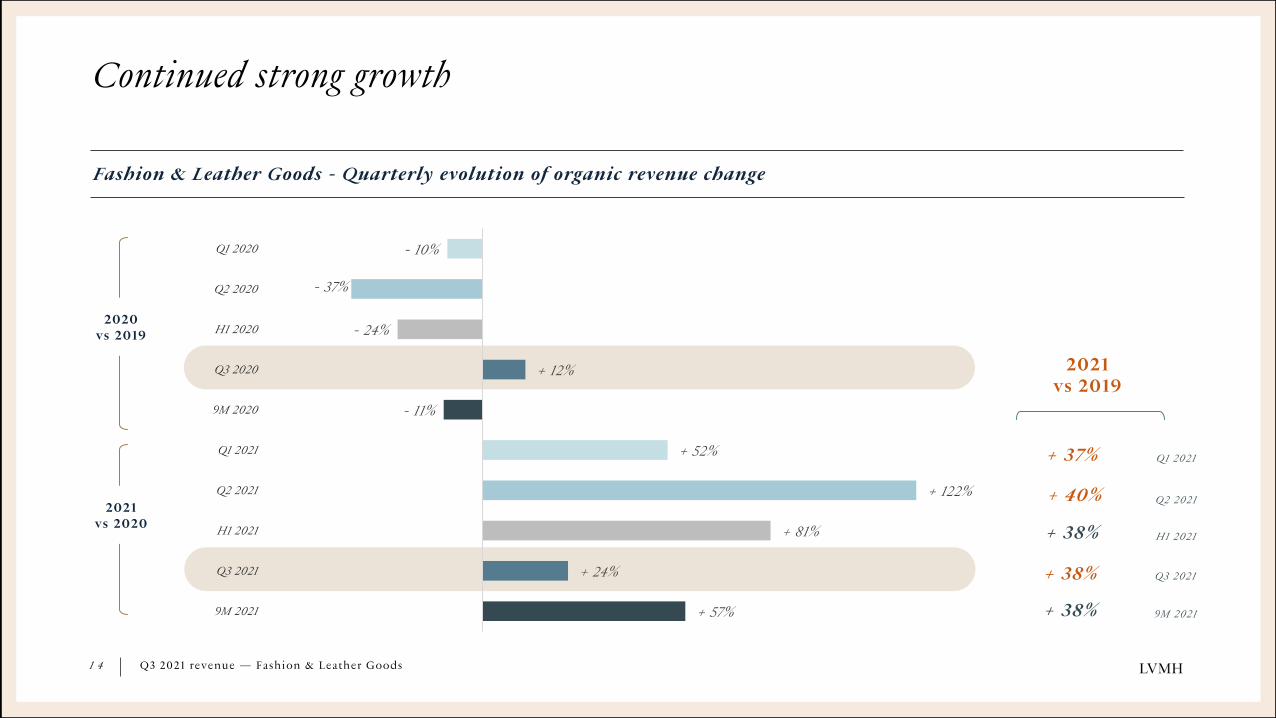
Continued strong growth
Fashion & Leather Goods - Quarterly evolution of organic revenue change
Q3 2021 revenue — Fashion & Leather Goods1 4
+ 57%
+ 24%
+ 81%
+ 122%
+ 52%
- 11%
+ 12%
- 24%
- 37%
- 10%
9M 2021
Q3 2021
H1 2021
Q2 2021
Q1 2021
9M 2020
Q3 2020
H1 2020
Q2 2020
Q1 2020
+ 37%
+ 40%
+ 38%
2021 vs 2019
+ 38%
+ 38%
Q1 2021
Q2 2021
H1 2021
Q3 2021
9M 2021
2020 vs 2019
2021 vs 2020

v
Remarkable performance, particularly Louis Vuitton, Christian Dior, Fendi, Loewe and Celine
Louis Vuitton
Exceptional performance, driven by innovation, quality and authenticity
⎯ Creative initiatives to celebrate 200th birthday
of the Maison’s founder Louis Vuitton
⎯ Innovative designs for Capucines bag following
new collaboration with six international artists
⎯ Enlarged product offering in all categories
⎯ Opening of Vendôme workshop for precious
leather handbags
Christian Dior Couture
Outstanding growth in all product categories
and all markets
⎯ Great success of the new Caro bag
⎯ Inspiring live fashion shows for collections
designed by Maria Grazia Chiuri
⎯ Exhibition « Christian Dior: Designer of Dreams »
reinvented at the Brooklyn Museum in New York
after Paris, London and Shanghai
Other brands
Q3 2021 revenue — Fashion & Leather Goods1 5
Fendi Kim Jones’ first collection very wellreceived, notably new Fendi First bag
Celine Strong demand in Ready-To-Wear and for leather goods line Triomphe
Loro Piana
Loewe
Official supplier for European Team during last Ryder Cup
Success of new Goya bag; innovative communication to support launch of new iconic Amazona bag
Artisticappointments
New Artistic Directors Nigo at Maison Kenzo and Camille Miceli at Maison Pucci
v
Perfumes & Cosmetics
Q3 2021 revenue1 6
Pa
rfum
s Ch
ristian
Dio
r
BUSINESS GROUPS
REVIEW

v
Perfumes & Cosmetics organic revenue up 30% versus 2020
Perfumes & Cosmetics - 9 months evolution of revenue (in million of euros)
1 7
Organic growth Structure impact Currency effect
+ 30% vs 2020
0% vs 2020 - 3% vs 2020
+ 27% vs 2020
- 2% organic changevs 2019
- 5% reported change vs 2019
Q3 2021 revenue — Perfumes & Cosmetics

v
Q3 back to 2019 level thanks to continued strong progress in US and China, and improvement in Europe
Perfumes & Cosmetics - Quarterly evolution of organic revenue change
1 8
- 4%
- 1%
- 3%
2021 vs 2019
Q3 2021 revenue— Perfumes & Cosmetics
+ 30%
+ 19%
+ 37%
+ 67%
+ 18%
- 25%
- 16%
- 29%
- 40%
- 19%
9M 2021
Q3 2021
H1 2021
Q2 2021
Q1 2021
9M 2020
Q3 2020
H1 2020
Q2 2020
Q1 2020
0%
- 2%
Q1 2021
Q2 2021
H1 2021
Q3 2021
9M 2021
2020 vs 2019
2021 vs 2020

v
Rapid growth in direct sales, both in-store and online, and continued selective distribution
Other brands
1 9 Q3 2021 revenue— Perfumes & Cosmetics
Parfums Christian Dior Strong revenue growth with local customers
throughout selective distribution
⎯ Successful launches of new iconic perfume Miss
Dior Eau de Parfum and Sauvage Elixir
⎯ Sustained progress of La Collection Privée
⎯ Continued development of Prestige
and Capture Totale lines
⎯ Solid online revenue growth
Guerlain
Excellent momentum driven by skincare
⎯ Aqua Allegoria performing well
⎯ Solid online sales momentum
⎯ Strong progress of skincare lines
Abeille Royale and Orchidée Impériale
⎯ Launch of Guerlain Haute Parfumerie line
L'Art & La Matière
Parfums Givenchy
Continued success of L’Interdit fragrance and Prisme Libre makeup
Fresh Success of Crème Ancienne Premium skincare line
Maison Francis Kurkdjian
Launch of new Cologne forte collection
Acqua di Parma
Officine Universelle Buly
New flagship opened in Shanghai
Acquired by LVMH following nearly4 years of support from LVMH LuxuryVentures

v
Watches & Jewelry
Q3 2021 revenue2 0
Tiffa
ny &
Co
.
BUSINESS GROUPS
REVIEW

v
Watches & Jewelry organic revenue up 49% versus 2020; significantstructure contribution from integration of Tiffany
Watches & Jewelry - 9 months evolution of revenue (in million of euros)
2 1
Organic growth Structure impact Currency effect
+ 49% vs 2020
X2.3 vs 2020
- 3% vs 2020
X2.7 vs 2020
+ 4% organic growth vs 2019
+ 89% reported growth vs 2019
Q3 2021 revenue — Watches & Jewelry

v
New Covid restrictions in Asia impact Q3 growth
Watches & Jewelry - Quarterly evolution of organic revenue change
2 2 Q3 2021 revenue — Watches & Jewelry
+ 49%
+ 18%
+ 71%
+ 125%
+ 35%
- 30%
- 14%
- 39%
- 52%
- 26%
9M 2021
Q3 2021
H1 2021
Q2 2021
Q1 2021
9M 2020
Q3 2020
H1 2020
Q2 2020
Q1 2020
+ 1%
+ 9%
+ 5%
2021 vs 2019
+ 1%
+ 4%
Q1 2021
Q2 2021
H1 2021
Q3 2021
9M 2021
2020 vs 2019
2021 vs 2020

v
Strong rebound of activity in own stores and start of Tiffany integration
Other brands
Q3 2021 revenue — Watches & Jewelry2 3
TiffanyExcellent first 9 months, momentum
particularly strong in the US
⎯ Solid performance of Tiffany T line
⎯ Successful launch of « ABOUT LOVE »
campaign starring Beyoncé and JAY-Z
⎯ Limited series of Blue Box sculptured by
contemporary artist Daniel Arsham
⎯ New brand ambassador Kyle Kuzma
Bvlgari
Good progress of jewelry, particularly in own
stores
⎯ Opening of refurbished Place Vendôme flagship
store
⎯ Serpenti Metamorphosis exhibition in Milan
through an immersive and multisensory AI data
sculpture
⎯ Launch of the first India-specific product
offering alongside brand ambassador Priyanka
Chopra Jonas
⎯ New ambassador Chinese actor Yang Yang
TAG Heuer New Carrera ambassador Ryan Gosling
Hublot New ambassador tennis player Novak Jokovic
Fred Popularity of Pretty Woman collection
Zenith Opening of Zenith ManufacturingBoutique in Switzerland
Chaumet Launch of an exclusive diamond cutthe Taille Impératrice

v
SelectiveRetailing
Q3 2021 revenue2 4
La S
am
arita
ine
BUSINESS GROUPS
REVIEW

v
Selective retailing organic revenue up 13% versus 2020
Selective retailing - 9 months evolution of revenue (in million of euros)
2 5
Organic growth Structure impact Currency effect
+ 13% vs 2020
0% vs 2020 - 4% vs 2020
+ 9% vs 2020
- 23% organic changevs 2019
- 26% reported changevs 2019
Q3 2021 revenue— Selective retailing

v
Continued impact of limited international travel
Selective retailing - Quarterly evolution of organic revenue change
2 6
+ 13%
+ 15%
+ 12%
+ 31%
- 5%
- 31%
- 29%
- 33%
- 38%
- 26%
9M 2021
Q3 2021
H1 2021
Q2 2021
Q1 2021
9M 2020
Q3 2020
H1 2020
Q2 2020
Q1 2020
Q3 2021 revenue— Selective retailing
- 30%
- 19%
- 25%
2021 vs 2019
-19%
- 23%
Q1 2021
Q2 2021
H1 2021
Q3 2021
9M 2021
2020 vs 2019
2021 vs 2020
v
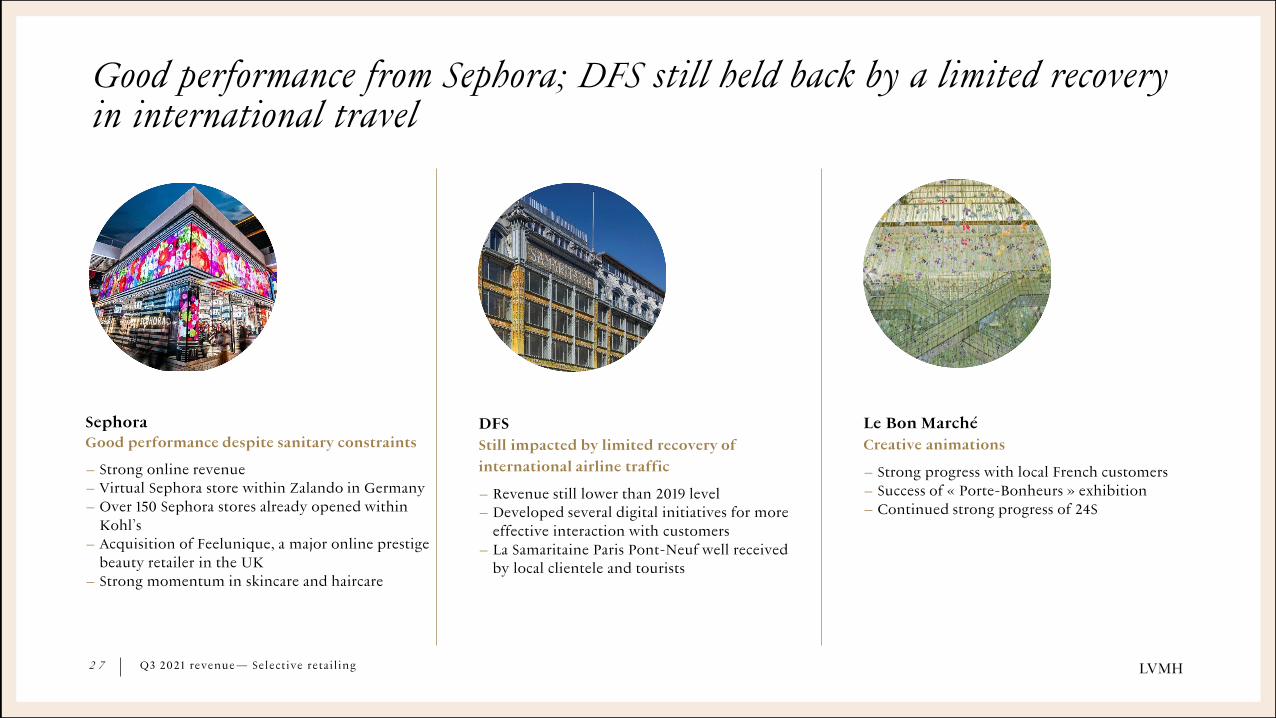
Good performance from Sephora; DFS still held back by a limited recovery in international travel
2 7 Q3 2021 revenue— Selective retailing
SephoraGood performance despite sanitary constraints
⎯ Strong online revenue
⎯ Virtual Sephora store within Zalando in Germany
⎯ Over 150 Sephora stores already opened within
Kohl’s
⎯ Acquisition of Feelunique, a major online prestige
beauty retailer in the UK
⎯ Strong momentum in skincare and haircare
DFS
Still impacted by limited recovery of
international airline traffic
⎯ Revenue still lower than 2019 level
⎯ Developed several digital initiatives for more
effective interaction with customers
⎯ La Samaritaine Paris Pont-Neuf well received
by local clientele and tourists
Le Bon Marché
Creative animations
⎯ Strong progress with local French customers
⎯ Success of « Porte-Bonheurs » exhibition
⎯ Continued strong progress of 24S

v
Taking advantage of progressive improvement in health crisis in 2021while staying vigilant
Strong recovery within the
context of emerging from the
health crisis and well positioned to continue to
gain market share
Continued strong momentum of online revenue and omnichannel developments
All business groups contributed to
Q3 organic growth versus 2020
Focus on innovative and high-quality products, continued selective investment, notably in store
network expansion,
cost management and agility
Q3 2021 revenue2 8

v ANNEX
Lou
is Vu
itton

v
2021 organic revenue change by region and by quarter
Q3 2021 revenue3 0
2021 vs 2020
Q1 2021 Q2 2021 H1 2021 Q3 2021 9M 2021
United States + 15 % + 31% + 23% + 22% + 23%
Japan - 3% - 4% - 3% - 6% - 4%
Asia (excl. Japan) + 26% + 34% + 30% + 26% + 29%
Europe - 18% - 15% - 16% - 6% - 13%
Total LVMH + 8% + 14% + 11% + 11% + 11%
2021 vs 2019
Q1 2021 Q2 2021 H1 2021 Q3 2021 9M 2021
United States + 23% X 2.1 + 60% + 28% + 48%
Japan + 8% X 2.1 + 42% + 15% +31%
Asia (excl. Japan) + 86% + 55% + 70% + 12% + 47%
Europe - 9% + 87% + 25% + 23% + 24%
Total LVMH + 30% + 84% + 53% + 20% + 40%
v
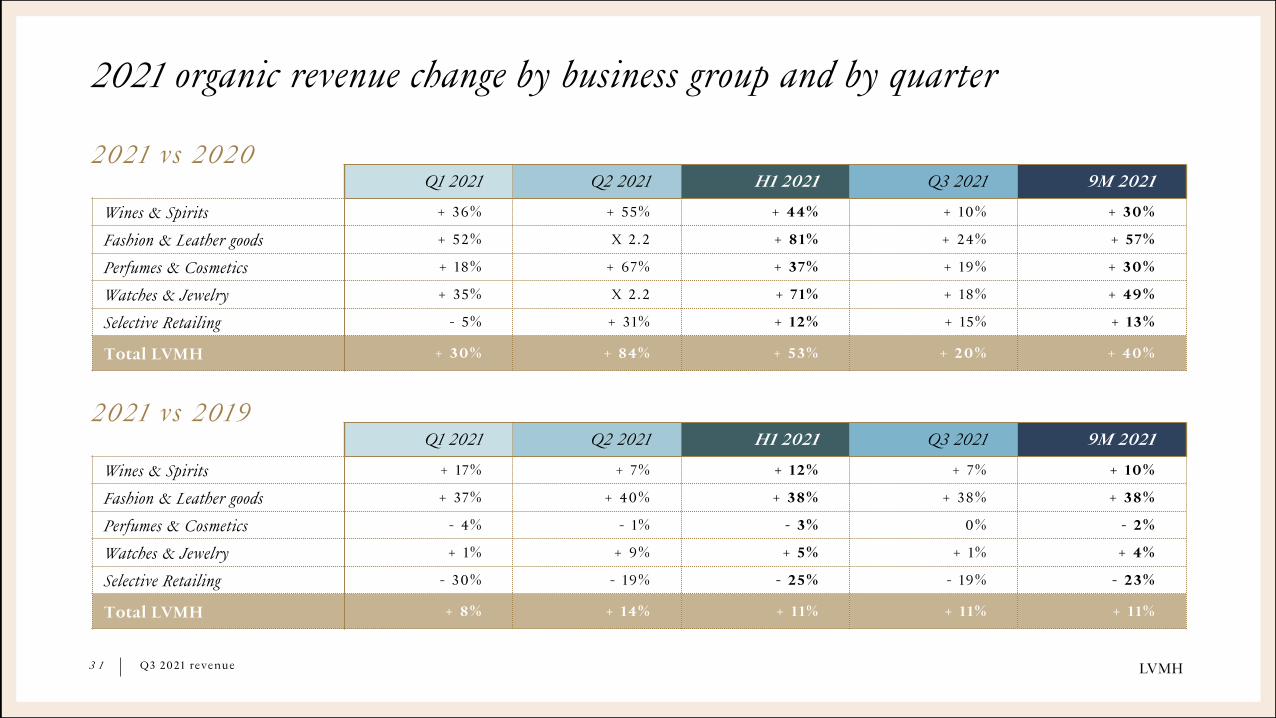
2021 organic revenue change by business group and by quarter
Q3 2021 revenue3 1
Q1 2021 Q2 2021 H1 2021 Q3 2021 9M 2021
Wines & Spirits + 36% + 55% + 44% + 10% + 30%
Fashion & Leather goods + 52% X 2.2 + 81% + 24% + 57%
Perfumes & Cosmetics + 18% + 67% + 37% + 19% + 30%
Watches & Jewelry + 35% X 2.2 + 71% + 18% + 49%
Selective Retailing - 5% + 31% + 12% + 15% + 13%
Total LVMH + 30% + 84% + 53% + 20% + 40%
2021 vs 2020
Q1 2021 Q2 2021 H1 2021 Q3 2021 9M 2021
Wines & Spirits + 17% + 7% + 12% + 7% + 10%
Fashion & Leather goods + 37% + 40% + 38% + 38% + 38%
Perfumes & Cosmetics - 4% - 1% - 3% 0% - 2%
Watches & Jewelry + 1% + 9% + 5% + 1% + 4%
Selective Retailing - 30% - 19% - 25% - 19% - 23%
Total LVMH + 8% + 14% + 11% + 11% + 11%
2021 vs 2019

v
Revenue by business group and by quarter
Q3 2021 revenue3 2
FY 2021Champagne
& Wines
Cognac &
Spirits
Wines &
Spirits
Fashion &
Leather goods
Perfumes &
Cosmetics
Watches &
Jewelry
Selective
Retailing
Other activities
& eliminationsTOTAL
Q1 2021 549 961 1 510 6 738 1 550 1 883 2 337 (59) 13 959
Q2 2021 580 615 1 195 7 125 1 475 2 140 2 748 23 14 706
H1 2021 1 129 1 576 2 705 13 863 3 025 4 023 5 085 (36) 28 665
Q3 2021 694 852 1 546 7 452 1 642 2 137 2 710 25 15 512
9M 2021 1 823 2 428 4 251 21 315 4 668 6 160 7 795 (12) 44 177
(in million of euros)
(in million of euros)
FY 2020Champagne
& Wines
Cognac &
Spirits
Wines &
Spirits
Fashion &
Leather goods
Perfumes &
Cosmetics
Watches &
Jewelry
Selective
Retailing
Other activities
& eliminationsTOTAL
Q1 2020 448 727 1 175 4 643 1 382 792 2 626 (22) 10 596
Q2 2020 306 503 810 3 346 922 527 2 218 (26) 7 797
H1 2020 754 1 230 1 985 7 989 2 304 1 319 4 844 (48) 18 393
Q3 2020 554 810 1 364 5 945 1 370 947 2 332 (3) 11 955
9M 2020 1 308 2 041 3 349 13 934 3 674 2 266 7 176 (51) 30 348
As table totals are calculated based on unrounded figures, there may be slight discrepancies between these totals and the sum of their component figures.