Embed Size (px)
Citation preview
VOCAL DIVERSITY OF FEMALE KLOSS’S GIBBONS (Hylobates klossii) IN THE
MENTAWAI ISLANDS, INDONESIA
Keith, S.A. 2005 Oxford Brookes University
MSc in Primate Conservation

ii
DEDICATION
I dedicate my dissertation to my Grandma who sadly passed away while I was still in Indonesia, but who’s belief in me has never faltered and who had the most knowledge about gibbons I have ever seen in an 89 year old!

iii
ABSTRACT
The vocal diversity of female Kloss’s gibbons was assessed by spectrographically
analysing the sex-specific, stereotypic great call phrase of the female. Songs were
recorded during a period from June – August 2005 in the Mentawai Islands 85-135km
off the coast of West Sumatra, Indonesia. Four locations on three different islands in
the chain were used: Simabuggai (Siberut), Sikabei (Siberut), Saureinu (Sipora) and
South Pagai (South Pagai). Songs were recorded from three to six listening posts per
location using a modified point census technique. A total of 24 females and 137 great
calls were of sufficient quality to be spectrographically analysed from the four
populations.
Spectrographic analysis was achieved using ‘Raven 1.2’ software and data was
obtained for 12 variables: (1) Pre-trill + trill duration, (2) Frequency band exploited
during pre-trill and trill, (3) Duration of 1st note, (4) Frequency modulation of 1
st note,
(5) Duration of 2nd note, (6) Frequency of 2
nd note, (7) Number of pre-trill notes, (8)
Pre-trill duration, (9) Notes/second in pre-trill, (10) Trill duration, (11) Number of trill
notes, (12) Notes/second in trill. No variables were included from the post-trill
element of the great call phrase because of insufficient recording quality. Statistical
tests determined significance of diversity in the following categories: Intra-individual,
inter-individual, inter-population, intra-island, inter-island, and Siberut group and
Sipora & South Pagai group. Coefficient of variation, Mann Whitney U and Kruskal
Wallis non-parametric analysis of variance tests demonstrated significant diversity of
individual, population and island categories. Discriminant function analysis assigned
great calls to individuals correctly in a range of 47.8-81.1% of cases in the 4
populations, assigned individuals to populations correctly in 58.3% of cases, and

iv
assigned individuals to their correct islands in 70.8% of cases. Discriminant function
analysis for classification of individuals to either a Siberut group or Sipora & South
Pagai group, assigned individuals correctly in 62.5% of cases when all variables were
included, and in 79.2% of cases when the variable ‘ Number of notes in trill’ was
removed.
Results suggest individuals are distinguishable from each other and therefore there is
potential for individual recognition among conspecifics. Three hypotheses are
proposed to explain inter-individual diversity: (1) Trilling as a handicap, (2)
Neighbour-stranger discrimination, (3) Relaxed selection. Inter-individual diversity
differs between populations and this is suggested to be because of local differences in
forest structure and characteristics. Inter-population differences are hypothesised to
be due to rivers acting as facilitators to speciation. Intra-island (Siberut) diversity is
lower than inter-island diversity as expected. Inter-island diversity is significant but
implies an invalid clinal relationship throughout the island chain. The level of
diversity between the Siberut group and the Sipora & South Pagai group indicates the
Kloss’s gibbon should remain with no Evolutionarily Significant Units (ESUs) despite
a trend suggesting a process of divergence, and advocate a reassessment of the current
classifications of the three endemic Mentawai monkey species.
v
ACKNOWLEDGEMENTS I would like to express my thanks to all the staff and students involved with the MSc
at Oxford Brookes University for their inspiration and enthusiasm, particularly Prof.
Simon Bearder who always has an encouraging word when you most need it, and
Clair Short for her advice on ‘hunting’ gibbon songs. Thanks to Thomas Geissmann
and the Gibbon Research Laboratory for the initial project idea and expert advice.
The project could not have been carried out without the advice of Danielle Whittaker
who was instrumental in the logistics of the research. Also, the original enthusiasm to
study gibbons was inspired by Susan Cheyne, who also provided much advice about
visas and permits. I much appreciate Noviar Andayani from Universitas Indonesia
acting as a sponsor and for L.I.P.I. for granting a research permit. My gratitude goes
to Cornell Ornithology for granting us a free licence for Raven 1.2 spectrographic
software. I would also like to thank Graham Holland for geography advice.
Thank you to all those who provided support in the field, particularly Abenk who
guided us every step of the way, taught us Bahasa Indonesian and always made sure
we were alive through his many contacts! Many thanks to Universitas Andalas who
put us in touch with Abenk and gave us an academic base in Padang, particularly Pak
Anes and Pak Tesri. I am extremely grateful to Reni from Conservation International,
and Ibu Reni, who not only provided us with a house while we stayed in Padang, but
also with invaluable advice about the Mentawais. I appreciate Koen Meyers of
UNESCO providing us with advice in Siberut. The local people who acted as our
guides and field assistants were fantastic in every aspect of forest living, so thank you
to: Riki, Albinus, Bisol, Rijal, Langot & Kacow, Badjar, Adjumar, Oggo, Bohensin,
Al and Hadi.

vi
The field sites were possible thanks to Sarrudhin for his kind allowance of the use of
his personal home stay in Sikabei, PT Minas Pagai Lumber Corporation, the Kepala
Desa of Saureinu and all who work for Siberut National Park, especially Musrizal.
Also, many thanks to Twycross Zoo, UK, who allowed us to conduct our pilot study
on their Kloss’s gibbon.
A special thanks to those who kept me sane during the tough 4 months and all through
the write-up stages: those from the Batang Arau Hotel who provided cold beer,
surfing and 3am conversations; Coldplay for providing the soundtrack to the research;
all the surf charter captains for their offers of rescues should anything go wrong, Feri
and Anton for taking us to Marrak Island, and most of all my family who always
encouraged me to follow my dreams and have never stopped believing in me.
And finally, thanks Mel, I can’t express how lucky I am that you were along for the
ride! I will never forget our shared adventures on the Sumber Rezeki.

vii
TABLE OF CONTENTS CONTENT PAGE
TITLE PAGE i
DEDICATION ii
ABSTRACT iii
ACKNOWLEDGEMENTS v
TABLE OF CONTENTS vii
LIST OF TABLES ix
LIST OF FIGURES x
1. INTRODUCTION 1-12 1.1 Background 1
1.1.1. Hylobatids 1
1.1.2. The Kloss’s Gibbon (Hylobates klossii) 1
1.1.3. Song Structure 3
1.1.4. Gibbon Phylogeny 4
1.1.5. The Mentawai Islands Monkeys 7
1.1.6. The Mentawai Islands and their Biogeography 8
1.2. Report Objectives 11
1.2.1. Aims and Hypotheses 11
1.2.2. Report Structure 12
2. METHODOLOGY 13-24 2.1. Pilot Study 13
2.2. Study Subjects 14
2.3. Study Sites 14
2.4. Methods 17
2.4.1. Field Method 17
2.4.2. Analysis 19
2.4.3. Equipment 23
3. RESULTS 25-41 3.1. Intra-Individual Diversity 25
3.1.1. Individual Discriminant Function Analysis 26
3.2. Intra-Population Diversity 29
3.3. Inter-Population Diversity 30
3.3.1. Kruskal Wallis Analysis of Variance 30
3.3.2. Population Discriminant Function Analysis 31
3.4. Intra-Island Diversity 34
3.5. Inter-Island Diversity 35
3.5.1. Kruskal Wallis Analysis of Variance 35
3.5.1. Island Discriminant Function Analysis 35
3.6. Siberut and, Sipora & South Pagai Discriminant Function Analysis 38

viii
4. DISCUSSION 42-58 4.1. Intra-Individual Diversity 42
4.2. Inter-Individual Diversity 44
4.2.1. Hypothesis (1) Trilling as a Handicap 46
4.2.2. Hypothesis (2) Neighbour-Stranger Discrimination 48
4.2.3. Hypothesis (3) Relaxed Selection 50
4.3. Inter-Population Diversity 52
4.3.1. Sikabei and Saureinu Relationship 53
4.3.2. Inter-Population differences in Intra-Population Diversity 55
4.4. Intra-Island Diversity 56
4.5. Inter-Island Diversity 58
4.6. A Siberut Group, and a Sipora & South Pagai Group 60
4.6.1. Evolutionarily Significant Units (ESUs) 60
4.6.2. Conservation Implications 63
4.7. Critique and Future Research 64
5. SUMMARY OF DISSERTATION 67
6. REFERENCES 68-79
APPENDICES 80-85 Appendix I – Global Positioning System (GPS) Waypoints of
Listening Posts 80
Appendix II – Coefficient of Variation (CV) Data 81
Appendix III – Spectrographic Data 82
Appendix IV –Means of Individuals for Spectrographic Data 85
ix
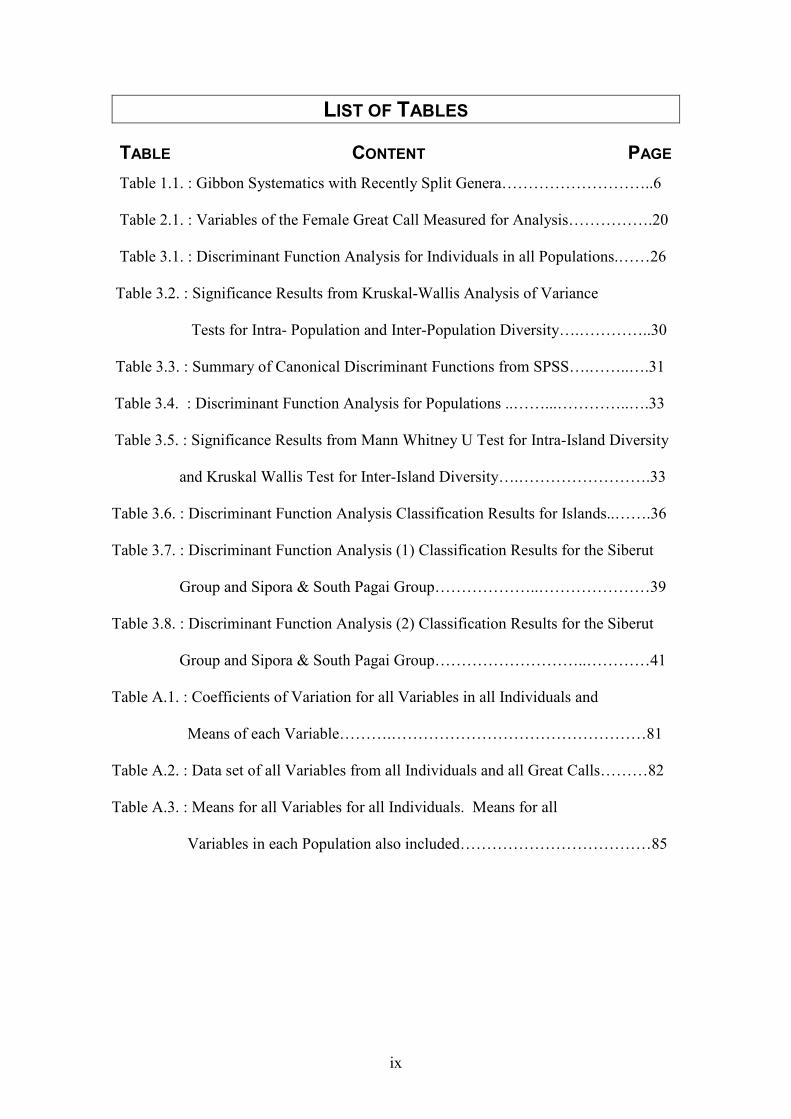
LIST OF TABLES
TABLE CONTENT PAGE Table 1.1. : Gibbon Systematics with Recently Split Genera………………………..6
Table 2.1. : Variables of the Female Great Call Measured for Analysis…………….20
Table 3.1. : Discriminant Function Analysis for Individuals in all Populations.……26
Table 3.2. : Significance Results from Kruskal-Wallis Analysis of Variance
Tests for Intra- Population and Inter-Population Diversity….…………..30
Table 3.3. : Summary of Canonical Discriminant Functions from SPSS….……..….31
Table 3.4. : Discriminant Function Analysis for Populations ..……...…………..….33
Table 3.5. : Significance Results from Mann Whitney U Test for Intra-Island Diversity
and Kruskal Wallis Test for Inter-Island Diversity….…………………….33
Table 3.6. : Discriminant Function Analysis Classification Results for Islands..…….36
Table 3.7. : Discriminant Function Analysis (1) Classification Results for the Siberut
Group and Sipora & South Pagai Group………………..…………………39
Table 3.8. : Discriminant Function Analysis (2) Classification Results for the Siberut
Group and Sipora & South Pagai Group………………………..…………41
Table A.1. : Coefficients of Variation for all Variables in all Individuals and
Means of each Variable……….…………………………………………81
Table A.2. : Data set of all Variables from all Individuals and all Great Calls………82
Table A.3. : Means for all Variables for all Individuals. Means for all
Variables in each Population also included………………………………85

x
LIST OF FIGURES FIGURE CONTENT PAGE
Fig. 1.1.: Great call phrase of female Kloss’s gibbon (Hylobates klossii).…….…....4
Fig. 1.2.: The Mentawai Islands and Indonesia (Falk, 2000)………………….….….8
Fig. 1.3.: Exposed Land Mass with Sea Levels 120m BPL
(Adapted from Voris, 2000).........................................................................9
Fig. 2.1.: Approximate Locations of Study Sites used for this Project
(Adapted from Whitten 1982c)…………………………………………...15
Fig. 2.2.: Approximate Sketch Maps of Relative Positions of Listening Posts.…….17
Fig. 3.1.: Mean Coefficients of Variation Across the Sample for all Variables….....25
Fig. 3.2.: Canonical Discriminant Function Graphs for each Population…….…….28
Fig. 3.3.: Canonical Discriminant Functions diagram using F1 and F2.…………….34
Fig. 3.4.: Canonical Discriminant Functions diagram including F1 and F2..………..37
Fig. 3.5.: Mean ‘Number of trill notes’. Populations are clustered into Siberut, and
Sipora & South Pagai…………………………………………...………....40
Fig. 3.6.: Clustered bar chart of mean ‘Trill duration’ and mean ‘Notes/second
in pre-trill’. Populations are clustered into Siberut, and Sipora
& S.Pagai…………………………………………………………………..40
Fig. 4.1.: Land Formation around the Sikabei Population
(Adapted from the TNS Management Areas Map)……………………..…54

1
1. INTRODUCTION
1.1. BACKGROUND
1.1.1. HYLOBATIDS
Hylobatids, commonly called gibbons, are monogamous, frugivorous, arboreal and
territorial apes (Brockelman, 1984; Chivers, 1977). Known as the ‘Lesser Apes’, the
amount of scientific and media interest attracted is very small in relation to the ‘Great
Apes’. Gibbon conservation, taxonomy and general behavioural ecology has thus
been overshadowed by their more easily accessible counterparts. Gibbon species
include the most threatened primates in the world, with the Hainan black crested
gibbon being placed in the top 25 endangered primates in the world (Mittermeier et
al., 2005). All gibbon species are listed under Appendix 1 of the Convention on
International Trade in Endangered Species (CITES, 2005) and all are near threatened,
vulnerable, endangered or critically endangered on the World Conservation Union
(IUCN) Redlist (IUCN, 2005).
1.1.2. THE KLOSS’S GIBBON (Hylobates klossii)
The Kloss’s gibbon (Hylobates klossii) is endemic to the Mentawai Islands of
Indonesia and is sexually monomorphic, black in colour and the smallest of all gibbon
species (Geissmann, 1993). IUCN (2005) class the species as Vulnerable, primarily
due to hunting and habitat destruction caused by humans (Tenaza & Tilson, 1985).
However, the data the IUCN classification is based on is out-dated and recent data
recommends the species be elevated to ‘Endangered’ status (Whittaker, 2005).
Kloss’s gibbons typically have a home range of 5-8 hectares (Tenaza, 1975) and use

2
set arboreal routes to travel around their range, utilising the upper canopy for singing
and sleeping, and the middle canopy for feeding and travelling (Whitten, 1982b).
Sleeping trees are 35-55m tall, 0.5-1.5m wide and liana-free, and are usually situated
towards the centre of the gibbon territory (Tenaza & Tilson, 1985). In contrast,
langurs (Presbytis potenziani) use sleeping trees on the periphery of a gibbon’s
territory, implying interspecific competition (Tilson & Tenaza, 1982). In comparison
to other Hylobates species, Kloss’s gibbons eat a high percentage of insects and low
percentage of leaves within their diet (Whitten, 1982b). The reason for this is
unknown but may be linked to chemical defences within leaves in the Mentawai
Islands. Kloss’s gibbons also spend more time resting than other gibbon species, and
this may be linked to neutralising chemical defences in the small amount of foliage
they do consume.
The Kloss’s gibbon song is unusual for hylobatids because the male and female do not
duet – the male sings pre-dawn and the female sings post-dawn (Haimoff & Tilson,
1985). The only other hylobatid to not duet is the Javan gibbon (Hylobates moloch).
It is postulated the function of the male song of the Kloss’s gibbon is to attract mates
and that it conforms to ‘Zahavi’s Handicap Principle’ because males spend a greater
time singing than females and the song exposes the male gibbon to dangers and
therefore indicates fitness (Whitten, 1984b; Geissmann et al., in press). Duet-splitting
is the term for the process by which solo songs have emerged in both Kloss’s gibbons
and their sister taxon, Javan gibbons, and is thought to be a derived characteristic
(Geissmann, 2002).
Morphological features can also be labelled primitive or derived. The absence of a
3
face ring or brow band in Kloss’s gibbons was originally thought to be a primitive
feature because it is a simple monochromatic form, but it has recently also been
labelled a derived feature after captive studies with Siamangs (Symphalangus
syndactylus), which are also black (Geissmann, 2003).
In light of this evidence, Kloss’s gibbons are not the most primitive gibbon species as
once thought, but are a more recently diverged species. However, trilling, exhibited
within the song of Kloss’s gibbons, is a primitive characteristic (Dallman &
Geissmann, 2001b). This characteristic may have remained unchanged simply
because there has been no selection pressure for it to change. The duet-splitting of
Kloss’s gibbons and Javan gibbons is thought to be due to relaxed selection because
these species do not live alongside other gibbon species (sympatry) and therefore
there is a reduced need to prevent interspecies breeding (Geissmann, 2002)
Research of Kloss’s gibbons and understanding of the species is limited. Published
papers specifically researching Kloss’s gibbon song number only three (Haimoff &
Wilson, 1985; Whitten, 1984; Whitten, 1981) and all focus on the island of Siberut,
and until this work and a recent PhD project (Whittaker, 2005), the Kloss’s gibbon
had not been studied since the 1980s.
1.1.3. SONG STRUCTURE
The terminology used to describe gibbon song in this work follows that used in
previous studies of gibbon song for consistency (Short, 2005; Konrad & Geissmann,
2004, unpub.; Dallmann & Geissmann, 2001a,b; Haimoff & Gittins 1985; Haimoff &
Tilson, 1985). The song structure of the Kloss’s gibbon consists of single frequency
4
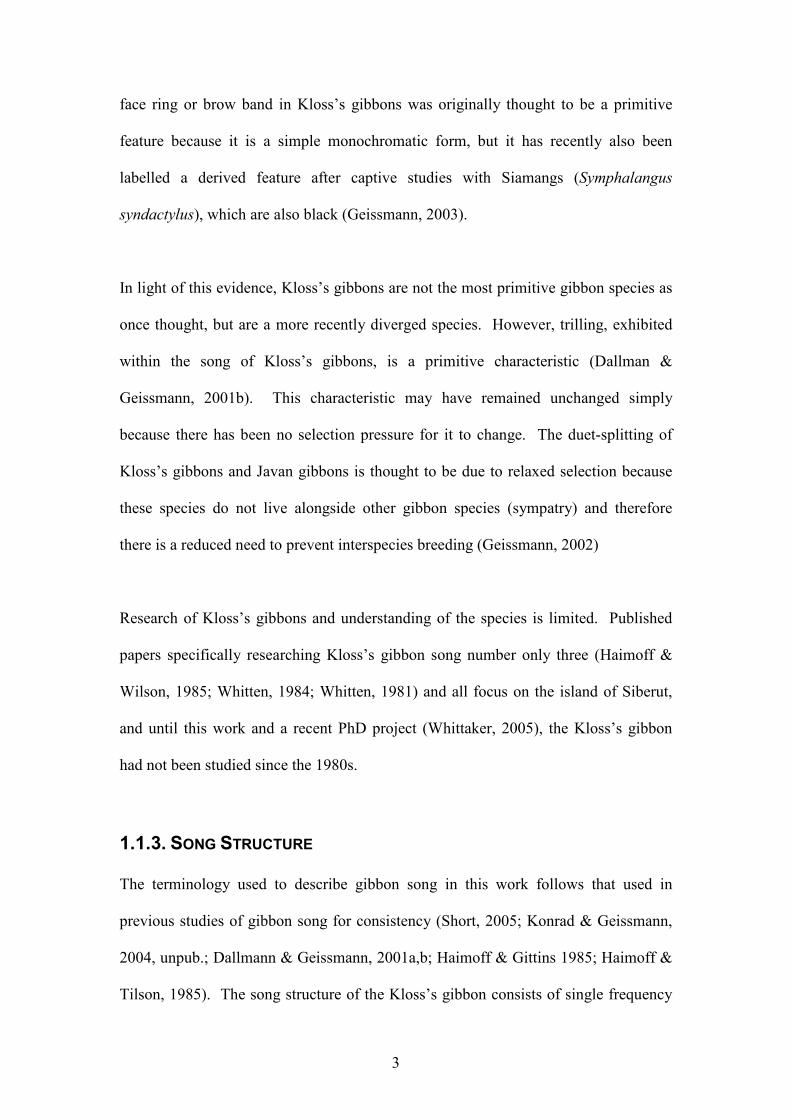
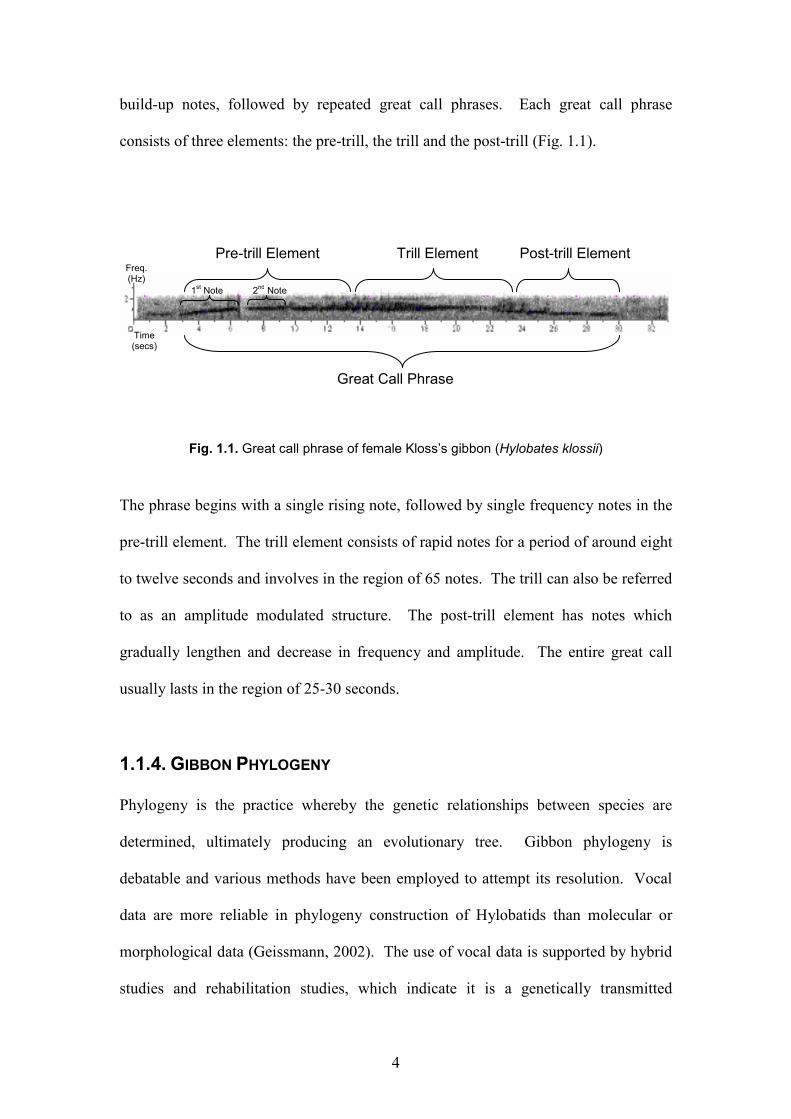
build-up notes, followed by repeated great call phrases. Each great call phrase
consists of three elements: the pre-trill, the trill and the post-trill (Fig. 1.1).
Fig. 1.1. Great call phrase of female Kloss’s gibbon (Hylobates klossii)
The phrase begins with a single rising note, followed by single frequency notes in the
pre-trill element. The trill element consists of rapid notes for a period of around eight
to twelve seconds and involves in the region of 65 notes. The trill can also be referred
to as an amplitude modulated structure. The post-trill element has notes which
gradually lengthen and decrease in frequency and amplitude. The entire great call
usually lasts in the region of 25-30 seconds.
1.1.4. GIBBON PHYLOGENY
Phylogeny is the practice whereby the genetic relationships between species are
determined, ultimately producing an evolutionary tree. Gibbon phylogeny is
debatable and various methods have been employed to attempt its resolution. Vocal
data are more reliable in phylogeny construction of Hylobatids than molecular or
morphological data (Geissmann, 2002). The use of vocal data is supported by hybrid
studies and rehabilitation studies, which indicate it is a genetically transmitted
Trill Element Pre-trill Element Post-trill Element
Great Call Phrase
1st Note 2
nd Note
Freq. (Hz)
Time (secs)

5
characteristic (Cheyne & Brule, 2002; Geissmann, 1984; Tenaza, 1984). Thus vocal
data provides information about population and species differences on a genetic level,
and this is exemplified because gibbon species can be distinguished by species-
specific vocalisations (Geissmann, 1993; Mitani, 1987).
The function of gibbon song is proposed to be the advertisement and defence of
territory/mates and pair bond reinforcement (Ahsan, 2001; Cowlishaw, 1992;
Brockelman, 1984; Gittins, 1984; Marshall & Marshall, 1976) therefore a species-
specific song is desirable. Geissmann (1993) initiated the exploitation of these
species-specific songs for taxonomic determination of a given population of gibbons.
The use of vocalisation as a diagnostic tool for taxonomy has been pioneered with
relation to gibbons by Geissmann (1993) and the Gibbon Research Laboratory.
Individual song variability within gibbon species has been researched (Geissmann et
al., in press; Dallmann & Geissmann, 2001a, 2001b; Haimoff & Gittins, 1985;
Haimoff & Tilson, 1985), however, there is as yet no published study utilising gibbon
song as a diagnostic tool for identification of Evolutionarily Significant Units (ESUs).
ESUs are used to define management units within a species and operate at the genetic
level (Frankham et al., 2004), but can be adapted to gibbon vocalisations because of
the genetic basis. ESUs are defined as unique groups within a species due to the
genetic composition of that group. ESUs are often used in conservation to guide
management strategies because they allow unique groups of animals or plants to be
identified and managed in light of this knowledge of uniqueness (Alpers et al., 2004;
Holder et al., 2004; Daugherty, 1990). Gibbon song has recently been used to
investigate species boundaries in crested gibbons (Konrad & Geissmann, in press).

6
Galagos have been successfully split into species with call variability as a key
characteristic (Ambrose & Bearder, 1998; Bearder et al., 1996; Bearder, 1995;
Courtenay & Bearder, 1989).
Chromosome number can be used as a defining feature of a genus or species.
Gibbons have recently been divided into four genera, elevated from subgenera, to
reflect the chromosome number inherent within certain groups (Roos & Geissmann,
2001). These genera are as follows: Hylobatidae, Bunopithecus, Nomascus and
Symphalangus (Table 1.1).
Table 1.1. Gibbon Systematics with Recently Split Genera (Geissmann, 2005)
Genus Diploid
number of
chromosomes
Other division
names
Species
Hylobates 44 Lar group H. agilis
H. klossii
H. lar
H. moloch
H. muelleri
H. pileatus
Bunopithecus 38 B. hoolock
Nomascus 52 Concolor
group, crested
gibbons
N. concolor
N. sp. cf.
nasutus
N. gabriellae
N. leucogenys
Symphalangus 50 S. syndactylus
Subspecies exist for some species of hylobatid, however, the determination of the
subspecies is often not straightforward. For example, H. agilis agilis and H. a. unko
are only differentiated by a variation in the ratio of pale and dark pelage colour
morphs (Brandon-Jones et al., 2004), which is clearly unreliable. Andayani et al.

7
(2001) named the Javan gibbon as two subspecies by the use of molecular data but the
samples of individuals were small and the nature of molecular data means only small
parts of the genome are examined, although, it is likely the Javan gibbon exhibits two
subspecies due to the habitat fragmentation on Java. Whittaker et al. (2004) used
molecular data to look at Kloss’s gibbon population differences and found no
significant difference between populations, however, the same limitations as just
discussed apply to this study.
Vocal data allow a much more holistic and less invasive method of examining the
relationship of gibbon populations, whilst remaining genetic in origin. Therefore,
investigation of Kloss’s gibbon vocal diversity yields information about the
phylogeography of the species i.e. the relationship between genetics and geography.
1.1.5. THE MENTAWAI ISLAND MONKEYS
An indication that differences are present in the endemic primates on the different
islands in the chain comes from studies on the other three Mentawai Island primates,
the Mentawai monkeys. The Mentawai Island macaque was recently split into two
species following genetic analysis of populations on different Mentawai islands (Roos
et al., 2003). The snub-nosed pig-tailed langur (Simias concolor) exists throughout
the Mentawai Islands and has been classified as two subspecies, Simias concolor
concolor and Simias concolor siberu (Chasen & Kloss, 1927), one of which occurs on
Sipora and the Pagais, and one which occurs on Siberut. The species is in the top 25
endangered primates in the world (Mittermeier et al., 2005). The Mentawai langur
(Presbytis potenziani) has also been classified as two subspecies, Presbytis potenziani
potenziani and Presbytis potenziani siberu, (Chasen & Kloss, 1927) with the same

8
pattern of geographic occurrence as the Mentawai langur.
1.1.6. THE MENTAWAI ISLANDS AND THEIR BIOGEOGRAPHY
The Mentawai Islands are an island chain 85-135km off the coast of West Sumatra,
Indonesia in the Indian Ocean (Whitten, 1982) (Fig. 1.2). The chain consists of four
islands: Siberut, Sipora, North Pagai and South Pagai. The islands and have
vegetation consisting primarily of tropical and subtropical moist broadleaf forest of
the Dipterocarpaceae family (WWF, 2005), and a mountainous terrain. In order to
understand the population relationships of a species, the general biogeography of an
area must be discussed because of the effects of isolation. The Mentawai Islands exist
as part of the Sunda Shelf, an area with highly unique geological features. The
tectonics of the region led to a number of islands forming along the West coast of
Sumatra, including the Mentawais. Sundaland is currently a focus of biodiversity
interest at Conservation International (CI) (CI Padang, pers. comm.) and has been
deemed a biodiversity hotspot (Myers et al., 2000).
Fig. 1.2. The Mentawai Islands and Indonesia (Falk, 2000)

9
Due to a subduction zone between two tectonic plates, a 1000m deep trench exists
between the Mentawai Islands and Sumatra (Moore et al., 1980). This has served to
isolate them from the rest of the Sunda Shelf even during substantial drops in sea level
(Baroux et al., 1998). The isolation has been complete for at least 500,000 years
because it has been this long since sea levels were 200m below present levels (BPL),
and although the 1000m trench was still submerged, land surrounding the trench is at
a depth of 200m and land bridges may have formed in these exposed areas,
connecting the Mentawais indirectly to the Sunda Shelf (Batchelor, 1979). Prolonged
isolation has meant that a large proportion of the islands flora and fauna is endemic
(39% mammal species: WWF, 2001). The map illustrates sea levels at 120m BPL
and the Mentawai Islands remain separate from the rest of the Sunda shelf (Fig. 1.3).
Fig. 1.3. Exposed Land Mass with Sea Levels 120m BPL (Adapted from Voris, 2000)
The Mentawais are thought to have remained forested during the last glacial
maximum (LGM) and subsequently contain mainly forest-dependent species

10
(Meijaard, 2003). The land connecting the islands to Sumatra at periods of low sea
level may have contained more open habitat (for example, savanna), therefore
providing a barrier to dispersal even during connection events, and serving to further
increase the isolation of the Mentawai Islands.
The islands used for field sites in this study are Siberut, Sipora and South Pagai.
Siberut is the northernmost of the four Mentawai Islands and is 4,030 km² with an
estimated population of 25,000 people and 68,000 non-human primates in 1995
(Fuentes, 1996/1997). It is likely the non-human primate figure has decreased with a
corresponding increase in humans.
Sipora contains the provincial capital of the Mentawai Islands and thus has a
relatively large population, despite it being the smallest of the four islands, with a
total area of 845km² (Fuentes, 1996/1997). South Pagai Island is the southernmost
island and is 900km². The island was only colonised by humans in the last 300 years
(Fuentes, 1996/1997) along with North Pagai, however, it is these two most recent
observers of human activity that have witnessed the greatest amount of human related
destruction, with primary forest on North Pagai no longer existent due to logging (PT
Minas, pers. comm.). It is for this reason no research was conducted on North Pagai.

11
1.2. REPORT OBJECTIVES
1.2.1. AIMS AND HYPOTHESES
The study aims to assess the diversity of vocalisations produced by the Kloss’s gibbon
(Hylobates klossii), the ape endemic to the Mentawai Islands, Indonesia. The study
will determine whether there is significant vocal diversity of female Kloss’s gibbons
within the island chain at the individual, population, island and a Siberut and Sipora &
South Pagai group’s level. Previous studies have assessed geographic variation in
vocalisations in primates (Gamba & Giacoma, 2001; Mitani et al., 1999, 1992;
Fischer et al., 1998; Ambrose & Bearder, 1998; Arcadi, 1996). The aim will be
achieved by recording the gibbons’ songs using a modified point census technique
and analysing the great calls of the song using spectrographic methods. The overall
hypothesis for this study is that the vocal diversity of female Kloss’s gibbons will not
be significant. This is broken down into six smaller hypotheses:
(1) There is no significant intra-individual diversity in female Kloss’s gibbons.
(2) There is no significant inter-individual diversity in female Kloss’s gibbons.
and therefore, is no potential for individual recognition by conspecifics.
(3) There is no significant inter-population diversity in female Kloss’s gibbons.
(4) There is no significant intra-island diversity in female Kloss’s gibbons on
Siberut island.
(5) There is no significant inter-island diversity in female Kloss’s gibbons and
therefore no divergence has occurred between the islands.
(6) There is no significant diversity between a Siberut group and a Sipora &
South Pagai group and therefore, the Kloss’s gibbon species is not significantly
diverse enough to consist of Evolutionary Significant Units (ESUs).

12
1.2.2. REPORT STRUCTURE
The methodology describes how fieldwork was undertaken and data obtained.
Spectrographic methods and statistical methods are explained and justified. The
results section details the diversity within each of the following groups: Intra-
individual, inter-individual, inter-population, intra-island, inter-island, and Siberut
group and Sipora & South Pagai group. Non-parametric tests and discriminant
function analysis is used where appropriate.
The discussion offers explanations of the results in the same format as the results
section by discussing each group separately. Environmental fluctuations, age, and
individual recognition are discussed in relation to individuals. Population differences
focus on local habitat and how these differ, in addition to attempting to explain
unexpected results by a tentative hypothesis. Island diversity focuses on the quality of
results in this section. The Siberut, and Sipora & South Pagai section discusses the
possibility of ESUs within the Kloss’s gibbon species, and the impact this has on
existing classifications of the Mentawai monkeys. A critique of this work highlights
limitations of the project, and possibilities for future research are suggested, before a
succinct summary section.
13
2. METHODOLOGY
2.1. PILOT STUDY
Prior to the project, four days was spent at Twycross Zoo, Leicester, UK. Twycross
Zoo is the only institution outside of South-East Asia to hold a Kloss’s gibbon in its
collection and the individual is a lone adult male. The researcher observed the gibbon
for four mornings between the 16th and 19
th of January 2005 and made ad libitum
recordings of its behaviour. Any vocalisations were recorded in the way detailed in
the main project methods and using the same equipment. Equipment use was also
practised on other gibbon species within Twycross Zoo. The aim of this pilot study
was to provide a familiarity with the study species and the recording equipment and to
identify any possible problems before departing for Indonesia.
The pilot study was successful and on completion the researcher was familiar with the
equipment needed to record gibbon vocalisation, and of the protocols required
(Section 2.4.1). The Kloss’s gibbon sang once but the song was not a full song, likely
due to his age and that he was housed alone. The timing of the singing was later than
anticipated by wild studies at 11:25am and I would suggest that this is because at this
time, gibbons in the surrounding enclosures ceased singing. This therefore supports
the fact that Kloss’s gibbons sing alone. However, the gibbon may have sung before
the zoo was opened, at the time expected for a male of the species, and the song
recorded could be an example of the post-dawn song (Haimoff & Tilson, 1985).
14
2.2 STUDY SUBJECTS
The study subjects were the populations at the sites detailed in the following section.
The populations were wild-living Kloss’s gibbons (Hylobates klossii) on the islands
of Siberut, Sipora and South Pagai. Demographic information for the study subjects
and populations is unavailable; however, the sample is assumed to be representative
due to the methods employed to obtain recordings. A total of 24 females were
recorded to a sufficient quality allowing analysis in the following breakdown:
Simabuggai 7, Sikabei 7, South Pagai 5, and Saureinu 5. A total of 137 great calls
were of sufficient quality to be analysed (average 5.7 per female).
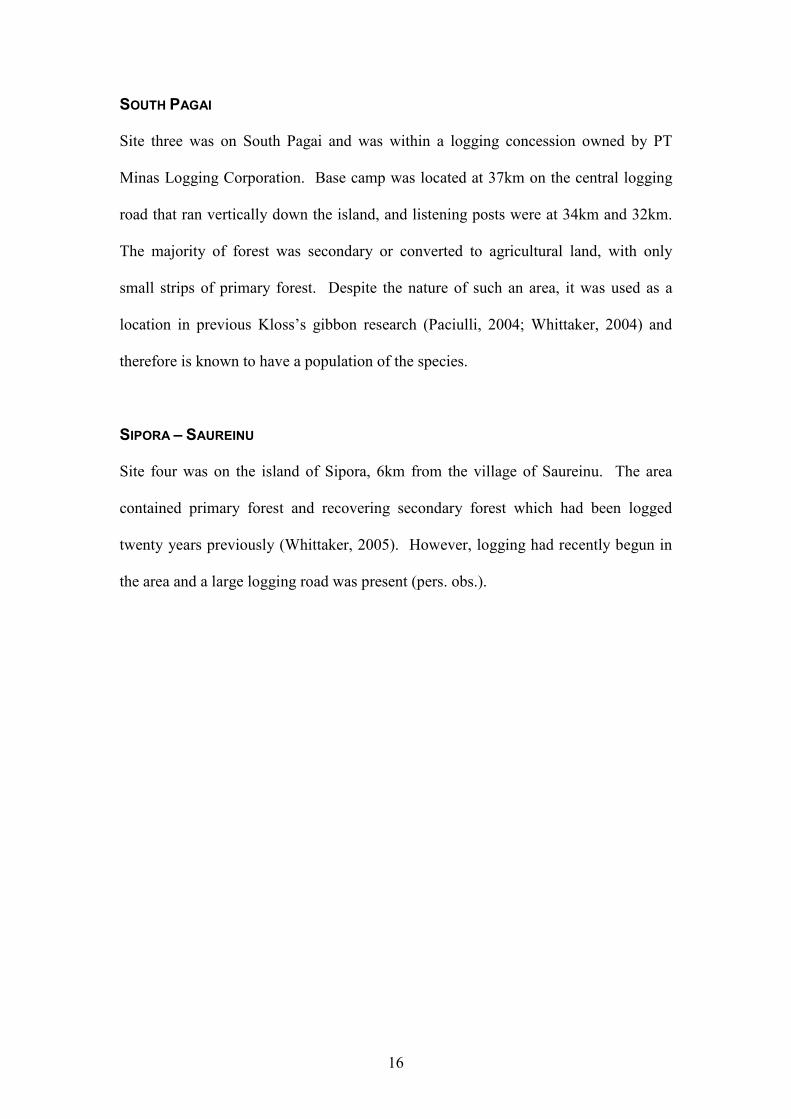
2.3 STUDY SITES
Songs were recorded from four sites as detailed below. Sites were chosen on the basis
of recommendation from previous researchers or were ad lib. The four sites covered a
wide range of the Mentawai Island chain (Fig. 2.1). There were three to six listening
posts per study site (Fig. 2.2). GPS waypoints can be found in Appendix 1 for each
study site and its listening posts.

15
Fig. 2.1. Approximate Locations of Study Sites used for this Project (Adapted from Whitten 1982c)
CENTRAL SIBERUT – SIMABUGGAI
Site one was located within the traditional use zone of Siberut National Park (TNS).
The area is primary dipterocarp forest with some secondary forest. Siberut National
Park is a protected area located on the Western side of Siberut and covers an area of
192,660 hectares (Whittaker, unpub.).
SOUTH SIBERUT – SIKABEI
Site two was on the coast in South Siberut. Mangrove forest bordered the coast and
gave way to primary dipterocarp forest further inland. No listening posts were located
in the mangrove forest because gibbons do not inhabit this forest type. Some
secondary forest was recovering from a small amount of logging activity by the local
people.
16
SOUTH PAGAI
Site three was on South Pagai and was within a logging concession owned by PT
Minas Logging Corporation. Base camp was located at 37km on the central logging
road that ran vertically down the island, and listening posts were at 34km and 32km.
The majority of forest was secondary or converted to agricultural land, with only
small strips of primary forest. Despite the nature of such an area, it was used as a
location in previous Kloss’s gibbon research (Paciulli, 2004; Whittaker, 2004) and
therefore is known to have a population of the species.
SIPORA – SAUREINU
Site four was on the island of Sipora, 6km from the village of Saureinu. The area
contained primary forest and recovering secondary forest which had been logged
twenty years previously (Whittaker, 2005). However, logging had recently begun in
the area and a large logging road was present (pers. obs.).
17
Fig. 2.2. Approximate Sketch Maps of Relative Positions of Listening Posts.
2.4 METHODS
2.4.1 FIELD METHOD
Ten to twelve days were spent recording at each of the four sites because the female
Kloss’s gibbon sings every three to four days on average (Whitten, 1981). In addition
to recording female vocalisations, male Kloss’s gibbon vocalisations were recorded
for a complementary study.
In each location the researcher applied a modified point census technique to obtain
recordings of Kloss’s gibbon song. The modification was necessary due to three
18
criteria that must be met. First, the terrain consists of steep ridges, large rivers and
impenetrable forest so the point cannot be random due to inaccessibility to many
areas. Second, gibbon calls can be heard and recorded well from high ridges with
little obstructions which are within a ‘sound window’ and therefore these points were
desirable for listening posts (Whitten, 1981). Thirdly, the distance between each point
was necessarily at least 800m because although gibbon song carries over 800-1000m
(Whittaker, pers. comm.), the song is only recordable to sufficient quality at an
estimated distance of 400m maximum. Therefore this minimised the possibility of
recording the same gibbon twice without realising. Any calls that were recorded with
the possibility of duplicates resulting from recording from two different listening post
at the same time, did not use the recordings from one of the listening posts. The
necessity of meeting these criteria therefore means the technique was not random and
was modified to accommodate such requirements.
Where possible, existing trails used by the local people were exploited to reach
listening posts. This was to allow maximum time for recording, as oppose to trail-
making, and to minimise destructive practices on the forest. Listening points were
recorded by a global positioning system (GPS) to enable a complete record and to
allow navigation. A minimum of five individual females per location was recorded to
gain a suitable sample size for statistical analysis.
The researcher reached the point/listening post at 03:30 each morning because male
Kloss’s gibbons sing pre-dawn (~5:00) and female Kloss’s gibbons begin to sing at
sunrise (~06:30) (Whittaker, pers. comm.). At the start of gibbon calls the researcher
vocally recorded the date, start time, end time, location and researcher on the tape. In

19
addition, the researcher recorded the same information by hand in a notebook, plus
direction, estimated distance, GPS waypoint and individual (if known), with room for
supplementary information. Individuals could be identified because the same
positions were used for singing from at each occasion and thus direction and distance
would determine which individual was being recorded (pers. obs.).
2.4.2 ANALYSIS
SPECTROGRAPHIC ANALYSIS
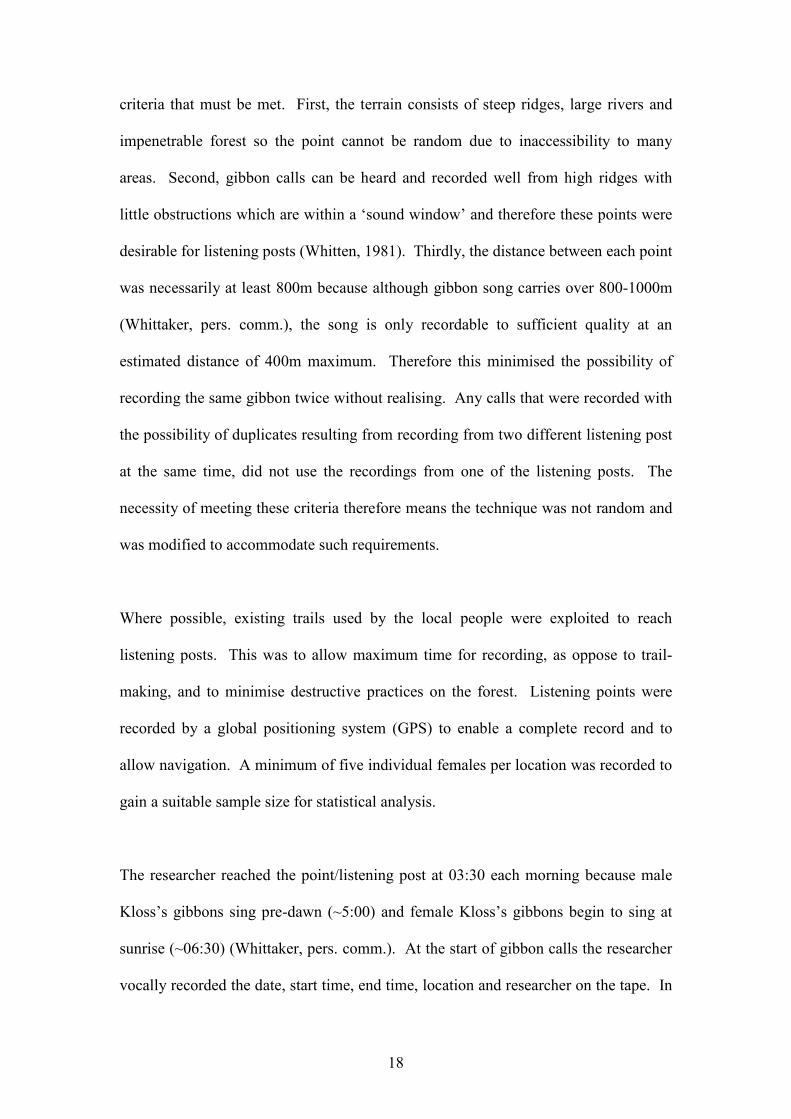
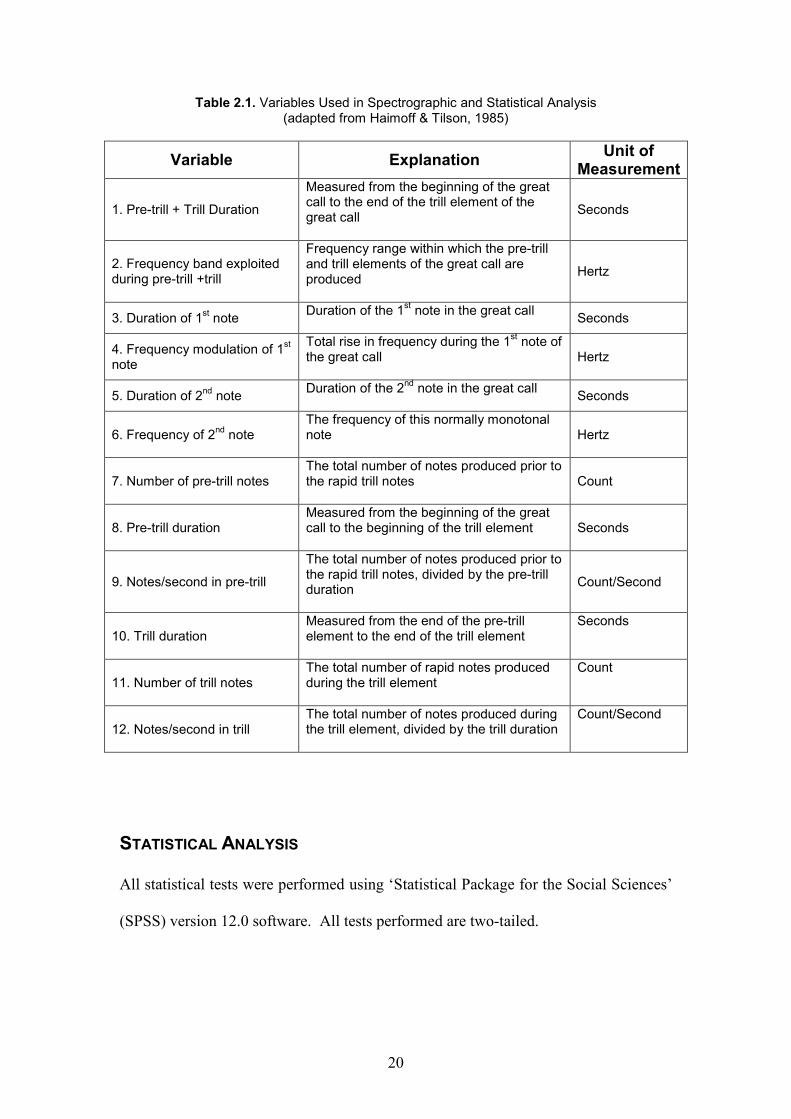
The recordings were placed onto the spectrographic analysis software ‘Raven 1.2’
software and a set of predetermined variables was measured/counted (Table 2.1).
Great call samples were digitised from tape-recordings with a 16 bit sampling size and
44.1 kHz sampling rate. The variables focus on the female great call because it is a
highly stereotyped phrase within female gibbon song. It is unique to each species and
therefore, population differences are most easily observable within the great call.
Each great call phrase has three elements: pre-trill, trill and post-trill (Fig. 1.1). Only
pre-trill and trill elements were analysed because post-trill elements were not of
sufficient quality. Post-trill sections tend to reduce dramatically in amplitude and
therefore are difficult to record (pers. obs.). Dallman and Geissmann (2001b) point
out that if the post-trill element becomes inaudible at a short distance, then it is likely
it is not used by individuals of the species to communicate with conspecifics. In light
of this information, removing the post-trill elements from the analysis should not have
a great effect on diversity. The female Kloss’s gibbon sang no other phrase apart
from single notes as build-up to the great call, great call fragments and the great call
itself. Great call fragments result from a female aborting the phrase and these
fragments are therefore not included in the analysis.
20
Table 2.1. Variables Used in Spectrographic and Statistical Analysis (adapted from Haimoff & Tilson, 1985)
Variable Explanation Unit of
Measurement
1. Pre-trill + Trill Duration
Measured from the beginning of the great call to the end of the trill element of the great call
Seconds
2. Frequency band exploited during pre-trill +trill
Frequency range within which the pre-trill and trill elements of the great call are produced
Hertz
3. Duration of 1st note
Duration of the 1st note in the great call
Seconds
4. Frequency modulation of 1st
note
Total rise in frequency during the 1st note of
the great call
Hertz
5. Duration of 2nd note
Duration of the 2nd note in the great call
Seconds
6. Frequency of 2nd note
The frequency of this normally monotonal note
Hertz
7. Number of pre-trill notes The total number of notes produced prior to the rapid trill notes
Count
8. Pre-trill duration Measured from the beginning of the great call to the beginning of the trill element
Seconds
9. Notes/second in pre-trill
The total number of notes produced prior to the rapid trill notes, divided by the pre-trill duration
Count/Second
10. Trill duration Measured from the end of the pre-trill element to the end of the trill element
Seconds
11. Number of trill notes The total number of rapid notes produced during the trill element
Count
12. Notes/second in trill The total number of notes produced during the trill element, divided by the trill duration
Count/Second
STATISTICAL ANALYSIS
All statistical tests were performed using ‘Statistical Package for the Social Sciences’
(SPSS) version 12.0 software. All tests performed are two-tailed.
21
INTRA-INDIVIDUAL ANALYSIS
Intra-individual diversity was analysed using the coefficient of variation (CV), and
then each variable was judged to be consistent within females subjectively because of
an unawareness of any objective tests available (CV=standard deviation/mean). CV
was necessary because standard deviation alone did not give sufficient information
due to some variables using a different measurement and/or the variables have very
different values. For example, frequency is a much higher value than trill duration,
and therefore comparing the standard deviations of these two variables is of no use.
KRUSKAL-WALLIS AND MANN WHITNEY U
Kruskal-Wallis one-way analysis of variance comparing medians was the test used to
determine if a significant level of variance existed between individuals within the
same population (intra-population), the diversity between the populations (inter-
population), and the diversity between islands (inter-island). The test was used
because both of the groups contained multiple independent samples data which
required non-parametric analysis due to small sample size. Intra-population variation
was tested using all the great calls which had been analysed spectrographically. Mann
Whitney U analysis of variance comparing medians was used to determine if a
significant level of variance existed between the two populations within Siberut (intra-
island). The test was used here because there were two samples of unrelated data that
required non-parametric testing due to small sample sizes.
Inter-population, intra-island and inter-island variance was tested using the means of
great calls for all individuals, to prevent the data being skewed by some individuals
being overrepresented or underrepresented in the data due to sample size differences

22
of great calls. Significance for both Kruskal-Wallis and Mann Whitney U tests was
determined at an alpha level of 5%, meaning there is only a 5% probability the results
are caused by chance.
DISCRIMINANT FUNCTION ANALYSIS
I performed stepwise discriminant function analysis to determine whether individuals,
populations and islands could be classified on the basis of statistically determined
functions (Konrad & Geissmann, in press). The functions signify combinations of
variables that between them represent as much of the data as possible, and is a way of
streamlining multivariate data. Variables were selected using Wilks’ λ which
determines the variation between samples (i.e. populations or islands). A function
selected by the discriminant function analysis will be a particular variable or
combination of variables that represents other variables in addition to itself due to
linear correlations. Variables were accepted or rejected from the model by a
probability of F (accepted=0.5, rejected=0.10) which was used to show the alteration
caused to the model when a variable was entered or removed. Prior probabilities to
each group were adjusted based on the sample size in each group using the ‘compute
from group size’ function on SPSS.
Classification tables showed whether individuals had a correct or incorrect predicted
assignment to their population using the discriminatory functions and were cross
validated using the leave-one-out method, which gives a more conservative estimate
of correct predicted assignment. Cross validated classifications are the classifications
referred to throughout this work unless otherwise stated. A Cohen’s κ test was then
performed to see whether inter-rater reliability was significant. Inter-rater reliability

23
is the extent to which the predicted assignments (predicted by the discriminant
function analysis) agree with the actual assignments, accounting for how chance alone
would assign individuals. The probability of individuals being assigned by chance is
provided by the prior probabilities calculated by SPSS. A higher κ value is indicative
of greater inter-rater reliability. Canonical discriminant function graphs are used to
visually illustrate function relationships between groups. The graphs use ‘centroids’
to show the centre point in the functions for a group as a whole, and great calls or
individuals within that group are clustered around the relevant centroid.
Discriminant function analysis for individuals was conducted separately for each
population. The reason for this is because, for individual recognition to be possible,
individuals only need to be different from other individuals within their population.
The addition of a discriminant function analysis that attempts to classify Siberut
individuals in one group and Sipora & South Pagai into another group is included in
the results section and needs explanation of its inclusion because the reason is not
obvious. The discriminant function analysis is attempting to answer the final
hypothesis in the aim (Section 1.2.1.), and to determine if the Kloss’s gibbon species
consists of ESUs, one on Siberut and one on the other islands. If a division in the
species exists, it is likely it will be in this pattern because of the subspecies and
species divisions of the Mentawai monkeys.
2.4.3 EQUIPMENT
The study used a Sony TCM-450DV cassette-corder and a Sennheiser ME66 Short
Gun Microphone to record the Kloss’s gibbon vocalisations. This equipment has been
24
used in similar experiments in the past (Whittaker, 2005; Paciulli, 2004; Whittaker et
al., 2004) with H. klossii. GPS points were taken using a Garmin eTrex Venture GPS
system.

25
3. RESULTS
Full data can be found in Appendix II (Coefficients of Variation), Appendix III (All
data from spectrograms) and Appendix IV (Means of all variables for each individual
and population).
3.1. INTRA-INDIVIDUAL DIVERSITY
Coefficients of Variation (CV) were determined for each variable within each
individual. The value of CV ranged from 0% to 56.3%. The highest value (56.3%)
was within a female that had unusually high CV values for all variables. Means of
CVs for all variables were calculated to determine the diversity within individuals
across the whole sample (Fig. 3.1).
Fig. 3.1. Mean Coefficients of Variation Across the Sample for all Variables

26
Variable 6 (‘Frequency of 2nd note’) was the most consistent variable with a mean CV
of 3.28%. ‘Duration of pre-trill + trill’ and all variables concerned with the trill
element had a mean that indicated consistency. Although the other variables are less
consistent, all have a mean CV of 18.3% or less, illustrating intra-individual diversity
is fairly low.
3.1.1. INDIVIDUAL DISCRIMINANT FUNCTION ANALYSIS
Discriminant function analysis conducted with females and their great calls has shown
great variation between the populations in both intra- and inter-individual diversity.
Each population was analysed separately for reasons explained in the methods
(Section 2.4.2.). Functions chosen in discriminant function analysis for each
population vary.
Table 3.1. Discriminant Function Analysis for Individuals in all Populations
Population % Correct Assignments
(Original Classification) % Correct Assignments
(Cross-Validated Classification)
Cohen’s κ Value
Significance of Cohen’s κ
Simabuggai 75.7 56.8 0.485 p<0.001
Sikabei 97.5 62.5 0.554 P<0.001
S.Pagai 56.5 47.8 0.313 P<0.005
Saureinu 97.3 81.1 0.757 P<0.001
The results show how well a great call can be assigned to the female who emitted it
(Table 3.1). Clearly, Saureinu has females which are either very consistent within
their own great calls and/or very diverse individuals because cross validated
classification shows a correct assignment rate of 81.1%, which is high. South Pagai
has the lowest correct assignment rate in both original and cross-validated
classifications with 56.5% and 47.8% respectively. Sikabei shows high original
correct assignment (97.5%) but this is reduced to just 62.5% on cross-validation.

27
Simabuggai is similar to Sikabei in that both populations show an intermediate level
of correct classification compared to the other two populations.
Cohen’s κ shows the inter-rater reliability, with a higher value indicating a higher
reliability. The two Siberut populations have intermediate but significant values
(Simabuggai: p<0.001, κ = 0.485; Sikabei: p<0.001, κ = 0.554) showing great calls
can be classified correctly using the discriminant function analysis significantly more
than would be expected by chance. South Pagai has a much lower value (p<0.005, κ
= 0.313) meaning great calls could not be classified very well to the correct
individuals but still significantly more than would be expected by chance. Saureinu
has a rate of correct assignment that suggests great calls will be assigned to the correct
female very consistently (p<0.001, κ = 0.757).
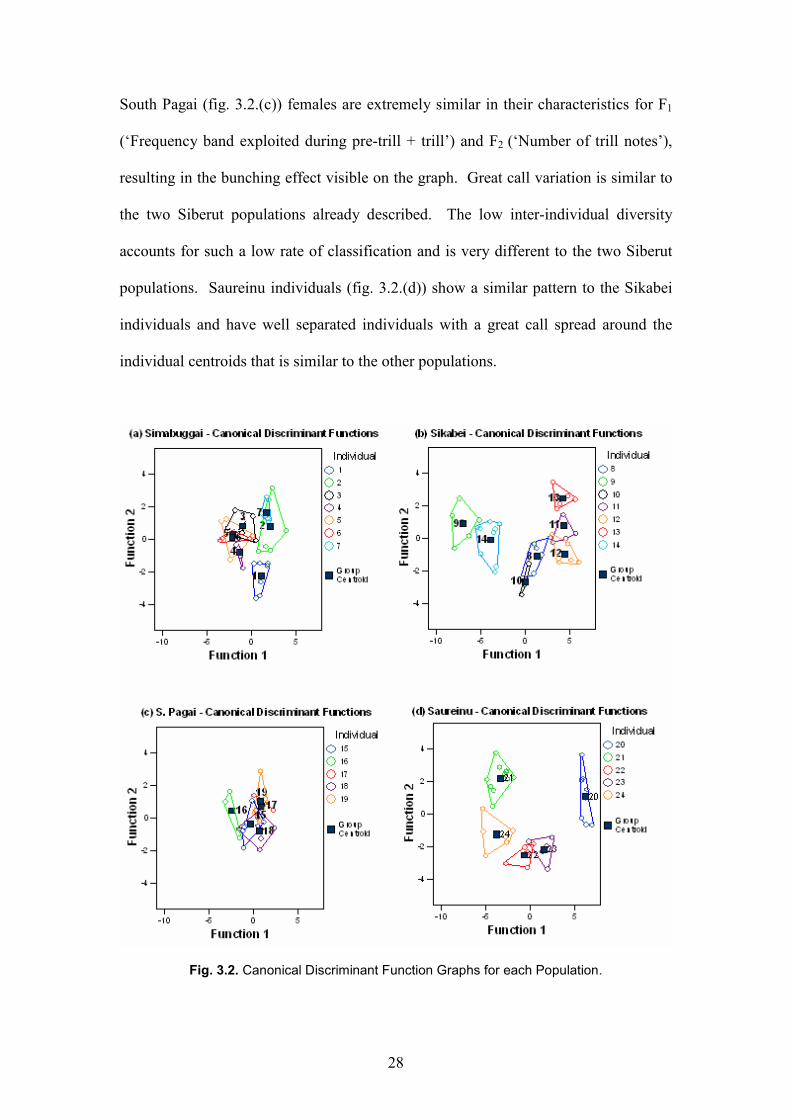
The canonical discriminant functions graphs (fig. 3.2) allow further information to be
gained from the discriminant function analysis. Simabuggai individuals (fig. 3.2.(a))
are close together (inter-individual) and great calls of each individual are relatively
spread out from the individual centroids (intra-individual). The discriminant function
analysis classification is thus resulting from a combination of well spread great calls
and close together individuals. Sikabei individuals (fig. 3.2.(b)) are markedly further
apart than the Simabuggai individuals and have a similar degree of spread of great
calls around each individual centroid. Sikabei is therefore achieving a slightly higher
percent of correct assignments because although great call differences within
individuals are similar, there is greater inter-individual diversity.
28
South Pagai (fig. 3.2.(c)) females are extremely similar in their characteristics for F1
(‘Frequency band exploited during pre-trill + trill’) and F2 (‘Number of trill notes’),
resulting in the bunching effect visible on the graph. Great call variation is similar to
the two Siberut populations already described. The low inter-individual diversity
accounts for such a low rate of classification and is very different to the two Siberut
populations. Saureinu individuals (fig. 3.2.(d)) show a similar pattern to the Sikabei
individuals and have well separated individuals with a great call spread around the
individual centroids that is similar to the other populations.
Fig. 3.2. Canonical Discriminant Function Graphs for each Population.
29
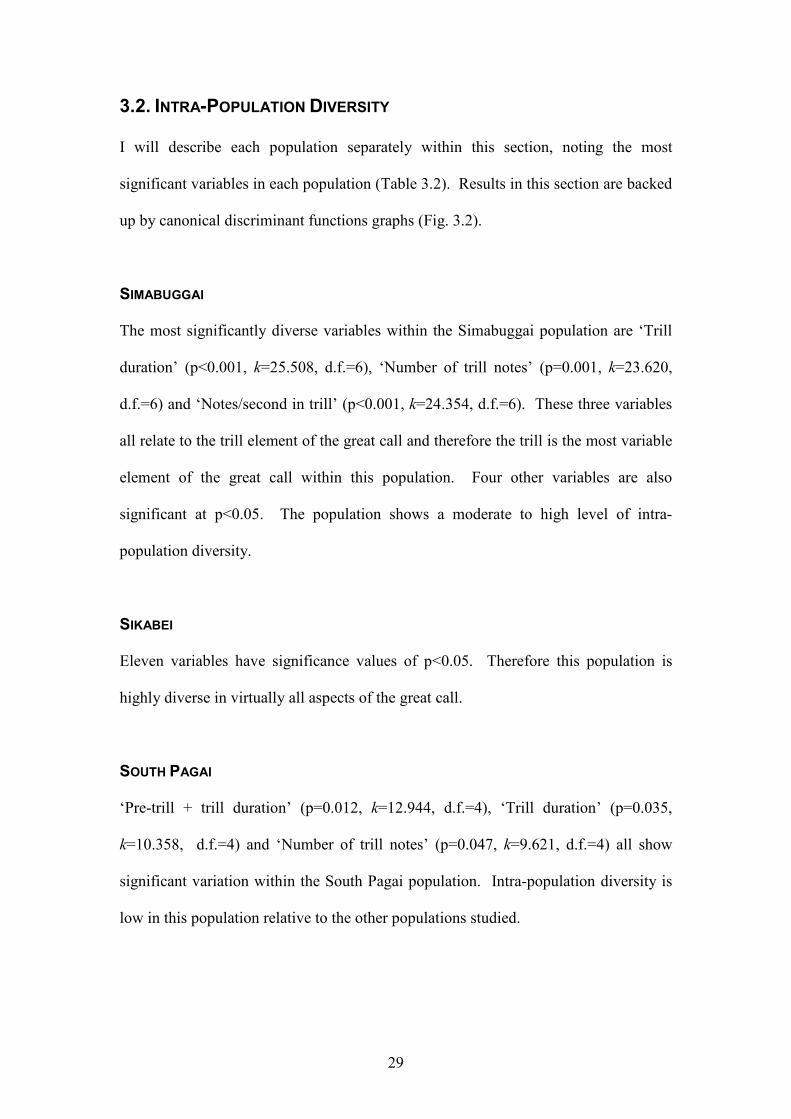
3.2. INTRA-POPULATION DIVERSITY
I will describe each population separately within this section, noting the most
significant variables in each population (Table 3.2). Results in this section are backed
up by canonical discriminant functions graphs (Fig. 3.2).
SIMABUGGAI
The most significantly diverse variables within the Simabuggai population are ‘Trill
duration’ (p<0.001, k=25.508, d.f.=6), ‘Number of trill notes’ (p=0.001, k=23.620,
d.f.=6) and ‘Notes/second in trill’ (p<0.001, k=24.354, d.f.=6). These three variables
all relate to the trill element of the great call and therefore the trill is the most variable
element of the great call within this population. Four other variables are also
significant at p<0.05. The population shows a moderate to high level of intra-
population diversity.
SIKABEI
Eleven variables have significance values of p<0.05. Therefore this population is
highly diverse in virtually all aspects of the great call.
SOUTH PAGAI
‘Pre-trill + trill duration’ (p=0.012, k=12.944, d.f.=4), ‘Trill duration’ (p=0.035,
k=10.358, d.f.=4) and ‘Number of trill notes’ (p=0.047, k=9.621, d.f.=4) all show
significant variation within the South Pagai population. Intra-population diversity is
low in this population relative to the other populations studied.

30
SAUREINU
All twelve variables are significant to p<0.05 (d.f.=4) demonstrating a very high
diversity in this population and the highest of all the populations studied. The four
most significant variables (p<0.001, d.f.=4) are all linked to the pre-trill element of
the great call. This differs from the pattern seen in the other populations which have
tended to have the most significantly diverse variables being those linked with the trill
element of the great call.
Table 3.2. Significance Results from Kruskal-Wallis Tests for Intra-Population
and Inter-Population Diversity.
VARIABLES INTRA-POPULATION INTER-
POPULATION
Sim. Sik. S.Pag. Sau.
1. Pre-trill + Trill Duration 0.022 0.001 0.012 0.005 0.198
2. Frequency band exploited during pre-trill + trill
0.450 0.001 0.094 0.014 0.059
3. Duration of 1st note 0.054 0.035 0.085 0.001 0.091
4. Frequency modulation of 1st
note 0.022 0.002 0.254 0.001 0.035
5. Duration of 2nd note 0.224 0.001 0.393 0.001 0.078
6. Frequency of 2nd note 0.024 0.001 0.712 0.001 0.105
7. Number of pre-trill notes 0.195 0.001 0.265 0.002 0.114
8. Pre-trill duration 0.718 0.001 0.089 0.002 0.182
9. Notes/second pre-trill 0.013 0.071 0.403 0.001 0.117
10. Trill duration 0.001 0.001 0.035 0.018 0.111
11. Number of trill notes 0.001 0.001 0.047 0.002 0.030
12. Notes/second trill 0.001 0.001 0.697 0.007 0.206
a. Sim.=Simabuggai, Sik.=Sikabei, S.Pag=South Pagai, Sau.=Saureinu. b. Values in red are significant
3.3. INTER-POPULATION DIVERSITY
3.3.1. KRUSKAL-WALLIS ANALYSIS OF VARIANCE
Inter-population diversity is lower than intra-population diversity (Table 3.2). The
significant variables within the inter-population diversity are ‘Frequency modulation
of 1st note’ (p=0.035, k=8.599, d.f.=3) and ‘Number of trill notes’ (p=0.030, k=8.952,

31
d.f.=3). These variables appear unrelated. Significance of variation between
populations does not vary markedly between the variables suggesting most variables
play a similar role in the overall variation.
3.3.2. POPULATION DISCRIMINANT FUNCTION ANALYSIS
Discriminant function analysis performed on the populations resulted in three
functions (F1, F2, F3) defined from the original twelve variables. The major variables
associated with each function in this analysis are F1= ‘Duration of first note’, F2=
‘Frequency modulation of 1st note’, F3=’Notes/second in pre-trill’. Each of these
functions represents a proportion of all the variance within the data (Table 3.3). The
Eigenvalue (information captured) of a function represents the spread of group means,
with the largest value indicating the function that has the biggest spread of group
means. The percent of total variation represented by each function is shown in the ‘%
of variance’ column, with a ‘cumulative %’ column showing the percent of all
functions so far added together. From this, it can be seen that these three functions
together have captured 100% of the information available from all twelve variables.
Table 3.3. Summary of Canonical Discriminant Functions from SPSS
Function Eigenvalue % of Variance Cumulative % Canonical Correlation
1 2.719(a) 81.7 81.7 .855
2 .380(a) 11.4 93.1 .525
3 .229(a) 6.9 100.0 .432
The Wilks’ λ value for each function demonstrates the amount a function differs
between populations. F1 (p<0.001, λ=0.158) differs significantly between
populations, F3 (p=0.45, λ=0.813) is more similar between populations but still
significant, and F2 (p=0.036, λ=0.589) lies somewhere in-between.

32
Prior probabilities of an individual belonging to a group (i.e. population) differ
depending on the actual number of individuals within that group. The classification
table (Table 3.4) places the individuals in the correct group in 79.2% of cases which is
much higher than the prior probabilities for all populations (range of 0.208-0.292).
After cross-validation this is reduced to 58.3% of cases being classified correctly,
which is still much higher than the prior probability.
The highest rate of correct classification after cross-validation is within the South
Pagai population with 80% correct assignment. This means 80% of the individuals
from South Pagai were correctly assigned to being from this population by
discriminant function analysis. This fits with the Kruksal-Wallis analysis of variance
intra-population because the test showed it to be the least variable population, and
therefore it would be expected that it would be more easily classified.
Simabuggai has the second highest rate of correct assignment in the cross validated
table (however, it has the highest in the non-cross validated table) with 71.4% correct
classification. Saureinu and Sikabei have the lowest rates of correct classification
with 20% and 57.1% respectively. This also corresponds with Kruskal-Wallis tests of
intra-population diversity because these were the two most diverse populations and
thus it would be expected, more difficult to classify because common ground is harder
to identify between individuals. Cohen’s κ test statistic shows inter-rater reliability is
significant (κ = 0.437, p<0.001) within the cross validated classifications.

33
Table 3.4. Discriminant Function Analysis for Populations
Population Predicted Group Membership Total
Simabuggai Sikabei S.Pagai Saureinu
% of individuals correctly classified
Original classification
Count Simabuggai 6 1 0 0 7
Sikabei 0 5 0 2 7
S.Pagai 0 1 4 0 5
Saureinu 0 1 0 4 5
Total 6 7 5 6 24
% Simabuggai 85.7 14.3 0.0 0.0 100.0 85.7
Sikabei 0.0 71.4 0.0 28.6 100.0 71.4
S.Pagai 0.0 20.0 80.0 0.0 100.0 80.0
Saureinu 0.0 20.0 0.0 80.0 100.0 80.0
Total 79.2
Cross-validated classification a
Simabuggai 5 1 0 1 7
Sikabei 0 4 1 2 7
S.Pagai 0 1 4 0 5
Saureinu 1 3 0 1 5
Total 5 7 6 6 24
% Simabuggai 71.4 14.3 0.0 14.3 100.0 71.4
Sikabei 0.0 57.1 14.3 28.6 100.0 57.1
S.Pagai 0.0 20.0 80.0 0.0 100.0 80.0
Saureinu 20.0 60.0 0.0 20.0 100.0 20.0
Total 58.3
Simabuggai appears to be the most ‘separate’ of all the populations in the canonical
discriminant functions graph, thus calling into question whether the original
classification is more accurate than the cross validated classification for this
population, because it intrinsically looks like the most easily identifiable population
(Fig. 3.3).
Sikabei, in this diagram, is the most central population and the population centroid is
approximately equally set between South Pagai and Saureinu. Despite appearing very
different from the other Siberut population, Sikabei is only markedly different in F1,
the difference in F2 between the two Siberut populations is minor. Therefore, the
difference is one of frequency and not duration.

34
Considering the amount of intra-population diversity identified by the previously
mentioned Kruskal-Wallis test (Section 3.4.1), the Sikabei individuals look relatively
close together on the diagram compared to the other three populations. Simabuggai
and Saureinu have especially ‘stretched’ populations. The canonical discriminant
functions diagram does only use the first two functions and therefore 6.9% of the
variance (as accounted for by F3) is not included here.
Fig. 3.3. Canonical Discriminant Functions diagram using F1 and F2.
3.4. INTRA-ISLAND DIVERSITY
Mann Whitney U was used to test for variation between medians in intra-island
analysis (Table 3.5). Diversity between the two populations within the island of
Siberut is significant in only one variable: ‘Frequency modulation of 1st note’
(p=0.017, U=6, d.f.=1).

35
Table 3.5. Significance Results from Mann Whitney U Test for Intra-Island Diversity and Kruskal Wallis Test for Inter-Island Diversity
VARIABLES INTRA-ISLAND (SIBERUT)
INTER-ISLAND
1. Pre-trill + Trill Duration 0.209 0.720
2. Frequency band exploited during pre-trill + trill 0.710 0.031
3. Duration of 1st note 1.000 0.041
4. Frequency modulation of 1st note 0.017 0.939
5. Duration of 2nd note 0.456 0.050
6. Frequency of 2nd note 0.209 0.259
7. Number of pre-trill notes 0.165 0.307
8. Pre-trill duration 0.259 0.222
9. Notes/second in pre-trill 0.165 0.120
10. Trill duration 0.259 0.139
11. Number of trill notes 0.097 0.079
12. Notes/second in trill 0.165 0.406
a. Values in red are significant
3.5. INTER-ISLAND DIVERSITY
3.5.1. KRUSKAL-WALLIS ANALYSIS OF VARIANCE
Kruskal-Wallis analysis of variance confirms diversity between islands (i.e. Siberut,
Sipora and South Pagai) and is higher than intra-island diversity for Siberut (Table
3.5). Three variables are significant: ‘Frequency band exploited during pre-trill +
trill’ (p=0.031, k =6.931, d.f.=2). ‘Duration of 1st note’ (p=0.041, k = 6.411, d.f.=2)
and ‘Duration of 2nd note’ (p=0.05, k = 5.991, d.f.=2).
3.5.2. ISLAND DISCRIMINANT FUNCTION ANALYSIS
An inter-island discriminant function analysis combined the two populations from
Siberut and then discriminated amongst the three islands: Siberut (Simabuggai +
Sikabei), Sipora (Saureinu), and South Pagai. The analysis used two functions
comprising of the ‘Duration of 1st note’ (F1) and ‘Notes/second in pre-trill’ (F2) which
combined, account for 100% of variance. Eigenvalues show the two functions have
36
an intermediate spread of means between islands. The Wilks’ λ values ( F1: p=0.005,
λ=0.480; F2: p=0.016, λ=0.752) for both functions suggests they have significant
variance between the islands.
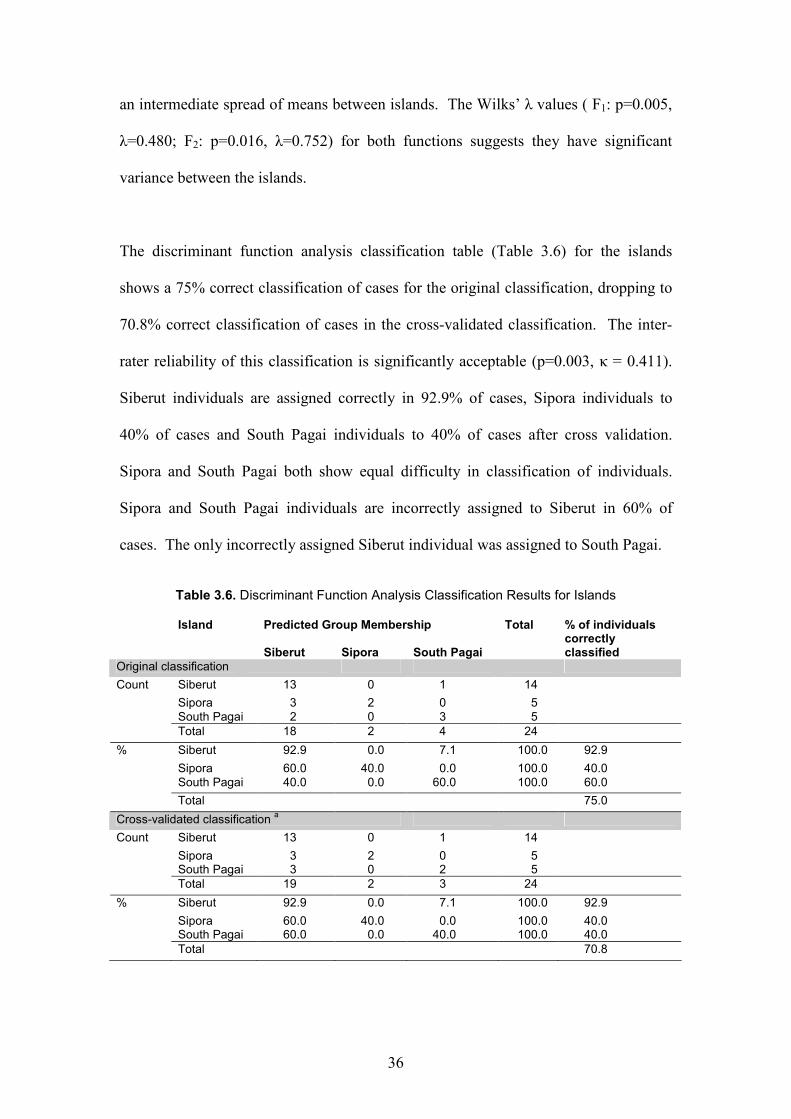
The discriminant function analysis classification table (Table 3.6) for the islands
shows a 75% correct classification of cases for the original classification, dropping to
70.8% correct classification of cases in the cross-validated classification. The inter-
rater reliability of this classification is significantly acceptable (p=0.003, κ = 0.411).
Siberut individuals are assigned correctly in 92.9% of cases, Sipora individuals to
40% of cases and South Pagai individuals to 40% of cases after cross validation.
Sipora and South Pagai both show equal difficulty in classification of individuals.
Sipora and South Pagai individuals are incorrectly assigned to Siberut in 60% of
cases. The only incorrectly assigned Siberut individual was assigned to South Pagai.
Table 3.6. Discriminant Function Analysis Classification Results for Islands
Island Predicted Group Membership Total % of individuals
correctly Siberut Sipora South Pagai classified
Original classification
Count Siberut 13 0 1 14
Sipora 3 2 0 5
South Pagai 2 0 3 5
Total 18 2 4 24
% Siberut 92.9 0.0 7.1 100.0 92.9
Sipora 60.0 40.0 0.0 100.0 40.0
South Pagai 40.0 0.0 60.0 100.0 60.0
Total 75.0
Cross-validated classification a
Count Siberut 13 0 1 14
Sipora 3 2 0 5 South Pagai 3 0 2 5
Total 19 2 3 24
% Siberut 92.9 0.0 7.1 100.0 92.9
Sipora 60.0 40.0 0.0 100.0 40.0 South Pagai 60.0 0.0 40.0 100.0 40.0
Total 70.8
37
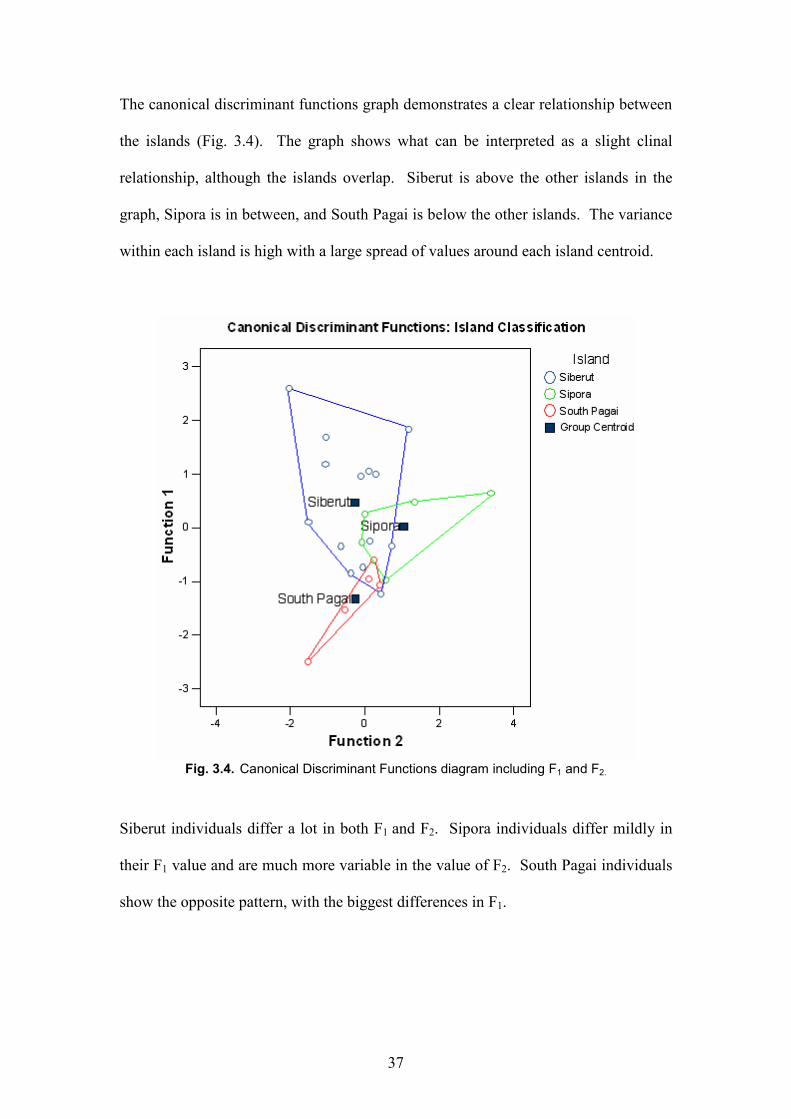
The canonical discriminant functions graph demonstrates a clear relationship between
the islands (Fig. 3.4). The graph shows what can be interpreted as a slight clinal
relationship, although the islands overlap. Siberut is above the other islands in the
graph, Sipora is in between, and South Pagai is below the other islands. The variance
within each island is high with a large spread of values around each island centroid.
Fig. 3.4. Canonical Discriminant Functions diagram including F1 and F2.
Siberut individuals differ a lot in both F1 and F2. Sipora individuals differ mildly in
their F1 value and are much more variable in the value of F2. South Pagai individuals
show the opposite pattern, with the biggest differences in F1.
38
3.6. SIBERUT, AND SIPORA & SOUTH PAGAI DISCRIMINANT FUNCTION
ANALYSIS
The discriminant function analysis attempted to classify Siberut individuals into one
group, and Sipora & South Pagai into another group. The reason behind this
discriminant function analysis is explained in the methods section (Section 2.4.2.).
The discriminant function analysis produced a model with only one function (F1) and
is referred to as discriminant function analysis (1). The function uses the variable
‘Number of trill notes’ which represents 100% variance via linear correlations with
other variables. The Wilks’ λ value (p=0.042, λ=0.825) suggests the function has
significant variance between the islands. The Eigenvalue is 0.212, thus the spread of
the means is less than for each function in the inter-population discriminant function
analysis.
The classification table (Table 3.7) shows 66.7% of cases were classified correctly in
the original classification, and this percent was reduced to 62.5% after cross
validation. Prior probabilities for group classification range are 0.583 for Siberut and
0.417 for Sipora & South Pagai, and therefore the results must be treated with caution
because they are very close to the prior probability values.

39
Table 3.7. Discriminant Function Analysis (1) Classification Results for the Siberut Group and Sipora & South Pagai Group
Group Predicted Group Membership Total % of individuals
correctly
Siberut Sipora & S.Pagai classified
Original classification
Count Siberut 10 4 14
Sipora & S.Pagai
4 6 10
Total 14 10 24
% Siberut 71.4 28.6 100.0 71.4
Sipora & S.Pagai
40.0 60.0 100.0 60.0
Total 66.7
Cross-validated classification a
Count Siberut 9 5 14
Sipora & S.Pagai
4 6 10
Total 13 11 24
% Siberut 64,3 35.7 100.0 64.3
Sipora & S.Pagai
40.0 60.0 100.0 60.0
Total 62.5
Correct assignment of Siberut individuals was 64.3% after cross validation whereas
correct assignment for Sipora & S.Pagai individuals was 60% after cross validation.
Therefore, Siberut individuals are more likely to be correctly classified than Sipora &
South Pagai individuals. Cohen’s κ test statistic shows inter-rater reliability is not
significant (p<0.239, κ = 0.239) within the cross validated classifications.
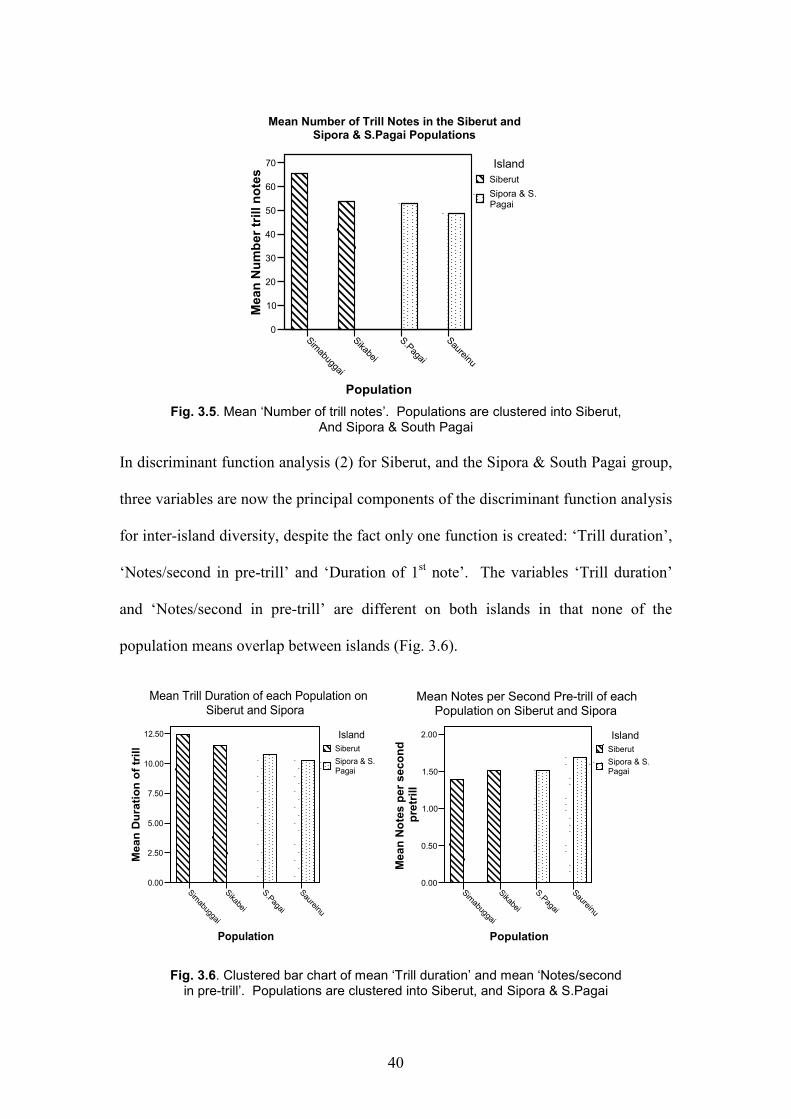
The clustered bar chart (Fig. 3.5) shows mean ‘Number of trill notes’ in each
population. The populations are clustered into Siberut, and Sipora & South Pagai.
Although there is an obvious difference between the two clusters, note that Sikabei
and South Pagai have the same mean ‘Number of trill notes’. Therefore, Sikabei and
South Pagai are closer to each other in this variable than to the other population of
their own clusters. It would therefore seem that the discriminant function analysis for
inter-island diversity is unreliable because this is the major component of the function
the model uses.
40
Simabuggai
Sikabei
S.Pagai
Saureinu
Population
0
10
20
30
40
50
60
70
Mean Number trill notes
Island
Siberut
Sipora & S.Pagai
Mean Number of Trill Notes in the Siberut and Sipora & S.Pagai Populations
Fig. 3.5. Mean ‘Number of trill notes’. Populations are clustered into Siberut,
And Sipora & South Pagai
In discriminant function analysis (2) for Siberut, and the Sipora & South Pagai group,
three variables are now the principal components of the discriminant function analysis
for inter-island diversity, despite the fact only one function is created: ‘Trill duration’,
‘Notes/second in pre-trill’ and ‘Duration of 1st note’. The variables ‘Trill duration’
and ‘Notes/second in pre-trill’ are different on both islands in that none of the
population means overlap between islands (Fig. 3.6).
Simabuggai
Sikabei
S.Pagai
Saureinu
Population
0.00
2.50
5.00
7.50
10.00
12.50
Mean Duration of trill
Island
Siberut
Sipora & S.Pagai
Mean Trill Duration of each Population on Siberut and Sipora
Simabuggai
Sikabei
S.Pagai
Saureinu
Population
0.00
0.50
1.00
1.50
2.00
Mean Notes per second
pretrill
Island
Siberut
Sipora & S.Pagai
Mean Notes per Second Pre-trill of each Population on Siberut and Sipora
Fig. 3.6. Clustered bar chart of mean ‘Trill duration’ and mean ‘Notes/second in pre-trill’. Populations are clustered into Siberut, and Sipora & S.Pagai

41
‘Trill duration’ also has a strong positive correlation with ‘Number of trill notes’
(p<0.01, r = 0.829) which further supports this new discriminant function analysis
because the removed variable is still indirectly represented.
The alteration in classification when discriminant function analysis (2) is used is
because mean ‘Number of trill notes’ is removed from the variables for analysis
(Table 3.8). Original classification has classified correctly 87.5% of cases, and after
cross validation this is reduced to 79.2% of cases. A Cohen’s κ test statistic shows
inter-rater reliability is highly significant (p<0.003, κ = 0.589) within the cross
validated classifications. 90% of individuals from Sipora & South Pagai are correctly
assigned. Siberut has a 71.4% correct predicted assignment for individuals from the
island, suggesting a slight overlap with the Sipora individuals.
Table 3.8. Discriminant Function Analysis (2) Classification Results for the
Siberut Group and Sipora & South Pagai Group
Group Predicted Group Membership Total % of individuals correctly
Siberut Sipora & S.Pagai classified
Original classification
Count Siberut 11 3 14
Sipora & S.Pagai
0 10 10
Total 11 13 24
% Siberut 78.6 21.4 100.0 78.6
Sipora & S.Pagai
0.0 100.0 100.0 100.0
Total 87.5
Cross-validated classification a
Count Siberut 10 4 14
Sipora & S.Pagai
1 9 10
Total 11 13 24
% Siberut 71.4 28.6 100.0 71.4
Sipora & S.Pagai
10.0 90.0 100.0 90.0
Total 79.2
42
4. DISCUSSION
4.1. INTRA-INDIVIDUAL DIVERSITY
Intra-individual diversity is moderately low, with all twelve variables having a
Coefficient of Variation (CV) of 18.3% or less. The most consistent variable is
‘Frequency of 2nd note’. From the second note of the great call phrase until the end of
the trill element, frequency tends to fluctuate very little and therefore this variable
represents more than the second note. The variable’s consistency implies the whole
of the pre-trill element after the first note, and the trill element, are consistent in
frequency. Although this variable is consistent within females and would thus appear
the most useful for discriminating between individuals, frequency is the most
consistent feature at all levels of grouping (i.e. individual, population, island, ESU)
because of the nature of sound propagation (Whitten, 1981; Richards & Wiley, 1978).
The least consistent variables are those related to the first note of the great call. This
implies that the first note is not important in proclaiming identity of an individual and
is therefore not subject to stringent control of its emission.
The low intra-individual diversity supports the possibility of individual recognition
potential between conspecifics, because, if an individual is to be recognised by the
great call, that call must be consistent within the individual (Fenton et al., 2004;
Jordan et al, 2002; Dallmann & Geissmann, 2001a,b; Friedl & Klump, 2001;
Lengagne, 2001; Reby et al., 2001).
The reason for the intra-individual diversity that does exist may be environmental
fluctuations, however, great calls from females were recorded during a single song
bout, which lasts ~20mins. Although most environmental fluctuations would seem

43
unlikely in this short amount of time, some factors fluctuate fast enough to influence
the variation. A change in wind strength/direction would encourage the female to
alter her phrases to compensate for differences in the sound window (Whitten, 1981).
Temperature also alters the way sound carries, and temperature gradients, such as
those between the forest floor and the forest canopy, refract sound. At the time
females sing, temperature will be gradually increasing and this could create a similar
refraction effect. The effect of this could be tested in future research by examining
the change in great calls over time within single song bouts, whilst measuring
variations in temperature. Therefore, environmental fluctuations may be a
contributing factor but are not influential enough in the given time frame to be the
ultimate source of all variation. Physiological and psychological state of the
individual can likewise be ruled out as a major factor due to an insufficient amount of
time available for this to change.
The intra-individual diversity could be a function of age and related level of
experience, whereby, the less experience a female has, the more likely that female
will have difficulty in reliably reproducing the species song. Age has been noted as a
function of variation in chimpanzee vocalisations, however, the level of genetic
influence in chimpanzee vocalisations is thought to be less than in gibbon
vocalisations and therefore this information is applied to this work with species
differences in mind (Arcadi, 1996; Mitani et al., 1992; Marler & Hobbett, 1975 cited
in Mitani et al., 1999). The CV results (Appendix II) clearly show that one individual
has a high CV for every variable, and so by this implication would be a young,
inexperienced female. Gibbon song is of genetic basis (Cheyne & Brule, 2002;
Geissmann, 1984; Tenaza, 1984) and the age function described would be expected in

44
species where learning is involved in vocalisations. Perhaps in hylobatids, a genetic
basis provides the vocalisation that will be sung at adulthood after a necessary period
of ‘practice’. Barbary macaques follow such a pattern, exhibiting a fixed structure of
vocalisation that has an element of plasticity (Fischer et al., 1998). In addition, the
song of gibbons is a complex vocalisation in comparison with other mammals adding
further support to the idea of necessary period of ‘practice’. Also, females sing to
declare and protect territory (Cowlishaw, 1992), and therefore the gibbon can afford
this period of practice before a territory of its own is held and requires maintenance.
In contrast to this idea, Gittins (1978) suggests female gibbons sing to declare
‘ownership’ of their mate, however, the article which implies this is mostly
speculation and not the result of detailed analyses. Therefore, the function proposed
by Cowlishaw (1992) is the function I accept in the writing of this report.
CONCLUSION FOR INTRA-INDIVIDUAL DIVERSITY
Therefore, in conclusion, the null hypothesis that there will be no significant intra-
individual diversity, can be accepted. The proposed reason for low intra-individual
diversity is the potential it provides for individual recognition of conspecifics. The
small amount of diversity that does exist is most likely to be a function of age and
related experience in maintaining a consistent great call.
4.2. INTER-INDIVIDUAL DIVERSITY
The four populations vary greatly in the amount of inter-individual diversity they
contain, demonstrated by the discriminant function analysis which assigned great calls
to individuals with a varying success rate. Despite the variation, it does seem that
from the results, overall, individuals can be distinguished by their great calls. This is
45
supported by the Kruskal Wallis analysis of variance within each population, where at
least three variables differ significantly between individuals in a population. In
Haimoff & Tilson’s (1985) study, twelve of the fifteen variables tested for variance
between Kloss’s gibbon females differed significantly. This inter-individual diversity
is higher than Simabuggai and South Pagai, but lower than Sikabei and Saureinu.
Unfortunately, a difficulty exists in comparing the Haimoff and Tilson (1985) study to
this work because of the variation in significance between populations, however, their
results do further illustrate the large difference between populations which is
discussed in Section 4.3. The authors argue the strongest differences found between
Kloss’s gibbon individuals are in duration and not in frequency of various elements in
the great call phrase. The results of the Haimoff & Tilson (1985) must be treated
prudently because only four females were used in the entire analysis and therefore the
high inter-individual diversity could be a function of small sample size rather than
illustrating actual diversity.
Whitten (1981) describes a ‘sound window’ used by the Kloss’s gibbon which is
determined by sound attenuation in the heterogeneous forest environment. Amplitude
modulation (e.g. the trill element) is also an adaptation to sound propagation in a
forest environment (Richards & Wiley, 1978). Many birds and insects in the
Mentawai Islands use amplitude modulated structures in the sounds they produce
(pers. obs.) so it is highly possible there are specific characteristics of Mentawai
forests which favour this form of sound propagation. Trills are the most acoustically
diverse variable between individuals, therefore the trill element would be used for
individual recognition among Kloss’s gibbon females.

46
Trills are used by animals in long-range territorial and/or mate attraction (Elemens et
al., 2004; Radford & du Plessis, 2004; Rogers & Cato, 2002; Doutrelant et al., 2000).
Male leopard seals (Hydrurga leptonyx) vary between individuals in duration more
than frequency in long-range trill calls (Rogers & Cato, 2002). Watkins & Schevill
(1979) suggest that increased length of a call may increase the calls detectability at a
distance. Ring doves (Strepopelia risoria) possess special “superfast” muscles used
in trilling (Elemens et al., 2004), demonstrating that this is of such importance that
anatomy has been altered at a cost to other structures to allow trills.
On the basis of trill properties, the territorial behaviour of the Kloss’s gibbon and the
nature of being the only hylobatid on the Mentawai Islands, I propose the following
three hypotheses to explain inter-individual diversity: (1) Trilling as a handicap, (2)
Neighbour-stranger discrimination, (3) Relaxed selection.
4.2.1. HYPOTHESIS (1) TRILLING AS HANDICAP
In sexual selection, individuals of some species chose a mate due to their performance
of a certain behaviour or for a particular physical attribute, which may not be adaptive
in terms of natural selection but does increase the number of offspring an individual
has, and therefore is deemed ‘sexual selection’. Zahavi’s Handicap Principle (Zahavi,
1975) states that mates will be chosen on their ability to cope with a characteristic that
otherwise hinders fitness.
The trill has been proposed to be a handicap in male Kloss’s gibbons in concordance
with Zahavi’s Handicap Principle (Whitten, 1984b). This was applied to the male
because it sings more often than the female, however, the trill may also act as a

47
handicap for the female. Trilling is energetically costly, therefore an individual that
can trill for a long time (long trill duration or long song bout) can demonstrate a high
level of fitness/stamina (Dallman & Geissmann, 2001b). Trill duration has significant
diversity within every population in this study, thus supporting this idea.
Some suggest that if a characteristic indicates fitness, that characteristic should vary
over time as fitness varies (Puglisi & Adamo, 2004; Lengagne, 2001). However, a
characteristic with a genetic basis such as gibbon song would remain stable whilst still
acting as an indicator of genetic fitness. It is therefore reasonable to assume intra-
individual differences indicate fitness on a temporal scale whereas inter-individual
differences are indicative of fitness on a genetic scale. Brockelman (1984) suggests
communication of this type may be referred to as ‘demonstrative communication’
because it vocally demonstrates a genetic state.
However, it may be that the songs of gibbons are not concerned with information
transmission. Brockelman (1984) questions the ‘information paradigm’ which he
states as “…regards communication as information transmission.” It is assumed any
communication that does not serve an informative purpose will be filtered via natural
selection because it wastes essential energy. Although disputed by some, I conclude
that the ‘information paradigm’ makes intrinsic sense and that gibbon songs do
convey important information. Brockelman himself points out no alternative
explanations are available.
In contrast to the hypothesis of trilling as a handicap in females, the song of female
gibbons has been proposed to function for territory defence and maintenance

48
(Cowlishaw, 1992), and therefore is not concerned, or only secondarily concerned,
with mate attraction. However, the study that proposed this function attempted to
encompass all hylobatid species within the explanation, and this may be diluting the
specific function of song within each species. It may be particularly inaccurate in the
case of Kloss’s gibbons because of the lack of duets.
4.2.2. HYPOTHESIS (2) NEIGHBOUR-STRANGER DISCRIMINATION
Neighbour-stranger discrimination relies on the ability to recognise conspecifics.
Conspecific recognition has been demonstrated in many taxa (Fenton et al., 2004 -
African bats; Friedl & Klump, 2001 – tree frogs; Jordan et al, 2002 – cotton top
tamarins; Lengagne, 2001 – eagle owls; Reby et al., 2001 - red deer). Individual
recognition over a long-range serves in territory defence and/or mate
attraction/defence (Rogers & Cato, 2002) and can be achieved if intra-individual
characteristics remain consistent while inter-individual diversity is apparent. The
results from this work and from Haimoff and Tilson (1985) suggest Kloss’s gibbons
have the potential to differentiate between individuals within their population,
however, Haimoff & Tilson’s (1985) study did not analyse intra-individual variation
and therefore the assumptions of a potential for individual recognition is extrapolated
from this work.
Neighbour-stranger discrimination using vocalisations is applicable to animals which
are either territorial and/or protect specific calling sites from conspecifics. The
principle works because individuals become habituated to the vocalisation of their
neighbour and therefore exhibit reduced aggression in reaction to the neighbour’s
song (Friedl & Klump, 2001). Decreased aggressive reactions to neighbours

49
vocalisations saves time and energy, which can be used for other activities, such as
foraging or attracting a mate. The individuals continue to react to strangers because
they are not habituated to the strangers’ vocalisations (Bee & Gerhardt, 2000). This
stranger reaction is adaptive because strangers are usually more of a threat. The
increased threat is because they are not likely to hold their territory and therefore are
more likely to challenge existing territory owners.
The neighbour-stranger idea is applicable to gibbons because during border disputes,
it is mostly the males which display aggressively whilst the females have a more
subdued reaction (Cowlishaw, 1992). The female song is hypothesised to function in
territory defence and the male song in mate defence, and therefore, a neighbour-
stranger system is supported because during the border dispute a female will be aware
that the rival female already owns a territory and therefore is not a threat. In further
support, the male, who is not functioning as a territory defender but rather in defence
of his mate, reacts aggressively because claims to females are more dynamic in nature
and aggressive reactions are not already habituated by a neighbour-stranger system.
Despite the knowledge that individuals can potentially be recognised by conspecifics,
this does not mean that recognition actually takes place. Playback experiments can
provide confirmation of recognition. Mitani et al. (1985) conducted playback
experiments with Műller’s gibbons (Hylobates muelleri) but recorded no response to
self, neighbour or stranger duets. This sheds doubt on the idea that gibbons employ
neighbour-stranger discrimination strategies, however, it may be that such
vocalisations and recognition is context dependent and playback experiments may not
sufficiently replicate the natural context required.

50
4.2.3. HYPOTHESIS (3) RELAXED SELECTION
Closely related, sympatrically living species originate from (a) sympatric speciation,
or (b) immigration of one species into the area already inhabited by the other species.
In the case of gibbons, some sympatrically living species are thought to originate from
the method (b) due to evidence from migration patterns and biogeography
(Geissmann, 1993). For example, Műller’s gibbons were thought to have diverged on
Borneo whereas agile gibbons are thought to have diverged on Sumatra and colonised
Borneo via a land bridge when sea levels were low. Now, both species co-exist
sympatrically on Borneo. This means that in this case sympatry is not the cause of
their species-specific song divergence but serves to maintain and reinforce the
existing variation. This is advantageous and important in lieu of the ‘recognition
concept of species’ (Paterson, 1985 cited in: Templeton, 1989).
The ‘recognition concept of species’ expresses that potential mates of a species can
recognise each other by a particular recognisable characteristic, exemplified by
vocalisations. A vocalisation would be specific to that species and therefore it is an
evolutionary step to ensure an individual will only mate with a member of its own
species (Templeton, 1989). There are criticisms of this species concept but in this
context it is the most appropriate concept of species.
When a hylobatid does not live sympatrically with another hylobatid species, the
pressure for a species-specific recognition system relaxes and individual recognition
may become the priority. Relaxation of the selection pressures to keep the species
song specific would allow random genetic drift to be able to have a greater effect on
the song before its effect is removed via natural selection. Geissmann (2002) suggests

51
duet-splitting evolved within the songs of the Kloss’s gibbon and the Javan gibbon as
a result of relaxed selection leading to a reduced need to prevent inter-species
breeding. The song would still be subject to other selection pressures, such as the
ability of the song to travel through the gibbons’ environment (Richards & Wiley,
1978; Whitten, 1981), but the species discrimination pressure is relaxed. The three
Mentawai monkeys also endemic to the islands have vocalisations that are too
dissimilar to the gibbon to replace the selection pressure that would be provided by
another hylobatid species (pers. obs.). Therefore the diversity found within
populations serves no function but is merely a by-product of relaxed selection and
subsequent random genetic drift.
There are exceptions to the idea of sympatry resulting in divergence. The mechanism
underlying divergence is the lowered fitness of hybrids between the parent
populations. If hybrids are produced and they do not exhibit a lower fitness than their
parent species, the characteristics of the two species may merge. This is known to
occur in agile/ Műller’s gibbon hybrids in the hybrid zone in Kalimantan, Indonesia.
Hybrids of the two species do not appear to show deleterious effects and their
vocalisations are intermediary between the parent populations, demonstrating a
merging of vocal characteristics (Short, 2005). Avian species have also demonstrated
this merging effect but without the presence of hybrids (de Kort et al., 2002). The
assumption Kloss’s gibbons would experience an increased pressure to diverge and
stereotype their song in the presence of a sympatric hylobatid species is therefore
unsubstantiated and the possibility of relaxed selection must be treated with caution.

52
CONCLUSION FOR INTER-INDIVIDUAL DIVERSITY
In conclusion, the null hypothesis that there will be no significant inter-individual
diversity can be rejected. I propose that neighbour-stranger discrimination is the
principle influence behind significant inter-individual diversity, with relaxed selection
contributing a smaller influence, particularly in non-trill elements of the great call.
4.3. INTER-POPULATION DIVERSITY
The most diverse variables between populations are variables concerned with the first
and second notes of the great call and the number of trill notes. Mean ‘Number of trill
notes’ for South Pagai and Sikabei is the same, but in Sikabei this variable is less
consistent intra-individually and inter-individually. One individual at Sikabei has a
particularly low number of trill notes (range 25 – 43), and this affects the overall
mean of the group. This individual may be particularly young and/or unfit and so
could have produced a sub-optimal song. The individual’s rate of notes per second in
the trill is also unusually low. Removal of this individual from the population data
does indeed bring the mean number of notes in the trill closer to the Simabuggai
population. Nonetheless, the CVs for this individual are high only in the ‘Trill
duration’ and ‘Number of trill notes’ variables, and therefore do not support that the
female was young and inexperienced unless the trill is the last element of the call to
be mastered by a female due to its speed.
The discriminant function analysis for populations assigned individuals to the correct
populations 58.3% of the time after cross validation and the assignment was
significantly reliable. Therefore, populations must have a clear difference between
53
them. Sikabei and Saureinu overlap in characteristics of vocalisations and as a result
are the hardest populations to classify according to the discriminant function analysis.
The variables chosen for functions in the discriminant function analysis may not have
been the most appropriate because the first two variables were very diverse intra-
individually and therefore, concluding real differences between them at a higher
group level is problematic. F3 does not display such a problem, however, this
function only accounted for 6.9% of total variation between the populations and was
not accounted for on the canonical discriminant functions graph. The discriminant
function analysis for populations must therefore be treated with caution.
4.3.1. SIKABEI AND SAUREINU RELATIONSHIP
I propose a tentative hypothesis to explain why Sikabei and Saureinu are more similar
than Sikabei and Simabuggai (the Siberut populations). The hypothesis focuses on
the known effect of rivers acting as boundaries to gibbon distribution (Morris, 1943),
and the knowledge that the two Siberut populations are separated by two rivers. In
addition, the Sikabei population is located on a section of island only connected to the
rest of Siberut by a 2km wide area (Fig. 4.1). Rivers continue to flow when sea levels
drop because precipitation will continue and therefore, when sea levels last dropped to
the extent that the Mentawai Islands were all connected, the rivers would still separate
the Siberut populations. In this event, Sikabei is unobstructed from the exposed land
between Siberut and Sipora, and Saureinu, located in the Northern half of Sipora, may
be equally unobstructed. These two populations would therefore be able to mix in
such an event, which last occurred 7,000 years before present (Whittaker, 2005) and
thus would be more closely related than the two Siberut populations. The notion of
rivers acting to facilitate the process of speciation is supported by a literature review

54
of lemur research which admits more research is necessary but there is a distinct
possibility it has occurred (Goodman & Ganzhorn, 2004).
Fig. 4.1. Land Formation around the Sikabei Population. (Adapted from the TNS Management Areas Map)
On the other hand, there are a number of criticisms to this hypothesis. Rivers alter
their course over time and how different the Siberut river was 7,000 years before
present compared to now is unknown. Also, maps presented by Voris (2000) depict
the Mentawai Islands as separate from each other when the sea is 120m BPL (Fig.
1.3), however, Voris cautions the reader about large error margins in these maps. In
spite of these criticisms, the hypothesis should be considered as an initial and tentative
hypothesis to the problem.

55
4.3.2. INTER-POPULATION DIFFERENCES IN INTRA-POPULATION DIVERSITY
There is a large difference between the levels of diversity seen within each
population. South Pagai shows the least amount of diversity and I suggest this is
because the population lives within a logging concession. Whittaker (2005) estimates
210km² of suitable habitat remains in designated buffer zones, conservation zones and
limited production zones. The area where I obtained recordings was in the limited
production area where only small tracts of primary forest remained and these were
usually fragmented strips (pers. obs.). Therefore, it is possible the population is
reduced in this area to such a degree that diversity is also reduced. Fewer individuals
means the population is more affected by stochastic events because the reproductive
success of each individual is instrumental in which genes are passed on (Cowlishaw &
Dunbar, 2000). Density of gibbon groups at this site was much higher where they did
occur (pers. obs.) which also supports the idea of this population being subject to
pressures from logging and loss of habitat. Kloss’s gibbons are thought to show equal
survival in logged and non-logged forest (Paciulli, 2004), however, the study that
advocates this does not detail the level of logging at which survival is good.
The environment of South Pagai is more limiting than the environment of the other
populations. It has a high elevation (~200m), is colder and experiences higher rainfall
than the other populations. This could mean the individuals have to conform to a very
specific fitness to be able to produce a vocalisation that will propagate sufficiently
through the forest. Cold temperatures and heavy rain is known to inhibit Kloss’s
gibbons singing (Whitten, 1981).

56
Saureinu has very high intra-population diversity. I theorise this could be because
only an estimated 10-15% of the island of Sipora is still forested, which in metric
measurement is 84.5-126.8km² (Whittaker, 2005; Fuentes, 1996/7), and the
individuals left could include immigrants from other areas of forest that were being
logged. Therefore, the forest around Saureinu could be acting as a reservoir for the
island’s population. The area is recovering from logging 20 years earlier (Whittaker,
2005), so the gibbons which are resident there now may have come from other areas if
it was inhabitable during the logging. The Siberut populations do not have any
features of their environment which I can suggest for the cause of their diversity
levels. Random genetic drift could account for the diversity seen between populations
that cannot be accounted for by human intervention and subsequent habitat
alterations.
CONCLUSION FOR INTER-POPULATION DIVERSITY
In conclusion, the null hypothesis that there will be no significant inter-population
diversity can be rejected. Differences are proposed to be due to human influence on
the local environment and random genetic drift.
4.4. INTRA-ISLAND DIVERSITY
Intra-island diversity could only be assessed within Siberut because only 1 population
was studied on Sipora and on South Pagai due to lack of available field sites. The
diversity within Siberut is low, with only one significantly diverse variable:
‘Frequency modulation of 1st note’. The variable is concerned with frequency and
this relates to the earlier discussion regarding sound propagation (Section 4.2) where
it was suggested frequency is less variable than duration within vocalisations (Rogers

57
& Cato, 2002; Friedl & Klump, 2001; Lengagne, 2001; Whitten, 1981; Richards &
Wiley, 1978). Therefore, the reason for the difference between the Siberut
populations’ great calls may be due to environmental differences in the structural
properties of the forest. The Mann-Whitney U test shows this was in fact the only
significantly diverse variable between the two populations, and therefore the nature of
discriminant function analyses (i.e. looking for and exaggerating differences between
populations) explains the result (Fig. 3.2).
Contrastingly, if the variable is significantly diverse because of structural differences,
it would be expected that all frequency variables would be significantly diverse,
which they are not. The first note was not considered important for individual
recognition compared to the importance of the trill (Section 4.2). Therefore, if the
variable is not an important functional part of the great call, the ability to transmit the
first note through the forest environment would not be essential. This reduction of
essential function would result in relaxed selection on this variable, leaving it
susceptible to the actions of random genetic drift.
CONCLUSION FOR INTRA-ISLAND DIVERSITY
In conclusion, the hypothesis that there will be no significant intra-island diversity on
Siberut can be rejected. In this case, the rejection of the null hypothesis is based only
on one of the twelve variables and therefore does not account for the level of
diversity. The level of diversity is extremely low and the only significantly diverse
intra-island variable is proposed to be due to random genetic drift.

58
4.5. INTER-ISLAND DIVERSITY
Inter-island diversity is larger than intra-island diversity (Siberut) which is to be
expected because more islands imply a larger gene pool. The trill element variables
were not significantly diverse, which is also to be expected because if the trill is the
most important element of the great call for individual recognition and its associated
advantages, it would be subject to the strongest selection pressure of all the variables,
expect perhaps for the frequency variables as previously discussed. A strong selection
pressure means that an individual whose trill deviated far from the optimum would
have reduced reproductive success and the deviation would eventually be lost in the
population.
The discriminant function analysis for islands chose ‘Duration of 1st note’ as function
one (F1) and ‘Notes/second in pre-trill’ as function two (F2) in the first classification.
Both functions are linked with the pre-trill element of the great call, again adding
support to the conservation of the trill element within the species. The discriminant
function analysis correctly classified 70.8% of cases demonstrating significant
reliability of being able to place an individual within its correct island. Sipora and
South Pagai were less reliably classified than Siberut, with only 40% correct
classification. Incorrectly assigned individuals from both Sipora and South Pagai
were all assigned to Siberut, therefore suggesting each island’s individuals are more
closely related to Siberut than to each other. Sipora is geographically closer to Siberut
(71km) than to South Pagai (121km) and thus it is reasonable incorrect assignments
will be in the direction of Siberut. However, South Pagai is closer to Sipora than
Siberut (192km), and so the result here is confusing. ‘Notes/second in pre-trill’ (F2)
is the factor that resulted in the incorrect assignment of South Pagai individuals
59
because Siberut and South Pagai centroids are extremely similar on both islands for
the factor. In contrast, the two island centroids are very different in ‘Duration of 1st
note’ (F1).
The canonical discriminant functions graph (Fig. 3.3) depicts a clinal relationship in
F1 (‘Duration of 1st note’), showing the island centroids in the same order as the
islands are geographically. There is even a gap in the graph where one could imagine
a North Pagai population would fit. Unfortunately, it is likely the North Pagai
population of Kloss’s gibbons has disappeared due to logging on the island
(Whittaker, 2005) and so could not be included in this work. Due to the link between
F1 and the island chain geography, and that F1 represents a higher percentage of
variation in the overall sample (F1=63.3%; F2=36.7%) I am inclined to conclude that
F1 is a better indicator of island than F2 (‘Notes/second in pre-trill’). Despite this, the
variable ‘Duration of 1st note’ is the most diverse intra-individual variable and
therefore is not a suitable variable for analysis at a higher level of grouping.
Therefore the clinal relationship is not valid.
As a further point of conflict, a similar geographic relationship in tree frogs
demonstrated an environmental influence (Ralin, 1977). The two species of tree frog
were thought to have different vocalisations due to a genetic basis, however, it was
discovered the species could converge in vocal characteristics when in the same
environment. The likelihood of this being the case in gibbons is small because the
gibbon song is far more complex than that of tree fogs, however, it must be
considered that influences other than genetics may exist.

60
CONCLUSION FOR INTER-ISLAND DIVERSITY
In conclusion, the null hypothesis for no significant inter-island diversity can be
rejected. The inter-island diversity initially implies a clinal relationship between the
islands, which corresponds to their geographic relationship. However, this
relationship is dismissed on consideration of further evidence.
4.6. A SIBERUT GROUP, AND A SIPORA & SOUTH PAGAI GROUP
The motivation for a combined Sipora and South Pagai to be compared to Siberut was
to assess whether Kloss’s gibbons can be recommended for classification simply as a
species, or as a species consisting of Evolutionarily Significant Units (ESUs). Siberut
and the other three islands would be most likely to have this division between them,
because the Mentawai monkeys are all separated into two subspecies or species along
this division. The Mentawai langur and the snub-nosed pig-tailed langur were both
classified into two subspecies by Chasen and Kloss (1927) on the first expedition to
the Mentawais to classify animals. Both langurs were described as being one
subspecific form on Siberut and a different subspecific form on Sipora and the Pagais.
The Mentawai macaque has recently been elevated to two species, one on Siberut and
one on the other three islands (Roos et al., 2003).
4.6.1. EVOLUTIONARILY SIGNIFICANT UNITS (ESUS)
The results section shows contrasting discriminant function analyses for classification
into the Siberut group or into the Sipora & South Pagai group. The first classification,
which used all the variables, predicts the classification of individuals unreliably
(62.5% of cases correctly assigned). This would suggest there is no significant
difference in vocal characteristics between the two groups and is provided further

61
support by the inter-island diversity already discussed (Section 4.5). Contrastingly,
the second classification, which removes just one variable (number of trill notes) has a
significantly reliable classification of individuals to their islands (79.2% of cases
correctly assigned). What this difference means is unclear but two main possibilities
exist: (1) The first classification is overshadowed by the variable ‘Number of trill
notes’ and therefore misses other important features, (2) There is no difference
between Siberut and the Sipora & South Pagai group, and the results are simply an
artefact of the highly variable data or of the statistical test.
Evidence for possibility (1) is found in the results (section 3.6). The variable used as
the function for the first classification has the same mean in Sikabei and South Pagai
which presents problems immediately obvious in classification, the two populations
must overlap. The two functions which cover the largest amount of variation used in
the second classification do not have this overlap problem suggesting they are the
better variables for discriminating between the island groupings. The possibility of
(2) is unlikely because of the inter-island classifications discussed in the previous
section (Section 4.5). In consideration of the possibilities I suggest possibility (1) is
the reason for such a dramatic increase in correct classification, however, the results
must be treated with caution because of the subjective manipulation of the data.
The results in this work are comparable to that in Whittaker (2005) who studied the
genetic phylogeography of the Kloss’s gibbon using the D-loop of mitochondrial
DNA (mtDNA). The mtDNA did not provide significant evidence to support the
Kloss’s gibbon species consisting of ESUs, however the sample was small and of
poor quality due to difficulties in collection of faecal samples. Whittaker (pers.

62
comm.) suggests a trend towards divergence between Siberut and the other islands,
despite the lack of significance.
In light of this evidence, I propose that the Kloss’s gibbon is undergoing a speciation
event whereby divergence between all islands is occurring, but that the level of
divergence is not yet sufficient to classify the species as containing more than one
ESU. Whittaker (2005) estimates the Mentawai Islands were last connected 7,000
years before present, however Mann (2005) notes that tectonic movements cause a
constant rising and dropping of the Mentawai Islands and this brings the methods of
estimation for the last connection event into question because they rely on the depth
of sea between the islands and corresponding sea level drops. Despite this, 7,000
years is a very short time in primate speciation events. To put this time in
perspective, the various species in the genus Hylobates evolved over a period of
800,000 (Chivers, 1977). Some speciation events can take longer, for example, three
spider monkey (Ateles) species diverged from each other 3.27 million years ago and
in the most recent divergence two subspecies of one of the afore mentioned species
diverged 0.34 million years ago (Collins & Dubach, 2000).
The validity of the Mentawai monkey classifications should be questioned and should
perhaps follow a similar classification to the Kloss’s gibbon. The Mentawai langur
was classified on the basis of just five specimens from Sipora and five from Siberut,
and diagnostic characters were mainly colour differences (Chasen & Kloss, 1927).
The problems are that with such a small sample, colour differences may simply be
polymorphisms within the population. The snub-nosed pig-tailed langur subspecific
classifications are based on a similarly small sample size (four individuals from
63
Sipora, three individuals from Siberut), the main difference of the Siberut species
(Simias concolor siberu) being, “…like S. concolor from Sipora island, but darker,
especially on the rump.” (Chasen & Kloss, 1927). The authors even admit the Siberut
female specimen cannot be distinguished from the Sipora specimens.
Mentawai macaques are currently classified as two species: one on Siberut and one on
Sipora and the Pagais; as a result of genetic analyses (Roos et al., 2003). However,
the specimen base from Siberut is highly unreliable: twelve individuals in total, only
five of which were actually sampled on Siberut. The rest are from Bukittinggi Zoo
and Padang (presumably pets), both on the Sumatran mainland (Whittaker, 2005).
Bukittinggi Zoo is in awful condition and it is very unlikely proper records are kept
for their animals and owners of pet macaques in Padang do not often know the
specific origin of their pets (pers. obs.). Further from this, the authors discuss the
Siberut macaque (Macaca siberu) as being more genetically similar to the mainland
form of the macaque (Macaca nemestrina), leading to the suggestion the origin of the
‘Siberut’ sample found on mainland Sumatra is not the Mentawais. Therefore, I do
not believe this study was sufficient to alter the original classification of one species
of Mentawai macaque to two separate species. ESUs for all Mentawai monkey
species need further research to either substantiate or disregard the studies that have
already taken place.
4.6.2. CONSERVATION IMPLICATIONS
The Kloss’s gibbon species can be treated as a species with no ESUs, however,
management strategies must also account for high levels of fragmentation of the
species and the beginning of divergence on the different islands. Unfortunately,

64
because the species is treated as containing no ESUs, focus may be put onto Siberut at
the cost of the other island populations, because the Siberut population is more viable
due to it being larger. Limited resources in conservation of the Mentawai Islands
means that Siberut is most often targeted, so some effort should go towards
highlighting Sipora and the Pagais before the Kloss’s gibbon stops being endemic to
the Mentawai Islands and is only endemic to Siberut.
CONCLUSION FOR SIBERUT, AND A SIPORA & SOUTH PAGAI GROUP DIVERSITY
The null hypothesis that there is no significant diversity between Siberut and a Sipora
& South Pagai group can be accepted. Although, the null hypothesis is accepted,
there is a trend towards divergence, with a boundary being between these two groups.
The Kloss’s gibbon is suggested to remain as a species with no ESUs, and the validity
of the classifications of the Mentawai monkeys are challenged.
4.7. CRITIQUE AND FUTURE RESEARCH
The data collection resulted in a smaller sample size of females than was expected.
This was because of the lack of a full pilot project in the Mentawai Islands, and that
the available information presented females as singing every three to four days
(Whitten, 1981). Time frames were set for each field site accordingly, however,
females sang less frequently than was suggested, with some listening posts being
visited for 7 days before a female was heard and recorded (pers. obs.). Future
research should account for this unpredictability in singing behaviour.
Sipora and South Pagai were each represented by only one field site which was
problematic because intra-island diversity could not be assessed for these two islands.
65
Inter-island diversity can only be assessed to a level of high reliability if it is pitched
against intra-island diversity, because of the premise that inter-island diversity will be
higher than intra-island diversity. This would have been of particular interest because
of the high inter-population diversity observed within this work. The lack of these
field sites was because of the logistical difficulties of finding new sites, and also
because of the small amount of remaining forest, particularly on North Pagai where it
is suggested the Kloss’s gibbon no longer exists (Whittaker, 2005; Fuentes, 1996/7).
Analysis in this work could have been improved by increasing the number of
variables measured/counted, however, it was useful to be able to directly compare this
work with that of Haimoff & Tilson (1985). Future research could use the recordings
already obtained and increase the number of variables examined. This would be
useful because it may be that important differences have been missed in this study
because they were not covered by the chosen variables. Research would also be
improved if a larger sample size was gained because of the high diversity within this
species. In addition, intra-individual diversity may be more constant if only females
of an age whereby the song is fully ‘practised’ were recorded. Although this sounds
good in principle, no Kloss’s gibbon populations exist where the age of all individuals
is known.
Inter-individual diversity among Kloss’s gibbons raises the possibility of using
vocalisations to monitor populations. If individuals can be distinguished, migration of
individuals between groups can be tracked, and a full record of females in an area at
any one time compiled. Vocal discrimination is not reliable enough to be used as the
sole method of monitoring, but combined with visual observation, would be a

66
powerful tool. The ability to monitor group composition changes would allow
stability of groups to be assessed. Stability may be linked to stability in the
environment and thus may indicate environmental changes and their effect on the
species.
Although this work has shown individual diversity, it can infer no more than a
potential for individual recognition. Playback experiments would help resolve
whether this potential has been realised by the species and whether neighbour-stranger
discrimination is used. Playback experiments could also be used to investigate the
function of gibbon song, and so this can be applied to all hylobatids (Geissmann, pers.
comm.). In theory this sounds reasonable because the solo songs of males and
females would make it easy to separate functions of each sex’s song. However,
Kloss’s gibbons have been observed in groups of up to fifteen (Whittaker, 2005).
Duets are thought to reinforce pair bonds (Ahsan, 2001) so the lack of these duets
combined with the presence of large groups means suggests that Kloss’s gibbon pairs
are not as tightly bonded as other hylobatid species.

67
5. SUMMARY OF DISSERTATION
(1) Intra-individual diversity was low and the null hypothesis was accepted. The
diversity is likely a function of age and environmental fluctuations.
(2) Inter-individual diversity varied greatly between populations but was significant in
all of the populations. Hypotheses to explain the inter-individual diversity are: (a)
Trilling as a handicap, (b) Neighbour-stranger discrimination, (c) Relaxed selection.
Neighbour-stranger discrimination is concluded to have the greatest influence, whilst
relaxed selection contributes a small influence.
(3) Inter-population diversity was significant and different conditions on the islands
are offered as explanations.
(4) Intra-island diversity in Siberut rejected the null hypothesis but is significant in
only one variable.
(5) Inter-island diversity is significant and appears to suggest a clinal relationship,
however, evidence directs the conclusion that this relationship is not valid.
(6) The Kloss’s gibbon species should remain without ESUs but does show evidence
of the beginnings of divergence and speciation. Conservation implications are
discussed and reassessment of classifications is suggested for the Mentawai monkeys.
(7) Future research should focus on playback experiments and the importance of the
‘recognition concept of species’ in hylobatids, and population monitoring using
vocalisations should be investigated for feasibility.

68
6. REFERENCES
Ahsan, M.S. (2001) Socioecology of the hoolock gibbon (Hylobates hoolock) in two
forests of Bangladesh. In: The Apes: Challenges for the 21st Century.
Conference Proceedings. Brookfield Zoo. Pp. 286-299.
Alpers, D.L., Van Vuuren, J., Arctander, P., Robinson, T.J. (2004) Population
genetics of the roan antelope (Hippotragus equinus) with suggestions for
conservation. Molecular Ecology 13 (7): 1771-1784
Ambrose, L. and Bearder, S.K. (1998) Identifying primate species from their calls.
Folia Primatologica 69 Supplement 1:406 (Abstract only)
Arcadi, A.C. (1996) Phrase structure of wild chimpanzee pant hoots: Patterns of
production and interpopulation variability. American Journal of Primatology
39: 159-178
Baroux, E., Avouac, J.P., Bellier, O. and Sébrier, M. (1998) Slip-partitioning and
fore-arc deformation at the Sunda Trench, Indonesia. Terra Nova 10 (3): 139-
144
Batchelor, B.C. (1979) Discontinuously rising late Cainozoic eustatic sea-levels, with
special reference to Sundaland, Southeast Asia. Geologie en Mijnbouw 58 (1):
1-20.
Bearder, S.K. (1995) Calls of the wild: When a bush baby calls, scientists listen.
Natural History 104 (8): 48-57
Bearder, S., Honess, P.E., Bayes, M., Ambrose, L. and Anderson, M. (1996)
Assessing galago diversity: A call for help. African Primates 2 (1): 11-15

69
Bee, M.A. and Gerhardt, H.C. (2000) Neighbour-stranger discrimination by territorial
male bullfrogs (Rana catesbeiana): I. Acoustic basis. Animal Behaviour 62:
1129-1140
Brandon-Jones, D., Eudey, A.A., Geissmann, T., Groves, C.P., Melnick, D.J.,
Morales, J.C., Shekelle, M. and Stewart, C.B. (2004) Asian primate
classification. International Journal of Primatology 25: 97-164
Brockelman, W.Y. (1984). Social Behaviour of Gibbons. Edinburgh University Press,
Edinburgh.
Cheyne, S. and Brule, A. (2002) Adaptation of a captive-raised gibbon to the wild.
Folia Primatologica 75: 37–39
Chivers, D.J. (1977). The lesser apes. In: Prince, Rainier & G.H. Bourne (eds.),
Primate Conservation. New York Academic Press, NY, pp 539-594
Clayton, N.S. (1990) Subspecies recognition and song learning in zebra finches.
Animal Behaviour 40: 1009-1017
Collins, A.C. and Dubach, J.M. (2000) Biogeographic and ecological forces
responsible for speciation in Ateles. International Journal of Primatology 21
(3): 421-444
Courtenay, D.O. and Bearder, S.K. (1989) The taxonomic status and distribution of
bushbabies in Malawi with emphasis on the significance of vocalizations.
International Journal of Primatology 10 (1): 17-34
Cowlishaw, G. and Dunbar, R. (2000) Primate Conservation Biology. The University
of Chicago Press. Pp. 105
Cowlishaw, G. (1992) Song function in gibbons. Behaviour 121 (1-2): 131-152
Dallmann, R., and Geissmann, T. (2001a) Different levels of variability in the female
song of wild silvery gibbons (Hylobates moloch). Behaviour 138: 629-648.

70
Dallmann, R., and Geissmann, T. (2001b) Individuality in the female songs of wild
silvery gibbons (Hylobates moloch) on Java, Indonesia. Contributions to
Zoology 70: 41-50.
Daugherty, C.H., Cree, A., Hay, J.M. and Thompson, M.B. (1990) Neglected
taxonomy and continuing extinctions of tuatara (Sphenodon). Nature 347:
177-179
Dring, J. C. M., C. J. McCarthy and A. J. Whitten (1990). The terrestrial herpetofauna
of the Mentawai Islands, Indonesia. Indo-Malayan Zoology 6: 119-132. Cited
in: Whittaker, D.J. (2005) Evolutionary Genetics of Kloss’ gibbons (Hylobates
klossii): Systematics, Phylogeography, and Conservation. Ph.D. thesis,
Graduate Faculty in Anthropology, The City University of New York.
Doutrelant, C., Blondel, J., Perret, P. and Lambrechts, M.M. (2000) Blue tit song
repertoire size, male quality and interspecific competition. Journal of Avian
Biology 31: 360-366
Eiler, K.C. and Banack, S.A. (2004) Variability in the alarm call of golden-mantled
ground squirrels (Spermophilus lateralis and S. saturatus). Journal of
Mammalogy 85 (1): 43-50
Elemans, C.P.H., Spierts, I.L.Y., Műller, U.K., van Leeuwen, J.L. and Goller, F.
(2004) Superfast muscles control dove’s trill. Nature 431: 146
Falk, D. (2000) Primate Diversity. New York, W. W. Norton and Company.
Fenton, M.B., Jacobs, D.S., Richardson, E.J., Taylor, P.J. and White, W. (2004)
Individual signatures in the frequency-modulated sweep calls of African large-
eared, free-tailed bats Otomops martiensseni (Chiroptera: Molossidae). Journal
of Zoology 262 (1): 11-19

71
Fischer, J., Hammerschmidt, K. and Todt, D. (1998) Local variation in barbary
macaque shrill barks. Animal Behaviour 56: 623-629
Fowler, J., Cohen, L. and Jarvis, P. (2002) Practical Statistics for Field Biology (2nd
Edn.). John Wiley & Sons. Pp. 135-137, 166-170, 210-233
Frankham, R., Ballou, J.D. and Briscoe, D.A. (2004) Intoduction to Conservation
Genetics. Cambridge University Press. Pp. 388-392
Friedl, T.W.P. and Klump, G.M. (2001) The vocal behaviour of male European tree
frogs (Hyla arborea): Implications for inter- and intrasexual selection.
Behaviour 139: 113-136
Fuentes, A. (1996/7) Current status and future viability for the Mentawai primates.
Primate Conservation 17: 111-116
Gamba, M., Cuminale, A. and Giacoma, C. (2002) Disturbance vocalizations in
Varecia variegata: Acoustic structure and sub-specific divergence. Folia
Primatologica 73 (6): 299-300 (Abstract only)
Gamba, M. and Giacoma, C. (2002) Subspecific divergence in the vocal repertoires of
Eulemur macaco macaco and Eulemur macaco flavifrons. Folia Primatologica
73: 299
Gamba, M. and Giacoma, C (2001) Comparison of the vocal repertoire of Eulemur
macaco subspecies. Folia Primatologica 72: 135 (Abstract only)
Geissmann, T. (2005) Gibbon systematics. <www.gibbons.de>, downloaded on the
17th February 2005.
Geissmann, T. (2003) Circumfacial markings in Siamang and evolution of the face
ring in the Hylobatidae. International Journal of Primatology 24 (1): 143–158
Geissmann, T. (2002). Duet-splitting and the evolution of gibbon songs. Biological
Reviews 77: 57-76.
72
Geissmann, T. (2002) Taxonomy and evolution of gibbons. Primatology and
Anthropology Supplement 1: 28-31
Geissmann, T. (1993). Evolution of communication in gibbons (Hylobatidae), Ph.D.
thesis, Anthropological Institute, Philosoph. Faculty II, Zürich University.
Geissmann, T. (1984). Inheritance of song parameters in the gibbon song, analyzed in
2 hybrid gibbons (Hylobates pileatus x H. lar). Folia Primatologica 42: 216-
235.
Geissmann, T., Bohlen-Eyring, S. and Heuck, A. (in press) The male song of the
Javan silvery gibbon (Hylobates moloch). Contributions to Zoology
Gittins, S.P. (1984) Territorial advertisement and defence in gibbons. In: Preuschoft
H, Chivers DJ, Brockelman WY& Creel N (eds.) The Lesser Apes.
Evolutionary and Behavioural Biology, Edinburgh University Press,
Edinburgh, pp. 420-424
Gittins, S.P. (1978) Hark! The beautiful song of the gibbon. New Scientist 14th
December 1978: 832-834
Goodman, S.M. and Ganzhorn, J.U. (2004) Biogeography of lemurs in the humid
forests of Madagascar: the role of elevational distribution and rivers. Journal of
Biogeography 31: 47-55
Groves, C.P. (2001). Primate taxonomy, Smithsonian Institution, Washington, D.C.
Haimoff, E.H. and Gittins, S.P. (1985) Individuality in the songs of wild agile gibbons
(Hylobates agilis) of peninsular Malaysia. American Journal of Primatology 8:
239-247
Haimoff, E.H. and Tilson, R.L. (1985). Individuality in the female songs of wild
Kloss' gibbons (Hylobates klossii) on Siberut Island, Indonesia. Folia
Primatologica 44: 129-137.

73
Holder, K., Montgomerie, R. and Friesen, V.L. (2004) Genetic diversity and
management of Nearctic rock ptarmigan (Lagopus mutus). Canadian Journal of
Zoology 82 (4): 564-575
Howitt, D. and Cramer, D. (2001) A Guide to Computing Statistics with SPSS for
Windows. Prentice Hall.
Howitt, D. and Cramer, D. (2000) An Introduction to Statistics in Psychology: A
Complete Guide for Students (2nd Edn.). Prentice Hall. Pp. 62-72, 176-186, 319-
333
IUCN, (2004) 2004 IUCN Red List of Threatened Species. <www.redlist.org>.
Downloaded on 19 October 2005.
Jordan, K., Weiss, D., Hauser, M. and McMurray, B. (2002) Antiphonal responses to
loud contact calls produced by Saguinus oedipus. International Journal of
Primatology 25 (2): 465-475
Konrad, R. and Geissmann, T. (2004). Vocal diversity and taxonomy of crested
gibbons (Nomascus spp.) in Cambodia. Folia Primatologica 75 Supplement 1:
288-289 (Abstract only).
Konrad, R. and Geissmann, T. (2006) Vocal diversity and taxonomy of the crested
gibbons (Genus Nomascus) in Cambodia. International Journal of Primatology.
In press.
de Kort, S.R., den Hartog, P.M. and ten Cate, C. (2002) Diverge or merge? The effect
of sympatric occurrence on the territorial vocalizations of the vinaceous dive
Streptopelia vinacea and the ring-necked dove S. capicola. Journal of Avian
Biology 33: 150-158
Lengagne, T. (2001) Temporal stability in the individual features in the calls of eagle
owls (Bubo bubo). Behaviour 138: 1407-1419

74
MacKinnon, K. (1987). Conservation status of primates in Malesia, with special
reference to Indonesia. Primate Conservation 8: 175-183.
MacKinnon, M. (1986). The conservation status of nonhuman primates in Indonesia.
In Benirschke, K. (ed.), Primates. The road to self-sustaining populations,
Springer-Verlag, New York and Berlin, pp. 99-126.
Mann, D. (2005) Tsunami and Earthquake Status of Padang and the Mentawai
Islands. Lecture delvered in Padang 15th June 2005. Chicago University.
Marler, P. and Hobbett, L. (1975) Individuality in a long-range vocalization of wild
chimpanzees. Zeitschrift Tierpsychol 38: 97-109. Cited in: Mitani, J.C.,
Hunley, R.L. and Murdoch, M.E. (1999) Geographic variation in the calls of
wild chimpanzees: A reassessment. American Journal of Primatology. 47:
133-151.
Marshall, J.T. and Marshall, E.R. (1976) Gibbons and their territorial songs. Science
193: 235-237
Marshall, J.T. and Sugardjito, J. (1986). Gibbon systematics. In Swindler, D. R., and
Erwin, J. (eds.), Comparative primate biology, vol. 1: Systematics, evolution,
and anatomy, Alan R. Liss, New York, pp. 137-185.
Meijaard, E. (2003) Mammals of south-east Asian islands and their Late Pleistocene
environments. Journal of Biogeography 30: 1245-1257
Mitani, J.C. (1985) Responses of gibbons (Hylobates muelleri) to self, neighbour and
stranger song duets. International Journal of Primatology 6 (2): 193-200
Mitani, J.C. (1987) Species discrimination of male song in gibbons. American Journal
of Primatology 13: 413-423
Mitani, J.C., Hasegawa, T., Gros-Louis, J., Marler, P. and Byrne, R. (1992) Dialects
in wild chimpanzees? American Journal of Primatology 27: 233-243
75
Mitani, J.C., Hunley, R.L. and Murdoch, M.E. (1999) Geographic variation in the
calls of wild chimpanzees: A reassessment. American Journal of Primatology.
47: 133-151.
Mittermeier, R.A., Valladares-Pádua, C., Rylands, A.B., Eudey, A.A., Butynski,
T.M., Ganzhorn, J.U., Kormos, R., Aguiar, J.M. and Walker, S. (2005)
Primates in peril, The World’s 25 Most Endangered Primates 2004–2006.
Moore, G. F., J. R. Curray, D. G. Moore and D. E. Karig, (1980). Variations in
geologic structure along the Sunda fore arc, northeastern Indian Ocean. In:
Hayes (Ed.). Tectonic and geologic evolution of South East Asian Seas and
Islands. Washington, D. C., American Geophysical Union.
Morris, R.C. (1943) Rivers as barriers to the distribution of gibbons. Journal of the
Bombay Natural History Society 43: 656
Myers, N., Mittermeier, R.A., Mittermeier, C.G., da Fonseca, G.A.B. and Kent, J.
(2000) Biodiversity hotspots for conservation priorities. Nature 403: 853-858
Paciulli, L. M. (2004). The effects of logging, hunting, and vegetation on the densities
of the Pagai, Mentawai Islands primates. Ph.D. thesis, Department of
Anthropology, State University of New York, Stony Brook.
Paterson, H.E.H. (1985). The recognition concept of species. In: Vrba, E.S. (ed.),
Species and Speciation. Transvaal Museum Monograph No. 4, Pretoria. Pp. 21-
29 Cited in: Templeton (1989) The meaning of species and speciation: A genetic
perspective. In: Speciation and its Consequences. omniscellula.net
Puglisi, L. and Adamo, C. (2004) Discrimination of individual voices in male great
bitterns (Botaurus stellaris) in Italy. The Auk 121 (2): 541-547

76
Radford, A.N. and du Plessis, M.A. (2004) Territorial vocal rallying in the green
woodhoopoe: factorsaffecting contest length and outcome. Animal Behaviour
68: 803-810
Ralin, D.B. (1977) Evolutionary aspects of mating call variation in a diploid-
tetraploid species complex of treefrogs (Anura). Evolution 31: 721-736
Reby, D., Hewison, M., Izquierdo, M. and Pépin, D. (2001) Red deer (Cervus
elaphus) hinds discriminate between the roars of their current harem-holder stag
and those of neighbouring stags. Ethology 107: 951-959
Rodríguez-Robles, J.A., Denardo, D.F. and Staubs, R.E. (1999) Phylogeogaphy of the
California mountain kingsnake, Lampropeltis zonata (Colubridae). Molecular
Ecology 8: 1923-1934
Rogers, T.L. and Cato, D.H. (2002) Individual variation in the acoustic behaviour of
the adult male leopard seal, Hydrurga leptonyx. Behaviour 139: 1267-1286
Roos, C. and Geissmann, T. (2001) Molecular phylogeny of the major Hylobatid
divisions. Molecular Phylogenetics and Evolution 19 (3): 486-494
Roos, C., Ziegler, T., Hodges, JK., Zischler, H. and Abegg, C. (2003) Molecular
phylogeny of Mentawai macaques: Taxonomic and biogeographic implications.
Molecular Phylogenetics and Evolution 29 (1):139-150
Sodhi, N.S., Koh, L.P., Brook, B.W. and Ng, P.K.L. (2004) Southeast Asian
biodiversity: an impending disaster. Trends in Ecology and Evolution 19 (12):
654-660
Templeton, A.R. (1989) The meaning of species and speciation: A genetic
perspective. In: Speciation and its Consequences. omniscellula.net
Tenaza, R. (1989) Social behaviour and conservation of Simias concolor in the Pagai
islands. (Abstract) American Journal of Physical Anthropology 78 (2):314

77
Tenaza, R. (1985). Songs of hybrid gibbons (Hylobates lar x H. muelleri). American
Journal Primatology 8: 249-253.
Tenaza, R.R. (1975) Territory and monogamy among Kloss’ Gibbons (Hylobates
klossii) in Siberut Island, Indonesia. Folia Primatologica 24: 60-80
Tenaza, R.R. and Fuentes, A. (1995) Monandrous social organisation of pig-tailed
langurs (Simias concolor) in the Pagai islands, Indonesia. International
Joiurnal of Primatology 16 (2):295-310
Tenaza, R.R. and Hamilton, W.J. (1971) Preliminary observations of the Mentawai
Islands gibbon, Hylobates klossii. Folia Primatologica 15: 201–211
Tenaza, R.R. and Tilson, R.L. (1977) Evolution of long-distance alarm calls in kloss’s
gibbon. Nature 268: 233–235
Tenaza, R.R. and Tilson, R.L. (1985) Human predation and Kloss’s Gibbon
(Hylobates klossii) sleeping trees in Siberut Island, Indonesia. American
Journal of Primatology 8: 299–308
Tilson, R.L. (1981) Family formation strategies of Kloss’s Gibbons. Folia
Primatologica 35: 259-287
Tilson, R.L. and Tenaza, R.R. (1982) Interspecific spacing between gibbons
(Hylobates klossii) and langurs (Presbytis potenziana) on Siberut Island,
Indonesia. American Journal of Primatology 2: 355–361
TNS (Siberut National Park) (Date unknown) Siberut National Park Management
Zones Map.
Voris, H.K. (2000) Maps of Pleistocene sea levels in Southeast Asia: shorelines, river
systems and time durations. Journal of Biogeography 27: 1153-1167

78
Watkins, W.A. and Schevill, W.E. (1979) Distinctive characteristics of underwater
calls of the harp seal (Phoca groenlandica) during the breeding season.
Journal of the Acoustic Society of America 64: 983-988
Whittaker, D.J. (2005) Evolutionary Genetics of Kloss’ gibbons (Hylobates klossii):
Systematics, Phylogeography, and Conservation. Ph.D. thesis, Graduate
Faculty in Anthropology, The City University of New York.
Whittaker, D. J., Morales, J. C., and Melnick, D. J. (2004). Phylogeographic structure
of Kloss's gibbon (Hylobates klossi) populations. Folia Primatologica 75
Supplement 1: 113 (Abstract only).
Whitten, A.J. (1981) The ecology of singing in Kloss Gibbons (Hylobates klossii) on
Siberut Island, Indonesia. International Journal of Primatology 3 (1): 33–51
Whitten, A.J. (1982a) Diet and feeding behaviour of Kloss Gibbons on Siberut Island,
Indonesia. Folia Primatologica 37: 117–208
Whitten, A.J. (1982b) Home range use by kloss gibbons (Hylobates klossii) on
Siberut Island, Indonesia. Animal Behaviour 30: 182–198
Whitten, A.J. (1982c) A numerical analysis of tropical rain forest, using floristic and
structural data, and its application to an analysis of gibbon ranging behaviour.
Journal of Ecology 70: 249-271
Whitten, A.J. (1984a) Ecological comparisons between Kloss gibbons and other small
gibbons. In: Preuschoft H, Chivers DJ, Brockelman WY& Creel N (eds.) The
Lesser Apes. Evolutionary and Behavioural Biology, Edinburgh University
Press, Edinburgh, pp. 219–227

79
Whitten, A.J. (1984b) The trilling handicap in Kloss gibbons. In: Preuschoft H,
Chivers DJ, Brockelman WY& Creel N (eds.) The Lesser Apes. Evolutionary
and Behavioural Biology, Edinburgh University Press, Edinburgh, pp. 416–
419
WWF (2001) Mentawai Islands Rain Forests. Retrieved on 8th October 2005 from
World Wide Web: www.worldwildlife.org
Zahavi, A. (1975) Mate selection – A selection for handicap. Journal of Theoretical
Biology 53: 205-214

80
APPENDIX I
GPS WAYPOINTS:
Simabuggai: LP1 S 01º 22’ 29.9’’ 41m
E 098º 56’ 35.2’’
LP2 S 01º 23’ 13.5’’ 140m
E 098º 56’ 59.7’’
LP3 S 01º 22’ 26.7’’ 65m
E 098º 56’ 54.4’’
LP4 S 01º 22’ 37.0’’ 22m
E 098º 56’58.7’’
Sikabei: LP1 S 01º 37’ 07.1’’ 39m
E 099º 15’ 15.7’’
LP2 S 01º 36’ 36.7’’ 18m
E 099º 15’ 26.3’’
LP3 S 01º 37’ 20.1’’ 41m
E 099º 15’ 41.6’’
LP4 S 01º 36’ 44.8’’ 120m
E 099º 15’ 00.1’’
S.Pagai: LP1 S 02º 58’ 00.9’’ 215m
E 100º 17’ 15.5’’
LP2 S 02º 58’ 06.1’’ 221m
E 100º 18’ 12.6’’
LP3 S 02º 58’ 05.2’’ 269m
E 100º 17’ 45.1’’
LP4 S 02º 57’ 26.7’’ 194m
E 100º 18’ 35.6’’
LP5 S 02º 57’ 54.3’’ 231m
E 100º 18’ 38.8’’
LP5+ S 02º 57’ 59.3’’ 209m
E 100º 18’ 39.2’’
Saureinu: LP1 S 02 07’ 15.5’’ 97m
E 099 38’ 04.1’’
LP3 S 02 07’ 52.0’’ 140m
E 099 37’ 33.7’’
LP4 S 02 07’ 49.2’’ 145m
E 099 37’ 01.7’’
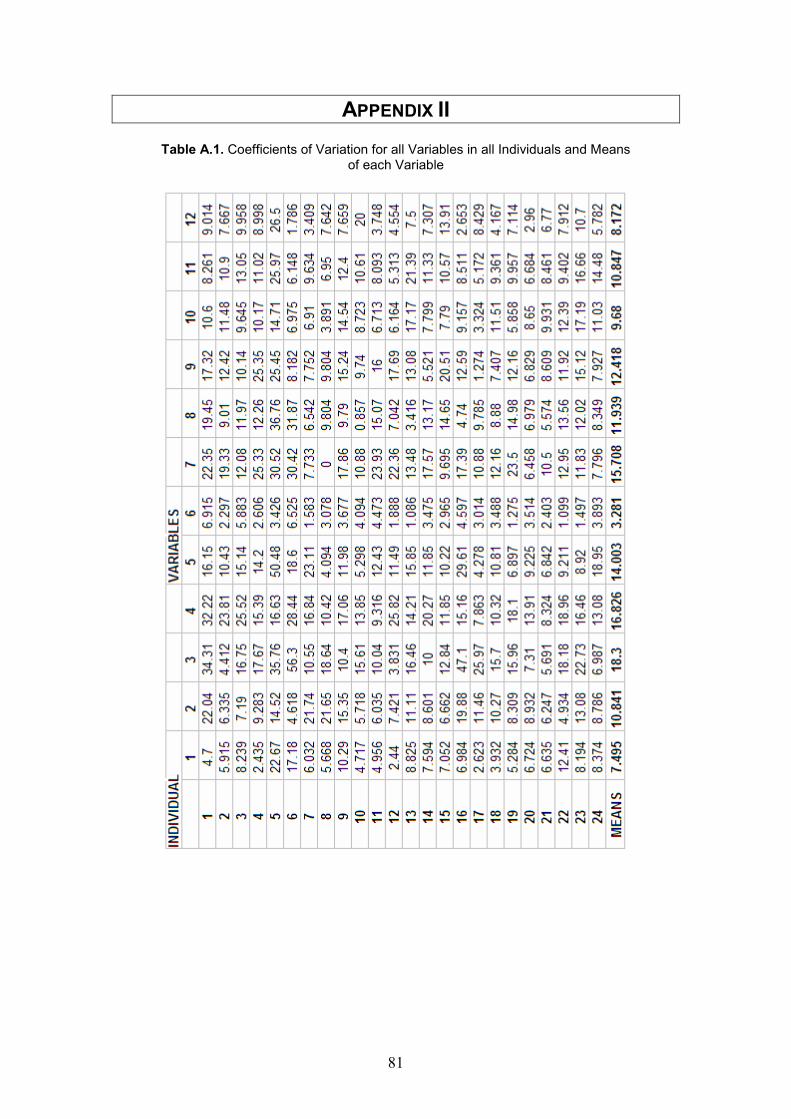
81
APPENDIX II
Table A.1. Coefficients of Variation for all Variables in all Individuals and Means of each Variable

82
APPENDIX III
Key to table: Island 1 – Siberut, 2 – South Pagai, 3 – Sipora Pop. 1 – Simabuggai, 2 – Sikabei, 3 – South Pagai, 4 - Saureinu
Ind. = Individual GC # = Great call number
Table A.2. Data set of all Variables from all Individuals and all Great Calls

83

84
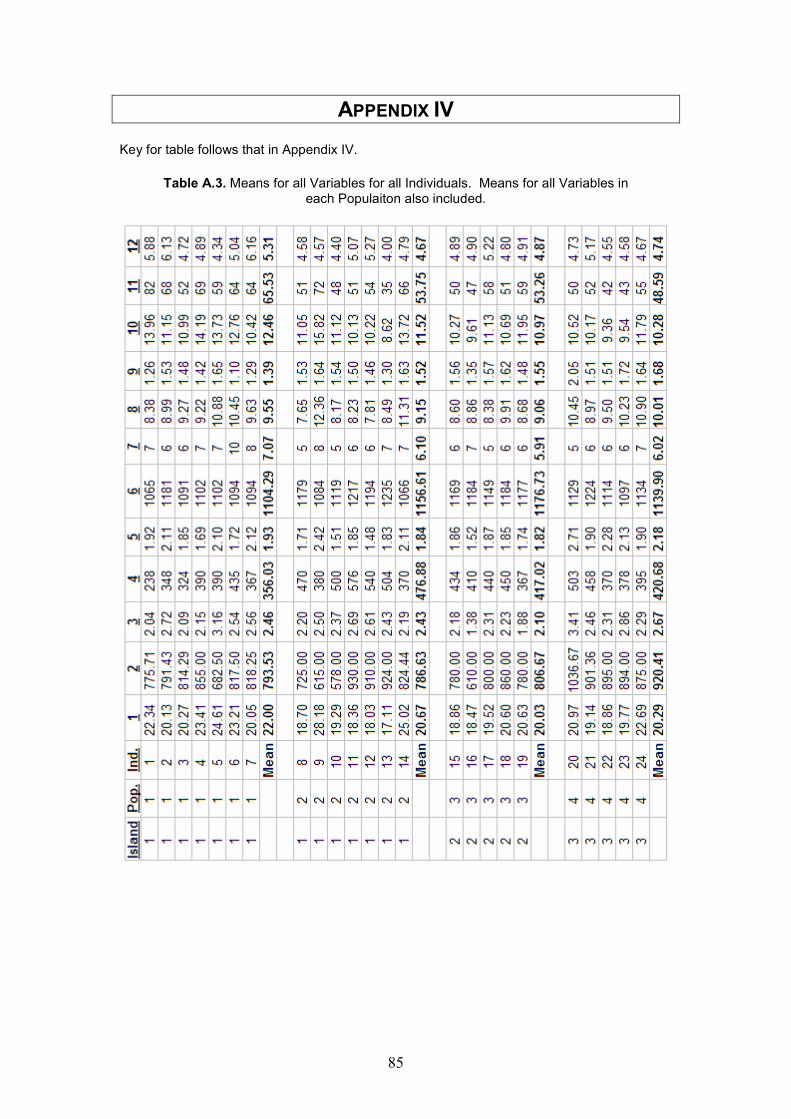
85
APPENDIX IV
Key for table follows that in Appendix IV.
Table A.3. Means for all Variables for all Individuals. Means for all Variables in
each Populaiton also included.