Embed Size (px)
DESCRIPTION
This proposal was prepared by diverse, interdisciplinary graduate students with a passion for real estate. For more details on many of the students that created this proposal: http://www.reuw.washington.edu/currentstudents/2013class.html As a capstone output for the two-year UW MSRE curriculum, many of the program's students participate in an intensive Real Estate Development Studio. This year's studio was focused on generating an exciting waterfront redevelopment proposal for South Lake Union in response to the 2013 NAIOP Real Estate Challenge.
Citation preview

BLOCK 25 + LAKE UNION WATERFRONT2013 NAIOP ChallengeUniversity of WashingtonRunstad Center for Real Estate StudiesMSRE Studio
Prepared for VULCAN REAL ESTATE byAQUA VIEW CONSULTING
Thank you to NAIOP and Vulcan Real Estate for the incredible opportunity to challenge ourselves and hopefully make a meaningful contribution to an exciting new chapter in Seattle’s history.
Our team received tremendous help from the NAIOP Competition Committee, our professors Al Levine and Chris Bitter, as well as the following professionals who went out of their way to inform and provide feedback for our proposal:
Maria Barientos, Barrientos Development Dana Behar, HAL Real Estate Frank Bosl, CBRE Susie Detmer, Cushman & Wakefield Hal Ferris, Spectrum Development John D. Gordon, Kidder Mathews Matt Goyer, RedFin, Urbnlivn.com Gabe Grant, HAL Real Estate John Hempelmann, Cairncross & Hempelmann Douglas Howe, Touchstone Greg Johnson, Wright Runstad & Company Judith Kalitzki, Foster School of Business Bruce Lorig, Lorig Associates John McAllister, Northwestern Mutual Real Estate Investments, LLC Steven O’Connor, University of Washington Runstad Center for Real Estate Studies PJ Santos, Lorax Partners Scott Shapiro, Eagle Rock Ventures, LLC Jonas Sylvester, Unico Val Thomas, Val Thomas, Inc. Jason Twill, Vulcan Real Estate
It has been exciting and enlightening working with so many talented people thoughout this process.
Sincerely, Aqua View Consultants Obi Amobi Michael Kaiser Daren Dai Leanna Li Drew Dresman James Mayton Liat Gofman Yasuhiro Sakaue Yoshinori Hirano Ji Shon Alvaro Jimenez Jimenez
THANK YOU!
Aqua View Consultants
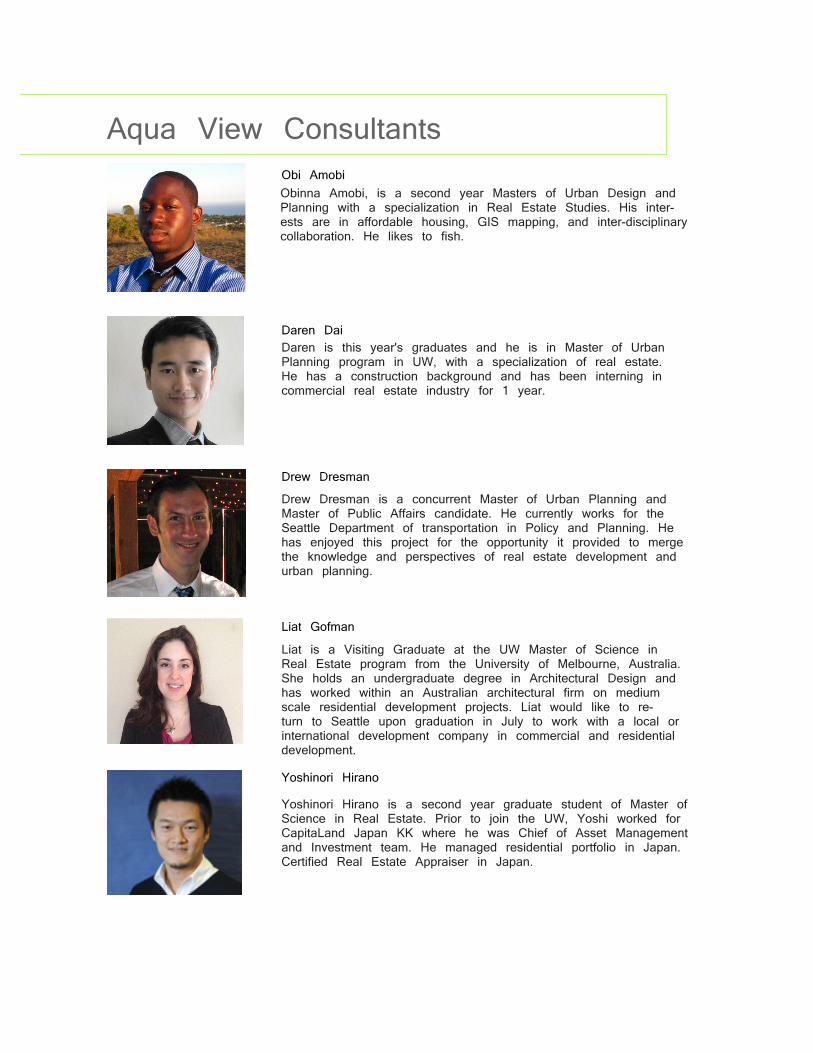
Liat is a Visiting Graduate at the UW Master of Science in Real Estate program from the University of Melbourne, Australia. She holds an undergraduate degree in Architectural Design and has worked within an Australian architectural firm on medium scale residential development projects. Liat would like to re-turn to Seattle upon graduation in July to work with a local or international development company in commercial and residential development.
Daren is this year's graduates and he is in Master of Urban Planning program in UW, with a specialization of real estate. He has a construction background and has been interning in commercial real estate industry for 1 year.
Obi Amobi
Daren Dai
Drew Dresman
Liat Gofman
Yoshinori Hirano
Yoshinori Hirano is a second year graduate student of Master of Science in Real Estate. Prior to join the UW, Yoshi worked for CapitaLand Japan KK where he was Chief of Asset Management and Investment team. He managed residential portfolio in Japan. Certified Real Estate Appraiser in Japan.
Drew Dresman is a concurrent Master of Urban Planning and Master of Public Affairs candidate. He currently works for the Seattle Department of transportation in Policy and Planning. He has enjoyed this project for the opportunity it provided to merge the knowledge and perspectives of real estate development and urban planning.
Obinna Amobi, is a second year Masters of Urban Design and Planning with a specialization in Real Estate Studies. His inter-ests are in affordable housing, GIS mapping, and inter-disciplinary collaboration. He likes to fish.

Originally from Vancouver, BC, Michael moved to Seattle for the Master of Architecture program at UW, adding a Master of Science in Real Estate along the way. He is looking forward to the conclusion of both degrees, with the presentation of a Seattle-based speculative alternative-tourism project this June. But most importantly, he is also the proud father of a two-month-old daughter.
Yasuhiro is a banker with 11 years of experience in real estate financing and investment. His employer, the Norinchukin Bank invests about $700 billion into various asset classes all over the world, including more than $10 billion in real estate related assets. His experience in finance & investment were instrumental for developing the financial plans in this proposal.
Alvaro Jimenez Jimenez
Michael Kaiser
Leanna Man Li
James Mayton
Yasuhiro Sakaue
Ji Shon
Alvaro’s core background relies on real estate, banking, and economics. In his young career, Alvaro has received important awards and recognitions. He also has studied and worked in major cities like Barcelona, LA, London, and Seattle. His exper-tise focuses in financial analysis, entrepreneurship, and manage-ment. His personal and professional philosophy is: “As far as I can, with everything I have”.
James' experience with CBRE on the Microsoft corporate services account and on the Washington CoreNet Chapter board gives him a unique understanding of the future needs of corporate tech ten-ants. As such, he's passionate about helping Seattle develop into a competitive global city capable of growing, attracting, and retain-ing world-class human capital.
Leanna’s passion in real estate is the intersection of urban plan-ning and corporate development. She has worked for Siemens, Seattle Preservation and Development Authority (SCIDPDA) and a Washington based Real Estate Fund Management Company, focusing on real estate project due diligence, market research, feasibility analysis, and business strategy. She holds a Bache-lor of Management in Real Estate and was awarded a CoreNet Scholarship in 2012.
Ji is pursuing a concurrent Master of Architecture and Master of Science in Real Estate from the University of Washington. Ji studied architecture at Smith College and was a driving force behind the design and vision for this proposal.

1 Executive Summary
2 Context
3 Uses & Programming
4 Design
5 Financial Analysis
6 Conclusion
Appendix
Table of Contents
Herzog & de Meuron’s 56 Leonard Street; one of the case studies which informed our design

1.0 Synopsis 1.1 Primary Conclusions 1.2 Vision 1.3 Design Overview 1.4 Uses & Programming Overview
1.0 SynopsisAquaview Consultants advise Vulcan to develop the Block 25 and Lake Union Waterfront Sites in accordance with the following proposal:
Block 25 is best suited for a tower-and-podium project. The tower is an upscale 24 story condominium tower, and the podium contains an eight story, high-end hotel. The podium also contains upscale fitness, cinema and dining facilities, with parking and grocery uses as well.
The Lake Union Waterfront site is best suited for a waterfront destination center, adding a world class thermal pools facility, restaurants, and event space in the form of a repurposed Discovery Center. The site is enhanced by boardwalks, plazas and small scale retail.
1.1 Primary Conclusions1. The Waterfront as Catalyst The Lake Union Waterfront has the potential to increase the value of the Mercer Blocks and beyond. South Lake Union will increase its competitiveness as a technology and life sciences hub by capitalizing on its best natural asset—the urban Lake—which simply cannot be duplicated. However, besides Gasworks Park on the north end of the Lake, there are few places for Seattleites to relax and engage with the Lake. Lake Union Park is a component of a destination, not a destination unto itself. By developing and reprogramming Henry Pier and Chandler’s Cove with destination entertainment, event space and dining, enabled by boardwalks and small plazas, we create a true multi-use destination. This development will create value for the Mercer
Executive Summary
Birds-eye view of the Waterfront (foreground) with Block
25 at rear.

Blocks--especially Block 25--and the rest of South Lake Union.
2. Fulfilling Vulcan’s requirement for a 24/7 community In our analysis of the site and its locational context in South Lake Union, we found it to be a few amenities short of a well-rounded, 24/7 community. The Waterfront fulfills some missing recreation and leisure amenities, while Block 25 provides for hotel, condominium, fitness, entertainment, dining and grocery.
3. Iconic Site and Neighborhood Identity The Mercer Blocks and The Lake Union Waterfront have a once in a lifetime opportunity to develop a truly iconic piece of Seattle; the shore of an urban Lake in the fastest growing district in a city known for its water imagery. These are high profile sites, with an ability to shape how South Lake Union is perceived. A successful development here can give South Lake Union the identity it has lacked until now; partly through iconic, landmark architecture, and partly through its ability to create holistic experiences at the ground plane and along the lakeshore. Needless to say, a landmark hotel and condominium will command premiums in excess of a generic development at this location, and this proposal targets high end product in each category.
4. Development timing. Block 25 and the Waterfront are to be developed simultaneously, with a 2017 completion date. The market projects favorably for both hotel and condominium uses, and South Lake Union is expected to continue its growth in the near future. Key financial metrics are discussed in greater detail in the Financial section of this proposal.
1.2 VisionVISION: A Strong Identity for a World Class Community
SLU has become a national success in the tech and life science industries, but it is still on a search for a lasting identity. A stronger identity will make for a stronger South
Lake Union. South Lake Union needs to continue to develop into a world class neighborhood to continue to attract world class talent, and Block 25 and the Waterfront provide this once-in-a-lifetime opportunity. By capitalizing on South Lake Union’s connection to the Lake, we provide an identity for SLU that cannot be duplicated or replicated.
The AquaView Proposal links South Lake Union with its namesake, creating a true destination leisure and recreation area. This proposal adds much needed
Boardwalk/Promenade on Chandler’s Cove. Aqua
View rendering.

amenities to the already-successful South Lake Union district, cementing its standing as a livable, workable, 24/7 community, achieving Vulcan’s investment goals while adding value to the entire area.
We believe that by implementing the AquaView Proposal, South Lake Union will continue its forward momentum, developing into the amenity-rich, world class, perpetually competitive community that it aspires to be.
1.3 Design OverviewThe Aqua View Proposal considers the Mercer Blocks and the Waterfront as a cohesive whole, establishing synergies of use that will enable both projects. As a whole, the area becomes a pedestrian-centered destination worth traveling to, whether it be from across busy
Mercer Street, or from across town.
By creating a destination waterfront, we provide South Lake Union with its strongest identity. This identity is strengthened by the iconic architecture of the Mercer Blocks, specifically the 240’ towers, setting South Lake Union apart from its competition.
The Waterfront also provides South Lake Union with a recreational/leisure area that is both escapist and connective. Pedestrian/Cyclist paths run through the site, connecting the user with the Lake, and providing a respite from pavement and traffic.
The amenities on the Waterfront enable the visitor to experience the Site in a variety of ways; through dining, bathing, boating and special events, or simply strolling, exercising or relaxing outdoors. On the long pedestrian path around Lake Union, this is the only true destination, where the Lake meets the City.
1.4 Uses & Programming OverviewThe Aquaview Proposal carefully considers the potential uses on this site for maximum synergy between the Mercer Blocks and the Waterfront. The ideal use will strengthen the identity of the Sites as unique destinations, attracting both residents and visitors, while providing the amenities that South Lake Union needs to become a truly livable, 24/7 neighborhood.
USES & PROGRAMMING: BLOCK 25
Executive Summary
View of the Aloha Path through Henry Pier’s system
of multi-level deck space. Aqua View Rendering

Block 25 turns the existing north-south alley into a linear east-west plaza, bisecting the site. This allows lower, non-view hotel rooms to have a quiet ‘courtyard’ environment, and all uses benefit from the interior street. The interior street also provides a more immediate respite from the hum of Mercer, from those crossing the street on their way to Block 25 or the Waterfront. Furthermore, if the same east-west linear plaza is continued through to Blocks 26 and 27, the three blocks can function as a cohesive whole, strengthening the sub-district between Mercer Street and Lake Union.
In addition, the tower is placed according to the zoning requirements of the site. The unique architecture suggested in the renderings confirm the building as an iconic new piece of the Seattle skyline, visible from points throughout Seattle.
Block 25 is the obvious choice of the three Mercer Blocks to contain the high end hotel that the district needs, given that it is the first to be developed, and that it is directly across Valley Street from the Waterfront and its inevitable tourist traffic.
BLOCK 25 OVERVIEW:
CONDOMINIUMS: The project is scheduled to come on line in 2017, when we forsee an increase in demand in the Seattle condominium market.
HOTEL: South Lake Union needs an upscale hotel closer to the heart of the district, surrounded by the type of amenities that are desirable to visitors.
BLOCK 25 OVERVIEWTotal SF 560,345Condominium SF: 220,500 Hotel SF: 116,000Retail SF: 57,600Parking SF: 161,184Grocery SF: 5,000
BLOCK 25 CONDOMINIUMSTotal SF: 220,500Number of Units: 156 high end units Average SF/Unit: 1,200Average Sale Price: $1,200,000Tower floors 4th through 24th Condo Parking Stalls: 172 (1.1 ratio)
BLOCK 25 HOTELHOTEL: Total SF: 116,000Number of Units: 168 Average SF/Unit: 400Average Daily Rate: $200Assumed Occupancy: 75%RevPAR: $150Hotel Parking Stalls: 78 (0.46 ratio)
BLOCK 25 RETAILTotal SF: 57,600General SF: 17,200Restaurant SF: 10,400 (4 Rest.)Fitness SF: 8,000Cinema SF: 22,000 (3 screens)Retail Parking Stalls: 188 (1 per 306 SF)
BLOCK 25 PARKINGTotal SF: 161,184Total Stalls: 437Below ground Stalls: 242Above ground Stalls: 195

RETAIL:Block 25 includes an upscale Fitness Club, an iPic-type Cinema, two primary restaurants with great views of Lake Union, a couple of smaller casual dining options, and a smaller Grocery store.
PARKINGDue to the high water table, only one underground parking floor is permissible. The full floor of underground parking is supplemented by parking areas on Floors 1-3.
USES & PROGRAMMING: WATERFRONT – HENRY PIERHenry Pier will be transformed with public boardwalks and plazas, with one new café and a new bar in new buildings. The Discovery Center, currently serving as the marketing center for South Lake Union, was always intended to be dismantled in large pieces and moved; The Proposal suggests that the Discovery Center should be split into two units and placed on the Henry Pier site, one piece facing Valley Street and one facing Lake Union. The larger of the two will be used for event space on the Waterfront, the smaller will be a Sales and Promotion Center for the Mercer Blocks and the Waterfront, eventually transitioning to an information/tourism center. Small scale retail space will also be provided for seasonal uses. The undulating boardwalk will be one of the best places in Seattle to connect with people and the water during the summer, and the retail uses will ensure that the Pier remains a year-round destination.
USES & PROGRAMMING: WATERFRONT – CHANDLER’S COVE PIERChandler’s Cove Pier starts with the continuation of the Aloha Path boardwalk and additional outdoor spaces for gathering and people watching. When the weather is less desirable, Chandler’s Cove Pier also shines with a world class thermal pools attraction, supplemented by high end restaurants. This proposal allows Joey’s restaurant to remain as is.
The Thermal Pools are situated at the very north end of the pier, as close to the Lake as possible. While Lake Union is actually rather toxic and cold, the heated indoor and outdoor Thermal Pools provide a great way to engage the water during the long Seattle winters.
1.4 Uses & Programming Overview
Executive Summary
OVERVIEW: HENRY PIERTotal Interior Space SF: 13,300Discovery Center Event Space SF: 7,500Discovery Sales Center SF: 3,500Small shops (café, bar, etc.) SF: 2,300
OVERVIEW: CHANDLER’S COVEBuilding 1 (Joey’s) SF: 13,300Building 2 (North) SF: 42,800 Thermal Pools 28,900 Restaurant 10,800 General 3,100Building 3 (South) SF: 26,300 Restaurant 20,000 General 6,300
Intentionally left blank

Context
2.0 Context Overview 2.1 History & Neighborhood Context 2.2 Site Analysis 2.3 Key Demographic Trends 2.4 Key Market Trends
2.0 Context OverviewIn a globalized world where more and more people are finding their dreams in urban environments, there is still a certain mystique to be found in living near the water. Seattle derives tremendous value from its relationship with its many bodies of water. Made up of almost 41% water, Seattle is one of the few cities in the nation with the ability to provide residents and businesses to take advantage of the incredible possibilities that come with waterfront development. Yet despite the potential for greatness, opportunity is not always realized on an individual basis; but in an ever-changing urban environment opportunity is always around the corner.With the changes that will be set in motion due to the rezone of South Lake Union, our site holds tremendous potential to become Seattle’s next landmark. Our proposal seeks to take advantage of this once in a lifetime opportunity and bring new vibrancy to the neighborhood. The combination of views of Lake Union, a central location, high visibility, and one of the fastest growing neighborhoods in the city position our site to accommodate a high performing, visually stunning development that will enhance the neighborhood and add value to current as well as future Vulcan investments.
2.1 History & Neighborhood ContextAlready the largest city in the Northwest region of the United States, Seattle boasts one of the fastest growing economies and populations in the nation. Since its earliest stages of
urban development, the city of Seattle grew around industry. From its inception as a timber town, to its boom during the gold rush, to the prominent rise of Boeing, to its present status as a national hub for biotech and software development.Throughout Seattle’s many stages of growth, its central regions have always played a key role due to the city’s intricate connection to the water that surrounds it, with the ship canal running through the middle of the city and the city’s port having been established as one of the busiest in the nation. That being said, it should be no surprise that the neighborhood that developed on the edge of the water even today remains one of the key regions of the city.
Located in the heart of Seattle, the neighborhood of South Lake Union was one of the first of the city to be developed by early settlers. The neighborhood soon rose in prominence as pioneer David Denny bought a land claim to a large portion of land, now known as the Denny Triangle, which led to the eventual development of the city’s largest saw mill, as Seattle was primarily a timber town at the time. Thus South Lake Union became home to industry, and the families of workers from the mill. In the years to come, Denny’s impact was made more
permanent as he participated in the extension of the canal to connect the Puget Sound to Lake Washington.
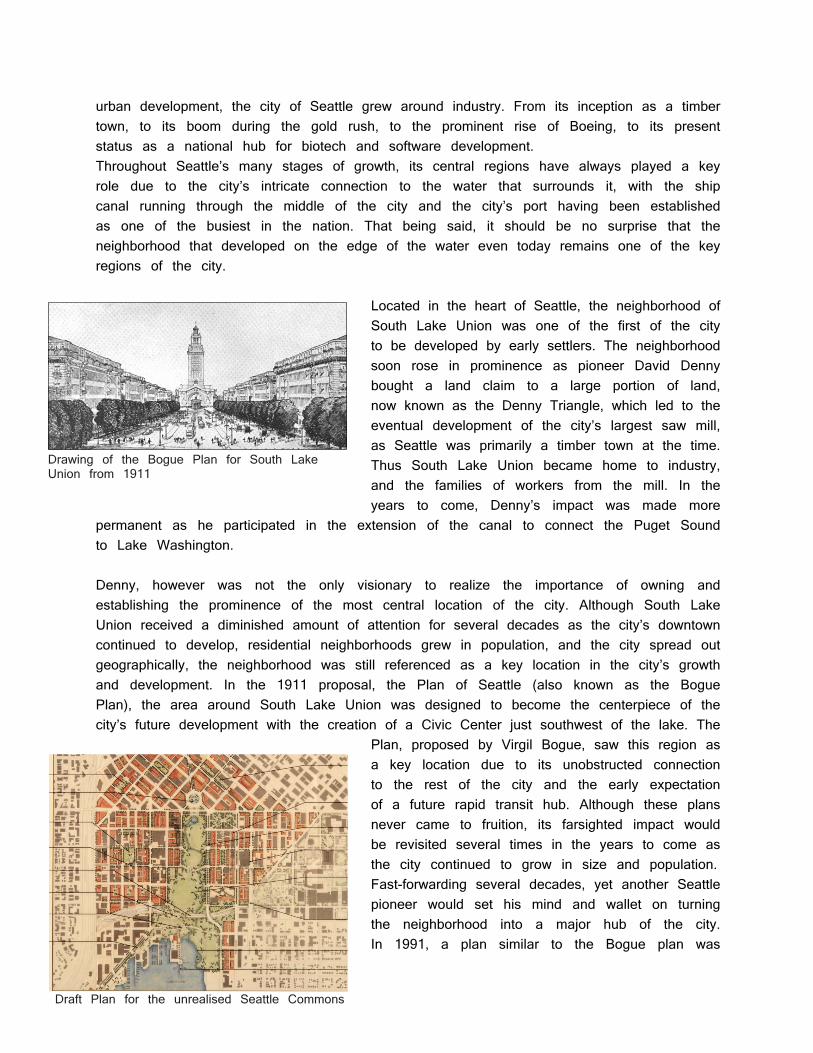
Denny, however was not the only visionary to realize the importance of owning and establishing the prominence of the most central location of the city. Although South Lake Union received a diminished amount of attention for several decades as the city’s downtown continued to develop, residential neighborhoods grew in population, and the city spread out geographically, the neighborhood was still referenced as a key location in the city’s growth and development. In the 1911 proposal, the Plan of Seattle (also known as the Bogue Plan), the area around South Lake Union was designed to become the centerpiece of the city’s future development with the creation of a Civic Center just southwest of the lake. The
Plan, proposed by Virgil Bogue, saw this region as a key location due to its unobstructed connection to the rest of the city and the early expectation of a future rapid transit hub. Although these plans never came to fruition, its farsighted impact would be revisited several times in the years to come as the city continued to grow in size and population.Fast-forwarding several decades, yet another Seattle pioneer would set his mind and wallet on turning the neighborhood into a major hub of the city. In 1991, a plan similar to the Bogue plan was
Draft Plan for the unrealised Seattle Commons
Drawing of the Bogue Plan for South Lake Union from 1911

proposed by Seattle Times writer John Hinterberger in which he envisioned the neighborhood becoming home to a large spanning city park, similar to New York’s Central Park. Although this plan was eventually turned down by public vote, the proposal spurred local software and real estate developer Paul Allen (founder of Vulcan and co-founder of Microsoft), to action as he subsequently invested between $20-30 million in South Lake Union property to bring the vision to light. This plan too was voted down by the public, yet nevertheless the acquired land would eventually bring a new phase of vitality and development to the neighborhood.
The neighborhood continued to develop in the form of numerous industrial and technology tenants, with an accumulation of biotech and software companies choosing to locate in South Lake Union such as the Fred Hutchinson Cancer Research Center, Zymogenetics, and the University of Washington School of Medicine. More specifically, with the recent relocation of Amazon’s headquarters to the neighborhood, South Lake Union has become one of the fastest growing areas in the city. Currently, the neighborhood is expected to accommodate an estimated 7,400 new residents and 11,800 additional employees by 2020. How the city will do this is yet to be seen, but there is little doubt that South Lake Union and its continued development will serve as a driving force to carry the city through the coming years.
2.2 Site Analysis The neighborhood’s location in the middle of the city makes it a clear choice as one of the employment centers of Seattle though the growth in employment has also ushered in rapid population growth and a variety of improvements. The site itself is particularly well poised for high-end residential and supporting retail, restaurants and amenities. ACCESSThe site is in close proximity to several major arterial streets (Mercer, Dexter, Fairview, etc.) as well as the I-5 to the east and route 99 to the west. With Mercer being one of the most heavily trafficked off-ramps in the city, the site will have no issue in terms of visibility, given that there is something to be seen. However, the high volume of traffic can also
Context
Valley Street Rendering with proposed improvements Source: South Lake Union Mobility Plan, 2012
be problematic, making access to the waterfront difficult by car, though the road layout is slated to change in the near future. Construction is underway to transform Mercer into a 2-way, 6 lane thoroughfare to easy freeway access. Valley St. on the other hand, will become a 2-way, 2 lane, pedestrian oriented street which would serve to calm the intensity of traffic flow adjacent to the waterfront. These traffic improvements should also ease pedestrian and bicycle access and overall make getting through the neighborhood a less daunting activity.
In addition to improvements for personal vehicle mobility, the city is also working to improve access to public transportation, an improvement that will be particularly advantageous to our site. At present, there is relatively good transit service. More importantly, potential changes to the Seattle street car have been rumored, which could eventually be extended to connect the current streetcar line to First Hill, Fremont, Ballard and the U-District in the years to come.
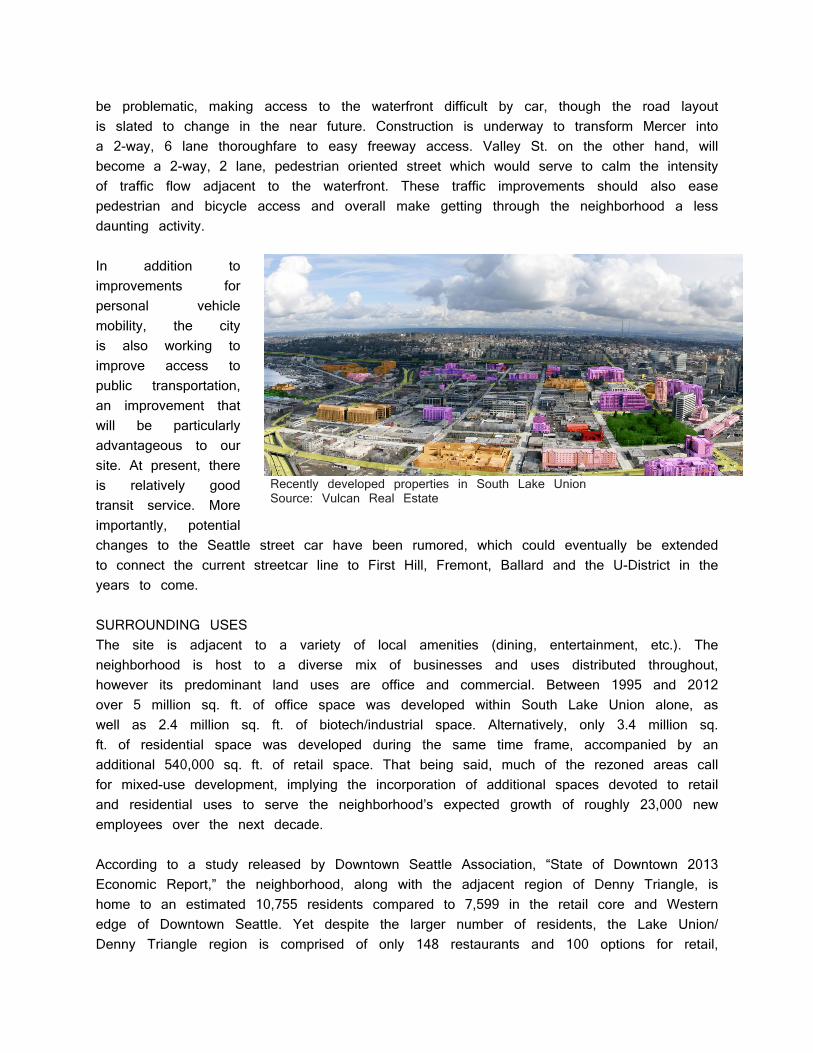
SURROUNDING USESThe site is adjacent to a variety of local amenities (dining, entertainment, etc.). The neighborhood is host to a diverse mix of businesses and uses distributed throughout, however its predominant land uses are office and commercial. Between 1995 and 2012 over 5 million sq. ft. of office space was developed within South Lake Union alone, as well as 2.4 million sq. ft. of biotech/industrial space. Alternatively, only 3.4 million sq. ft. of residential space was developed during the same time frame, accompanied by an additional 540,000 sq. ft. of retail space. That being said, much of the rezoned areas call for mixed-use development, implying the incorporation of additional spaces devoted to retail and residential uses to serve the neighborhood’s expected growth of roughly 23,000 new employees over the next decade.
According to a study released by Downtown Seattle Association, “State of Downtown 2013 Economic Report,” the neighborhood, along with the adjacent region of Denny Triangle, is home to an estimated 10,755 residents compared to 7,599 in the retail core and Western edge of Downtown Seattle. Yet despite the larger number of residents, the Lake Union/Denny Triangle region is comprised of only 148 restaurants and 100 options for retail,
Recently developed properties in South Lake Union Source: Vulcan Real Estate

figures way below Downtown’s 390 and 536 respectively. Given the current mix of uses, there is a relative lack of residential and retail establishments to compliment the neighborhood’s abundance of employees and job oriented development. There is also a notable disconnect in the neighborhood as a whole due to the major barriers created by Mercer and its connection to I-5 and SR-99. Thus despite the spread of retail, office, and residential developments, establishments along the waterfront (our site included) and areas north of Mercer remain both under-utilized and under-serviced.
LINKAGESAs the neighborhood is known more for its major employers rather than visitor attractions and residential accommodations, it experiences more commuters coming into the neighborhood simply for work over entertainment. In other words, the necessary
linkages to the neighborhood are areas of abundant residents (employees) and retail. That being said, the neighborhood is adjacent to several others that are largely residential, such as Fremont, Wallingford, Capitol Hill, Magnolia, and Queen Anne. Thus the neighborhood is well connected to several key locations from which employees can commute. Similarly, residents living in South Lake Union have easy access to several major shopping centers such as the retail core of Downtown Seattle as well as a relatively short distance to further options in Northgate and Bellevue, and the nightlife amenities of Fremont, Capitol Hill and Ballard. Also in close proximity are the major institutions located in the U-District (University of Washington), Capitol Hill (Seattle University), and Queen Anne (Seattle Pacific University).
Context
Highlights of Coming Transportation Improvements

SEATTLEAt present the city’s population is estimated to be 616,500 according to the city’s website. Growth has been steady in recent years. In general the population experienced growth in almost every age group, with the largest increases in persons aged 55 - 74, and moderate increases in adults aged 20 - 45. With adults (25 - 55) comprising roughly 50% of the population, the median age is 36.1. The city is projected to accommodate an additional 40,000 over the next 7 years, cumulatively 76,000 more by 2030.Lake Union
While the individual neighborhood’s boundaries are rather vague, and therefore unclassified by Census data, Lake Union as a forecast analysis zone (FAZ) has been determined by the PSRC to include South Lake Union, Eastlake, Westlake and a small portion of South Queen Anne.
LAKE UNIONLake Union’s population growth in particular has been impressive over the last 10 years as it outpaced several other largely residential neighborhoods, and will likely continue to do so given the recent rezone and the implicit height bonuses for residential development. According to PSRC projections based on 2010 Census data, growth in the Lake Union region will outpace neighborhoods such as Fremont, Ballard and the U-District in terms of population, number of households and employment in coming years.
While specific forecasts can be misleading at such a small scale, population growth over the last 10 years in the Lake Union region has been focused in several key age groups; these will serve as a key market for our proposal under the assumption that similar growth trends will continue through the near future.
At present, the population ranging from age 20-55 has experienced the most growth in the region and now accounts for 77% of the regions’ residents, with a median age of 33.4 based on 2010 Census data. The average household income is $60,790, while the average family income stands at $92,643. It should also be noted that about 52% of households earn between $25 – 100,000 per year.
Based on these demographic trends, Lake Union’s forecasted share of residential growth, expected increases in Amazon’s physical presence and employment, as well as the general economic condition of the city and neighborhood, we envision our proposed development to serve a range of future residents. As the neighborhood continues to improve economically, driven by major Lake Union employers, we imagine that future employees will likely be the same people seeking to live, stay and play in the neighborhood. Not far from reality, we envision a neighborhood of young professionals, mostly singles but with young couples, small families and empty nesters in the mix as well. A subclass of employees from Amazon, Fred Hutchinson, UW School of Medicine, and several other key industry workers; A subclass of future residents that are fairly well off, with a healthy amount of disposable income, looking to start a life in the fastest growing neighborhood of a city on the brink of innovation.
Context2.3 Key Economic TrendsOVERVIEWAs with the rest of the nation, Seattle’s economy continues to recover from the economic recession, which has distressed global finances since 2009. The United States GDP has been on the rise and is expected to continue to improve, with forecasts showing growth through the year 2022.
Washington State as well has shown signs of recovery in recent years with its GDP having improved since 2009.
The Seattle MSA is expected to experience significant growth in the near future, having outpaced the increase in the economies of both the US and Washington State in recent years.
EMPLOYMENTDespite the economic recession, Seattle continues to prosper, albeit at a depleted rate, due to the growth in population and specialized job force. Overall, the city has a Hachman Index of .955, up from .91 in 2001. This figure reflects the Seattle MSA’s highly diversified job force, which is fairly resistant to fluctuations in the national job market. Between 2001 and 2010, Seattle job force increased by an estimated 33,000 workers. Several industry sectors have grown at rates higher than the national level; specifically, the industries of Services, Arts & Entertainment, Real Estate, Information Technology, Transportation, Professional & Technical Services, and Manufacturing, have all remained strong in terms of employment over the last 10 years. These industries, particularly Information Technology and Professional & Technical services, which are the regions leading industries, will continue to drive the cities economy in years to come as major sources of jobs and innovation. Although these industries together, along with health care, account for only 27% of the MSA’s jobs, several of the associated major employers are located in South Lake Union.
Looking forward, Seattle’s work force is forecasted to increase by 72,000 employees by the year 2020. According to forecasts estimated by the PSRC’s data analysts, this increase in jobs will favor South Lake Union over a several other Seattle neighborhoods as its share of employees continues to grow.
REAL ESTATE MARKETSince 2009, the volume of investment in commercial real estate has been increasing due to historically low interest rates and attractive prices. The volume of US investment in 2012 reached approximately $230 billion, which is almost same volume as in 2011. Although there is some global uncertainty and a lack of seller motivation, and buyer
confidence, we expect this trend continue in next couple of years. According to ULI Consensus Forecast, after a mainly flat 2012 with respect to investment volumes, activity in US is anticipated to re-accelerate by mid-year 2013, and reach up to 12% growth from 2012 levels.

3.0 OverviewOVERVIEWBased on our analysis of the historical and physical condition of the sites, the current and forecasted local market conditions, and relevant land use code and regulations, we will recommend a series of uses for the subject properties on both sites and provide the hypothetical development programs with further details in this chapter.
For the Block 25 site, we are planning to develop a residential tower grounded by an innovative boutique hotel and retail site, supported by parking. For the Waterfront sites, the primary goal of the future development is to create an innovative, self-supporting mix of leisure and retail uses. The Waterfront gives an identity to South Lake Union, connecting Chandler’s Cove and Block 25 (as well as Blocks 26 and 27 in the future).
Block 25 is intended to become a multi-functional place for people to stay, play and live on the site. On Block 25, we propose an iconic high-end condominium tower, surrounded by an architecturally significant four-star hotel anchored by lifestyle amenities such as an upscale athletic club.
In order to ensure flexibility for project financing and disposition strategies, a Master Association will be established for Block 25 with a Master Condominium Agreement. While legal fees will
3.0 Overview 3.1 Block 25 Uses & Market Analysis 3.2 Waterfront Uses & Market Analysis
Uses & Programming
BLOCK 25 PROGRAMMING SUMMARY(Unit: SF)
Stories Total SFCondominium 21 220,500 Retail 55,600 General 22,000 Restaurant 10,400 Gym 2 15,000 Movie Theater 2 8,000 Hotel 116,000 Total Parking 161,184 Broken down per type: Above ground 89,184 Below ground 72,000 Broken down per use: Parking for Condominium 63,297 Parking for Hotel 28,737 Parking for Retail 69,150 Open Space 14,400 Total Total 567,684
Birds-eye view of Block 25 & Waterfront

increase (as seen on the project Proforma), the Master Association organization will allow Vulcan to refinance the hotel and retail components of the Block 25 development with a permanent loan while the condominium units are sold through at a conservatively projected rate of five per month. Furthermore, the hotel and retail components can be sold independently of each other to specialized REITs or other institutional investors, allowing for optimal exit capitalization rates during those transactions.
3.1 Block 25 Uses & Market AnalysisCONDOMINIUM TOWER OVERVIEWThe iconic condominium tower featured in Block 25 is the backbone of this development proposal in many respects—not only does it offer a public face in the form of an identifiable landmark that will define South Lake Union to the rest of Seattle, but it also is projected to capture much of the externalized value that is created by the amenities that are being proposed for the waterfront sites. The decision to develop condominiums was made based on a few important analyses:• Premiumlocationinanamenity-richneighborhood• Apartmentandcondominiumsupplyforecastsfavornew condominium projects• JobgrowthanddemandintheSeattlemarket
LUXURY CONDOMINIUM RESIDENCES
Land Value per Unit $81,067/UnitHard+Soft Costs ($/GSF )$460Sales Costs 3% of sales revenueCondominium Gross SF 220,500 Efficiency Factor 80%Net SF (NSF) 187,425 Average Unit NSF 1,200 Average Unit Sale Price $1,200,000Average Unit Sale Price/NSF $1,000/NSFHOA dues $1.00/SFParking Ratio 1.1 per UnitAverage Parking Unit Sale Price $50,000Floors 4-24Unit Sale Timing 44 pre-sales, assumed 5/month

LUXURY CONDOMINIUM FOR AN AMENITY RICH NEIGHBORHOOD Our condominium site on Block 25 is unparalleled in locational attributes and amenities. Located in a desirable neighborhood of South Lake Union, it boasts a Walkscore rating of 95, a Walker’s Paradise with excellent transit. Furthermore, our residents will have uncontested views of Lake Union and the city skyline as the proposed zoning change of ‘one tower per Mercer block’ results in a permanent and panoramic view that is extremely rare in the rest of the city.
CONDOMINIUM SUPPLY & COMPETITIONCurrent condominium stock is rapidly declining, especially at the higher end of the market while apartment deliveries are set to spike with over 4,855 units planned or under construction for inner-urban Seattle neighborhoods between now and 2015 Q1. Insignia by Bosa Development with 600 plus units entering the market in 2015 will be the only other new condominiums at the time of our projected delivery in 2017. The sheer number of units at Insignia suggests that they will carry diverse inventory for different income levels and we expect to compete only with their top luxury units. Considering that relatively few condominium projects have been announced due to the lingering residential market hangover, bold developers such as Vulcan who are willing to make the first move have an opportunity to deliver in an environment with little competition.
There is no direct competition for our luxury condominium tower. Similar condominiums with comparable
Uses & Programming
1 Four Seasons
2 1521 2ND Ave
3 Escala
4 Cristalla
Olive 85
Insignia6
1
2
34 5
6
Source: Realogics Sotheby’s International Realty (RSIR)
Source: Realogics Sotheby’s International Realty (RSIR)

amenities in downtown Seattle are selling from $500/SF to $1,000/SF. In this wide range, Four Seasons positioned itself at the top of the tier with $1,000+/SF sale price. With its exclusivity of 36 residences on top of the 5-star hotel, offering top amenities and views, it is one of the better comparables. According to UrbnLivn blog, Escala with $700-800/SF sales prices have sold 8 units in Feburary 2013 while 1521 2nd Ave, at $895/SF “commanded approximately 50% of market share for $1M+ condos since delivery in 2009.” (Urbnlivn) Both Escala and 1521 2nd Ave speak to the optimistic recovery in the luxury condominium market, and our condominium tower with permanent views of Lake Union and the city skyline, unparalleled amenities, iconic design, and SLU locational attributes, is expected to be the most competitive condominium tower in Seattle. Our average sales price of $1000/SF, an assumption of $850/SF base price plus $150/SF upgrades, will be outfitted with a very high quality of amenities with the construction cost of $470/sf.
JOB GROWTH & DEMOGRAPHICS With the average sale price at $1.2 million, our condominium buyers include individuals or households with an income of $200,000 or above. Included in this target demographics are empty nesters or baby boomers, typically with equity to invest, looking to downsize their current homes, or executives with high paying jobs looking to live in close proximity to diverse amenities.- 6.3% (18,418) of Seattle makes 200k+. This number will grow to be 6.7% (21,500) in 2017. An increase of 16.7%!- Currently 14.17% of the Lake Union population is made up of 55+ age demographics. - Forbes magazine ranked Seattle as number one in their ‘Top Ten Cities of Tech Job Growth,’ with 43% job growth since 2000, 12%
WHO
$1.2 million average price less 20% equity ($240,000)$960,000 [email protected] % interest rate; 30YR Fixed
$4,310 monthly payment+ $1,200 HOA fee
$5,510 total monthly payment $66,130 annual payment
$198,000 Annual Income @ 30% towards housing
Top Amenities Club House: Fitness Room, Lounge, Wine Bar Discounted Membership to fitness club in Block 25 Parking, Optional Valet Package
Top Amenities Club House: Fitness Room, Lounge, Wine Bar Discounted Membership to fitness club in Block 25 Parking, Optional Valet Package

Uses & Programming
since 2010 in high-tech industry (7.6% STEM growth), surpassing the San Francisco Bay area.
FOUR STAR HOTELOn Block 25, we propose a state-of-the-art, iconic, four-star hotel that will be a reference point in Seattle and part of the South Lake Union neighborhood’s heart. The concept does not intend to maximize the building envelope, but instead creates a scaled, distinctive building that maximizes views and offers a sense of privacy, belonging, and individuality, as well as private balconies for most rooms. The building envelope will be distributed along Block 25, and will benefit from the direct connections with the waterfront spa and thermal pools, as well as lifestyle retail amenities. All are contained within a unique destination landmark—the South Lake Union waterfront.
The proposed hotel is composed of approximately 116,000 GSF with 168 rooms that average at 400SF/room in size. 15% of these rooms will be slightly larger suites, while another will serve as an exclusive presidential room. The hotel will also feature a high-end restaurant with excellent views of Lake Union. The Average Daily Room is projected at $220 with a 75% occupancy rate, yielding a RevPAR of $165.
The main customers the hotel will attract are higher-income leisure travelers who want to stay in a neighborhood surrounded by amenities, especially the convenient access to compelling entertainment choices on the waterfront in the form of a destination thermal pool complex, top restaurants, the Museum of History and Industry, seaplane tours, and various boating opportunities. While some business travelers will inevitably be attracted to this destination, the target market is the overnight visitor that has come to Seattle for leisure and to sample the best of what the city can offer—a segment said to compose 80% of Seattle’s overnight visitors, most of whom arrive by plane and
Existing HotelsProposed Hotels

will seek a pedestrian-oriented destination.
In order to stay competitive with some of the other best-in-class hotels in central Seattle, the proposed hotel concept should seek a flag such as W Hotels. This modern-styled flag already operates one hotel in downtown Seattle and would likely be interested in operating a complementary hotel that is better oriented towards relaxation visitors that will prefer a quieter central neighborhood with waterfront proximity, low crime rates, and superior transit access for facilitating trips to Seattle’s top destinations. W Hotels have experience linking their hotel operations to high-end spa businesses—a perfect fit with the neighboring thermal pool complex, and perfect for synergistic business tie-ins.
The nearest key competitor is the SLU Pan-Pacific, also owned by Vulcan. While the proposed hotel assumes ADRs similar to the Pan-Pacific, we expect this location to be more competitive than the Pan-Pacific due to the superior location and amenities mentioned previously. That said, the overall allure of SLU will be enhanced by this proposal, generating more visitor interest in the neighborhood and benefitting the Pan-Pacific by establishing a critical mass of tourism-oriented business agglomeration. We can expect both of these Vulcan-owned hotel properties to maintain an occupancy rate near the historical norm of 75% per the forecast below.
HOTEL NOTESIn order to continue growing as a holistic, mixed-use district, South Lake Union needs an upscale hotel closer to the heart of the district so that overnight visitors can experience the best of what the neighborhood offers throughout their stay in Seattle.
We assume it requires two years to stabilize hotel performance, and the hotel will operate 8,000 SF of retail space for a restaurant, bar and small shops. These spaces will be leased to tenants with $28/SF. As a result, we expect an unleveraged IRR of 8.9% and a leveraged IRR of 19.6%.
RevPAR $220
ADR $165
Top - W Seattle King Room
Bottom - The Living Room at W Seattle

Uses & Programming
The podium design adopts the “stacked blocks” strategy, terracing individual hotel units on top of ground floor retail. Some hotel units terrace down towards the courtyard while others towards the water but most units, as a result of the terracing, have a private balcony. On the ground plane, retail stores front both sides of the interior plaza. This is an intentional strategy to bring more activities in and through the block, allowing the public to experience this landmark in many ways. LIFESTYLE RETAILRestaurants & General RetailBlock 25 is projected to both generate and fulfill a strong local demand for Restaurants and Cafés. The surrounding retail market has provided a history of consumer behavior and preferences for dining places, with primary customers being employees from Amazon, Fred Hutchinson Cancer Research, and other nearby companies
We define our major retail market as leisure travelers attracted to the SLU waterfront’s amenities, as well as the employees and residents that live in the neighborhood and earn above-average disposable income and prefer a high-quality urban life style. As a result, we target two main categories for future dining retail at Block 25: mid-to-high end and diverse restaurants & cafes with substantial public seating space and a good view of the lake. The average size we are targeting for restaurants is 4,000 SF, on either the first and second floor of the building; the proposed average floor size for general retail is 1,000–2,500 SF, only on the first floor (no retail will front on Mercer due to the heavy traffic).
In addition to mid-to-high end restaurants, bars and Cafés, we propose other types of Small Boutique Retail and will include 5-8 stores in Block 25. Successful Projects in SLU are often local and small. We are continuing this model and offering more local/small retail tenants that are focused on food and beverage, grocery stores and some small boutique shops.
Retail
Block 25 Specialized Fitness StudiosComprehensive Fitness Centers

ENTERTAINMENTWe plan to include a movie theater and a fitness club in Block 25.
For the movie theater concept, we propose an 8,000 SF cinema with three intimate screening rooms, each seating 100-150 guests. The cinema features food and alcohol table service that can be summoned with a digital menu system. Considering the local corporate and high-end residential presence, it is foreseen that movie screens will be rented out for special events.,
For the gym, we propose a high-end athletic club, providing lots of amenities and diverse studios (yoga, dances, zumba, etc.) We offer an “exclusive & luxury” athletic club atmosphere, such as Athletic Wellness Center, in-door Spa, club events, food & wine, special events & meetings.
According to Diversified Health and Fitness (diversifiedhf.com), health club members are affluent. The mean household income of a club member in 2005 was $82,900; members with household incomes of over $100,000 accounted for 33% of all club memberships, as of 2005. According to Health Club 2007
Block 25 Retail Restaurants General Retail Cinema Fitness CenterType Mid-‐to-‐high end restaurants Cafe, boutique shops 3 Screens, iPic Model Upscale BasicTotal SF 10,400 22,200 8,000 15,000Avg Floor Size 4,000 2,000 2,000 15,000Rent/SF $34 $30 $25 $28Construction Cost/SF $220 $220 $180 $180Space RequirementsLease StructureTI $100 $100 $80 $80Op. Ex. $1.15 $1.15 $2.00 $2.00Cap RateParking Ratio
14' height, 1st & 2nd FloorNNN
6.00%1/1000SF
The Living Room, Portland, OR

Uses & ProgrammingIndustry Review by active marketing group, as of 2005, 50% of health club users have household incomes over $75,000. The medium user age is 41, while 69% of them are at the age between 18 and 54. Currently there are at least 9 fitness places within 0.5 mile from our site. Considering the demographics of the neighborhood and the increased demand that is projected due to new employment and residences in SLU, a health club concept is projected to do well at this location.
3.2 Waterfront Uses / Market Analysis“I’ll meet you by the water…”
Our proposal will turn the waterfront into a year round destination for both residents and visitors alike and will further assert South Lake Union’s position as ‘the place to be’ in Seattle.
Chandler’s cove will be transformed into a waterfront leisure precinct composed of modern thermal pools and spa, award winning restaurants and a waterside promenade with casual sitting and café and ice creamery and concealed parking.
Henry Pier will become a place for social gatherings of all sizes with a multi layered deck which wraps around an open air concert stage, flexible indoor event space and casual dining and bar.
Waterfront Zoning Compliance Key Elements:Zoning: C2-40
Aloha Path diagram
WATERFRONT
BLOCK 25
ALOHA PATH


Thermal Pools and Spa atChandler’s Cove
THERMAL POOLS & SPAThe 29,000 SF of destination thermal spa offers a unique attraction to the South Lake Union waterfront that is perfectly tailored to the Seattle weather and lifestyle. The center is comprised of indoor and outdoor heated soaking pools, spa treatment rooms, a reception area, a small café, showers and changing rooms. The thermal soaking pools will vary in size and depth, offering different levels of privacy and social interaction. The pools will have a total capacity of 120 guests with an estimated average of 2,000 visitors per week, including hotel guests and tower residents from Block 25.
Thermal Pools & Spa
Total NSF: 26,000 SF Sales/Revenue: $70/ per visit ConstructionCost: $250/SF Lease structure: NNN (All included) Lease term: 30yrs+10yrs option Rent: $23.5/SF TI(Concession): $100/SF OperatingExpense: $2/SF Cap Rate: 7% Parking Ratio: 500SF/Stall
Uses and Programming

Waterfront Fine Dining Restaurants
Total NSF: 27,220 SF AverageFloorSize 9,000 SF Sales/Revenue: $600/SF/Yr ConstructionCost: $185/SF Lease structure: NNN (All included) Rent: $31/SF TI(Concession): $100/SF OperatingExpense: $1.15/SF Cap Rate: 7% Parking Ratio: 500SF/Stall
Upscale Restaurants on Chandler’s Cove
The pools will be heated using a sustainable geothermal heating system and will use on-site recycled water. The structure we purpose will be built in cooperation with the spa management company, which will run the thermal spa center on a long-term lease agreement. The main pool is located outdoors at the end of the pier, with panoramic views of Lake Union and an infinity edge.
RESTAURANTSTwo new fine dining restaurants will be built elevated on the Chandler’s Cove site with premium views of the water. Current tenant Daniel’s Broiler will be extended the opportunity to relocate to the new venue, due to design changes to the site’s orientation, once development has been completed. Joey’s restaurant will be kept as is on the site. with some landscaping and site work to improve connectivity.These restaurant spaces will have premium views and a growing number of walk-in traffic from neighborhood residents, in addition to those who come to the area for the lakefront views and upscale dining.

FLEXIBLE EVENT SPACEAs part of the proposal, the South Lake Union Discovery center will be relocated to the waterfront in two sections. The structure was built in such a way that it could be moved if such a need should arise; we feel that the center would be better utilized in this vibrant location, as well as provide a cost efficient means to enhance the site. The larger structure will function as a flexible waterfront event space, which can be hired out for private functions and local events. Next to the indoor event space will be an open-air concert stage to accommodate large outdoor functions.
Flexible Event Space
Total NSF: 6,900SF ConstructionCost: $70,000 to Relocate Lease structure: On per use basis Rent: $550/day OperatingExpense: $6/SF Cap Rate: 7%
Casual Dining
Total NSF: 13,000SF AverageFloorSize 2,100SF ConstructionCost: $160 / SF Lease structure: NNN (All included) Rent: $26/SF TI(Concession): $80/SF OperatingExpense: $1.15/SF Cap Rate: 7% Parking Ratio: 500SF/Stall
Event Space Casual Dining Sales office
Henry Pier
Uses and Programming

South Lake Union Discovery Center Relocation
CASUAL DININGChandler’s Cove will also be re-structured to include a stepped promenade along the waterfront with casual outdoor sitting, a café, an ice cream parlor, and small-scale retail. Henry Pier will also feature a bistro and a bar overlooking the park and lake.
SOUTH LAKE UNION MARKET & TOURISM CENTERThe smaller portion of the Discovery Center will be located on Henry Pier, closer to Valley Street, and will be used as a sales office for the new developments on blocks 25, 26 and 27. Once it is no longer required as a sales office, the structure will function as a tourist information center and can provide small-scale retail.
MARINA & YACHT RETAILThe existing marina will be kept in its current form with maintenance work done as required. Opportunities to use boats to host events, parties and draw tour groups will be pursued at the end of Henry Pier.
The current marine related retail offices will be accommodated within the Joey’s Restaurant building and within the new Chandler’s Cove structure.
SLU Marketing & Sales Office
Total NSF: 3,000SF ConstructionCost: $40,000 to Relocate Lease structure: Used by Vulcan Rent: $0 OperatingExpense: $6/SF Cap Rate: 7%
Yacht Retail
Total NSF: 14,858SF AverageFloorSize 1,000SF ConstructionCost: $130 / SF Lease structure: NNN (All included) Rent: $25/SF TI(Concession): $80/SF OperatingExpense: $1.15/SF Cap Rate: 7% Parking Ratio: 500SF/Stall
Marina
Total NSF: 81Deck (4,806 Lineal Foot) Rent: $15/Lineal Foot/month Operating Expense: 20% Gross Revenue DNR Lease: $119,050/year Cap Rate: 12%

PARKINGChandler’s Cove will offer 128 stalls of concealed car parking to service the spa, marina and restaurant users. Our proposal removes parking from the street level and relocates it out of the line of vision to allow for a smooth transition from the street to the site. An additional 30 stall surface parking will be available on the Henry Pier site. Since the waterfront will have prime connections to public transportation, lower parking ratios are anticipated per use. If extra parking is required on days when large events take place, this can be fulfilled by utilizing parking on the Mercer blocks and adjacent Union Park parking.
Concealed Parking Garage at
Chandler’s Cove
Parking
Total NSF: 128 stalls (44,790SF) Average Stall size: 350 SF Construction Cost: $10,000/stall Rent : $140/stall/mth, $4.00/h\r Operating Expense: $1.15/SF Cap Rate: 7%
Uses and Programming
THERMAL POOLSRESTAURANTS
PARKINGRETAIL
Waterfront Section

Intentionally left blank
Waterfront Section

Design
4.0 Design Strategy4.1 Sustainability4.2 Project Phasing & Timeline
Fig. 3 Courtyard rendering, Aqua View
Fig. 2 Hotel massing precedent, BIG
Fig. 1 Tower precedent, Herzog and de Meuron
4.0 Design StrategyThe overall design strategy for the proposal is to create an Urban Playground across both the Block 25 and Waterfront sites. The Waterfront site will be dedicated to leisure and recreation through the provision of outdoor space for gathering, celebrating, relaxing and more. The Waterfront is what positions Block 25 to offer one of a kind condominiums and a world class hotel: landmark architecture in a lakefront neighborhood rich with amenities and instant access to all Seattle has to offer.
BLOCK 25With the iconic design of the tower and the podium we are proposing to establish Block 25 as a visual landmark for South Lake Union. The condominium tower, soaring at 240 feet, is a steel-framed, glass structure that can be seen from many points throughout the city. Built on a 10,500 SF floor plate, the units are laid out encircling a core offering views of both the water and the Seattle skyline.
As the first building to take advantage of the lakefront block rezone, this tower will set the stage for how people perceive the area. A building of architectural significance will raise the profile of South Lake Union as a place to live and draw future residents to the adjacent blocks. Condominium buyers will have permanent views and the ability to walk across the street and enjoy the new Lake Union waterfront.
The podium hotel design also adopts the “stacked blocks” strategy, terracing individual hotel units on top of ground floor retail. Some hotel units terrace down

Aloha Path diagram
WATERFRONT
BLOCK 25
ALOHA PATH
Replanted swale on Chandler’s Cove Pier
Chandler’s Cove Boardwalk rendering, Aqua View
towards the courtyard while others towards the water but most units, as a result of the terracing, have a private balcony. On the ground plane, retail stores front both sides of the interior plaza. This is an intentional strategy to bring more activities in and through the block, allowing the public to experience this landmark in many ways.
THE WATERFRONTWaterfront Concept: Urban Playground/ConnectivityThe design strategy for the Waterfront prioritizes the Aloha Path, which will connect Aloha Street W to Aloha Street E, using the existing pedestrian bridge on the west side of MOHAI, and creating a new boardwalk path through the Henry Pier and Chandler’s Cove Pier sites. The Aloha Path meanders through boardwalks to open spaces to undulating decks, offering a variety of avenues for people to engage the waterfront.
It is essential that the Waterfront and the Mercer Blocks become a sub-district of their own, with a variety of uses to provide for visitors’ needs once they are there. Acknowledging that Mercer Street traffic provides a logistical and psychological barrier to some potential visitors, our aim is to provide a space for activity and entertainment for hours, making it ‘worth the trip’ in every regard.
Once completed, the waterfront will feel like one continuous public space from Lake Union Park to Chandler’s Cove. The eastern end of this stretch will have the most intensive uses with restaurants, retail and the thermal pools with a gradual transition to the museum, followed by park
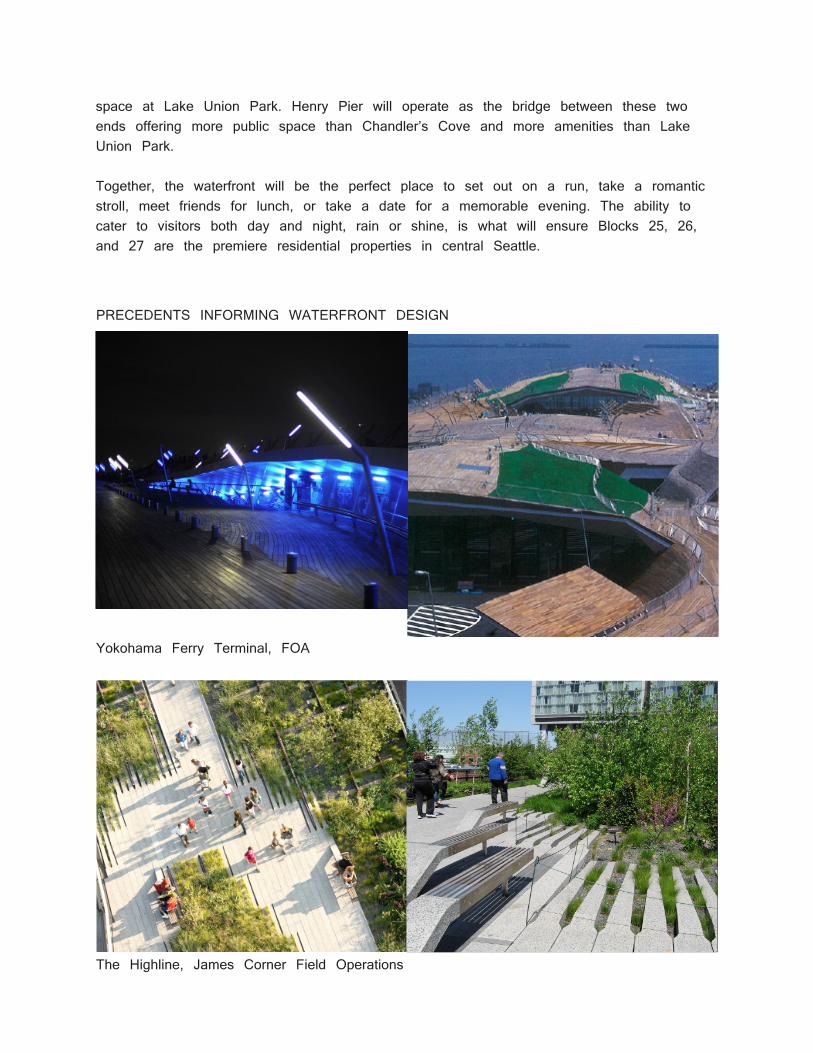
PRECEDENTS INFORMING WATERFRONT DESIGN
Yokohama Ferry Terminal, FOA
The Highline, James Corner Field Operations
space at Lake Union Park. Henry Pier will operate as the bridge between these two ends offering more public space than Chandler’s Cove and more amenities than Lake Union Park.
Together, the waterfront will be the perfect place to set out on a run, take a romantic stroll, meet friends for lunch, or take a date for a memorable evening. The ability to cater to visitors both day and night, rain or shine, is what will ensure Blocks 25, 26, and 27 are the premiere residential properties in central Seattle.

4.1 SustainabilityKey sustainability strategies in the proposal include storm water management, transportation considerations, and LEED certification.
All the buildings in Block 25 will aim for a LEED Gold standard. Plants and landscaping will both create a beautiful place as well as help with ecological functions. The individual balconies of the hotel rooms will use captured rainwater for planter boxes while the Chandler’s Cove Pier will dedicate over 5000SF of soil (originally landfill) to be replanted with native species to mitigate storm water runoff from the area.
While we recognize the need for parking, particularly for luxury condominiums, the site will build on transit investments and continue Vulcan’s strategy of creating attractive neighborhoods through walkability, both in terms of proximity of uses and attractive urban design. Once Blocks 26 and 27 have been developed we recommend creating car share opportunities, subsidized transit fares and bicycle share programs for condo residents, employees and hotel guests to reduce the need for parking and provide attractive and useful amenities.
We recommend that Vulcan lobby the city to ensure completion of the proposed streetcar expansion as well as improved Lake Union pedestrian and bicycle paths. We believe that demonstrated progress on these efforts in 2017, along with Vulcan continuing as a leader in comprehensive sustainability will add significant value to the project and its neighbors.
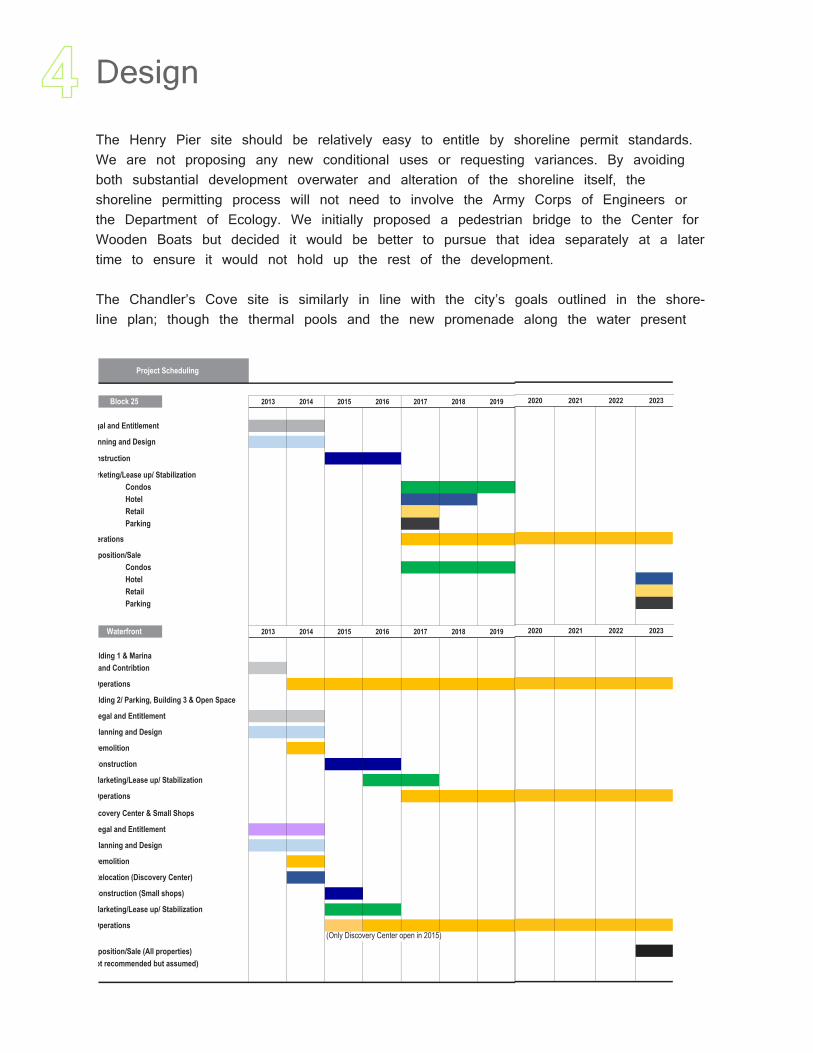
4.2 Phasing & Timeline
VULCAN’S OVERALL STRATEGYThe development of Block 25 and the waterfront sites will begin Vulcan’s formation of a new neighborhood along Lake Union. In addition to the proposal we have outlined, Vulcan will need to devise a strategy for the subsequent development of the other tower blocks along Valley Street. By focusing first on the waterfront and Block 25, the following two residential tower blocks should be easier and more profitable to develop. Timeline for the Waterfront and Block 25
We recommend that Vulcan begin development immediately and simultaneously on the Waterfront and Block 25. The number of components, shoreline regulations, the prominence of the location and the controversy surrounding the tower height will inevitably require a longer than average time for design, planning and securement of entitlements. We feel that two years is an appropriate estimate for this process for the following reasons:
Design
The Henry Pier site should be relatively easy to entitle by shoreline permit standards. We are not proposing any new conditional uses or requesting variances. By avoiding both substantial development overwater and alteration of the shoreline itself, the shoreline permitting process will not need to involve the Army Corps of Engineers or the Department of Ecology. We initially proposed a pedestrian bridge to the Center for Wooden Boats but decided it would be better to pursue that idea separately at a later time to ensure it would not hold up the rest of the development.
The Chandler’s Cove site is similarly in line with the city’s goals outlined in the shore- line plan; though the thermal pools and the new promenade along the water present
2013 2014 2015 2016 2017 2018 2019
Legal and Entitlement
Planning and Design
Construction
Marketing/Lease up/ StabilizationCondosHotelRetailParking
Operations
Disposition/SaleCondosHotelRetailParking
2013 2014 2015 2016 2017 2018 2019
Building 1 & MarinaLand Contribtion
Operations
Building 2/ Parking, Building 3 & Open Space
Legal and Entitlement
Planning and Design
Demolition
Construction
Marketing/Lease up/ Stabilization
Operations
Discovery Center & Small Shops
Legal and Entitlement
Planning and Design
Demolition
Relocation (Discovery Center)
Construction (Small shops)
Marketing/Lease up/ Stabilization
Operations(Only Discovery Center open in 2015)
Disposition/Sale (All properties) (not recommended but assumed)
Waterfront
Block 25
Project Scheduling
2020 2021 2022 2023
2020 2021 2022 2023
potential delays. However, even if this results in revisions and exorbitant delays, the development will not suffer dramatically as the site will continue generating revenue throughout the permitting process.
The largest potential delays for Block 25 will come from the alley vacation process and design review. The alley vacation process should not be controversial as the reconfigured alley will be a major improvement for circulation over the current alley, which intersects Mercer, and zoning prohibits alley access on Mercer. The design review process could bring out a large number of citizens who oppose the height of the building. However, we feel that a unique, high-end building will have greater appeal to design review board members than a generic building and the high construction budget can easily absorb any revisions required by the board. Ultimately, the development cannot be delayed based on height alone and the goal of our proposal is to make this relatively small tower as attractive as possible.
By moving quickly, this project can be well timed to capitalize on excellent market conditions for condominium sales between 2017 and 2019 (see Condominium section in Uses and Programming for more information). Completing the waterfront before the tower is finished ensures condominium buyers will be able to see the new amenities and urban design, which will elevate Block 25 above all other high-end condominiums in the Seattle core. At the same time, the rest of South Lake Union will continue to mature and develop into a thriving neighborhood, thanks to the fresh infusion of retail, restaurants, and other amenities in the area.

Block 25 and the Waterfront have more than 10 development components including parking, open space, and many other uses. These components have been comprehensively detailed, modeled and considered. Consequently, this section intends to provide a quick overview of the finances broken down by the two sites and main uses. For more detail on each aspect, we recommend the comprehensive proformas and summaries attached in the appendix of this report. These proformas present important elements such as the financing and land value distribution to the best of our knowledge on a use-by-use basis, capturing the important, strategic financial considerations. This section is an introduction and overview, supplemented by the attached Appendix.
1. Block 25The main purpose of Block 25’s financial summary is to reflect the potential of a unique landmark through numbers. Block 25 is the most profitable component of the project, and we have devised a financial strategy that balances risk-return according to the usual preferences of our client, Vulcan. We believe the financial risks of the project have been optimally managed, yielding an unleveraged IRR of 12.7%, and a leveraged IRR of 18%.
(1) Condominium Tower: This component of our landmark de-velopment is also a key in the financial performance of Block 25. Composed of 21 stories, with a floor plate of 10,500 SF, and an average unit size of 1,200 SF, the impressive and modern tower features 147 luxury high-end units with unique and exquisite finishes – with all its associated hard costs accounted for and reflected in the development costs. The average unit will sell for $1,200,000, translating in a sale price of $1,000 per SF. The ratio of parking reserved for the condominiums is 110%, meaning that each owner will have the option of having at least one parking stall associated with the unit for an additional $50,000 per stall. The projected condominium sales will start with 30% in presales during construction and 5 units/month after completion due to a timing strategy. The bulk will be sold mainly during 2018 and 2019 with 61% and 29% of the stock being sold each of the years respectively.
An important side note is that the affordable housing required by code has been accounted through a payment in lieu, which means no affordable housing is included in the development, but a payment of
Financial Analysis
Leveraged IRR Unleveraged IRR Cash on Cash (incl. Sale)Waterfront 8.69% 6.40% 111.89%Block 25 16.92% 12.47% 192.47%
8.69% 6.40%
111.89%
16.92% 12.47%
192.47%
Leveraged IRR Unleveraged IRR Cash on Cash (incl. Sale)
Project Returns
Waterfront Block 25

$2.5 million has been added in development costs.
(2) Hotel: In our hotel project, we plan to develop and start managing 168 rooms in a four star hotel in 2017. Our room price (ADR) assumption is $220, stabilized occupan-cy rate is 75% and expense rate is 80%. We assume it requires two years to stabilize hotel performance. Also, we assume the hotel will operate 8,000 SF of retail space for a restaurant, bar and small shops. These spaces will be leased to tenants with $28/SF. As aresult, we expect an unleveraged IRR of 11.1% and a leveraged IRR of 17.2%.
(3) Retail: Retail is comprised of four parts, restaurants, gym, movie theater and gen-eral retail shops which includes a small grocery store. For restaurants, we assumed four spaces averaging 2,340 sf. Based on market analysis, these restaurants would lease for $34/SF. The gym is 13,500 sf and leases for $28/SF. The movie theater is 6,000 sf and leases for $25/SF. We assumed that both the gym and cinema spaces rent under a ten year lease term. The other retail uses, restaurant and general retail lease with five years contracts. We assume all tenants will accept NNN lease contracts and receive 3 months free rent.
Regarding retail parking, our development plan has 208 parking spaces for retail use. 188 spaces are hourly parking for retail customers. We assume a $6.00 hourly parking charge and the stabilized utilization rate is 30%. We distribute the other 20 spaces for monthly parking.
Based on above assumptions, the unleveraged and leveraged IRR of the retail portion are 11.1% and 17.2% respectively.
2. Waterfront
As previously explained in other sections of this report, the waterfront developments pro-vide social, spatial, and cultural amenities to South Lake Union with acceptable return. Overall, the combined yield for the waterfront project is 6.4% unleveraged IRR and a leveraged IRR of 8.7%.
General Assumption(1) Initial site value is given at $17.5 million. Aqua View recommends to continue to use existing retail & office building with Joey’s restaurant on Chandler’s Cove (“Build-ing 1”) and marinas in both Chandler’s cove and H.C. Henry Pier as existing (“Marina”). The value of Building 1 and the Marina is evaluated based on direct capitalization. Re-maining land value per SF is $23.38.(Insert table for prorated site value)
(2) Total project cost will be $53 million and financed by $17.5 million of initial contribution as equity, loan of $32.9 million and cash flow from Building 1, Marina and
Event Space; Discovery center will be relocated in 2014.
(3) Vulcan will not be required cash contribution because the waterfront site can be financed even in permitting phase by collateral with Building 1 and Marina. Conservative-ly, all cash flow from Building 1 and Marina during construction will not be distributed to Vulcan, used for development. (Insert table for financing summary 2013-2016)
(4) Retail complex building in Chandler’s cove consists of north side building (“Building 2”), south side (“Building 3”) and semi-ground parking below retail complex (“Parking”).
(5) In consideration for the particularity of waterfront site permits, especially for the thermal pools, $1.5 million of fees are accounted for permits and consulting.
Assumption of Uses(1) Building 1: The current home of Joey’s restaurant has an occupancy rate of more than 95%, therefore we will leave Building 1 as is. Cash flow from Building 1 will sup-port waterfront development and attractive return with unleveraged IRR of 8.1% helps return a yield for the waterfront project.
(2) Building 2: consists of thermal pools and a restaurant. The thermal pool space will be leased to an operating company as NNN lease ($23.5/SF). Restaurant space will enjoy spectacular views and generate higher rent than general retail ($31/SF).
(3) Parking: 114 parking spaces are used as existing but covered by surface for walking access to Building 2. 13 parking spaces will be added on the same level of current parking.
(4) Building 3: Located south of Building 2 and connected to Building 2 by the board walk. The second floor restaurant space will also enjoy a great water view and can generate higher rent ($30) Tenants of 1st floor will be casual dining and marina related retail that attract boat owners and casual visitors. Rent of these space should be lower than the 2nd floor restaurant (Casual Dining: $26/SF, Retail: $25/SF)
(5) H.C. Henry Pier: Discovery Center in South Lake Union will be relocated to H.C. Henry Pier and split into an event space and marketing office. A Café/bar will also be provided at H.C. Henry Pier. The Discovery Center will be relocated from its current site in year 2 (2014) and start to operate in year 3. We assume the event space will be utilized 60% of rentable days after stabilization, assuming use for corporate events and meetings 2 to 3 times during the week, with approximately 80% occupancy on week-ends.
Financial Analysis

(6) Marina: Existing to remain. Vacancy rate is currently lower than 5%, however, in consideration of the 10%+ vacancy rate during the last recession, 7% vacancy is used for the proforma. Cash flow from the Marina will also support waterfront development with an attractive return, earning an unleveraged IRR of 15.2%.
(7) Open Space: Our waterfront plan includes an investment of $3.6 million on open space such as boardwalks, decks, and landscaping (excluding land cost) in order to at-tract visitors and serve as an amenity for adjacent Vulcan properties.
3. Exit Strategy(1) Block 25For condominiums, we assume all units will be sold by 2019. We recommend Vulcan sell the hotel and retail portion to a REIT or other institutional investors in 2023, be-cause these investors can offer more competitive and attractive prices than other local investors and developers.
(2) WaterfrontWe recommend that Vulcan holds onto the waterfront space, since the site will profit the whole of Southlake Union and can generate some return by refinancing proceeds. If Vulcan planned to sell the project as part of an exit strategy, we recommend Vulcan packages the sites with the Marina space since retail space will be difficult to sell with its relatively lower return.
2013 2014 2015 2016 2017 2018 2019 2020 2021 2022 2023SourcesEquity
Land $25,000,000 $0 $0 $0 $0 $0 $0 $0 $0 $0 $0Cash $22,984,209 $23,889,005 $789,889 $0 $0 $0 $0 $0 $0 $0 $0
$3,254,292Debt $0 $0 $75,377,647 $76,590,752 $0 $0 $0 $0 $0 $0 $0NOI $0 $0 $0 $0 $523,346 $6,060,634 $8,320,904 $8,613,321 $8,916,221 $8,636,118 $9,555,020Sales $0 $0 $0 $0 $118,380,518 $57,304,265 $20,524,779 $0 $0 $0 $139,412,274TOTAL $47,984,209 $23,889,005 $76,167,535 $76,590,752 $122,158,156 $63,364,899 $28,845,683 $8,613,321 $8,916,221 $8,636,118 $148,967,294
UsesDevelopment Cost $47,984,209 $23,889,005 $75,397,713 $75,057,175 $0 $0 $0 $0 $0 $0 $0Debt Service $0 $0 $769,822 $1,533,577 $8,850,182 $2,361,067 $2,361,067 $2,361,067 $2,361,067 $2,361,067 $2,361,067Principal Repayment $0 $0 $0 $0 $108,151,924 $0 $0 $0 $0 $0 $39,536,553Return on Equity $0 $0 $0 $0 $5,163,727 $61,003,832 $26,484,616 $6,252,254 $6,555,154 $6,275,051 $107,069,675TOTAL $47,984,209 $23,889,005 $76,167,535 $76,590,752 $122,165,833 $63,364,899 $28,845,683 $8,613,321 $8,916,221 $8,636,118 $148,967,294
2013 2014 2015 2016 2017 2018 2019 2020 2021 2022 2023
Source Equity $18,275,000 $0 $0 $0 $0 $0 $0 $0 $0 $0 $0Debt $0 $2,918,101 $14,945,166 $15,017,582 $0 $0 $0 $0 $0 $0 $0NOI $0 $915,181 $996,256 $1,091,953 $2,705,798 $3,425,569 $3,667,042 $3,777,054 $3,855,206 $3,790,171 $4,075,146Sales Proceeds $52,151,562TOTAL $18,275,000 $3,833,282 $15,941,421 $16,109,535 $2,705,798 $3,425,569 $3,667,042 $3,777,054 $3,855,206 $3,790,171 $56,226,708
Use Development Cost $18,275,000 $2,956,148 $15,316,207 $14,958,705 $0 $0 $0 $0 $0 $0 $0Debt Service $0 $102,134 $625,214 $1,150,830 $1,771,796 $1,771,796 $1,771,796 $1,771,796 $1,771,796 $1,771,796 $1,771,796Principal Repay $27,963,398Return on Equity $0 $775,000 $0 $0 $934,001 $1,653,773 $1,895,246 $2,005,257 $2,083,410 $2,018,374 $26,491,513TOTAL $18,275,000 $3,833,282 $15,941,421 $16,109,535 $2,705,798 $3,425,569 $3,667,042 $3,777,054 $3,855,206 $3,790,171 $56,226,708
BLOCK 25: SOURCES & USES
WATERFRONT: SOURCES & USES

ConclusionThe Mercer Blocks and The Lake Union Waterfront have a once in a lifetime opportunity to develop a truly iconic piece of Seattle—the shore of an urban Lake next to the city’s fastest growing district. These are high profile sites, with an ability to shape how South Lake Union is perceived both locally and globally. A successful development here can give South Lake Union the identity it has lacked until now; partly through iconic, landmark architecture, and partly through its ability to create holistic, memorable experiences at the ground plane and along the lakeshore.
Block 25 and the Waterfront are to be developed simultaneously with a 2017 target delivery date, leaving room for two years of entitlement and design, and an additional two years for construction. The market forecast is favorable for both hotel and condominium uses, and South Lake Union is expected to continue its impressive growth for the foreseeable future. On Block 25, we propose an iconic high-end condominium tower, surrounded by an architecturally significant 4-star hotel with upscale amenities and retail. Complementing Block 25 will be the new and improved Lake Union Waterfront, where we will increase open public leisure space while bringing thousands of new tourists and customers into the area with an extensive Thermal Pool destination situated amongst Restaurants, Retail, and Event Space, all connected by the new Aloha Path for pedestrians and cyclists.
The proposed improvements to the Lake Union Waterfront will generate external value for the Mercer Blocks and beyond, much of which will be captured by the investments on Block 25. In turn, Block 25’s financial returns will enable otherwise ambitious investment on the Waterfront sites. The new Waterfront development--combined with Lake Union Park, MOHAI, and the Center for Wooden Boats--will establish the district as a true multi-use destination for regional, domestic and global visitors.
Activation of South Lake Union’s tourism potential will help the neighborhood grow into a true 24/7 urban community, capable of attracting world-class talent to a rapidly expanding hub for life science and technology industries.
In conclusion, this development proposal for both Block 25 and Chandler’s Cove will be profitable and supported by the sites’ natural advantages, local economic growth, employment prospects, demographic trends, zoning changes, synergy of uses, and design and community characteristics. The Aqua View Proposal links the South Lake Union neighborhood with its namesake, achieving Vulcan’s investment goals while offering Seattle a destination to be proud of.

Intentionally left blank

Source: Visitor Impact to Seattle/King County
- 80% of overnight visitors to Seattle/King County are tourists. - 15% is for business purpose - Half of those visitors arrived by Air
Total Overnight Visitors 9.9 Million, Seattle-King Co.
Source: Dean Runyan Associates for Seattle’s Convention and Visitors Bureau
Hotel Market Analysis
1. Seattle Hotel Market Overview
50.0
55.0
60.0
65.0
70.0
75.0
80.0
2010 2011 2012 2013 2014 2015
Occupancy Rate Forecast
Seattle Seattle Downtown (All subtypes)
South Lake Union (Up Scale/Mid Price)
Forecast
Appendix: Hotel
Supplemental Market Data for Block 25 Hotel

2. Downtown SLU Market Overview
2002 2003 2004 2005 2006 2007 2008 2009 2010 2011Supply 36,275 36,397 36,560 36,261 36,814 37,421 38,176 39,232 40,129 40,564Demand 22,213 22,769 23,711 24,930 26,193 26,825 25,996 24,127 26,415 28,063Occ. Rate (%) 61.20 62.60 64.90 68.80 71.20 71.70 68.10 61.50 65.80 69.20
54.00
56.00
58.00
60.00
62.00
64.00
66.00
68.00
70.00
72.00
74.00
0
5,000
10,000
15,000
20,000
25,000
30,000
35,000
40,000
45,000Ro
oms
Seattle Hotel Market Overview
2002 2003 2004 2005 2006 2007 2008 2009 2010 2011 2012 2013 2014 2015 2016 2017ADR 96.59 95.49 98.14 104.26 116.76 125.87 130.23 115.98 113.23 117.62 124.14 128.68 131.73 135.59 138.52 140.97RevPAR 59.15 59.74 63.65 71.68 83.08 90.23 88.68 71.32 74.53 81.38 87.97 89.24 92.06 93.93 95.25 96.73RevPAR
(% Chg YOY) -‐6.70 1.00 6.50 12.60 15.90 8.60 -‐1.70 -‐19.60 4.50 9.20 8.10 1.40 3.20 2.00 1.40 1.60
-‐25.00
-‐20.00
-‐15.00
-‐10.00
-‐5.00
0.00
5.00
10.00
15.00
20.00
0.00
20.00
40.00
60.00
80.00
100.00
120.00
140.00
160.00
$/Rm
Seattle Hotel ADR, Rev PAR
2010 2011 2012(est)DownTown Seattle (Luxury) 74.8% 76.7% 77.0%Seattle South Lake Union
(Upscale/Mid Price) 72.7% 74.4% 76.0%
70.0%71.0%72.0%73.0%74.0%75.0%76.0%77.0%78.0%
Hotel Room Occupancy Rate
3. Downtown SLU Hotel Demand Analysis
3.1 Historical Demand
2010 2011 2012(est)DownTown Seattle (Luxury) 174 183 197Seattle South Lake Union
(Upscale/Mid Price) 132 133 141
0
50
100
150
200
250
ADR
2010 2011 2012(est)DownTown Seattle (Luxury) 130 140 152Seattle South Lake Union
(Upscale/Mid Price) 96 99 107
020406080
100120140160
Rev PAR
2009 2010 2011Total Overnight Visitors 8,800,000 9,300,000 9,900,000
Visitor LodgingExpenditure(Million) 533 1,100 1,000
0
200
400
600
800
1000
1200
8,200,0008,400,0008,600,0008,800,0009,000,0009,200,0009,400,0009,600,0009,800,000
10,000,000
Visitor to Seattle King County

4.2 Supply Forecast
New Hotel Supply in Downtown Seattle since 2005Hotel Name Rooms
Sheraton Seattle Hotel&Towers 415Olive 8 349Marriott Courtyard-Downtown Seattle 250Stadium Silver Cloud 237Hotel Max 165The 2200 160Hyatt Place Seattle/6th&Denny Apartments 158Four Seasons Hotel and Private Residences 149Hotel 1000/ Madison Tower 120Arctic Club Hotel (renovation) 120Alexis Hotel (renovation and addition) 12
2006 2007 2008 2009 2010 2011 2012Supplied Room 280 652 269 429 408 0 0
0
100
200
300
400
500
600
700
Room
s
Supplied Hotel Room in Downtown Seattle
Future Hotel Development Project in Downtown Seattle as at 2012 Name Status Address Completion Category
Red Union Hotel Renovation Under Construction 1415 5th Ave 2014 HotelStadium Place Phase 2 Permitted and Scheduled 201 S King St 2015 Hotel/Residential2000 Third Ave Apartments On Hold 2000 3rd Ave TBD Hotel/ResidentialBest Western Exective Inn (expansion) Proposed, Unpermitted 200 Taylor Ave N TBD Hotel1903 5th Ave Hotel Proposed, Unpermitted 1903 5th Ave TBD HotelHill7 Proposed, Unpermitted Stewart and Boren TBD HotelStanford Hotel Proposed, Unpermitted 300 Terry Ave N TBD HotelHyatt House Proposed, Unpermitted 416 John St 2015 Hotel/Residential2nd and Pine Proposed, Unpermitted 1608 2nd Ave 2016 Hotel/Residential417 Broad St Proposed, Unpermitted 417 Broad St TBD Hotel/ResidentialGreyHound Station Site Proposed, Unpermitted 811 Stewart St TBD Hotel/Residential1900 1st Ave Proposed, Unpermitted 1900 1st Ave TBD Hotel/Residential1200 Stewart Proposed, Unpermitted 1200 Stewart St TBD Hotel/Residential2nd and Virginia Proposed, Unpermitted 1931 2nd Ave TBD Hotel/ResidentialSecond & Stewart Proposed, Unpermitted 1613 2nd Ave TBD Hotel/Residential
3.2 Demand Forecast
4. Downtown SLU Hotel Supply Analysis 4.1 Historical Supply
Visiting Friends/Relati
ves37%
Pleasure/Vacation43%
Business10%
Convention/Conference
5%
Other5%
Purpose of Overnight Trip (2010)
Arrived by Air51%
Arrived by Auto46%
Others3%
Transportation
-‐6%-‐4%-‐2%0%2%4%6%8%10%
05,000,00010,000,00015,000,00020,000,00025,000,00030,000,00035,000,00040,000,000
2000 2001 2002 2003 2004 2005 2006 2007 2008 2009 2010 2011 2012 2013 2014
Seatac Air Passanger Levels
Changing Percentage Total

Appendix: Waterfront

NAIOP Real Estate Challenge
Waterfront
Total Building 1 Building 2 w/ Parking Building 3 Discovery Center Marina
DESIGN ASSUMPTIONS GROSS SF 154,478 19,625 84,490 24,118 26,244 NA
Efficiency Factor 90% 90% 90% 90% 90% NA RENTABLE SF 143,509 17,663 80,520 21,706 23,620 NA
Restaurant: 8,438 NSF Marine Retail & office: 11,188 NSF
Spa: 26,010 NSFRestaurant: 9,720 NSFParking: 44,790 NSF
Restaurant: 9,063 NSFCasual Dining: 8,937NSF Marine Retail: 3,670 NSF
Event Space: 6,900NSFSales Office: 3,000NSF
Café and Bar: 4,270 NSFParking: 10,500 SF
81 Deck (4,806 Lineal Foot)
Average Unit SF NA NA 350SF/ parking space NA 350SF/ surface parking NAPARKING STALLS 127 2.29/1,000 NSF NA
COST ASSUMPTIONS LAND VALUE PER DEVELOPMENT UNIT $52/NSF Building is used as existing $27/NSF $69/NSF $63/NSF NA
SITE - INFRASTRUCTURE ( $ / SF OF SITE ) $30.0 NA $30 $30 $30 NABUILDING SHELL ( $ / Gross SF ) NA Building is used as existing Spa: $250/SF
Restaurant: $185/SFRestaurant: $185/SF
Casual Dining: $160/SFMarina Retail: $130/SF
Discovery Center: $110K for Moving
Café & Bar: $160/SF
Marina is used as existing
TENANT IMPROVEMENT ($ / Net SF ) NA Building is used as existing Spa: $100/SFRestaurant: $100/SF
Restaurant: $100/SFCasual Dining: $100/SFMarina Retail: $80/SF
Café & Bar: $90/SF Marina is used as existing
PARKING ABOVE GRADE ($ / STALL) Surface Parking: $15,000/ stall
PARKING BELOW GRADE ($ / STALL)
SOFT COST ( % of hard costs ) NA Included Building Shell Included Building Shell Included Building Shell Included Parking Bld Cost NABASE YR. OPERATING EXPENSES ( $ / Gross SF / YR ) NA $1.15/SF Spa: $2.00/SF
Resutaurant: $1.15/SF$1.15/SF Event & Sales: $6.00/SF
Café & Bar: $1.15/SF20% Gross Revenue
INCOME ASSUMPTIONSRENTAL INCOME ( $ / Net SF / MO ) NA $30/NSF
Marina Retail & Office: $25/NSF
Spa: $23.5/NSFRestaurant: $31/NSF
Restaurant: $30/ NSFCasual Dining: $26/ NSFMarina Retail: $25/NSF
Event: $550/day/spaceCafé & Bar: $26/NSF
$15/Lineal Foot/month
Financial Underwriting Summary
NA
Surface Cost: $10,000/stall (Parking is
used as existing and covered by surface)
1.69/1,000 NSF
PARKING INCOME ( $ / SF / MO ) NA NA $140/stall/ mo$4.00/hour
NA $4.00/hour NA
VALUE ASSUMPTIONDiscount Rate NA 8.00% 8.00% 8.00% 8.00% 8.00%
Exit Capitalization Rate NA 7.00% 7.00% 7.00% 7.00% 12.00%NET PRESENT VALUE ( $ / NSF ) ($40.46) $1.77 ($71.51) ($71.62) ($17.48)
VALUE TOTAL $ ($5,806,561) $31,346 ($5,757,870) ($1,554,684) ($412,933) $1,887,580Unleveraged IRR Before Taxes 6.4% 8.1% 4.3% 4.9% 7.0% 15.2%
Leveraged IRR Before Taxes 8.7% NA NA NA NA NA
DEBT ASSUMPTIONSLOAN TO VALUE 65% NA NA NA NA NA
Average DEBT SERVICE COVERAGE 1.90 NA NA NA NA NATOTAL DEBT $32,880,848 NA NA NA NA NA
NET EQUITY During Development (Inclu Land) $17,500,000 NA NA NA NA NA
Hard & Soft Cost NotesExcludes 9.5% Washington State Sales TaxAssumes pricing in the construction year LEED Silver certificateIncludes contingencies
WATERFRONT KEY ASSUMPTIONS

NAIOP Real Estate Challenge
Waterfront
Total Building 1 Building 2 w/ Parking Building 3 Discovery Center Marina
DESIGN ASSUMPTIONS GROSS SF 154,478 19,625 84,490 24,118 26,244 NA
Efficiency Factor 90% 90% 90% 90% 90% NA RENTABLE SF 143,509 17,663 80,520 21,706 23,620 NA
Restaurant: 8,438 NSF Marine Retail & office: 11,188 NSF
Spa: 26,010 NSFRestaurant: 9,720 NSFParking: 44,790 NSF
Restaurant: 9,063 NSFCasual Dining: 8,937NSF Marine Retail: 3,670 NSF
Event Space: 6,900NSFSales Office: 3,000NSF
Café and Bar: 4,270 NSFParking: 10,500 SF
81 Deck (4,806 Lineal Foot)
Average Unit SF NA NA 350SF/ parking space NA 350SF/ surface parking NAPARKING STALLS 127 2.29/1,000 NSF NA
COST ASSUMPTIONS LAND VALUE PER DEVELOPMENT UNIT $52/NSF Building is used as existing $27/NSF $69/NSF $63/NSF NA
SITE - INFRASTRUCTURE ( $ / SF OF SITE ) $30.0 NA $30 $30 $30 NABUILDING SHELL ( $ / Gross SF ) NA Building is used as existing Spa: $250/SF
Restaurant: $185/SFRestaurant: $185/SF
Casual Dining: $160/SFMarina Retail: $130/SF
Discovery Center: $110K for Moving
Café & Bar: $160/SF
Marina is used as existing
TENANT IMPROVEMENT ($ / Net SF ) NA Building is used as existing Spa: $100/SFRestaurant: $100/SF
Restaurant: $100/SFCasual Dining: $100/SFMarina Retail: $80/SF
Café & Bar: $90/SF Marina is used as existing
PARKING ABOVE GRADE ($ / STALL) Surface Parking: $15,000/ stall
PARKING BELOW GRADE ($ / STALL)
SOFT COST ( % of hard costs ) NA Included Building Shell Included Building Shell Included Building Shell Included Parking Bld Cost NABASE YR. OPERATING EXPENSES ( $ / Gross SF / YR ) NA $1.15/SF Spa: $2.00/SF
Resutaurant: $1.15/SF$1.15/SF Event & Sales: $6.00/SF
Café & Bar: $1.15/SF20% Gross Revenue
INCOME ASSUMPTIONSRENTAL INCOME ( $ / Net SF / MO ) NA $30/NSF
Marina Retail & Office: $25/NSF
Spa: $23.5/NSFRestaurant: $31/NSF
Restaurant: $30/ NSFCasual Dining: $26/ NSFMarina Retail: $25/NSF
Event: $550/day/spaceCafé & Bar: $26/NSF
$15/Lineal Foot/month
Financial Underwriting Summary
NA
Surface Cost: $10,000/stall (Parking is
used as existing and covered by surface)
1.69/1,000 NSF
PARKING INCOME ( $ / SF / MO ) NA NA $140/stall/ mo$4.00/hour
NA $4.00/hour NA
VALUE ASSUMPTIONDiscount Rate NA 8.00% 8.00% 8.00% 8.00% 8.00%
Exit Capitalization Rate NA 7.00% 7.00% 7.00% 7.00% 12.00%NET PRESENT VALUE ( $ / NSF ) ($40.46) $1.77 ($71.51) ($71.62) ($17.48)
VALUE TOTAL $ ($5,806,561) $31,346 ($5,757,870) ($1,554,684) ($412,933) $1,887,580Unleveraged IRR Before Taxes 6.4% 8.1% 4.3% 4.9% 7.0% 15.2%
Leveraged IRR Before Taxes 8.7% NA NA NA NA NA
DEBT ASSUMPTIONSLOAN TO VALUE 65% NA NA NA NA NA
Average DEBT SERVICE COVERAGE 1.90 NA NA NA NA NATOTAL DEBT $32,880,848 NA NA NA NA NA
NET EQUITY During Development (Inclu Land) $17,500,000 NA NA NA NA NA
Hard & Soft Cost NotesExcludes 9.5% Washington State Sales TaxAssumes pricing in the construction year LEED Silver certificateIncludes contingencies
WATERFRONT SUMMARY
1. Space Summary
FAR Stories Total SF Efficiency Factor NSF Avg. space sf No of Unit Unit Cost Total CostLand Use Building 1 19,625 (sf.) 90% 17,663 (sf.) - (sf./store) $350.20 (per NSF) $7,055,191Candler's Cove 179,361 (sf.) Restaurant 8,438 (sf.) 90% 7,594 (sf.) 7,594 (sf./ store) 1 (store) Building 1 w/ open space 24,672 Marina Retail & Office 11,187 (sf.) 90% 10,068 (sf.) 1,007 (sf./ store, office) 10 (store) Building 2 w/ open space 88,902 Building 2 39,700 (sf.) 90% 35,730 (sf.) - $583.65 (per NSF) $20,853,767 Building 3 w/ open space 65,787 Spa 28,900 (sf.) 90% 26,010 (sf.) 26,010 (sf./spa) 1 (spa) ( Total Open Space bldg 1-3) 98,660 (s.f.) Restaurant 10,800 (sf.) 90% 9,720 (sf.) 9,720 (sf./store) 1 (restaurant)H.C. Henry Pier 153,378 (sf.) Building 3 24,118 (sf.) 90% 21,706 (sf.) - $482.62 (per NSF) $10,475,718 Discovery Center (Event Space + Sales Office) 11,000 Marina Retail & Office 4,078 (sf.) 90% 3,670 (sf.) 1,223 (sf./store) 3 (store) Café & Bar 4,744 Restaurant 10,070 (sf.) 90% 9,063 (sf.) 9,063 (sf./store) 1 (restaurnt) Surface Parking 10,500 (sf.) Casual Dining 9,970 (sf.) 90% 8,973 (sf.) 2,991 (sf./store) 3 (restaurant) Open Space 127,134 (sf.) Parking (Chandler's cove) 44,790 (sf.) 100% 44,790 (sf.) 350 (sf./stall) 127 (stall) $14,146 (per stall) $1,796,525Total 332,739 (sf.) H.C. Henry Pier 26,244 (sf.) 90% 23,620 (sf.) $318.74 (per NSF) $7,528,714(Marina) of ground lease 45,279 (sf.) Event Space 7,667 (sf.) 90% 6,900 (sf.) 3,450 (sf/ space) 2 (space)Building Foot Print Sales Office 3,333 (sf.) 90% 3,000 (sf.) 3,000 (sf/ space) 1 (space) Building 1 11,101 (sf.) Café & Bar 4,744 (sf.) 90% 4,270 (sf.) 2,135 (sf/ store) 2 (restaurant) Building 2 + Parking 40,000 (sf.) Surface Parking 10,500 (sf.) 100% 10,500 (sf.) 350 (sf./ stall) 30 (stall) Building 3 29,600 (sf.) Marina - - - 61 (Lenial Foot/ deck) 72 (deck) $52,724.23 (per deck) $3,796,144 Discovery Center 26,244 (sf.) Total 154,478 (sf.) Total 143,509 (sf.) $51,506,060
Land Program Building Summary NSF Space
2. Summary ProformaYear 0 Year 1 Year 2 Year 3 Year 4 Year 5 Year 6 Year 7 Year 8 Year 9 Year 102013 2014 2015 2016 2017 2018 2019 2020 2021 2022 2023
Net Operating IncomeRent/ Sales $0 $1,309,680 $1,774,921 $1,828,169 $5,226,303 $5,517,758 $5,821,996 $5,996,656 $6,176,556 $6,361,853 $6,552,708Building 1 $0 $493,920 $508,737 $523,999 $539,719 $555,911 $572,588 $589,766 $607,459 $625,682 $644,453Building 2 $0 $0 $0 $0 $1,027,089 $1,057,901 $1,089,638 $1,122,328 $1,155,997 $1,190,677 $1,226,398Building 3 $0 $0 $0 $0 $671,859 $692,015 $712,775 $734,158 $756,183 $778,869 $802,235H.C. Henry Pier $0 $0 $425,951 $438,730 $1,759,981 $1,812,780 $1,867,163 $1,923,178 $1,980,874 $2,040,300 $2,101,509Parking (Chandler's cove) $0 $0 $0 $0 $336,252 $481,006 $634,142 $653,166 $672,761 $692,944 $713,732Marina $0 $815,760 $840,233 $865,440 $891,403 $918,145 $945,689 $974,060 $1,003,282 $1,033,380 $1,064,382Vacancy & Credit Loss $0 ($81,799) ($403,717) ($350,019) ($1,670,895) ($1,217,090) ($1,253,603) ($1,291,211) ($1,365,106) ($1,586,751) ($1,463,084) (%) $0 32.0% 22.1% 21.5% 21.5% 22.1% 24.9% 22.3%Building 1 $0 ($24,696) ($25,437) ($26,200) ($26,986) ($27,796) ($28,629) ($29,488) ($30,373) ($31,284) ($32,223)Building 2 $0 $0 $0 $0 ($256,772) $0 $0 $0 $0 ($98,289) ($20,247)Building 3 $0 $0 $0 $0 ($128,136) $0 $0 $0 $0 ($118,617) ($24,435)H.C. Henry Pier $0 $0 ($319,464) ($263,238) ($1,196,603) ($1,125,024) ($1,158,775) ($1,193,538) ($1,264,504) ($1,266,225) ($1,311,672)Marina $0 ($57,103) ($58,816) ($60,581) ($62,398) ($64,270) ($66,198) ($68,184) ($70,230) ($72,337) ($74,507)Effective Gross Income $0 $1,227,880 $1,371,205 $1,478,150 $3,555,407 $4,300,668 $4,568,393 $4,705,445 $4,811,449 $4,775,101 $5,089,624Operating Cost $0 ($312,700) ($374,949) ($386,197) ($849,610) ($875,098) ($901,351) ($928,391) ($956,243) ($984,931) ($1,014,478)Building 1 $0 ($23,246) ($23,944) ($24,662) ($25,402) ($26,164) ($26,949) ($27,757) ($28,590) ($29,448) ($30,331)Building 2 $0 $0 $0 $0 ($79,033) ($81,404) ($83,846) ($86,362) ($88,953) ($91,621) ($94,370)Building 3 $0 $0 $0 $0 ($31,216) ($32,153) ($33,118) ($34,111) ($35,134) ($36,188) ($37,274)H.C. Henry Pier $0 $0 ($52,868) ($54,454) ($115,245) ($118,702) ($122,263) ($125,931) ($129,709) ($133,600) ($137,608)Parking (Chandler's cove) $0 $0 $0 $0 ($218,887) ($225,454) ($232,217) ($239,184) ($246,359) ($253,750) ($261,362)Marina $0 ($289,453) ($298,137) ($307,081) ($316,293) ($325,782) ($335,556) ($345,622) ($355,991) ($366,671) ($377,671)Open Space $0 $0 $0 $0 ($63,533) ($65,439) ($67,402) ($69,424) ($71,507) ($73,652) ($75,862)
NOI $0 $915,181 $996,256 $1,091,953 $2,705,798 $3,425,569 $3,667,042 $3,777,054 $3,855,206 $3,790,171 $4,075,146Sales Proceeds $53,764,497Transaction Cost 3% ($1,612,935)Net Sales Proceeds $52,151,562

NAIOP Real Estate Challenge
Waterfront
Total Building 1 Building 2 w/ Parking Building 3 Discovery Center Marina
DESIGN ASSUMPTIONS GROSS SF 154,478 19,625 84,490 24,118 26,244 NA
Efficiency Factor 90% 90% 90% 90% 90% NA RENTABLE SF 143,509 17,663 80,520 21,706 23,620 NA
Restaurant: 8,438 NSF Marine Retail & office: 11,188 NSF
Spa: 26,010 NSFRestaurant: 9,720 NSFParking: 44,790 NSF
Restaurant: 9,063 NSFCasual Dining: 8,937NSF Marine Retail: 3,670 NSF
Event Space: 6,900NSFSales Office: 3,000NSF
Café and Bar: 4,270 NSFParking: 10,500 SF
81 Deck (4,806 Lineal Foot)
Average Unit SF NA NA 350SF/ parking space NA 350SF/ surface parking NAPARKING STALLS 127 2.29/1,000 NSF NA
COST ASSUMPTIONS LAND VALUE PER DEVELOPMENT UNIT $52/NSF Building is used as existing $27/NSF $69/NSF $63/NSF NA
SITE - INFRASTRUCTURE ( $ / SF OF SITE ) $30.0 NA $30 $30 $30 NABUILDING SHELL ( $ / Gross SF ) NA Building is used as existing Spa: $250/SF
Restaurant: $185/SFRestaurant: $185/SF
Casual Dining: $160/SFMarina Retail: $130/SF
Discovery Center: $110K for Moving
Café & Bar: $160/SF
Marina is used as existing
TENANT IMPROVEMENT ($ / Net SF ) NA Building is used as existing Spa: $100/SFRestaurant: $100/SF
Restaurant: $100/SFCasual Dining: $100/SFMarina Retail: $80/SF
Café & Bar: $90/SF Marina is used as existing
PARKING ABOVE GRADE ($ / STALL) Surface Parking: $15,000/ stall
PARKING BELOW GRADE ($ / STALL)
SOFT COST ( % of hard costs ) NA Included Building Shell Included Building Shell Included Building Shell Included Parking Bld Cost NABASE YR. OPERATING EXPENSES ( $ / Gross SF / YR ) NA $1.15/SF Spa: $2.00/SF
Resutaurant: $1.15/SF$1.15/SF Event & Sales: $6.00/SF
Café & Bar: $1.15/SF20% Gross Revenue
INCOME ASSUMPTIONSRENTAL INCOME ( $ / Net SF / MO ) NA $30/NSF
Marina Retail & Office: $25/NSF
Spa: $23.5/NSFRestaurant: $31/NSF
Restaurant: $30/ NSFCasual Dining: $26/ NSFMarina Retail: $25/NSF
Event: $550/day/spaceCafé & Bar: $26/NSF
$15/Lineal Foot/month
Financial Underwriting Summary
NA
Surface Cost: $10,000/stall (Parking is
used as existing and covered by surface)
1.69/1,000 NSF
PARKING INCOME ( $ / SF / MO ) NA NA $140/stall/ mo$4.00/hour
NA $4.00/hour NA
VALUE ASSUMPTIONDiscount Rate NA 8.00% 8.00% 8.00% 8.00% 8.00%
Exit Capitalization Rate NA 7.00% 7.00% 7.00% 7.00% 12.00%NET PRESENT VALUE ( $ / NSF ) ($40.46) $1.77 ($71.51) ($71.62) ($17.48)
VALUE TOTAL $ ($5,806,561) $31,346 ($5,757,870) ($1,554,684) ($412,933) $1,887,580Unleveraged IRR Before Taxes 6.4% 8.1% 4.3% 4.9% 7.0% 15.2%
Leveraged IRR Before Taxes 8.7% NA NA NA NA NA
DEBT ASSUMPTIONSLOAN TO VALUE 65% NA NA NA NA NA
Average DEBT SERVICE COVERAGE 1.90 NA NA NA NA NATOTAL DEBT $32,880,848 NA NA NA NA NA
NET EQUITY During Development (Inclu Land) $17,500,000 NA NA NA NA NA
Hard & Soft Cost NotesExcludes 9.5% Washington State Sales TaxAssumes pricing in the construction year LEED Silver certificateIncludes contingencies
WATERFRONT SUMMARY
3. Development ProgramTotal CostLand Cost ($7,518,318) ($7,518,318)Demolishment Cost ($1,209,018) $0 ($1,209,018) $0 $0 $0 $0 $0 $0 $0 $0 $0Development Cost ($32,797,042) ($775,000) ($1,747,130) ($15,316,207) ($14,958,705) $0 $0 $0 $0 $0 $0 $0
Building 2 ($15,825,620) ($250,000) ($250,000) ($7,373,511) ($7,952,109) $0 $0 $0 $0 $0 $0 $0Building 3 ($8,037,686) ($250,000) ($250,000) ($3,592,648) ($3,945,038) $0 $0 $0 $0 $0 $0 $0H.C. Henry Pier ($3,476,102) ($250,000) ($1,222,130) ($664,981) ($1,338,990) $0 $0 $0 $0 $0 $0 $0Parking (Chandler's cove) ($1,796,525) ($25,000) ($25,000) ($523,958) ($1,222,568) $0 $0 $0 $0 $0 $0 $0
Open Space ($3,661,110) $0 $0 ($3,161,110) ($500,000) $0 $0 $0 $0 $0 $0 $0Purchasing Cost Building 1 ($6,185,537) ($6,185,537)
Marina ($3,796,144) ($3,796,144)Total Development Cost ($51,506,060) ($18,275,000) ($2,956,148) ($15,316,207) ($14,958,705) $0 $0 $0 $0 $0 $0 $0
4. Source/ FinancialDebt/ Service 3.50% ($102,134) ($625,214) ($1,150,830) ($1,771,796) ($1,771,796) ($1,771,796) ($1,771,796) ($1,771,796) ($1,771,796) ($1,771,796)Principal Amortization 30 Years ($631,026) ($653,469) ($676,711) ($700,780) ($725,704) ($751,515) ($778,244)Principal Repay at sale ($27,963,398)Equity (Land + Equity) $18,275,000 $18,275,000(Cash Contribution) $775,000 $775,000 $0Net Sales Proceeds to Equity $24,188,163Debt $2,918,101 $14,945,166 $15,017,582Debt Amount $32,880,848 $2,918,101 $17,863,267 $32,880,848 $32,249,823 $31,596,353 $30,919,642 $30,218,863 $29,493,158 $28,741,643 $27,963,398
Start Period 1 13 25 37 49 61 73End Period 12 24 36 48 60 72 84
Present Value/ Project Cost Yellow: Total Project Cost $53,384,238 $53,384,238 $53,384,238 $45,336,955 $48,430,888 $49,883,815 $50,878,055 $49,823,089 $53,764,497LTC/ LTV 33.5% 61.6% 60.4% 69.7% 63.8% 60.6% 58.0% 57.7% 52.0%DSCR 0.95 1.53 1.93 2.07 2.13 2.18 2.14 2.30
5. Source & UseUse Development Cost$18,275,000 $2,956,148 $15,316,207 $14,958,705 $0 $0 $0 $0 $0 $0 $0
Debt Service $0 $102,134 $625,214 $1,150,830 $1,771,796 $1,771,796 $1,771,796 $1,771,796 $1,771,796 $1,771,796 $1,771,796Principal Repay $27,963,398Return on Equity $0 $775,000 $0 $0 $934,001 $1,653,773 $1,895,246 $2,005,257 $2,083,410 $2,018,374 $26,491,513
Sub Total $18,275,000 $3,833,282 $15,941,421 $16,109,535 $2,705,798 $3,425,569 $3,667,042 $3,777,054 $3,855,206 $3,790,171 $56,226,708Source Equity $18,275,000 $0 $0 $0 $0 $0 $0 $0 $0 $0 $0
Debt $0 $2,918,101 $14,945,166 $15,017,582 $0 $0 $0 $0 $0 $0 $0NOI $0 $915,181 $996,256 $1,091,953 $2,705,798 $3,425,569 $3,667,042 $3,777,054 $3,855,206 $3,790,171 $4,075,146Sales Proceeds $52,151,562
Sub Total $18,275,000 $3,833,282 $15,941,421 $16,109,535 $2,705,798 $3,425,569 $3,667,042 $3,777,054 $3,855,206 $3,790,171 $56,226,708
6. Return/ Cash FlowNet Property Cash Flow ($18,275,000) ($2,040,967) ($14,319,951) ($13,866,752) $2,705,798 $3,425,569 $3,667,042 $3,777,054 $3,855,206 $3,790,171 $56,226,708Net Equity Cash Flow ($18,275,000) $775,000 $0 $0 $934,001 $1,653,773 $1,895,246 $2,005,257 $2,083,410 $2,018,374 $26,491,513Cash on Cash on Equity per Year (%) 5.3% 9.5% 10.8% 11.5% 11.9% 11.5% 151.4%Total Return on Project Equity 111.9%Cumulative Total Benefit ($18,275,000) ($17,500,000) ($17,500,000) ($17,500,000) ($16,565,999) ($14,912,226) ($13,016,980) ($11,011,722) ($8,928,313) ($6,909,938) $19,581,575Net Present Value 8% ($4,251,877)Project IRR (Unleveraged) 6.4%Project IRR (Leveraged) 8.7%

NAIOP Real Estate Challenge
Waterfront
Total Building 1 Building 2 w/ Parking Building 3 Discovery Center Marina
DESIGN ASSUMPTIONS GROSS SF 154,478 19,625 84,490 24,118 26,244 NA
Efficiency Factor 90% 90% 90% 90% 90% NA RENTABLE SF 143,509 17,663 80,520 21,706 23,620 NA
Restaurant: 8,438 NSF Marine Retail & office: 11,188 NSF
Spa: 26,010 NSFRestaurant: 9,720 NSFParking: 44,790 NSF
Restaurant: 9,063 NSFCasual Dining: 8,937NSF Marine Retail: 3,670 NSF
Event Space: 6,900NSFSales Office: 3,000NSF
Café and Bar: 4,270 NSFParking: 10,500 SF
81 Deck (4,806 Lineal Foot)
Average Unit SF NA NA 350SF/ parking space NA 350SF/ surface parking NAPARKING STALLS 127 2.29/1,000 NSF NA
COST ASSUMPTIONS LAND VALUE PER DEVELOPMENT UNIT $52/NSF Building is used as existing $27/NSF $69/NSF $63/NSF NA
SITE - INFRASTRUCTURE ( $ / SF OF SITE ) $30.0 NA $30 $30 $30 NABUILDING SHELL ( $ / Gross SF ) NA Building is used as existing Spa: $250/SF
Restaurant: $185/SFRestaurant: $185/SF
Casual Dining: $160/SFMarina Retail: $130/SF
Discovery Center: $110K for Moving
Café & Bar: $160/SF
Marina is used as existing
TENANT IMPROVEMENT ($ / Net SF ) NA Building is used as existing Spa: $100/SFRestaurant: $100/SF
Restaurant: $100/SFCasual Dining: $100/SFMarina Retail: $80/SF
Café & Bar: $90/SF Marina is used as existing
PARKING ABOVE GRADE ($ / STALL) Surface Parking: $15,000/ stall
PARKING BELOW GRADE ($ / STALL)
SOFT COST ( % of hard costs ) NA Included Building Shell Included Building Shell Included Building Shell Included Parking Bld Cost NABASE YR. OPERATING EXPENSES ( $ / Gross SF / YR ) NA $1.15/SF Spa: $2.00/SF
Resutaurant: $1.15/SF$1.15/SF Event & Sales: $6.00/SF
Café & Bar: $1.15/SF20% Gross Revenue
INCOME ASSUMPTIONSRENTAL INCOME ( $ / Net SF / MO ) NA $30/NSF
Marina Retail & Office: $25/NSF
Spa: $23.5/NSFRestaurant: $31/NSF
Restaurant: $30/ NSFCasual Dining: $26/ NSFMarina Retail: $25/NSF
Event: $550/day/spaceCafé & Bar: $26/NSF
$15/Lineal Foot/month
Financial Underwriting Summary
NA
Surface Cost: $10,000/stall (Parking is
used as existing and covered by surface)
1.69/1,000 NSF
PARKING INCOME ( $ / SF / MO ) NA NA $140/stall/ mo$4.00/hour
NA $4.00/hour NA
VALUE ASSUMPTIONDiscount Rate NA 8.00% 8.00% 8.00% 8.00% 8.00%
Exit Capitalization Rate NA 7.00% 7.00% 7.00% 7.00% 12.00%NET PRESENT VALUE ( $ / NSF ) ($40.46) $1.77 ($71.51) ($71.62) ($17.48)
VALUE TOTAL $ ($5,806,561) $31,346 ($5,757,870) ($1,554,684) ($412,933) $1,887,580Unleveraged IRR Before Taxes 6.4% 8.1% 4.3% 4.9% 7.0% 15.2%
Leveraged IRR Before Taxes 8.7% NA NA NA NA NA
DEBT ASSUMPTIONSLOAN TO VALUE 65% NA NA NA NA NA
Average DEBT SERVICE COVERAGE 1.90 NA NA NA NA NATOTAL DEBT $32,880,848 NA NA NA NA NA
NET EQUITY During Development (Inclu Land) $17,500,000 NA NA NA NA NA
Hard & Soft Cost NotesExcludes 9.5% Washington State Sales TaxAssumes pricing in the construction year LEED Silver certificateIncludes contingencies
WATERFRONT: OPEN SPACE
Development Cost and Operating Cost for Open Space are allocated to each use.Year 0 Year 1 Year 2 Year 3 Year 4 Year 5 Year 6 Year 7 Year 8 Year 9 Year 10
Input Total 2013 2014 2015 2016 2017 2018 2019 2020 2021 2022 2023Inflation Factor 3%Open Space Development 59% 0% 35% 6% 0% 0% 0% 0% 0% 0% 0%
225,794 sf ($5,277,945) ($5,277,945)$12.00 ($2,709,523) ($2,709,523)$2.00 ($451,587) ($451,587)
($500,000) ($500,000)($8,939,055) ($5,277,945) $0 ($3,161,110) ($500,000) $0 $0 $0 $0 $0 $0 $0
Operating Cost225,794 s.f. ($63,533) ($65,439) ($67,402) ($69,424) ($71,507) ($73,652) ($75,862)
$0.25 $0.25 $0.26 $0.27 $0.27 $0.28 $0.29 $0.30 $0.31 $0.32 $0.33 $0.34
Permiting & Planning Construction Operation
OPEN SPACE INFRAESTRUCTURE
Land CostLandscaping
Public AmmenitiesPedestrian Bridge/ Boardwalk
Subtotal
Operating CostOperating Cost Per sf
Cash Flow($5,277,945) $0 ($3,161,110) ($500,000) ($63,533) ($65,439) ($67,402) ($69,424) ($71,507) ($73,652) ($75,862)Total Cash Flow
Net Present Value of Costs 8% ($8,027,629)

NAIOP Real Estate Challenge
Waterfront
Total Building 1 Building 2 w/ Parking Building 3 Discovery Center Marina
DESIGN ASSUMPTIONS GROSS SF 154,478 19,625 84,490 24,118 26,244 NA
Efficiency Factor 90% 90% 90% 90% 90% NA RENTABLE SF 143,509 17,663 80,520 21,706 23,620 NA
Restaurant: 8,438 NSF Marine Retail & office: 11,188 NSF
Spa: 26,010 NSFRestaurant: 9,720 NSFParking: 44,790 NSF
Restaurant: 9,063 NSFCasual Dining: 8,937NSF Marine Retail: 3,670 NSF
Event Space: 6,900NSFSales Office: 3,000NSF
Café and Bar: 4,270 NSFParking: 10,500 SF
81 Deck (4,806 Lineal Foot)
Average Unit SF NA NA 350SF/ parking space NA 350SF/ surface parking NAPARKING STALLS 127 2.29/1,000 NSF NA
COST ASSUMPTIONS LAND VALUE PER DEVELOPMENT UNIT $52/NSF Building is used as existing $27/NSF $69/NSF $63/NSF NA
SITE - INFRASTRUCTURE ( $ / SF OF SITE ) $30.0 NA $30 $30 $30 NABUILDING SHELL ( $ / Gross SF ) NA Building is used as existing Spa: $250/SF
Restaurant: $185/SFRestaurant: $185/SF
Casual Dining: $160/SFMarina Retail: $130/SF
Discovery Center: $110K for Moving
Café & Bar: $160/SF
Marina is used as existing
TENANT IMPROVEMENT ($ / Net SF ) NA Building is used as existing Spa: $100/SFRestaurant: $100/SF
Restaurant: $100/SFCasual Dining: $100/SFMarina Retail: $80/SF
Café & Bar: $90/SF Marina is used as existing
PARKING ABOVE GRADE ($ / STALL) Surface Parking: $15,000/ stall
PARKING BELOW GRADE ($ / STALL)
SOFT COST ( % of hard costs ) NA Included Building Shell Included Building Shell Included Building Shell Included Parking Bld Cost NABASE YR. OPERATING EXPENSES ( $ / Gross SF / YR ) NA $1.15/SF Spa: $2.00/SF
Resutaurant: $1.15/SF$1.15/SF Event & Sales: $6.00/SF
Café & Bar: $1.15/SF20% Gross Revenue
INCOME ASSUMPTIONSRENTAL INCOME ( $ / Net SF / MO ) NA $30/NSF
Marina Retail & Office: $25/NSF
Spa: $23.5/NSFRestaurant: $31/NSF
Restaurant: $30/ NSFCasual Dining: $26/ NSFMarina Retail: $25/NSF
Event: $550/day/spaceCafé & Bar: $26/NSF
$15/Lineal Foot/month
Financial Underwriting Summary
NA
Surface Cost: $10,000/stall (Parking is
used as existing and covered by surface)
1.69/1,000 NSF
PARKING INCOME ( $ / SF / MO ) NA NA $140/stall/ mo$4.00/hour
NA $4.00/hour NA
VALUE ASSUMPTIONDiscount Rate NA 8.00% 8.00% 8.00% 8.00% 8.00%
Exit Capitalization Rate NA 7.00% 7.00% 7.00% 7.00% 12.00%NET PRESENT VALUE ( $ / NSF ) ($40.46) $1.77 ($71.51) ($71.62) ($17.48)
VALUE TOTAL $ ($5,806,561) $31,346 ($5,757,870) ($1,554,684) ($412,933) $1,887,580Unleveraged IRR Before Taxes 6.4% 8.1% 4.3% 4.9% 7.0% 15.2%
Leveraged IRR Before Taxes 8.7% NA NA NA NA NA
DEBT ASSUMPTIONSLOAN TO VALUE 65% NA NA NA NA NA
Average DEBT SERVICE COVERAGE 1.90 NA NA NA NA NATOTAL DEBT $32,880,848 NA NA NA NA NA
NET EQUITY During Development (Inclu Land) $17,500,000 NA NA NA NA NA
Hard & Soft Cost NotesExcludes 9.5% Washington State Sales TaxAssumes pricing in the construction year LEED Silver certificateIncludes contingencies
WATERFRONT: BUILDING 1 CF
Year 0 Year 1 Year 2 Year 3 Year 4 Year 5 Year 6 Year 7 Year 8 Year 9 Year 10
Input Unit Unit Value Total 2013 2014 2015 2016 2017 2018 2019 2020 2021 2022 2023Space Program
Inflation Factor 3%GSF 19,625 s.f. 19,625 19,625 19,625 19,625 19,625 19,625 19,625 19,625 19,625 19,625 19,625
Net Rentable Area 90% of GSF @ 19,625 s.f. 17,663 s.f. 17,663 17,663 17,663 17,663 17,663 17,663 17,663 17,663 17,663 17,663 17,663 Restaurant 90% of GSF @ 8,438 s.f. 7,594 s.f. 7,594 7,594 7,594 7,594 7,594 7,594 7,594 7,594 7,594 7,594 7,594
Marina Retail & Office 90% of GSF @ 11,187 s.f. 10,068 s.f. 10,068 10,068 10,068 10,068 10,068 10,068 10,068 10,068 10,068 10,068 10,068Net Operating Income
Gross Revenue $479,534 $493,920 $508,737 $523,999 $539,719 $555,911 $572,588 $589,766 $607,459 $625,682 $644,453Rent (NNN) per s.f. (Restaurant) $30.00 per NSF @ 8,438 NSF $30.00 $30.90 $31.83 $32.78 $33.77 $34.78 $35.82 $36.90 $38.00 $39.14 $40.32
Rent (NNN) per s.f. (Marina Retail & Office) $25.00 per NSF @ 11,187 NSF $25.00 $25.75 $26.52 $27.32 $28.14 $28.98 $29.85 $30.75 $31.67 $32.62 $33.60Vacancy & Credit Loss ($23,977) ($24,696) ($25,437) ($26,200) ($26,986) ($27,796) ($28,629) ($29,488) ($30,373) ($31,284) ($32,223)
Vacancy & Credit Loss (%) 5% 5% 5% 5% 5% 5% 5% 5% 5% 5% 5%Operations & Maintenance Expenses ($22,569) ($23,246) ($23,944) ($24,662) ($25,402) ($26,164) ($26,949) ($27,757) ($28,590) ($29,448) ($30,331)
Expense per s.f. $1.15 per GSF @ 19,625 s.f. $1.15 $1.18 $1.22 $1.26 $1.29 $1.33 $1.37 $1.41 $1.46 $1.50 $1.55Allocated Operating Cost for Open Space $0.25 per Open Space @ 13,571 s.f. $0 $0 $0 $0 ($3,819) ($3,933) ($4,051) ($4,173) ($4,298) ($4,427) ($4,560)
Net Operating Income $432,988 $445,977 $459,357 $473,137 $483,513 $498,018 $512,959 $528,347 $544,198 $560,524 $577,339Development Costs
Asset Value of Building 1 ($6,185,537) ($6,185,537)Land Cost of Open Space $47.87 per s.f. @ 13,571 s.f. ($649,602) ($649,602)
Allocated Development Cost of Open Space $16.21 per s.f. @ 13,571 s.f. ($220,052) $0 $0 ($189,999) ($30,053)Total Development Costs $399.44 per NSF @ 17,663 s.f. ($7,055,191) ($6,835,139) $0 ($189,999) ($30,053) $0 $0 $0 $0 $0 $0 $0
Annual Cash FlowNet Operating Income * $445,977 $459,357 $473,137 $483,513 $498,018 $512,959 $528,347 $544,198 $560,524 $577,339
Building 1 Asset Value (Exclude Open Space) 7.0% (Cap Rate) $6,185,537 $6,371,103 $6,562,237 $6,759,104 $6,907,324 $7,114,544 $7,327,980 $7,547,820 $7,774,254 $8,007,482 $8,247,706Transaction Cost 3.0% ($247,431)
Total Development Costs ($6,835,139) ($6,835,139) $0 ($189,999) ($30,053) $0 $0 $0 $0 $0 $0 $0Unleveraged Net Cash Flow ($6,835,139) $445,977 $269,357 $443,085 $483,513 $498,018 $512,959 $528,347 $544,198 $560,524 $8,577,615
Building 1
Permiting & Planning Construction Operation
Net Present Value 8% $31,346Unleveraged IRR Before Taxes 8.1%Net Cash Flow (Chandler's Cove: Building 1-3, Parking & Marina of Chandler's Cove) ($15,990,690) ($1,204,191) ($16,319,822) ($16,693,034) $2,486,153 $3,223,840 $3,459,261 $3,563,039 $3,669,930 $3,444,505 $54,634,520Unleveraged IRR (Chandler's Cove) 5.5%* 1: In Year 0, project can not generate cash flow.

NAIOP Real Estate Challenge
Waterfront
Total Building 1 Building 2 w/ Parking Building 3 Discovery Center Marina
DESIGN ASSUMPTIONS GROSS SF 154,478 19,625 84,490 24,118 26,244 NA
Efficiency Factor 90% 90% 90% 90% 90% NA RENTABLE SF 143,509 17,663 80,520 21,706 23,620 NA
Restaurant: 8,438 NSF Marine Retail & office: 11,188 NSF
Spa: 26,010 NSFRestaurant: 9,720 NSFParking: 44,790 NSF
Restaurant: 9,063 NSFCasual Dining: 8,937NSF Marine Retail: 3,670 NSF
Event Space: 6,900NSFSales Office: 3,000NSF
Café and Bar: 4,270 NSFParking: 10,500 SF
81 Deck (4,806 Lineal Foot)
Average Unit SF NA NA 350SF/ parking space NA 350SF/ surface parking NAPARKING STALLS 127 2.29/1,000 NSF NA
COST ASSUMPTIONS LAND VALUE PER DEVELOPMENT UNIT $52/NSF Building is used as existing $27/NSF $69/NSF $63/NSF NA
SITE - INFRASTRUCTURE ( $ / SF OF SITE ) $30.0 NA $30 $30 $30 NABUILDING SHELL ( $ / Gross SF ) NA Building is used as existing Spa: $250/SF
Restaurant: $185/SFRestaurant: $185/SF
Casual Dining: $160/SFMarina Retail: $130/SF
Discovery Center: $110K for Moving
Café & Bar: $160/SF
Marina is used as existing
TENANT IMPROVEMENT ($ / Net SF ) NA Building is used as existing Spa: $100/SFRestaurant: $100/SF
Restaurant: $100/SFCasual Dining: $100/SFMarina Retail: $80/SF
Café & Bar: $90/SF Marina is used as existing
PARKING ABOVE GRADE ($ / STALL) Surface Parking: $15,000/ stall
PARKING BELOW GRADE ($ / STALL)
SOFT COST ( % of hard costs ) NA Included Building Shell Included Building Shell Included Building Shell Included Parking Bld Cost NABASE YR. OPERATING EXPENSES ( $ / Gross SF / YR ) NA $1.15/SF Spa: $2.00/SF
Resutaurant: $1.15/SF$1.15/SF Event & Sales: $6.00/SF
Café & Bar: $1.15/SF20% Gross Revenue
INCOME ASSUMPTIONSRENTAL INCOME ( $ / Net SF / MO ) NA $30/NSF
Marina Retail & Office: $25/NSF
Spa: $23.5/NSFRestaurant: $31/NSF
Restaurant: $30/ NSFCasual Dining: $26/ NSFMarina Retail: $25/NSF
Event: $550/day/spaceCafé & Bar: $26/NSF
$15/Lineal Foot/month
Financial Underwriting Summary
NA
Surface Cost: $10,000/stall (Parking is
used as existing and covered by surface)
1.69/1,000 NSF
PARKING INCOME ( $ / SF / MO ) NA NA $140/stall/ mo$4.00/hour
NA $4.00/hour NA
VALUE ASSUMPTIONDiscount Rate NA 8.00% 8.00% 8.00% 8.00% 8.00%
Exit Capitalization Rate NA 7.00% 7.00% 7.00% 7.00% 12.00%NET PRESENT VALUE ( $ / NSF ) ($40.46) $1.77 ($71.51) ($71.62) ($17.48)
VALUE TOTAL $ ($5,806,561) $31,346 ($5,757,870) ($1,554,684) ($412,933) $1,887,580Unleveraged IRR Before Taxes 6.4% 8.1% 4.3% 4.9% 7.0% 15.2%
Leveraged IRR Before Taxes 8.7% NA NA NA NA NA
DEBT ASSUMPTIONSLOAN TO VALUE 65% NA NA NA NA NA
Average DEBT SERVICE COVERAGE 1.90 NA NA NA NA NATOTAL DEBT $32,880,848 NA NA NA NA NA
NET EQUITY During Development (Inclu Land) $17,500,000 NA NA NA NA NA
Hard & Soft Cost NotesExcludes 9.5% Washington State Sales TaxAssumes pricing in the construction year LEED Silver certificateIncludes contingencies
WATERFRONT: BUILDING 3 CF
Year 0 Year 1 Year 2 Year 3 Year 4 Year 5 Year 6 Year 7 Year 8 Year 9 Year 10
Input Unit Unit Value Total 2013 2014 2015 2016 2017 2018 2019 2020 2021 2022 2023Space Program
Inflation Factor 3%GSF 24,118 s.f. 0 0 0 0 24,118 24,118 24,118 24,118 24,118 24,118 24,118
Marina Retail & Office 4,078 s.f. 4,078 4,078 4,078 4,078 4,078 4,078 4,078 Restaurant 10,070 s.f. 10,070 10,070 10,070 10,070 10,070 10,070 10,070
Casual Dining 9,970 s.f. 9,970 9,970 9,970 9,970 9,970 9,970 9,970Net Rentable Area 90% of GSF @ 24,118 s.f. 21,706 s.f. 0 0 0 0 21,706 21,706 21,706 21,706 21,706 21,706 21,706
Marina Retail & Office 90% of GSF @ 4,078 s.f. 3,670 s.f. 0 0 0 0 3,670 3,670 3,670 3,670 3,670 3,670 3,670 Restaurant 90% of GSF @ 10,070 s.f. 9,063 s.f. 0 0 0 0 9,063 9,063 9,063 9,063 9,063 9,063 9,063
Casual Dining 90% of GSF @ 9,970 s.f. 8,973 s.f. 0 0 0 0 8,973 8,973 8,973 8,973 8,973 8,973 8,973Net Operating Income
Gross Revenue $0 $0 $0 $0 $671,859 $692,015 $712,775 $734,158 $756,183 $778,869 $802,235 Marina Retail & Office $0 $0 $0 $0 $103,265 $106,363 $109,554 $112,841 $116,226 $119,713 $123,304
Restaurant $0 $0 $0 $0 $306,015 $315,195 $324,651 $334,390 $344,422 $354,755 $365,397 Casual Dining $0 $0 $0 $0 $262,579 $270,456 $278,570 $286,927 $295,535 $304,401 $313,533
Rent (NNN) per s.f. $16.75 per NSF @ 21,706 s.f. $16.75 $17.26 $17.77 $18.31 $30.95 $31.88 $32.84 $33.82 $34.84 $35.88 $36.96 Marina Retail & Office $25.00 per NSF @ 3,670 s.f. $25.00 $25.75 $26.52 $27.32 $28.14 $28.98 $29.85 $30.75 $31.67 $32.62 $33.60
Restaurant $30.00 per NSF @ 9,063 s.f. $30.00 $30.90 $31.83 $32.78 $33.77 $34.78 $35.82 $36.90 $38.00 $39.14 $40.32 Casual Dining $26.00 per NSF @ 8,973 s.f. $26.00 $26.78 $27.58 $28.41 $29.26 $30.14 $31.05 $31.98 $32.94 $33.92 $34.94
Vacancy & Credit Loss $0 $0 $0 $0 ($128,136) $0 $0 $0 $0 ($118,617) ($24,435) Marina Retail & Office $0 $0 $0 $0 ($51,633) $0 $0 $0 $0 ($29,928) ($6,165)
Restaurant $0 $0 $0 $0 ($76,504) $0 $0 $0 $0 ($88,689) ($18,270) Casual Dining ($65,645) $0 $0 $0 $0 ($76,100) ($15,677)
Vacancy & Credit Loss (%) Marina Retail & Office 3 Month (Free Rent) 50% 0% 0% 0% 0% 25% 5%
Restaurant 3 Month (Free Rent) 25% 0% 0% 0% 0% 25% 5% Casual Dining 3 Month (Free Rent) 25% 0% 0% 0% 0% 25% 5%
Operations & Maintenance Expenses $0 $0 $0 $0 ($31,216) ($32,153) ($33,118) ($34,111) ($35,134) ($36,188) ($37,274) Marina Retail & Office $0 $0 $0 $0 ($5,278) ($5,436) ($5,599) ($5,767) ($5,940) ($6,119) ($6,302)
Restaurant $0 $0 $0 $0 ($13,034) ($13,425) ($13,828) ($14,243) ($14,670) ($15,110) ($15,563) Casual Dining $0 $0 $0 $0 ($12,905) ($13,292) ($13,690) ($14,101) ($14,524) ($14,960) ($15,409)
Expense per s.f. $1.15 per GSF @ 24,118 s.f. $1.29 $1.33 $1.37 $1.41 $1.46 $1.50 $1.55 Marina Retail & Office $1.15 per GSF @ 4,078 s.f. $1.15 $1.18 $1.22 $1.26 $1.29 $1.33 $1.37 $1.41 $1.46 $1.50 $1.55
Restaurant $1.15 per GSF @ 10,070 s.f. $1.15 $1.18 $1.22 $1.26 $1.29 $1.33 $1.37 $1.41 $1.46 $1.50 $1.55 Casual Dining $1.15 per GSF @ 9,970 s.f. $1.15 $1.18 $1.22 $1.26 $1.29 $1.33 $1.37 $1.41 $1.46 $1.50 $1.55
Allocated Operating Cost for Open Space $0.25 per Open Space @ 36,187 s.f. $0 $0 $0 $0 ($10,182) ($10,488) ($10,802) ($11,126) ($11,460) ($11,804) ($12,158)Net Operating Income $0 $0 $0 $0 $502,324 $649,374 $668,855 $688,921 $709,589 $612,259 $728,367
Development CostsPercent Built by year 16.6% 5.8% 39.1% 38.4% 0.0% 0.0% 0.0% 0.0% 0.0% 0.0% 0.0%Demolishment Cost $30.00 per Existing Building SF @ 12,036 s.f. ($361,077) ($361,077)
Land $23.38 per s.f. @ 29,600 s.f. ($691,903) ($691,903)Land Cost of Open Space $22.06 per s.f. @ 36,187 s.f. ($798,300) ($798,300)
Site - Infrastructure $30.00 per s.f. @ 29,600 s.f. ($888,000) ($888,000)Building Shell (Includes Soft Cost) $165.37 per GSF @ 24,118 s.f. ($3,988,261) $0 $0 ($2,392,957) ($1,595,304) $0 $0 $0 $0 $0 $0 $0
Marina Retail & Office $130.00 per GSF @ 4,078 s.f. ($530,111) ($318,067) ($212,044) Restaurant $185.00 per GSF @ 10,070 s.f. ($1,862,950) ($1,117,770) ($745,180)
Casual Dining $160.00 per GSF @ 9,970 s.f. ($1,595,200) ($957,120) ($638,080)Tenant Improvement $92.48 per NSF @ 21,706 s.f. ($2,007,470) $0 $0 $0 ($2,007,470) $0 $0 $0 $0 $0 $0 $0 Marina Retail & Office $80.00 per NSF @ 3,670 s.f. ($293,600) ($293,600)
Restaurant $100.00 per NSF @ 9,063 s.f. ($906,300) ($906,300) Casual Dining $90.00 per NSF @ 8,973 s.f. ($807,570) ($807,570)
Other Fees (Permitting, Consultant) ($500,000) ($250,000) ($250,000)WST 9.5% per Construction Cost @ $6,883,731 ($653,954) ($311,691) ($342,264)
Allocated Development Cost of Open Space $16.21 per Open Space @ 36,187 s.f. ($586,753) $0 $0 ($506,620) ($80,133)Total Development Costs ($10,475,718) ($1,740,202) ($611,077) ($4,099,267) ($4,025,171) $0 $0 $0 $0 $0 $0 $0
Annual Cash FlowNet Operating Income $0 $0 $0 $0 $502,324 $649,374 $668,855 $688,921 $709,589 $612,259 $728,367
Asset Value 7.0% (Cap Rate) $0 $0 $0 $0 $7,176,056 $9,276,772 $9,555,076 $9,841,728 $10,136,980 $8,746,562 $10,405,249Transaction Cost 3.0% ($312,157)
Total Development Costs ($10,475,718) ($1,740,202) ($611,077) ($4,099,267) ($4,025,171) $0 $0 $0 $0 $0 $0 $0Unleveraged Net Cash Flow ($1,740,202) ($611,077) ($4,099,267) ($4,025,171) $502,324 $649,374 $668,855 $688,921 $709,589 $612,259 $10,821,459
Building 3
Permiting & Planning Construction Operation
Net Present Value 8% ($1,554,684)Unleveraged IRR Before Taxes 4.9%

NAIOP Real Estate Challenge
Waterfront
Total Building 1 Building 2 w/ Parking Building 3 Discovery Center Marina
DESIGN ASSUMPTIONS GROSS SF 154,478 19,625 84,490 24,118 26,244 NA
Efficiency Factor 90% 90% 90% 90% 90% NA RENTABLE SF 143,509 17,663 80,520 21,706 23,620 NA
Restaurant: 8,438 NSF Marine Retail & office: 11,188 NSF
Spa: 26,010 NSFRestaurant: 9,720 NSFParking: 44,790 NSF
Restaurant: 9,063 NSFCasual Dining: 8,937NSF Marine Retail: 3,670 NSF
Event Space: 6,900NSFSales Office: 3,000NSF
Café and Bar: 4,270 NSFParking: 10,500 SF
81 Deck (4,806 Lineal Foot)
Average Unit SF NA NA 350SF/ parking space NA 350SF/ surface parking NAPARKING STALLS 127 2.29/1,000 NSF NA
COST ASSUMPTIONS LAND VALUE PER DEVELOPMENT UNIT $52/NSF Building is used as existing $27/NSF $69/NSF $63/NSF NA
SITE - INFRASTRUCTURE ( $ / SF OF SITE ) $30.0 NA $30 $30 $30 NABUILDING SHELL ( $ / Gross SF ) NA Building is used as existing Spa: $250/SF
Restaurant: $185/SFRestaurant: $185/SF
Casual Dining: $160/SFMarina Retail: $130/SF
Discovery Center: $110K for Moving
Café & Bar: $160/SF
Marina is used as existing
TENANT IMPROVEMENT ($ / Net SF ) NA Building is used as existing Spa: $100/SFRestaurant: $100/SF
Restaurant: $100/SFCasual Dining: $100/SFMarina Retail: $80/SF
Café & Bar: $90/SF Marina is used as existing
PARKING ABOVE GRADE ($ / STALL) Surface Parking: $15,000/ stall
PARKING BELOW GRADE ($ / STALL)
SOFT COST ( % of hard costs ) NA Included Building Shell Included Building Shell Included Building Shell Included Parking Bld Cost NABASE YR. OPERATING EXPENSES ( $ / Gross SF / YR ) NA $1.15/SF Spa: $2.00/SF
Resutaurant: $1.15/SF$1.15/SF Event & Sales: $6.00/SF
Café & Bar: $1.15/SF20% Gross Revenue
INCOME ASSUMPTIONSRENTAL INCOME ( $ / Net SF / MO ) NA $30/NSF
Marina Retail & Office: $25/NSF
Spa: $23.5/NSFRestaurant: $31/NSF
Restaurant: $30/ NSFCasual Dining: $26/ NSFMarina Retail: $25/NSF
Event: $550/day/spaceCafé & Bar: $26/NSF
$15/Lineal Foot/month
Financial Underwriting Summary
NA
Surface Cost: $10,000/stall (Parking is
used as existing and covered by surface)
1.69/1,000 NSF
PARKING INCOME ( $ / SF / MO ) NA NA $140/stall/ mo$4.00/hour
NA $4.00/hour NA
VALUE ASSUMPTIONDiscount Rate NA 8.00% 8.00% 8.00% 8.00% 8.00%
Exit Capitalization Rate NA 7.00% 7.00% 7.00% 7.00% 12.00%NET PRESENT VALUE ( $ / NSF ) ($40.46) $1.77 ($71.51) ($71.62) ($17.48)
VALUE TOTAL $ ($5,806,561) $31,346 ($5,757,870) ($1,554,684) ($412,933) $1,887,580Unleveraged IRR Before Taxes 6.4% 8.1% 4.3% 4.9% 7.0% 15.2%
Leveraged IRR Before Taxes 8.7% NA NA NA NA NA
DEBT ASSUMPTIONSLOAN TO VALUE 65% NA NA NA NA NA
Average DEBT SERVICE COVERAGE 1.90 NA NA NA NA NATOTAL DEBT $32,880,848 NA NA NA NA NA
NET EQUITY During Development (Inclu Land) $17,500,000 NA NA NA NA NA
Hard & Soft Cost NotesExcludes 9.5% Washington State Sales TaxAssumes pricing in the construction year LEED Silver certificateIncludes contingencies
WATERFRONT: HENRY PIER CF
Year 0 Year 1 Year 2 Year 3 Year 4 Year 5 Year 6 Year 7 Year 8 Year 9 Year 10
OperationInput Unit Unit Value Total 2013 2014 2015 2016 2017 2018 2019 2020 2021 2022 2023
Space ProgramInflation Factor 3%
Total GSF (Exclude Parking) 15,744 s.f. 0 0 11,000 11,000 15,744 15,744 15,744 15,744 15,744 15,744 15,744 Event Space 7,667 s.f. 7,667 7,667 7,667 7,667 7,667 7,667 7,667 7,667 7,667 Sales Office 3,333 s.f. (No Revenue will be generated) 3,333 3,333 3,333 3,333 3,333 3,333 3,333 3,333 3,333 Café & Bar 4,744 s.f. 4,744 4,744 4,744 4,744 4,744 4,744 4,744
Surface Parking 10,500 s.f. 0 10,500 10,500 10,500 10,500 10,500 10,500 10,500NSF (Excludie Parking) 90% of GSF @ 15,744 s.f. 14,170 s.f. 0 0 9,900 9,900 14,170 14,170 14,170 14,170 14,170 14,170 14,170
Event Space 90% of GSF @ 7,667 s.f. 6,900 s.f. 0 0 6,900 6,900 6,900 6,900 6,900 6,900 6,900 6,900 6,900 Sales Office 90% of GSF @ 3,333 s.f. 3,000 s.f. 0 0 3,000 3,000 3,000 3,000 3,000 3,000 3,000 3,000 3,000 Café & Bar 90% of GSF @ 4,744 s.f. 4,270 s.f. 0 0 0 4,270 4,270 4,270 4,270 4,270 4,270 4,270
Surface Parking Space 350 per stall @ 10,500 s.f. 30 stall 0 0 30 30 30 30 30 30 30Net Operating Income Gross Revenue $0 $0 $425,951 $438,730 $1,759,981 $1,812,780 $1,867,163 $1,923,178 $1,980,874 $2,040,300 $2,101,509
Event space 365 Days $0 $0 $425,951 $438,730 $451,892 $465,449 $479,412 $493,794 $508,608 $523,866 $539,582 Café & Bar $0 $0 $0 $0 $124,954 $128,703 $132,564 $136,541 $140,637 $144,856 $149,202
Surface Parking (Nonworking Days) $0 $0 $0 $0 $350,078 $360,581 $371,398 $382,540 $394,016 $405,837 $418,012Surface Parking (Working Days) $0 $0 $0 $0 $833,057 $858,048 $883,790 $910,303 $937,613 $965,741 $994,713
Daily Rate for Event Space $550.00 per space @ 2 space $550.00 $566.50 $583.50 $601.00 $619.03 $637.60 $656.73 $676.43 $696.72 $717.63 $739.15Rent (NNN) per s.f. (café & Bar) $26.00 per NSF @ 4,270 s.f. $26.00 $26.78 $27.58 $28.41 $29.26 $30.14 $31.05 $31.98 $32.94 $33.92 $34.94
Surface Parking (Nonworking Days) $4.00 per hour @ 30 stall 108 days $4.00 $4.12 $4.24 $4.37 $4.50 $4.64 $4.78 $4.92 $5.07 $5.22 $5.38Surface Parking (Working Days) $4.00 per hour @ 30 stall 257 days $4.00 $4.12 $4.24 $4.37 $4.50 $4.64 $4.78 $4.92 $5.07 $5.22 $5.38
Vacancy & Credit Loss $0 $0 ($319,464) ($263,238) ($1,196,603) ($1,125,024) ($1,158,775) ($1,193,538) ($1,264,504) ($1,266,225) ($1,311,672)Vacancy & Credit Loss for Event Space(%) 75% 60% 50% 40% 40% 40% 40% 40% 40%
Vacancy & Credit Loss for Café & Bar(%) 25% 0% 0% 0% 0% 25% 0% 5%Vacancy & Ceredit Loss for Parking (%) (Nonworking Days) 80% 75% 70% 70% 70% 70% 70% 70%
(Working Days) 90% 85% 80% 80% 80% 80% 80% 80%Operations & Maintenance Expenses $0 $0 ($52,868) ($54,454) ($115,245) ($118,702) ($122,263) ($125,931) ($129,709) ($133,600) ($137,608)
Event Space & Sales Office Expense per s.f. $6.00 per GSF @ 11,000 s.f. $6.00 $6.18 $6.37 $6.56 $6.75 $6.96 $7.16 $7.38 $7.60 $7.83 $8.06Café & Bar Expense per s.f. $1.15 per GSF @ 4,744 s.f. $1.15 $1.18 $1.22 $1.26 $1.29 $1.33 $1.37 $1.41 $1.46 $1.50 $1.55
Parking Expenses (Percent of Gross Revenue) 5% per Gross Revenue 5% 5% 5% 5% 5% 5% 5% 5% 5% 5% 5%Allocated Operating Cost for Open Space $0.25 per Open Space @ 127,134 s.f. $0 $0 $0 $0 ($35,772) ($36,846) ($37,951) ($39,090) ($40,262) ($41,470) ($42,714)Net Operating Income $0 $0 $53,620 $121,038 $412,361 $532,208 $548,174 $564,619 $546,399 $599,005 $609,515Development Costs
Percent Built by year 23.01% 22.99%Demolishment Cost $30.00 per Existing Building SF @ 16,968.6 s.f. ($509,058) ($509,058)
Land $23.38 per s.f. @ 26,244 s.f. ($613,466) ($613,466)Land Cost of Open Space $6.83 per s.f. @ 127,134 s.f. ($868,692) ($868,692)
Site - Infrastructure $30.00 per s.f. @ 26,244 s.f. ($787,333) ($787,333)Moving Cost $10.00 per GSF @ 11,000 s.f. ($110,000) ($110,000)
Development Costs $160.00 per GSF @ 4,744 s.f. ($759,111) ($607,289) ($151,822)TI for Café and Bar $90.00 per NSF @ 4,270 s.f. ($621,000) ($621,000)
Development Costs for Surface Parking $15,000 per stall @ 30 stall ($450,000) ($450,000)Other Fees (Permits, Consultant) Allow ($500,000) ($250,000) ($250,000)
WST 9.5% per Construction Cost @ ($2,617,444) ($248,657) ($74,797) ($57,692) ($116,168)Allocated Development Cost of Open Space $16.21 per Open Space @ 127,134 s.f. ($2,061,396) $0 $0 ($1,779,870) ($281,526)
Total Development Costs ($7,528,714) ($1,732,159) ($1,731,188) ($2,444,851) ($1,620,516) $0 $0 $0 $0 $0 $0 $0Annual Cash Flow
Net Operating Income $0 $0 $53,620 $121,038 $412,361 $532,208 $548,174 $564,619 $546,399 $599,005 $609,515Asset Value 7.0% (Cap Rate) $0 $0 $765,995 $1,729,110 $5,890,869 $7,602,971 $7,831,060 $8,065,992 $7,805,697 $8,557,211 $8,707,355
Transaction Cost 3.0% ($261,221)Total Development Costs ($7,528,714) ($1,732,159) ($1,731,188) ($2,444,851) ($1,620,516) $0 $0 $0 $0 $0 $0 $0
Unleveraged Net Cash Flow ($1,732,159) ($1,731,188) ($2,391,231) ($1,499,479) $412,361 $532,208 $548,174 $564,619 $546,399 $599,005 $9,055,649
H.C. Henry Pier
Permiting & Planning Construction
Net Present Value 8% ($412,933)Unleveraged IRR Before Taxes 7.0%Net Cash Flow (H.C. Henry Pier) ($4,024,512) ($1,447,853) ($2,099,397) ($1,198,889) $721,969 $851,104 $876,637 $902,936 $894,865 $957,925 $12,413,646Unleveraged IRR (H.C. Henry Pier) 9.3%

NAIOP Real Estate Challenge
Waterfront
Total Building 1 Building 2 w/ Parking Building 3 Discovery Center Marina
DESIGN ASSUMPTIONS GROSS SF 154,478 19,625 84,490 24,118 26,244 NA
Efficiency Factor 90% 90% 90% 90% 90% NA RENTABLE SF 143,509 17,663 80,520 21,706 23,620 NA
Restaurant: 8,438 NSF Marine Retail & office: 11,188 NSF
Spa: 26,010 NSFRestaurant: 9,720 NSFParking: 44,790 NSF
Restaurant: 9,063 NSFCasual Dining: 8,937NSF Marine Retail: 3,670 NSF
Event Space: 6,900NSFSales Office: 3,000NSF
Café and Bar: 4,270 NSFParking: 10,500 SF
81 Deck (4,806 Lineal Foot)
Average Unit SF NA NA 350SF/ parking space NA 350SF/ surface parking NAPARKING STALLS 127 2.29/1,000 NSF NA
COST ASSUMPTIONS LAND VALUE PER DEVELOPMENT UNIT $52/NSF Building is used as existing $27/NSF $69/NSF $63/NSF NA
SITE - INFRASTRUCTURE ( $ / SF OF SITE ) $30.0 NA $30 $30 $30 NABUILDING SHELL ( $ / Gross SF ) NA Building is used as existing Spa: $250/SF
Restaurant: $185/SFRestaurant: $185/SF
Casual Dining: $160/SFMarina Retail: $130/SF
Discovery Center: $110K for Moving
Café & Bar: $160/SF
Marina is used as existing
TENANT IMPROVEMENT ($ / Net SF ) NA Building is used as existing Spa: $100/SFRestaurant: $100/SF
Restaurant: $100/SFCasual Dining: $100/SFMarina Retail: $80/SF
Café & Bar: $90/SF Marina is used as existing
PARKING ABOVE GRADE ($ / STALL) Surface Parking: $15,000/ stall
PARKING BELOW GRADE ($ / STALL)
SOFT COST ( % of hard costs ) NA Included Building Shell Included Building Shell Included Building Shell Included Parking Bld Cost NABASE YR. OPERATING EXPENSES ( $ / Gross SF / YR ) NA $1.15/SF Spa: $2.00/SF
Resutaurant: $1.15/SF$1.15/SF Event & Sales: $6.00/SF
Café & Bar: $1.15/SF20% Gross Revenue
INCOME ASSUMPTIONSRENTAL INCOME ( $ / Net SF / MO ) NA $30/NSF
Marina Retail & Office: $25/NSF
Spa: $23.5/NSFRestaurant: $31/NSF
Restaurant: $30/ NSFCasual Dining: $26/ NSFMarina Retail: $25/NSF
Event: $550/day/spaceCafé & Bar: $26/NSF
$15/Lineal Foot/month
Financial Underwriting Summary
NA
Surface Cost: $10,000/stall (Parking is
used as existing and covered by surface)
1.69/1,000 NSF
PARKING INCOME ( $ / SF / MO ) NA NA $140/stall/ mo$4.00/hour
NA $4.00/hour NA
VALUE ASSUMPTIONDiscount Rate NA 8.00% 8.00% 8.00% 8.00% 8.00%
Exit Capitalization Rate NA 7.00% 7.00% 7.00% 7.00% 12.00%NET PRESENT VALUE ( $ / NSF ) ($40.46) $1.77 ($71.51) ($71.62) ($17.48)
VALUE TOTAL $ ($5,806,561) $31,346 ($5,757,870) ($1,554,684) ($412,933) $1,887,580Unleveraged IRR Before Taxes 6.4% 8.1% 4.3% 4.9% 7.0% 15.2%
Leveraged IRR Before Taxes 8.7% NA NA NA NA NA
DEBT ASSUMPTIONSLOAN TO VALUE 65% NA NA NA NA NA
Average DEBT SERVICE COVERAGE 1.90 NA NA NA NA NATOTAL DEBT $32,880,848 NA NA NA NA NA
NET EQUITY During Development (Inclu Land) $17,500,000 NA NA NA NA NA
Hard & Soft Cost NotesExcludes 9.5% Washington State Sales TaxAssumes pricing in the construction year LEED Silver certificateIncludes contingencies
WATERFRONT: MARINA CF
Year 0 Year 1 Year 2 Year 3 Year 4 Year 5 Year 6 Year 7 Year 8 Year 9 Year 10
Input Unit Unit Value Total 2013 2014 2015 2016 2017 2018 2019 2020 2021 2022 2023Space Program
Inflation Factor 3%Total Deck 72 Deck Total Lineal Foot 4,400 LF 4,400 4,400 4,400 4,400 4,400 4,400 4,400 4,400 4,400 4,400 4,400
Chandler's Cove 20 Deck Total Lineal Foot 1,743 LF 1,743 1,743 1,743 1,743 1,743 1,743 1,743 1,743 1,743 1,743 1,743H.C. Henry Pier 52 Deck Total Lineal Foot 2,657 LF 2,657 2,657 2,657 2,657 2,657 2,657 2,657 2,657 2,657 2,657 2,657
Net Operating Income Gross Revenue $792,000 $815,760 $840,233 $865,440 $891,403 $918,145 $945,689 $974,060 $1,003,282 $1,033,380 $1,064,382
Rent per Lineal Foot "LF", per month $15.00 per Lineal Foot @ 4,400 LF 12 month $15.00 $15.45 $15.91 $16.39 $16.88 $17.39 $17.91 $18.45 $19.00 $19.57 $20.16Vacancy & Credit Loss ($55,440) ($57,103) ($58,816) ($60,581) ($62,398) ($64,270) ($66,198) ($68,184) ($70,230) ($72,337) ($74,507)
Vacancy & Credit Loss (%) 7% 7% 7% 7% 7% 7% 7% 7% 7% 7% 7%Operations & Maintenance Expenses ($158,400) ($163,152) ($168,047) ($173,088) ($178,281) ($183,629) ($189,138) ($194,812) ($200,656) ($206,676) ($212,876)
Expense Ratio (%) 20% per Gross Revenue 20% 20% 20% 20% 20% 20% 20% 20% 20% 20% 20%Ground Lease ($122,623) ($126,301) ($130,090) ($133,993) ($138,013) ($142,153) ($146,418) ($150,810) ($155,335) ($159,995) ($164,795)
Ground Lease 1 $104,188.17 ($107,314) ($110,533) ($113,849) ($117,265) ($120,783) ($124,406) ($128,138) ($131,982) ($135,942) ($140,020) ($144,221)Ground Lease 2 $14,862.96 ($15,309) ($15,768) ($16,241) ($16,728) ($17,230) ($17,747) ($18,280) ($18,828) ($19,393) ($19,975) ($20,574)
Net Operating Income $455,537 $469,203 $483,280 $497,778 $512,711 $528,093 $543,935 $560,253 $577,061 $594,373 $612,204
Marina
Permiting & Planning Construction Operation
Annual Cash FlowNet Operating Income * $469,203 $483,280 $497,778 $512,711 $528,093 $543,935 $560,253 $577,061 $594,373 $612,204
Asset Value 12.0% (Cap Rate) $3,796,144 $3,910,029 $4,027,330 $4,148,150 $4,272,594 $4,400,772 $4,532,795 $4,668,779 $4,808,842 $4,953,108 $5,101,701Transaction Cost 3.0% ($153,051)
Total Development Costs ($3,796,144) ($3,796,144) $0 $0 $0 $0 $0 $0 $0 $0 $0 $0Net Cash Flow ($3,796,144) $469,203 $483,280 $497,778 $512,711 $528,093 $543,935 $560,253 $577,061 $594,373 $5,560,854
Net Present Value 8% $1,887,580Unleveraged IRR Before Taxes 15.2%Cash Flow from Chandler's Cove ($1,503,791) $185,869 $191,445 $197,188 $203,104 $209,197 $215,473 $221,937 $228,595 $235,453 $2,202,856Cash Flow from H.C. Henry Pier ($2,292,354) $283,335 $291,835 $300,590 $309,608 $318,896 $328,463 $338,317 $348,466 $358,920 $3,357,997* 1: In Year 0, project can not generate cash flow.

NAIOP Real Estate Challenge
Waterfront
Total Building 1 Building 2 w/ Parking Building 3 Discovery Center Marina
DESIGN ASSUMPTIONS GROSS SF 154,478 19,625 84,490 24,118 26,244 NA
Efficiency Factor 90% 90% 90% 90% 90% NA RENTABLE SF 143,509 17,663 80,520 21,706 23,620 NA
Restaurant: 8,438 NSF Marine Retail & office: 11,188 NSF
Spa: 26,010 NSFRestaurant: 9,720 NSFParking: 44,790 NSF
Restaurant: 9,063 NSFCasual Dining: 8,937NSF Marine Retail: 3,670 NSF
Event Space: 6,900NSFSales Office: 3,000NSF
Café and Bar: 4,270 NSFParking: 10,500 SF
81 Deck (4,806 Lineal Foot)
Average Unit SF NA NA 350SF/ parking space NA 350SF/ surface parking NAPARKING STALLS 127 2.29/1,000 NSF NA
COST ASSUMPTIONS LAND VALUE PER DEVELOPMENT UNIT $52/NSF Building is used as existing $27/NSF $69/NSF $63/NSF NA
SITE - INFRASTRUCTURE ( $ / SF OF SITE ) $30.0 NA $30 $30 $30 NABUILDING SHELL ( $ / Gross SF ) NA Building is used as existing Spa: $250/SF
Restaurant: $185/SFRestaurant: $185/SF
Casual Dining: $160/SFMarina Retail: $130/SF
Discovery Center: $110K for Moving
Café & Bar: $160/SF
Marina is used as existing
TENANT IMPROVEMENT ($ / Net SF ) NA Building is used as existing Spa: $100/SFRestaurant: $100/SF
Restaurant: $100/SFCasual Dining: $100/SFMarina Retail: $80/SF
Café & Bar: $90/SF Marina is used as existing
PARKING ABOVE GRADE ($ / STALL) Surface Parking: $15,000/ stall
PARKING BELOW GRADE ($ / STALL)
SOFT COST ( % of hard costs ) NA Included Building Shell Included Building Shell Included Building Shell Included Parking Bld Cost NABASE YR. OPERATING EXPENSES ( $ / Gross SF / YR ) NA $1.15/SF Spa: $2.00/SF
Resutaurant: $1.15/SF$1.15/SF Event & Sales: $6.00/SF
Café & Bar: $1.15/SF20% Gross Revenue
INCOME ASSUMPTIONSRENTAL INCOME ( $ / Net SF / MO ) NA $30/NSF
Marina Retail & Office: $25/NSF
Spa: $23.5/NSFRestaurant: $31/NSF
Restaurant: $30/ NSFCasual Dining: $26/ NSFMarina Retail: $25/NSF
Event: $550/day/spaceCafé & Bar: $26/NSF
$15/Lineal Foot/month
Financial Underwriting Summary
NA
Surface Cost: $10,000/stall (Parking is
used as existing and covered by surface)
1.69/1,000 NSF
PARKING INCOME ( $ / SF / MO ) NA NA $140/stall/ mo$4.00/hour
NA $4.00/hour NA
VALUE ASSUMPTIONDiscount Rate NA 8.00% 8.00% 8.00% 8.00% 8.00%
Exit Capitalization Rate NA 7.00% 7.00% 7.00% 7.00% 12.00%NET PRESENT VALUE ( $ / NSF ) ($40.46) $1.77 ($71.51) ($71.62) ($17.48)
VALUE TOTAL $ ($5,806,561) $31,346 ($5,757,870) ($1,554,684) ($412,933) $1,887,580Unleveraged IRR Before Taxes 6.4% 8.1% 4.3% 4.9% 7.0% 15.2%
Leveraged IRR Before Taxes 8.7% NA NA NA NA NA
DEBT ASSUMPTIONSLOAN TO VALUE 65% NA NA NA NA NA
Average DEBT SERVICE COVERAGE 1.90 NA NA NA NA NATOTAL DEBT $32,880,848 NA NA NA NA NA
NET EQUITY During Development (Inclu Land) $17,500,000 NA NA NA NA NA
Hard & Soft Cost NotesExcludes 9.5% Washington State Sales TaxAssumes pricing in the construction year LEED Silver certificateIncludes contingencies
WATERFRONT: BUILDING 2 CF
Year 0 Year 1 Year 2 Year 3 Year 4 Year 5 Year 6 Year 7 Year 8 Year 9 Year 10
Input Unit Unit Value Total 2013 2014 2015 2016 2017 2018 2019 2020 2021 2022 2023Space Program
Inflation Factor 3%GSF 39,700 s.f. 0 0 0 0 39,700 39,700 39,700 39,700 39,700 39,700 39,700 Spa 28,900 s.f. 28,900 28,900 28,900 28,900 28,900 28,900 28,900
Restaurant 10,800 s.f. 10,800 10,800 10,800 10,800 10,800 10,800 10,800Net Rentable Area 90% of GSF @ 39,700 s.f. 35,730 s.f. 0 0 0 0 35,730 35,730 35,730 35,730 35,730 35,730 35,730
Spa 90% of GSF @ 28,900 s.f. 26,010 s.f. 0 0 0 0 26,010 26,010 26,010 26,010 26,010 26,010 26,010 Restaurant 90% of GSF @ 10,800 s.f. 9,720 s.f. 0 0 0 0 9,720 9,720 9,720 9,720 9,720 9,720 9,720
Net Operating Income Gross Revenue $0 $0 $0 $0 $1,027,089 $1,057,901 $1,089,638 $1,122,328 $1,155,997 $1,190,677 $1,226,398
Spa $0 $0 $0 $0 $687,950 $708,589 $729,847 $751,742 $774,294 $797,523 $821,449 Restaurant $0 $0 $0 $0 $339,138 $349,312 $359,792 $370,586 $381,703 $393,154 $404,949
Rent (NNN) per s.f. $25.54 per NSF @ 35,730 s.f. $25.54 $26.31 $27.10 $27.91 $28.75 $29.61 $30.50 $31.41 $32.35 $33.32 $34.32 Spa $23.50 per NSF @ 26,010 s.f. $23.50 $24.21 $24.93 $25.68 $26.45 $27.24 $28.06 $28.90 $29.77 $30.66 $31.58
Restaurant $31.00 per NSF @ 9,720 s.f. $31.00 $31.93 $32.89 $33.87 $34.89 $35.94 $37.02 $38.13 $39.27 $40.45 $41.66Vacancy & Credit Loss $0 $0 $0 $0 ($256,772) $0 $0 $0 $0 ($98,289) ($20,247)
Spa 3 Month (Free Rent) $0 $0 $0 $0 ($171,988) $0 $0 $0 $0 $0 $0 Restaurant 3 Month (Free Rent) $0 $0 $0 $0 ($84,785) $0 $0 $0 $0 ($98,289) ($20,247)
Vacancy & Credit Loss (%) 25% 0% 0% 0% 0% 8% 2% Spa 3 Month (Free Rent) 25% 0% 0% 0% 0% 0% 0%
Restaurant 3 Month (Free Rent) 25% 0% 0% 0% 0% 25% 5%Operations & Maintenance Expenses $0 $0 $0 $0 ($79,033) ($81,404) ($83,846) ($86,362) ($88,953) ($91,621) ($94,370)
Spa $0 $0 $0 $0 ($65,054) ($67,006) ($69,016) ($71,087) ($73,219) ($75,416) ($77,678) Restaurant $0 $0 $0 $0 ($13,979) ($14,398) ($14,830) ($15,275) ($15,733) ($16,205) ($16,691)
Expense per s.f. $1.15 per GSF @ 39,700 s.f. $1.99 $2.05 $2.11 $2.18 $2.24 $2.31 $2.38 Spa $2.00 per GSF @ 28,900 s.f. $2.00 $2.06 $2.12 $2.19 $2.25 $2.32 $2.39 $2.46 $2.53 $2.61 $2.69
Restaurant $1.15 per GSF @ 10,800 s.f. $1.15 $1.18 $1.22 $1.26 $1.29 $1.33 $1.37 $1.41 $1.46 $1.50 $1.55Allocated Operating Cost for Open Space $0.25 per Open Space @ 48,902 s.f. $0 $0 $0 $0 ($13,760) ($14,173) ($14,598) ($15,036) ($15,487) ($15,951) ($16,430)
Net Operating Income $0 $0 $0 $0 $677,524 $962,325 $991,194 $1,020,930 $1,051,558 $984,816 $1,095,350Development Costs
Percent Built by year 19.88% 2.82% 38.64% 38.65%Demolishment Cost $30.00 per Existing Building SF @ 11,296 s.f. ($338,883) ($338,883)
Land $23.38 per s.f. @ 40,000 s.f. ($935,004) ($935,004)Land Cost of Open Space $60.56 per s.f. @ 48,902 s.f. ($2,961,351) ($2,961,351)
Site - Infrastructure $30.00 per s.f. @ 40,000 s.f. ($1,200,000) ($1,200,000)Building Shell (Includes Soft Cost) $232.32 per GSF @ 39,700 s.f. ($9,223,000) $0 $0 ($5,533,800) ($3,689,200) $0 $0 $0 $0 $0 $0 $0
Spa $250.00 per GSF @ 28,900 s.f. ($7,225,000) ($4,335,000) ($2,890,000) Restaurant $185.00 per GSF @ 10,800 s.f. ($1,998,000) ($1,198,800) ($799,200)
Tenant Improvement $100.00 per NSF @ 35,730 s.f. ($3,573,000) $0 $0 $0 ($3,573,000) $0 $0 $0 $0 $0 $0 $0 Spa $100.00 per NSF @ 26,010 s.f. ($2,601,000) ($2,601,000)
Restaurant $100.00 per NSF @ 9,720 s.f. ($972,000) ($972,000)Other Fees (Permitting, Consultant) ($500,000) ($250,000) ($250,000)
WST 9.5% per Construction Cost @ $13,996,000 ($1,329,620) $0 $0 ($639,711) ($689,909)Allocated Development Cost of Open Space $16.21 per Open Space @ 48,902 s.f. ($792,909) $0 $0 ($684,621) ($108,288)
Total Development Costs ($20,853,767) ($4,146,355) ($588,883) ($8,058,132) ($8,060,397) $0 $0 $0 $0 $0 $0 $0Annual Cash Flow
Net Operating Income $0 $0 $0 $0 $677,524 $962,325 $991,194 $1,020,930 $1,051,558 $984,816 $1,095,350Asset Value 7.0% (Cap Rate) $0 $0 $0 $0 $9,678,907 $13,747,494 $14,159,919 $14,584,716 $15,022,258 $14,068,803 $15,647,864
Transaction Cost 3.0% ($469,436)Total Development Costs ($20,853,767) ($4,146,355) ($588,883) ($8,058,132) ($8,060,397) $0 $0 $0 $0 $0 $0 $0
Unleveraged Net Cash Flow ($4,146,355) ($588,883) ($8,058,132) ($8,060,397) $677,524 $962,325 $991,194 $1,020,930 $1,051,558 $984,816 $16,273,779
Building 2
Permiting & Planning Construction Operation
Net Present Value 8% ($6,506,313)Unleveraged IRR Before Taxes 0.7%Net Cash Flow (Building 2+3, Parking) ($5,757,870) ($5,911,558) ($1,224,960) ($12,681,357) ($13,308,136) $1,297,213 $1,867,251 $2,061,974 $2,123,833 $2,187,548 $2,036,269 $33,032,590Unleveraged IRR (Bldg 2+3, Parking 4.3%
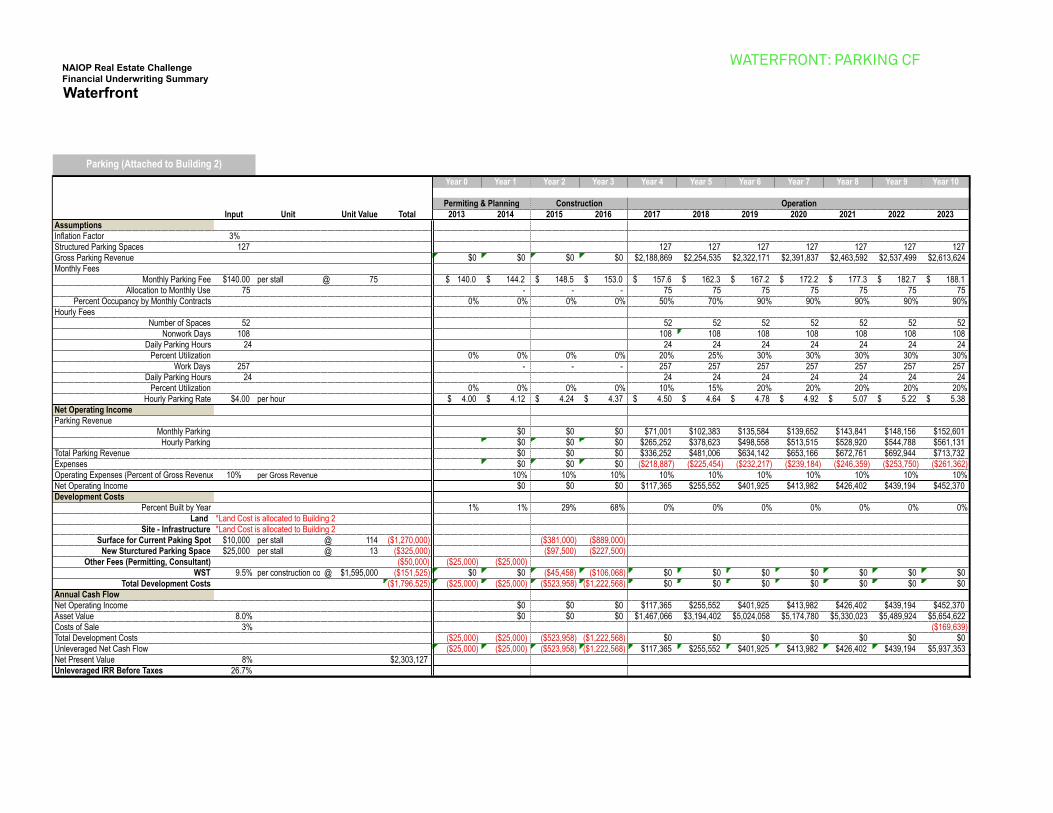
NAIOP Real Estate Challenge
Waterfront
Total Building 1 Building 2 w/ Parking Building 3 Discovery Center Marina
DESIGN ASSUMPTIONS GROSS SF 154,478 19,625 84,490 24,118 26,244 NA
Efficiency Factor 90% 90% 90% 90% 90% NA RENTABLE SF 143,509 17,663 80,520 21,706 23,620 NA
Restaurant: 8,438 NSF Marine Retail & office: 11,188 NSF
Spa: 26,010 NSFRestaurant: 9,720 NSFParking: 44,790 NSF
Restaurant: 9,063 NSFCasual Dining: 8,937NSF Marine Retail: 3,670 NSF
Event Space: 6,900NSFSales Office: 3,000NSF
Café and Bar: 4,270 NSFParking: 10,500 SF
81 Deck (4,806 Lineal Foot)
Average Unit SF NA NA 350SF/ parking space NA 350SF/ surface parking NAPARKING STALLS 127 2.29/1,000 NSF NA
COST ASSUMPTIONS LAND VALUE PER DEVELOPMENT UNIT $52/NSF Building is used as existing $27/NSF $69/NSF $63/NSF NA
SITE - INFRASTRUCTURE ( $ / SF OF SITE ) $30.0 NA $30 $30 $30 NABUILDING SHELL ( $ / Gross SF ) NA Building is used as existing Spa: $250/SF
Restaurant: $185/SFRestaurant: $185/SF
Casual Dining: $160/SFMarina Retail: $130/SF
Discovery Center: $110K for Moving
Café & Bar: $160/SF
Marina is used as existing
TENANT IMPROVEMENT ($ / Net SF ) NA Building is used as existing Spa: $100/SFRestaurant: $100/SF
Restaurant: $100/SFCasual Dining: $100/SFMarina Retail: $80/SF
Café & Bar: $90/SF Marina is used as existing
PARKING ABOVE GRADE ($ / STALL) Surface Parking: $15,000/ stall
PARKING BELOW GRADE ($ / STALL)
SOFT COST ( % of hard costs ) NA Included Building Shell Included Building Shell Included Building Shell Included Parking Bld Cost NABASE YR. OPERATING EXPENSES ( $ / Gross SF / YR ) NA $1.15/SF Spa: $2.00/SF
Resutaurant: $1.15/SF$1.15/SF Event & Sales: $6.00/SF
Café & Bar: $1.15/SF20% Gross Revenue
INCOME ASSUMPTIONSRENTAL INCOME ( $ / Net SF / MO ) NA $30/NSF
Marina Retail & Office: $25/NSF
Spa: $23.5/NSFRestaurant: $31/NSF
Restaurant: $30/ NSFCasual Dining: $26/ NSFMarina Retail: $25/NSF
Event: $550/day/spaceCafé & Bar: $26/NSF
$15/Lineal Foot/month
Financial Underwriting Summary
NA
Surface Cost: $10,000/stall (Parking is
used as existing and covered by surface)
1.69/1,000 NSF
PARKING INCOME ( $ / SF / MO ) NA NA $140/stall/ mo$4.00/hour
NA $4.00/hour NA
VALUE ASSUMPTIONDiscount Rate NA 8.00% 8.00% 8.00% 8.00% 8.00%
Exit Capitalization Rate NA 7.00% 7.00% 7.00% 7.00% 12.00%NET PRESENT VALUE ( $ / NSF ) ($40.46) $1.77 ($71.51) ($71.62) ($17.48)
VALUE TOTAL $ ($5,806,561) $31,346 ($5,757,870) ($1,554,684) ($412,933) $1,887,580Unleveraged IRR Before Taxes 6.4% 8.1% 4.3% 4.9% 7.0% 15.2%
Leveraged IRR Before Taxes 8.7% NA NA NA NA NA
DEBT ASSUMPTIONSLOAN TO VALUE 65% NA NA NA NA NA
Average DEBT SERVICE COVERAGE 1.90 NA NA NA NA NATOTAL DEBT $32,880,848 NA NA NA NA NA
NET EQUITY During Development (Inclu Land) $17,500,000 NA NA NA NA NA
Hard & Soft Cost NotesExcludes 9.5% Washington State Sales TaxAssumes pricing in the construction year LEED Silver certificateIncludes contingencies
WATERFRONT: PARKING CF
Year 0 Year 1 Year 2 Year 3 Year 4 Year 5 Year 6 Year 7 Year 8 Year 9 Year 10
Input Unit Unit Value Total 2013 2014 2015 2016 2017 2018 2019 2020 2021 2022 2023AssumptionsInflation Factor 3%Structured Parking Spaces 127 127 127 127 127 127 127 127Gross Parking Revenue $0 $0 $0 $0 $2,188,869 $2,254,535 $2,322,171 $2,391,837 $2,463,592 $2,537,499 $2,613,624Monthly Fees
Monthly Parking Fee $140.00 per stall @ 75 140.0$ 144.2$ 148.5$ 153.0$ 157.6$ 162.3$ 167.2$ 172.2$ 177.3$ 182.7$ 188.1$ Allocation to Monthly Use 75 - - - 75 75 75 75 75 75 75
Percent Occupancy by Monthly Contracts 0% 0% 0% 0% 50% 70% 90% 90% 90% 90% 90%Hourly Fees
Number of Spaces 52 52 52 52 52 52 52 52 Nonwork Days 108 108 108 108 108 108 108 108
Daily Parking Hours 24 24 24 24 24 24 24 24 Percent Utilization 0% 0% 0% 0% 20% 25% 30% 30% 30% 30% 30%
Work Days 257 - - - 257 257 257 257 257 257 257 Daily Parking Hours 24 24 24 24 24 24 24 24
Percent Utilization 0% 0% 0% 0% 10% 15% 20% 20% 20% 20% 20%Hourly Parking Rate $4.00 per hour 4.00$ 4.12$ 4.24$ 4.37$ 4.50$ 4.64$ 4.78$ 4.92$ 5.07$ 5.22$ 5.38$
Net Operating IncomeParking Revenue
Monthly Parking $0 $0 $0 $71,001 $102,383 $135,584 $139,652 $143,841 $148,156 $152,601Hourly Parking $0 $0 $0 $265,252 $378,623 $498,558 $513,515 $528,920 $544,788 $561,131
Total Parking Revenue $0 $0 $0 $336,252 $481,006 $634,142 $653,166 $672,761 $692,944 $713,732Expenses $0 $0 $0 ($218,887) ($225,454) ($232,217) ($239,184) ($246,359) ($253,750) ($261,362)Operating Expenses (Percent of Gross Revenue) 10% per Gross Revenue 10% 10% 10% 10% 10% 10% 10% 10% 10% 10%Net Operating Income $0 $0 $0 $117,365 $255,552 $401,925 $413,982 $426,402 $439,194 $452,370Development Costs
Percent Built by Year 1% 1% 29% 68% 0% 0% 0% 0% 0% 0% 0%Land *Land Cost is allocated to Building 2
Site - Infrastructure *Land Cost is allocated to Building 2Surface for Current Paking Spot $10,000 per stall @ 114 ($1,270,000) ($381,000) ($889,000)
New Sturctured Parking Space $25,000 per stall @ 13 ($325,000) ($97,500) ($227,500)Other Fees (Permitting, Consultant) ($50,000) ($25,000) ($25,000)
WST 9.5% per construction cost@ $1,595,000 ($151,525) $0 $0 ($45,458) ($106,068) $0 $0 $0 $0 $0 $0 $0Total Development Costs ($1,796,525) ($25,000) ($25,000) ($523,958) ($1,222,568) $0 $0 $0 $0 $0 $0 $0
Annual Cash FlowNet Operating Income $0 $0 $0 $117,365 $255,552 $401,925 $413,982 $426,402 $439,194 $452,370Asset Value 8.0% $0 $0 $0 $1,467,066 $3,194,402 $5,024,058 $5,174,780 $5,330,023 $5,489,924 $5,654,622Costs of Sale 3% ($169,639)Total Development Costs ($25,000) ($25,000) ($523,958) ($1,222,568) $0 $0 $0 $0 $0 $0 $0Unleveraged Net Cash Flow ($25,000) ($25,000) ($523,958) ($1,222,568) $117,365 $255,552 $401,925 $413,982 $426,402 $439,194 $5,937,353
Parking (Attached to Building 2)
Permiting & Planning Construction Operation
Net Present Value 8% $2,303,127Unleveraged IRR Before Taxes 26.7%
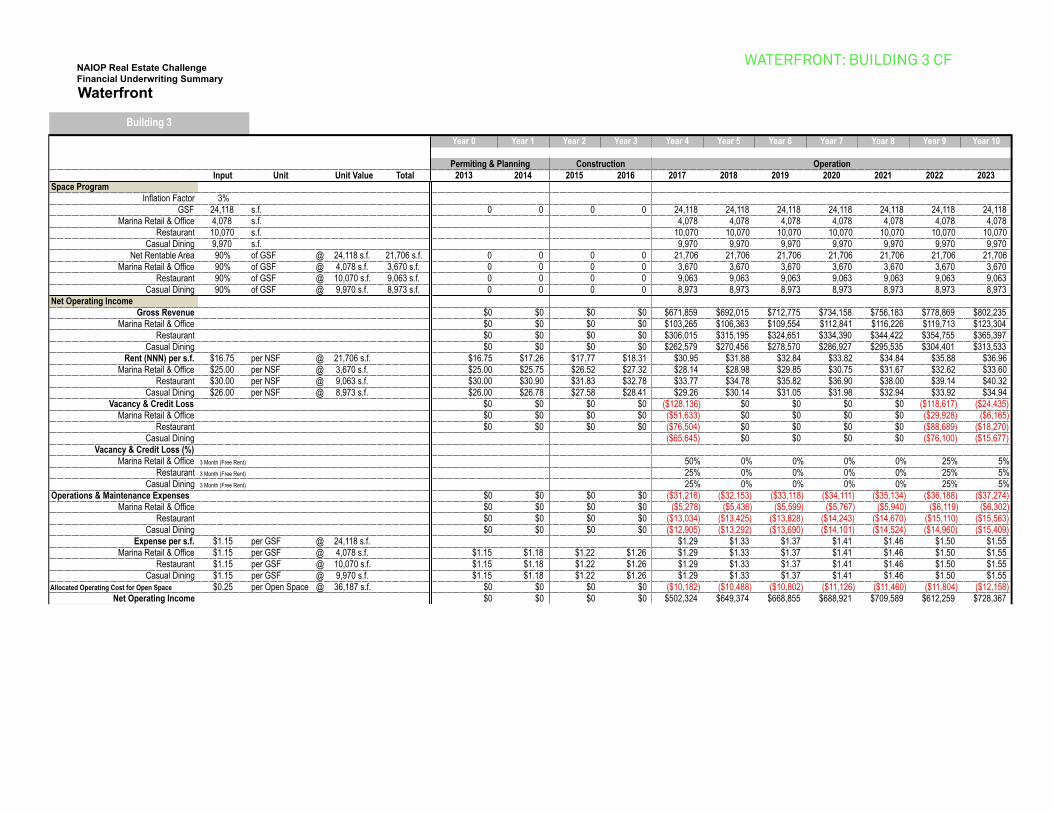
NAIOP Real Estate Challenge
Waterfront
Total Building 1 Building 2 w/ Parking Building 3 Discovery Center Marina
DESIGN ASSUMPTIONS GROSS SF 154,478 19,625 84,490 24,118 26,244 NA
Efficiency Factor 90% 90% 90% 90% 90% NA RENTABLE SF 143,509 17,663 80,520 21,706 23,620 NA
Restaurant: 8,438 NSF Marine Retail & office: 11,188 NSF
Spa: 26,010 NSFRestaurant: 9,720 NSFParking: 44,790 NSF
Restaurant: 9,063 NSFCasual Dining: 8,937NSF Marine Retail: 3,670 NSF
Event Space: 6,900NSFSales Office: 3,000NSF
Café and Bar: 4,270 NSFParking: 10,500 SF
81 Deck (4,806 Lineal Foot)
Average Unit SF NA NA 350SF/ parking space NA 350SF/ surface parking NAPARKING STALLS 127 2.29/1,000 NSF NA
COST ASSUMPTIONS LAND VALUE PER DEVELOPMENT UNIT $52/NSF Building is used as existing $27/NSF $69/NSF $63/NSF NA
SITE - INFRASTRUCTURE ( $ / SF OF SITE ) $30.0 NA $30 $30 $30 NABUILDING SHELL ( $ / Gross SF ) NA Building is used as existing Spa: $250/SF
Restaurant: $185/SFRestaurant: $185/SF
Casual Dining: $160/SFMarina Retail: $130/SF
Discovery Center: $110K for Moving
Café & Bar: $160/SF
Marina is used as existing
TENANT IMPROVEMENT ($ / Net SF ) NA Building is used as existing Spa: $100/SFRestaurant: $100/SF
Restaurant: $100/SFCasual Dining: $100/SFMarina Retail: $80/SF
Café & Bar: $90/SF Marina is used as existing
PARKING ABOVE GRADE ($ / STALL) Surface Parking: $15,000/ stall
PARKING BELOW GRADE ($ / STALL)
SOFT COST ( % of hard costs ) NA Included Building Shell Included Building Shell Included Building Shell Included Parking Bld Cost NABASE YR. OPERATING EXPENSES ( $ / Gross SF / YR ) NA $1.15/SF Spa: $2.00/SF
Resutaurant: $1.15/SF$1.15/SF Event & Sales: $6.00/SF
Café & Bar: $1.15/SF20% Gross Revenue
INCOME ASSUMPTIONSRENTAL INCOME ( $ / Net SF / MO ) NA $30/NSF
Marina Retail & Office: $25/NSF
Spa: $23.5/NSFRestaurant: $31/NSF
Restaurant: $30/ NSFCasual Dining: $26/ NSFMarina Retail: $25/NSF
Event: $550/day/spaceCafé & Bar: $26/NSF
$15/Lineal Foot/month
Financial Underwriting Summary
NA
Surface Cost: $10,000/stall (Parking is
used as existing and covered by surface)
1.69/1,000 NSF
PARKING INCOME ( $ / SF / MO ) NA NA $140/stall/ mo$4.00/hour
NA $4.00/hour NA
VALUE ASSUMPTIONDiscount Rate NA 8.00% 8.00% 8.00% 8.00% 8.00%
Exit Capitalization Rate NA 7.00% 7.00% 7.00% 7.00% 12.00%NET PRESENT VALUE ( $ / NSF ) ($40.46) $1.77 ($71.51) ($71.62) ($17.48)
VALUE TOTAL $ ($5,806,561) $31,346 ($5,757,870) ($1,554,684) ($412,933) $1,887,580Unleveraged IRR Before Taxes 6.4% 8.1% 4.3% 4.9% 7.0% 15.2%
Leveraged IRR Before Taxes 8.7% NA NA NA NA NA
DEBT ASSUMPTIONSLOAN TO VALUE 65% NA NA NA NA NA
Average DEBT SERVICE COVERAGE 1.90 NA NA NA NA NATOTAL DEBT $32,880,848 NA NA NA NA NA
NET EQUITY During Development (Inclu Land) $17,500,000 NA NA NA NA NA
Hard & Soft Cost NotesExcludes 9.5% Washington State Sales TaxAssumes pricing in the construction year LEED Silver certificateIncludes contingencies
WATERFRONT: BUILDING 3 CF
Year 0 Year 1 Year 2 Year 3 Year 4 Year 5 Year 6 Year 7 Year 8 Year 9 Year 10
Input Unit Unit Value Total 2013 2014 2015 2016 2017 2018 2019 2020 2021 2022 2023Space Program
Inflation Factor 3%GSF 24,118 s.f. 0 0 0 0 24,118 24,118 24,118 24,118 24,118 24,118 24,118
Marina Retail & Office 4,078 s.f. 4,078 4,078 4,078 4,078 4,078 4,078 4,078 Restaurant 10,070 s.f. 10,070 10,070 10,070 10,070 10,070 10,070 10,070
Casual Dining 9,970 s.f. 9,970 9,970 9,970 9,970 9,970 9,970 9,970Net Rentable Area 90% of GSF @ 24,118 s.f. 21,706 s.f. 0 0 0 0 21,706 21,706 21,706 21,706 21,706 21,706 21,706
Marina Retail & Office 90% of GSF @ 4,078 s.f. 3,670 s.f. 0 0 0 0 3,670 3,670 3,670 3,670 3,670 3,670 3,670 Restaurant 90% of GSF @ 10,070 s.f. 9,063 s.f. 0 0 0 0 9,063 9,063 9,063 9,063 9,063 9,063 9,063
Casual Dining 90% of GSF @ 9,970 s.f. 8,973 s.f. 0 0 0 0 8,973 8,973 8,973 8,973 8,973 8,973 8,973Net Operating Income
Gross Revenue $0 $0 $0 $0 $671,859 $692,015 $712,775 $734,158 $756,183 $778,869 $802,235 Marina Retail & Office $0 $0 $0 $0 $103,265 $106,363 $109,554 $112,841 $116,226 $119,713 $123,304
Restaurant $0 $0 $0 $0 $306,015 $315,195 $324,651 $334,390 $344,422 $354,755 $365,397 Casual Dining $0 $0 $0 $0 $262,579 $270,456 $278,570 $286,927 $295,535 $304,401 $313,533
Rent (NNN) per s.f. $16.75 per NSF @ 21,706 s.f. $16.75 $17.26 $17.77 $18.31 $30.95 $31.88 $32.84 $33.82 $34.84 $35.88 $36.96 Marina Retail & Office $25.00 per NSF @ 3,670 s.f. $25.00 $25.75 $26.52 $27.32 $28.14 $28.98 $29.85 $30.75 $31.67 $32.62 $33.60
Restaurant $30.00 per NSF @ 9,063 s.f. $30.00 $30.90 $31.83 $32.78 $33.77 $34.78 $35.82 $36.90 $38.00 $39.14 $40.32 Casual Dining $26.00 per NSF @ 8,973 s.f. $26.00 $26.78 $27.58 $28.41 $29.26 $30.14 $31.05 $31.98 $32.94 $33.92 $34.94
Vacancy & Credit Loss $0 $0 $0 $0 ($128,136) $0 $0 $0 $0 ($118,617) ($24,435) Marina Retail & Office $0 $0 $0 $0 ($51,633) $0 $0 $0 $0 ($29,928) ($6,165)
Restaurant $0 $0 $0 $0 ($76,504) $0 $0 $0 $0 ($88,689) ($18,270) Casual Dining ($65,645) $0 $0 $0 $0 ($76,100) ($15,677)
Vacancy & Credit Loss (%) Marina Retail & Office 3 Month (Free Rent) 50% 0% 0% 0% 0% 25% 5%
Restaurant 3 Month (Free Rent) 25% 0% 0% 0% 0% 25% 5% Casual Dining 3 Month (Free Rent) 25% 0% 0% 0% 0% 25% 5%
Operations & Maintenance Expenses $0 $0 $0 $0 ($31,216) ($32,153) ($33,118) ($34,111) ($35,134) ($36,188) ($37,274) Marina Retail & Office $0 $0 $0 $0 ($5,278) ($5,436) ($5,599) ($5,767) ($5,940) ($6,119) ($6,302)
Restaurant $0 $0 $0 $0 ($13,034) ($13,425) ($13,828) ($14,243) ($14,670) ($15,110) ($15,563) Casual Dining $0 $0 $0 $0 ($12,905) ($13,292) ($13,690) ($14,101) ($14,524) ($14,960) ($15,409)
Expense per s.f. $1.15 per GSF @ 24,118 s.f. $1.29 $1.33 $1.37 $1.41 $1.46 $1.50 $1.55 Marina Retail & Office $1.15 per GSF @ 4,078 s.f. $1.15 $1.18 $1.22 $1.26 $1.29 $1.33 $1.37 $1.41 $1.46 $1.50 $1.55
Restaurant $1.15 per GSF @ 10,070 s.f. $1.15 $1.18 $1.22 $1.26 $1.29 $1.33 $1.37 $1.41 $1.46 $1.50 $1.55 Casual Dining $1.15 per GSF @ 9,970 s.f. $1.15 $1.18 $1.22 $1.26 $1.29 $1.33 $1.37 $1.41 $1.46 $1.50 $1.55
Allocated Operating Cost for Open Space $0.25 per Open Space @ 36,187 s.f. $0 $0 $0 $0 ($10,182) ($10,488) ($10,802) ($11,126) ($11,460) ($11,804) ($12,158)Net Operating Income $0 $0 $0 $0 $502,324 $649,374 $668,855 $688,921 $709,589 $612,259 $728,367
Development CostsPercent Built by year 16.6% 5.8% 39.1% 38.4% 0.0% 0.0% 0.0% 0.0% 0.0% 0.0% 0.0%Demolishment Cost $30.00 per Existing Building SF @ 12,036 s.f. ($361,077) ($361,077)
Land $23.38 per s.f. @ 29,600 s.f. ($691,903) ($691,903)Land Cost of Open Space $22.06 per s.f. @ 36,187 s.f. ($798,300) ($798,300)
Site - Infrastructure $30.00 per s.f. @ 29,600 s.f. ($888,000) ($888,000)Building Shell (Includes Soft Cost) $165.37 per GSF @ 24,118 s.f. ($3,988,261) $0 $0 ($2,392,957) ($1,595,304) $0 $0 $0 $0 $0 $0 $0
Marina Retail & Office $130.00 per GSF @ 4,078 s.f. ($530,111) ($318,067) ($212,044) Restaurant $185.00 per GSF @ 10,070 s.f. ($1,862,950) ($1,117,770) ($745,180)
Casual Dining $160.00 per GSF @ 9,970 s.f. ($1,595,200) ($957,120) ($638,080)Tenant Improvement $92.48 per NSF @ 21,706 s.f. ($2,007,470) $0 $0 $0 ($2,007,470) $0 $0 $0 $0 $0 $0 $0 Marina Retail & Office $80.00 per NSF @ 3,670 s.f. ($293,600) ($293,600)
Restaurant $100.00 per NSF @ 9,063 s.f. ($906,300) ($906,300) Casual Dining $90.00 per NSF @ 8,973 s.f. ($807,570) ($807,570)
Other Fees (Permitting, Consultant) ($500,000) ($250,000) ($250,000)WST 9.5% per Construction Cost @ $6,883,731 ($653,954) ($311,691) ($342,264)
Allocated Development Cost of Open Space $16.21 per Open Space @ 36,187 s.f. ($586,753) $0 $0 ($506,620) ($80,133)Total Development Costs ($10,475,718) ($1,740,202) ($611,077) ($4,099,267) ($4,025,171) $0 $0 $0 $0 $0 $0 $0
Annual Cash FlowNet Operating Income $0 $0 $0 $0 $502,324 $649,374 $668,855 $688,921 $709,589 $612,259 $728,367
Asset Value 7.0% (Cap Rate) $0 $0 $0 $0 $7,176,056 $9,276,772 $9,555,076 $9,841,728 $10,136,980 $8,746,562 $10,405,249Transaction Cost 3.0% ($312,157)
Total Development Costs ($10,475,718) ($1,740,202) ($611,077) ($4,099,267) ($4,025,171) $0 $0 $0 $0 $0 $0 $0Unleveraged Net Cash Flow ($1,740,202) ($611,077) ($4,099,267) ($4,025,171) $502,324 $649,374 $668,855 $688,921 $709,589 $612,259 $10,821,459
Building 3
Permiting & Planning Construction Operation
Net Present Value 8% ($1,554,684)Unleveraged IRR Before Taxes 4.9%

NAIOP Real Estate Challenge
Waterfront
Total Building 1 Building 2 w/ Parking Building 3 Discovery Center Marina
DESIGN ASSUMPTIONS GROSS SF 154,478 19,625 84,490 24,118 26,244 NA
Efficiency Factor 90% 90% 90% 90% 90% NA RENTABLE SF 143,509 17,663 80,520 21,706 23,620 NA
Restaurant: 8,438 NSF Marine Retail & office: 11,188 NSF
Spa: 26,010 NSFRestaurant: 9,720 NSFParking: 44,790 NSF
Restaurant: 9,063 NSFCasual Dining: 8,937NSF Marine Retail: 3,670 NSF
Event Space: 6,900NSFSales Office: 3,000NSF
Café and Bar: 4,270 NSFParking: 10,500 SF
81 Deck (4,806 Lineal Foot)
Average Unit SF NA NA 350SF/ parking space NA 350SF/ surface parking NAPARKING STALLS 127 2.29/1,000 NSF NA
COST ASSUMPTIONS LAND VALUE PER DEVELOPMENT UNIT $52/NSF Building is used as existing $27/NSF $69/NSF $63/NSF NA
SITE - INFRASTRUCTURE ( $ / SF OF SITE ) $30.0 NA $30 $30 $30 NABUILDING SHELL ( $ / Gross SF ) NA Building is used as existing Spa: $250/SF
Restaurant: $185/SFRestaurant: $185/SF
Casual Dining: $160/SFMarina Retail: $130/SF
Discovery Center: $110K for Moving
Café & Bar: $160/SF
Marina is used as existing
TENANT IMPROVEMENT ($ / Net SF ) NA Building is used as existing Spa: $100/SFRestaurant: $100/SF
Restaurant: $100/SFCasual Dining: $100/SFMarina Retail: $80/SF
Café & Bar: $90/SF Marina is used as existing
PARKING ABOVE GRADE ($ / STALL) Surface Parking: $15,000/ stall
PARKING BELOW GRADE ($ / STALL)
SOFT COST ( % of hard costs ) NA Included Building Shell Included Building Shell Included Building Shell Included Parking Bld Cost NABASE YR. OPERATING EXPENSES ( $ / Gross SF / YR ) NA $1.15/SF Spa: $2.00/SF
Resutaurant: $1.15/SF$1.15/SF Event & Sales: $6.00/SF
Café & Bar: $1.15/SF20% Gross Revenue
INCOME ASSUMPTIONSRENTAL INCOME ( $ / Net SF / MO ) NA $30/NSF
Marina Retail & Office: $25/NSF
Spa: $23.5/NSFRestaurant: $31/NSF
Restaurant: $30/ NSFCasual Dining: $26/ NSFMarina Retail: $25/NSF
Event: $550/day/spaceCafé & Bar: $26/NSF
$15/Lineal Foot/month
Financial Underwriting Summary
NA
Surface Cost: $10,000/stall (Parking is
used as existing and covered by surface)
1.69/1,000 NSF
PARKING INCOME ( $ / SF / MO ) NA NA $140/stall/ mo$4.00/hour
NA $4.00/hour NA
VALUE ASSUMPTIONDiscount Rate NA 8.00% 8.00% 8.00% 8.00% 8.00%
Exit Capitalization Rate NA 7.00% 7.00% 7.00% 7.00% 12.00%NET PRESENT VALUE ( $ / NSF ) ($40.46) $1.77 ($71.51) ($71.62) ($17.48)
VALUE TOTAL $ ($5,806,561) $31,346 ($5,757,870) ($1,554,684) ($412,933) $1,887,580Unleveraged IRR Before Taxes 6.4% 8.1% 4.3% 4.9% 7.0% 15.2%
Leveraged IRR Before Taxes 8.7% NA NA NA NA NA
DEBT ASSUMPTIONSLOAN TO VALUE 65% NA NA NA NA NA
Average DEBT SERVICE COVERAGE 1.90 NA NA NA NA NATOTAL DEBT $32,880,848 NA NA NA NA NA
NET EQUITY During Development (Inclu Land) $17,500,000 NA NA NA NA NA
Hard & Soft Cost NotesExcludes 9.5% Washington State Sales TaxAssumes pricing in the construction year LEED Silver certificateIncludes contingencies
WATERFRONT: MARINA CF
Year 0 Year 1 Year 2 Year 3 Year 4 Year 5 Year 6 Year 7 Year 8 Year 9 Year 10
Input Unit Unit Value Total 2013 2014 2015 2016 2017 2018 2019 2020 2021 2022 2023Space Program
Inflation Factor 3%Total Deck 72 Deck Total Lineal Foot 4,400 LF 4,400 4,400 4,400 4,400 4,400 4,400 4,400 4,400 4,400 4,400 4,400
Chandler's Cove 20 Deck Total Lineal Foot 1,743 LF 1,743 1,743 1,743 1,743 1,743 1,743 1,743 1,743 1,743 1,743 1,743H.C. Henry Pier 52 Deck Total Lineal Foot 2,657 LF 2,657 2,657 2,657 2,657 2,657 2,657 2,657 2,657 2,657 2,657 2,657
Net Operating Income Gross Revenue $792,000 $815,760 $840,233 $865,440 $891,403 $918,145 $945,689 $974,060 $1,003,282 $1,033,380 $1,064,382
Rent per Lineal Foot "LF", per month $15.00 per Lineal Foot @ 4,400 LF 12 month $15.00 $15.45 $15.91 $16.39 $16.88 $17.39 $17.91 $18.45 $19.00 $19.57 $20.16Vacancy & Credit Loss ($55,440) ($57,103) ($58,816) ($60,581) ($62,398) ($64,270) ($66,198) ($68,184) ($70,230) ($72,337) ($74,507)
Vacancy & Credit Loss (%) 7% 7% 7% 7% 7% 7% 7% 7% 7% 7% 7%Operations & Maintenance Expenses ($158,400) ($163,152) ($168,047) ($173,088) ($178,281) ($183,629) ($189,138) ($194,812) ($200,656) ($206,676) ($212,876)
Expense Ratio (%) 20% per Gross Revenue 20% 20% 20% 20% 20% 20% 20% 20% 20% 20% 20%Ground Lease ($122,623) ($126,301) ($130,090) ($133,993) ($138,013) ($142,153) ($146,418) ($150,810) ($155,335) ($159,995) ($164,795)
Ground Lease 1 $104,188.17 ($107,314) ($110,533) ($113,849) ($117,265) ($120,783) ($124,406) ($128,138) ($131,982) ($135,942) ($140,020) ($144,221)Ground Lease 2 $14,862.96 ($15,309) ($15,768) ($16,241) ($16,728) ($17,230) ($17,747) ($18,280) ($18,828) ($19,393) ($19,975) ($20,574)
Net Operating Income $455,537 $469,203 $483,280 $497,778 $512,711 $528,093 $543,935 $560,253 $577,061 $594,373 $612,204
Marina
Permiting & Planning Construction Operation
Annual Cash FlowNet Operating Income * $469,203 $483,280 $497,778 $512,711 $528,093 $543,935 $560,253 $577,061 $594,373 $612,204
Asset Value 12.0% (Cap Rate) $3,796,144 $3,910,029 $4,027,330 $4,148,150 $4,272,594 $4,400,772 $4,532,795 $4,668,779 $4,808,842 $4,953,108 $5,101,701Transaction Cost 3.0% ($153,051)
Total Development Costs ($3,796,144) ($3,796,144) $0 $0 $0 $0 $0 $0 $0 $0 $0 $0Net Cash Flow ($3,796,144) $469,203 $483,280 $497,778 $512,711 $528,093 $543,935 $560,253 $577,061 $594,373 $5,560,854
Net Present Value 8% $1,887,580Unleveraged IRR Before Taxes 15.2%Cash Flow from Chandler's Cove ($1,503,791) $185,869 $191,445 $197,188 $203,104 $209,197 $215,473 $221,937 $228,595 $235,453 $2,202,856Cash Flow from H.C. Henry Pier ($2,292,354) $283,335 $291,835 $300,590 $309,608 $318,896 $328,463 $338,317 $348,466 $358,920 $3,357,997* 1: In Year 0, project can not generate cash flow.
Financing Summary during construction term (2013 - 2016)
Land/ Property Value $17,500,000 Equity (Land/ Property Contribution) $17,500,000(Existing Retail) $6,185,537 Debt $32,880,848(Marina) $3,796,144 NOI from existing properties $2,828,732(Remained Land Value) $7,518,318 (Existing Retail) $1,378,471
Development Cost $34,006,060 (Marina) $1,450,261Interest $1,878,178 NOI from H.C. Henry Pier $174,657Total $53,384,238 Total $53,384,238
Use Source
Initial Value Expected NOI in 2013 Cap Rate Land Value per SF*Waterfront Site $17,500,000 $41.18Building 1 $6,185,537 $432,988 7%Marina $3,796,144 $455,537 12%Land for Redvelopment $2,240,373 $23.38Land for Open Space $5,277,945 $23.38* Land Value = $17.5 million - Marina Value $3.8 million
WATERFRONT: FINANCING SUMMARY 2013-16
WATERFRONT: LAND VALUE
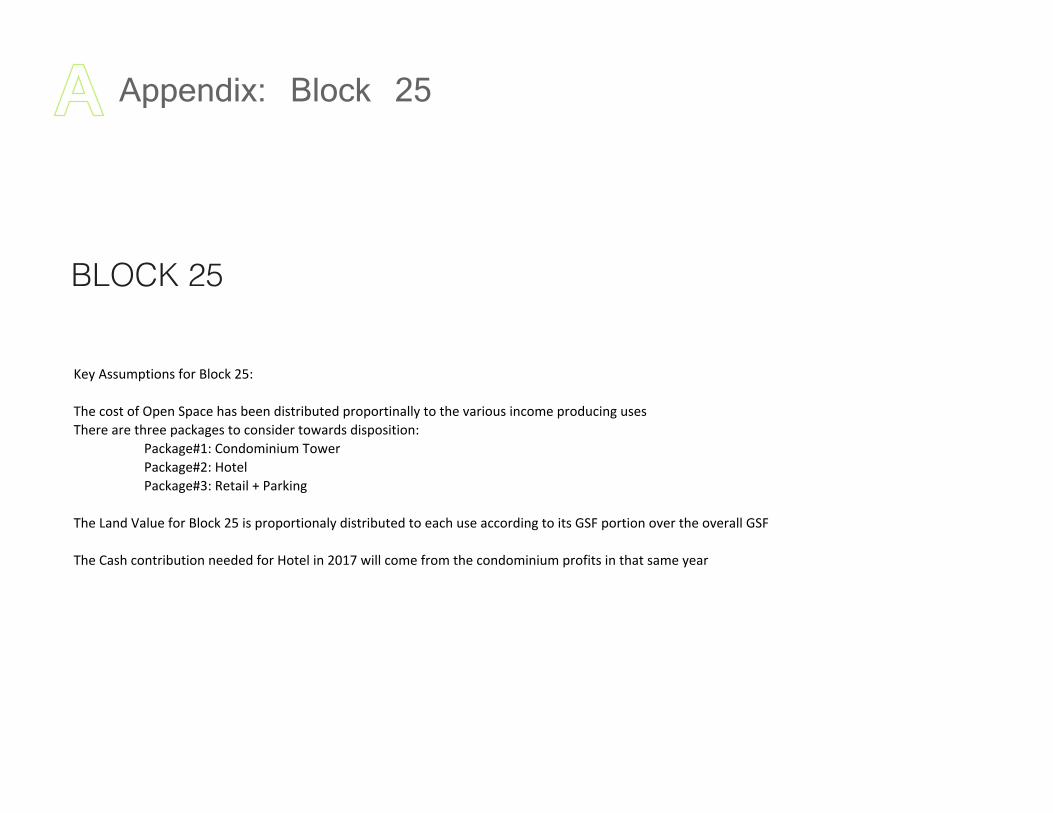
BLOCK 25
Key Assumptions for Block 25:
The cost of Open Space has been distributed proportinally to the various income producing usesThere are three packages to consider towards disposition:
Package#1: Condominium Tower Package#2: Hotel Package#3: Retail + Parking
The Land Value for Block 25 is proportionaly distributed to each use according to its GSF portion over the overall GSF
The Cash contribution needed for Hotel in 2017 will come from the condominium profits in that same year
Appendix: Block 25

NAIOP Real Estate Challenge
Block 25
Total Condominium Hotel Retail Retail Parking Open SpaceDESIGN ASSUMPTIONS
GROSS SF 553,284 220,500 116,000 55,600 161,184 0Efficiency Factor 81% 80% 65% 89% 95% 100% RENTABLE SF 446,565 176,400 67,400 49,640 153,125 0Average Unit SF NA 1,200 400 NA 350 NA
PARKING STALLS 437 1 per Unit 50% of Occupancy NAExclude: For sale and hotel gurst spaces
COST ASSUMPTIONS LAND VALUE PER DEVELOPMENT UNIT $45/NSF $86,089/Unit $37,937/Unit $51/NSF $23/NSF NA
SITE - INFRASTRUCTURE ( $ / SF OF SITE ) $30 $30 $30 $30 $30 $0HARD COSTS + SOFT COSTS ( $ / Gross SF ) NA $460 $240 General: $220/SF
Restaurant: $220/SFGym: $180/SFMovie: $180/SF
See Below Parking Cost NA
TENANT IMPROVEMENT ($ / Net SF ) NA Included Building Shell Included Building Shell General: $100/SFRestaurant: $100/SF
Gym: $80/SFMovie: $80/SF
Included Parking Bld Cost NA
PARKING ABOVE GRADE ($ / STALL) $20,000 / Stall (350 SF per stall)PARKING BELOW GRADE ($ / STALL) $35,000 / Stall (350 SF per stall)
BASE YR. OPERATING EXPENSES ( $ / Gross SF / YR ) NA Cost of Sales: 3% of sales revenue
Expense Rate: 80% of total revenue
General: $1.15/SFRestaurant: $1.15/SF
Gym: $2.0/SFMovie: $2.0/SF
10% Gross Revenue NA
Upscale/Luxyry
INCOME ASSUMPTIONSRENTAL INCOME ( $ / Net SF / MO )
NA NA NA
General: $30/SFRestaurant: $34/SF
Gym: $28/SFMovie: $25/SF
See below Parking Income NASALE INCOME ( $ / USABLE SF ) NA $1,200k/Unit Rev PAR$165 NAPARKING INCOME ( $ / SF / MO )
NA$50k/Unit $25k/Unit
See Parking SectionMonthly Parking Fee: $150Hourly Parking Rate: $5.0 NA
VALUE ASSUMPTIONDiscount Rate 8.00% 8.00% 8.00% 7.00% 8.00% NA
Exit Capitalization Rate NA NA 6.00% 6.00% 8.00% NAVALUE per NSF ( NPV / NSF ) $99.5 $104.2 $232.0 NA
NPV $44,432,338 $18,372,145 $15,637,270 NAUnleveraged IRR Before Taxes 0.0% 12.7% 11.1% NA
Leveraged IRR Before Taxes 16.9% 18.0% 17.2% NA
DEBT ASSUMPTIONSLOAN TO VALUE 67% 65% 54% 45% 21% NA
Average DEBT SERVICE COVERAGE 8.06 0.00 2.79 2.17 17.75 NATOTAL DEBT $151,968,399 $108,151,924 $28,066,740 $13,334,842 $2,414,893 NA
TOTAL EQUITY(Inclu Land) $75,925,070 $38,202,431 $20,179,807 $9,063,394 $8,479,439 NA
Financial Underwriting Summary
$10,422,922$85.2
14.1%17.2%
Total 208 lots, (3.2 per 1,000 SF)
Hard Cost + Soft Cost NotesExcludes 9.5% Washington State Sales TaxAssumes 2013 pricingConstruction Costs assume Leed Silver certificationIncluded 10% contingency
BLOCK 25 KEY ASSUMPTIONS

BLOCK 25 SUMMARYNAIOP Real Estate Challenge
Block 25
Total Condominium Hotel Retail Retail Parking Open SpaceDESIGN ASSUMPTIONS
GROSS SF 553,284 220,500 116,000 55,600 161,184 0Efficiency Factor 81% 80% 65% 89% 95% 100% RENTABLE SF 446,565 176,400 67,400 49,640 153,125 0Average Unit SF NA 1,200 400 NA 350 NA
PARKING STALLS 437 1 per Unit 50% of Occupancy NAExclude: For sale and hotel gurst spaces
COST ASSUMPTIONS LAND VALUE PER DEVELOPMENT UNIT $45/NSF $86,089/Unit $37,937/Unit $51/NSF $23/NSF NA
SITE - INFRASTRUCTURE ( $ / SF OF SITE ) $30 $30 $30 $30 $30 $0HARD COSTS + SOFT COSTS ( $ / Gross SF ) NA $460 $240 General: $220/SF
Restaurant: $220/SFGym: $180/SFMovie: $180/SF
See Below Parking Cost NA
TENANT IMPROVEMENT ($ / Net SF ) NA Included Building Shell Included Building Shell General: $100/SFRestaurant: $100/SF
Gym: $80/SFMovie: $80/SF
Included Parking Bld Cost NA
PARKING ABOVE GRADE ($ / STALL) $20,000 / Stall (350 SF per stall)PARKING BELOW GRADE ($ / STALL) $35,000 / Stall (350 SF per stall)
BASE YR. OPERATING EXPENSES ( $ / Gross SF / YR ) NA Cost of Sales: 3% of sales revenue
Expense Rate: 80% of total revenue
General: $1.15/SFRestaurant: $1.15/SF
Gym: $2.0/SFMovie: $2.0/SF
10% Gross Revenue NA
Upscale/Luxyry
INCOME ASSUMPTIONSRENTAL INCOME ( $ / Net SF / MO )
NA NA NA
General: $30/SFRestaurant: $34/SF
Gym: $28/SFMovie: $25/SF
See below Parking Income NASALE INCOME ( $ / USABLE SF ) NA $1,200k/Unit Rev PAR$165 NAPARKING INCOME ( $ / SF / MO )
NA$50k/Unit $25k/Unit
See Parking SectionMonthly Parking Fee: $150Hourly Parking Rate: $5.0 NA
VALUE ASSUMPTIONDiscount Rate 8.00% 8.00% 8.00% 7.00% 8.00% NA
Exit Capitalization Rate NA NA 6.00% 6.00% 8.00% NAVALUE per NSF ( NPV / NSF ) $99.5 $104.2 $232.0 NA
NPV $44,432,338 $18,372,145 $15,637,270 NAUnleveraged IRR Before Taxes 0.0% 12.7% 11.1% NA
Leveraged IRR Before Taxes 16.9% 18.0% 17.2% NA
DEBT ASSUMPTIONSLOAN TO VALUE 67% 65% 54% 45% 21% NA
Average DEBT SERVICE COVERAGE 8.06 0.00 2.79 2.17 17.75 NATOTAL DEBT $151,968,399 $108,151,924 $28,066,740 $13,334,842 $2,414,893 NA
TOTAL EQUITY(Inclu Land) $75,925,070 $38,202,431 $20,179,807 $9,063,394 $8,479,439 NA
Financial Underwriting Summary
$10,422,922$85.2
14.1%17.2%
Total 208 lots, (3.2 per 1,000 SF)
Hard Cost + Soft Cost NotesExcludes 9.5% Washington State Sales TaxAssumes 2013 pricingConstruction Costs assume Leed Silver certificationIncluded 10% contingency
1. Space Summary
Stories Total SF Efficiency Factor NSF Avg. unit space sf Number of Units Unit Cost Total CostCondominium 28,815.28 (sf.) 21 220,500 (sf.) 80% 176,400 (sf.) 1,200 (sf./unit) 147 (unit) ($957,108) (per unit) ($140,694,854)Retail 7,266 (sf.) 55,600 (sf.) 89% 49,640 (sf.) 1,379 (sf./per store) 36 (stores) ($391) (per sf.) ($21,716,382) General 2,901 (sf.) 22,200 (sf.) 90% 19,980 (sf.) 650 (sf./per store) 30 (stores) (per sf.)
Restaurant 1,359 (sf.) 10,400 (sf.) 90% 9,360 (sf.) 2,340 (sf./store) 4 (stores) (per sf.)
Gym 1,960 (sf.) 2 15,000 (sf.) 90% 13,500 (sf.) 13,500 1
Movie Theater 1,045 (sf.) 2 8,000 (sf.) 85% 6,800 (sf.) 6,000 (sf./screen) 1 (screen) (per sf.)
Hotel 15,159 (sf.) 116,000 (sf.) 65% 67,400 (sf.) 400 (sf./room) 168 (room) ($247,995) (per room) ($41,663,188)Total Parking 21,063.77 (sf.) 161,184 (sf.)
Broken down per type:Above ground 89,184 (sf.) 95% 84,725 (sf.) 350 (sf/stall) 242 (stalls) ($20,000) (per stall)Below ground 72,000 (sf.) 95% 68,400 (sf.) 350 (sf/stall) 195 (stalls) ($35,000) (per stall)
Broken down per use:Parking for Condominium Tower 7,785 (sf.) 59,574 (sf.) 95% 56,595 (sf.) 350 (sf/stall) 162 (stalls) ($5,659,500)Parking for Hotel 3,274 (sf.) 25,053 (sf.) 95% 23,800 (sf.) 350 (sf/stall) 68 (stalls) ($1,865,929)Parking for Retail 10,004.68 (sf.) 76,558 (sf.) 95% 72,730 (sf.) 350 (sf/stall) 208 (stalls) ($10,728,248)
Open Space - (sf.) (sf.) 100% - (sf.) - - - - (sf.)Total 72,304 (sf.) Total 553,284 (sf.) Total 446,565 (sf.) ($222,328,101)
Land value distribution Building Summary NSF Space
2. Summary ProformaYear 0 Year 1 Year 2 Year 3 Year 4 Year 5 Year 6 Year 7 Year 8 Year 9 Year 102013 2014 2015 2016 2017 2018 2019 2020 2021 2022 2023
Gross IncomeRent/ Sales $396,753,016 $0 $0 $0 $0 $149,173,194 $84,683,572 $47,433,372 $27,271,513 $28,307,530 $29,383,343 $30,500,493 Condominium $0 $0 $0 $0 $125,910,671 $59,370,590 $21,159,566 $0 $0 $0 $0 Retail $0 $0 $0 $0 $1,647,570 $1,696,997 $1,747,907 $1,800,344 $1,854,354 $1,909,985 $1,967,284 General $0 $0 $0 $0 $669,237 $689,314 $709,994 $731,294 $753,232 $775,829 $799,104 Restaurant $0 $0 $0 $0 $355,319 $365,978 $376,958 $388,266 $399,914 $411,912 $424,269 Gym $0 $0 $0 $0 $422,042 $434,703 $447,744 $461,176 $475,011 $489,262 $503,940 Movie Theater $0 $0 $0 $0 $200,972 $207,001 $213,211 $219,608 $226,196 $232,982 $239,971Hotel $0 $0 $0 $0 $19,368,722 $20,143,471 $20,949,210 $21,787,178 $22,658,666 $23,565,012 $24,507,613Parking $0 $0 $0 $0 $2,246,231 $3,472,514 $3,576,690 $3,683,990 $3,794,510 $3,908,346 $4,025,596Vacancy & Credit Loss ($8,792,899) $0 $0 $0 $0 ($6,130,675) ($1,991,596) ($14,172) ($14,738) ($15,328) ($609,812) ($16,579)Total Vacancy & Credit Loss(%) - - - - -4% -2% 0% 0% 0% -2% 0% Retail $0 $0 $0 $0 ($411,892) $0 $0 $0 $0 ($593,871) $0 General $0 $0 $0 $0 ($167,309) $0 $0 $0 $0 ($387,915) $0 Restaurant $0 $0 $0 $0 ($88,830) $0 $0 $0 $0 ($205,956) $0 Gym $0 $0 $0 $0 ($105,510) $0 $0 $0 $0 $0 $0 Movie Theater $0 $0 $0 $0 ($50,243) $0 $0 $0 $0 $0 $0Hotel $0 $0 $0 $0 ($5,718,783) ($1,991,596) ($14,172) ($14,738) ($15,328) ($15,941) ($16,579)ParkingEffective Gross Income $387,960,117 $0 $0 $0 $0 $143,042,519 $82,691,976 $47,419,201 $27,256,774 $28,292,202 $28,773,531 $30,483,914Operating Cost ($137,086,953) $0 $0 ($3,777,320) ($1,781,118) ($17,243,290) ($17,260,753) ($17,938,731) ($18,643,454) ($19,375,981) ($20,137,413) ($20,928,894) Condominium (Sales cost) $0 $0 ($3,777,320) ($1,781,118) ($634,787) $0 $0 $0 $0 $0 $0 Retail $0 $0 $0 $0 ($93,969) ($96,788) ($99,691) ($102,682) ($105,763) ($108,936) ($112,204) General $0 $0 $0 $0 ($28,734) ($29,596) ($30,484) ($31,399) ($32,341) ($33,311) ($34,310) Gym $0 $0 $0 $0 ($13,461) ($13,865) ($14,281) ($14,709) ($15,151) ($15,605) ($16,073) Restaurant $0 $0 $0 $0 ($33,765) ($34,778) ($35,822) ($36,896) ($38,003) ($39,143) ($40,317) Movie Theater $0 $0 $0 $0 ($18,008) ($18,548) ($19,105) ($19,678) ($20,268) ($20,876) ($21,503)Hotel $0 $0 $0 $0 ($15,399,522) ($16,015,503) ($16,656,123) ($17,322,368) ($18,015,262) ($18,735,873) ($19,485,308)Parking $0 $0 $0 $0 ($1,115,012) ($1,148,462) ($1,182,916) ($1,218,404) ($1,254,956) ($1,292,605) ($1,331,383)Open Space $0 $0 $0 $0 $0 $0 $0 $0 $0 $0 $0NOI $250,873,164 $0 $0 ($3,777,320) ($1,781,118) $125,799,229 $65,431,223 $29,480,470 $8,613,321 $8,916,221 $8,636,118 $9,555,020
Included in revenue

BLOCK 25 SUMMARYNAIOP Real Estate Challenge
Block 25
Total Condominium Hotel Retail Retail Parking Open SpaceDESIGN ASSUMPTIONS
GROSS SF 553,284 220,500 116,000 55,600 161,184 0Efficiency Factor 81% 80% 65% 89% 95% 100% RENTABLE SF 446,565 176,400 67,400 49,640 153,125 0Average Unit SF NA 1,200 400 NA 350 NA
PARKING STALLS 437 1 per Unit 50% of Occupancy NAExclude: For sale and hotel gurst spaces
COST ASSUMPTIONS LAND VALUE PER DEVELOPMENT UNIT $45/NSF $86,089/Unit $37,937/Unit $51/NSF $23/NSF NA
SITE - INFRASTRUCTURE ( $ / SF OF SITE ) $30 $30 $30 $30 $30 $0HARD COSTS + SOFT COSTS ( $ / Gross SF ) NA $460 $240 General: $220/SF
Restaurant: $220/SFGym: $180/SFMovie: $180/SF
See Below Parking Cost NA
TENANT IMPROVEMENT ($ / Net SF ) NA Included Building Shell Included Building Shell General: $100/SFRestaurant: $100/SF
Gym: $80/SFMovie: $80/SF
Included Parking Bld Cost NA
PARKING ABOVE GRADE ($ / STALL) $20,000 / Stall (350 SF per stall)PARKING BELOW GRADE ($ / STALL) $35,000 / Stall (350 SF per stall)
BASE YR. OPERATING EXPENSES ( $ / Gross SF / YR ) NA Cost of Sales: 3% of sales revenue
Expense Rate: 80% of total revenue
General: $1.15/SFRestaurant: $1.15/SF
Gym: $2.0/SFMovie: $2.0/SF
10% Gross Revenue NA
Upscale/Luxyry
INCOME ASSUMPTIONSRENTAL INCOME ( $ / Net SF / MO )
NA NA NA
General: $30/SFRestaurant: $34/SF
Gym: $28/SFMovie: $25/SF
See below Parking Income NASALE INCOME ( $ / USABLE SF ) NA $1,200k/Unit Rev PAR$165 NAPARKING INCOME ( $ / SF / MO )
NA$50k/Unit $25k/Unit
See Parking SectionMonthly Parking Fee: $150Hourly Parking Rate: $5.0 NA
VALUE ASSUMPTIONDiscount Rate 8.00% 8.00% 8.00% 7.00% 8.00% NA
Exit Capitalization Rate NA NA 6.00% 6.00% 8.00% NAVALUE per NSF ( NPV / NSF ) $99.5 $104.2 $232.0 NA
NPV $44,432,338 $18,372,145 $15,637,270 NAUnleveraged IRR Before Taxes 0.0% 12.7% 11.1% NA
Leveraged IRR Before Taxes 16.9% 18.0% 17.2% NA
DEBT ASSUMPTIONSLOAN TO VALUE 67% 65% 54% 45% 21% NA
Average DEBT SERVICE COVERAGE 8.06 0.00 2.79 2.17 17.75 NATOTAL DEBT $151,968,399 $108,151,924 $28,066,740 $13,334,842 $2,414,893 NA
TOTAL EQUITY(Inclu Land) $75,925,070 $38,202,431 $20,179,807 $9,063,394 $8,479,439 NA
Financial Underwriting Summary
$10,422,922$85.2
14.1%17.2%
Total 208 lots, (3.2 per 1,000 SF)
Hard Cost + Soft Cost NotesExcludes 9.5% Washington State Sales TaxAssumes 2013 pricingConstruction Costs assume Leed Silver certificationIncluded 10% contingency
3. Development ProgramLand Cost ($25,000,000)Development Cost ($222,328,101) ($47,984,209) ($23,889,005) ($75,397,713) ($75,057,175) $0 $0 $0 $0 $0 $0 $0 Condominium ($146,354,354) ($25,116,819) ($13,085,612) ($53,382,721) ($54,769,203) $0 $0 $0 $0 $0 $0 $0 Retail ($21,716,382) ($5,392,889) ($2,880,617) ($6,721,439) ($6,721,439) $0 $0 $0 $0 $0 $0 $0 Hotel ($43,529,116) ($11,542,256) ($5,375,581) ($13,044,744) ($13,566,534) $0 $0 $0 $0 $0 $0 $0 Parking ($10,728,248) ($5,932,245) ($2,547,195) ($2,248,809) $0 $0 $0 $0 $0 $0 $0 $0 Open Space $0 $0 $0 $0 $0 $0 $0 $0 $0 $0 $0 $0Total Cost ($222,328,101) ($47,984,209) ($23,889,005) ($75,397,713) ($75,057,175) $0 $0 $0 $0 $0 $0 $0
4. Source/ FinancialDebt/ Service ($133,471,905) $0 $0 ($769,822) ($1,533,577) ($117,002,106) ($2,361,067) ($2,361,067) ($2,361,067) ($2,361,067) ($2,361,067) ($2,361,067)Principal Repayment ($112,431,846) $0 $0 $0 $0 ($108,701,139) ($568,750) ($588,978) ($609,926) ($631,620) ($654,084) ($677,348)Principal Repayment at exit ($39,536,553) $0 $0 $0 $0 $0 $0 $0 $0 $0 $0 ($39,536,553)Equity (Cash + Land) $75,925,070 $47,984,209 $23,889,005 $789,889 $0 $3,261,969 $0 $0 $0 $0 $0 $0
(Cash Contribution) $50,925,070 $22,984,209 $23,889,005 $789,889 $0 $3,261,969 $0 $0 $0 $0 $0 $0Debt $151,968,399 $0 $0 $75,377,647 $76,590,752 $0 $0 $0 $0 $0 $0 $0Equity Amount $75,925,070 $47,984,209 $71,873,213 $72,663,102 $72,663,102 $75,925,070 $75,925,070 $75,925,070 $37,722,640 $37,722,640 $37,722,640 $37,722,640Debt Amount $151,968,399 $0 $0 $75,377,647 $151,968,399 $43,267,259 $42,698,510 $42,109,531 $41,499,605 $40,867,985 $40,213,901 $39,536,553Present Value/ Project Cost $222,328,101 $222,328,101 $222,328,101 $110,509,048 $128,707,684 $133,282,067 $138,022,208 $133,036,376 $148,024,446LTC/ LTV 34% 68% 19% 39% 33% 31% 30% 30% 27%DSCR 1.08 27.71 12.49 3.65 3.78 3.66 4.05 Sales Proceeds $148,024,446Transaction Cost ($8,612,172)Net Sales Proceeds $139,412,274Net Sales Proceeds for Equity Participation $99,875,722
5. Return/ Cash FlowBlock 25 Cash Flow ($47,984,209) ($23,889,005) ($79,175,033) ($76,838,293) $125,799,229 $65,431,223 $29,480,470 $8,613,321 $8,916,221 $8,636,118 $148,967,294Equity Cash Flow ($47,984,209) ($23,889,005) ($789,889) $0 $5,156,051 $61,003,832 $26,484,616 $6,252,254 $6,555,154 $6,275,051 $107,069,675Cumulative Total Benefit ($47,984,209) ($71,873,213) ($72,663,102) ($72,663,102) ($67,507,051) ($6,503,218) $19,981,398 $26,233,652 $32,788,806 $39,063,858 $146,133,533Net Present Value 8% $36,813,808Cash on Cash Return per year 6.8% 80.3% 34.9% 8.2% 8.6% 8.3% 141.0%Cash on Cash Return on Project$146,133,533 192.47%Project IRR (Unleveraged) 12.5%Project IRR (Leveraged) 16.9%
2013 2014 2015 2016 2017 2018 2019 2020 2021 2022 2023Sources
EquityLand $25,000,000 $0 $0 $0 $0 $0 $0 $0 $0 $0 $0Cash $22,984,209 $23,889,005 $789,889 $0 $0 $0 $0 $0 $0 $0 $0
Debt $0 $0 $75,377,647 $76,590,752 $0 $0 $0 $0 $0 $0 $0NOI $0 $0 $0 $0 $523,346 $6,060,634 $8,320,904 $8,613,321 $8,916,221 $8,636,118 $9,555,020Sale $0 $0 $0 $0 $118,380,518 $57,304,265 $20,524,779 $0 $0 $0 $139,412,274
TOTAL $47,984,209 $23,889,005 $76,167,535 $76,590,752 $122,158,156 $63,364,899 $28,845,683 $8,613,321 $8,916,221 $8,636,118 $148,967,294Uses
Development Cost $47,984,209 $23,889,005 $75,397,713 $75,057,175 $0 $0 $0 $0 $0 $0 $0Debt Service $0 $0 $769,822 $1,533,577 $8,850,182 $2,361,067 $2,361,067 $2,361,067 $2,361,067 $2,361,067 $2,361,067Principal Repayment $0 $0 $0 $0 $108,151,924 $0 $0 $0 $0 $0 $39,536,553Return on Equity $0 $0 $0 $0 $5,163,727 $61,003,832 $26,484,616 $6,252,254 $6,555,154 $6,275,051 $107,069,675
TOTAL $47,984,209 $23,889,005 $76,167,535 $76,590,752 $122,165,833 $63,364,899 $28,845,683 $8,613,321 $8,916,221 $8,636,118 $148,967,294

BLOCK 25 CONDOMINIUM TOWERNAIOP Real Estate Challenge
Block 25
Total Condominium Hotel Retail Retail Parking Open SpaceDESIGN ASSUMPTIONS
GROSS SF 553,284 220,500 116,000 55,600 161,184 0Efficiency Factor 81% 80% 65% 89% 95% 100% RENTABLE SF 446,565 176,400 67,400 49,640 153,125 0Average Unit SF NA 1,200 400 NA 350 NA
PARKING STALLS 437 1 per Unit 50% of Occupancy NAExclude: For sale and hotel gurst spaces
COST ASSUMPTIONS LAND VALUE PER DEVELOPMENT UNIT $45/NSF $86,089/Unit $37,937/Unit $51/NSF $23/NSF NA
SITE - INFRASTRUCTURE ( $ / SF OF SITE ) $30 $30 $30 $30 $30 $0HARD COSTS + SOFT COSTS ( $ / Gross SF ) NA $460 $240 General: $220/SF
Restaurant: $220/SFGym: $180/SFMovie: $180/SF
See Below Parking Cost NA
TENANT IMPROVEMENT ($ / Net SF ) NA Included Building Shell Included Building Shell General: $100/SFRestaurant: $100/SF
Gym: $80/SFMovie: $80/SF
Included Parking Bld Cost NA
PARKING ABOVE GRADE ($ / STALL) $20,000 / Stall (350 SF per stall)PARKING BELOW GRADE ($ / STALL) $35,000 / Stall (350 SF per stall)
BASE YR. OPERATING EXPENSES ( $ / Gross SF / YR ) NA Cost of Sales: 3% of sales revenue
Expense Rate: 80% of total revenue
General: $1.15/SFRestaurant: $1.15/SF
Gym: $2.0/SFMovie: $2.0/SF
10% Gross Revenue NA
Upscale/Luxyry
INCOME ASSUMPTIONSRENTAL INCOME ( $ / Net SF / MO )
NA NA NA
General: $30/SFRestaurant: $34/SF
Gym: $28/SFMovie: $25/SF
See below Parking Income NASALE INCOME ( $ / USABLE SF ) NA $1,200k/Unit Rev PAR$165 NAPARKING INCOME ( $ / SF / MO )
NA$50k/Unit $25k/Unit
See Parking SectionMonthly Parking Fee: $150Hourly Parking Rate: $5.0 NA
VALUE ASSUMPTIONDiscount Rate 8.00% 8.00% 8.00% 7.00% 8.00% NA
Exit Capitalization Rate NA NA 6.00% 6.00% 8.00% NAVALUE per NSF ( NPV / NSF ) $99.5 $104.2 $232.0 NA
NPV $44,432,338 $18,372,145 $15,637,270 NAUnleveraged IRR Before Taxes 0.0% 12.7% 11.1% NA
Leveraged IRR Before Taxes 16.9% 18.0% 17.2% NA
DEBT ASSUMPTIONSLOAN TO VALUE 67% 65% 54% 45% 21% NA
Average DEBT SERVICE COVERAGE 8.06 0.00 2.79 2.17 17.75 NATOTAL DEBT $151,968,399 $108,151,924 $28,066,740 $13,334,842 $2,414,893 NA
TOTAL EQUITY(Inclu Land) $75,925,070 $38,202,431 $20,179,807 $9,063,394 $8,479,439 NA
Financial Underwriting Summary
$10,422,922$85.2
14.1%17.2%
Total 208 lots, (3.2 per 1,000 SF)
Hard Cost + Soft Cost NotesExcludes 9.5% Washington State Sales TaxAssumes 2013 pricingConstruction Costs assume Leed Silver certificationIncluded 10% contingency
Year 0 Year 1 Year 2 Year 3 Year 4 Year 5 Year 6 Year 7 Year 8 Year 9 Year 10
Input Unit Unit Value Total 2013 2014 2015 2016 2017 2018 2019 2020 2021 2022 2023
AssumptionsAvg Inflation Factor 3%Number of Condominium Units 147Floor Plate SF 10,500 Total SF 220,500
# Stories 21 Average Unit Size 1,200 Net Usable Area 176,400
Efficiency Factor 80%Average Sale price per unit 1,200,000 Sale Price per SF $1,000Parking units 162 110% Parking Unit Price $50,000
Income
61% 29% 10%
Projected Condominum Unit Sales - - - - 89 42 15 0 0
Projected Parking Unit Sales 99 47 16 0 0Condominium Unit Sale Revenues $120,339,402 $56,725,644 $20,259,159 $0 $0Parlking Units Sale Revenues $5,571,269 $2,644,946 $900,407 $0 $0Marketing and Legal Allow ($300,000) ($200,000)HOA $1 SF/Year ($198,540) ($85,207)Cost of Sales 3% - - ($3,777,320) ($1,781,118) ($634,787) $0 $0
Income -$ -$ -$ -$ $121,634,811 $57,304,265 $20,524,779 $0 $0
Development Costs
Built per year % 10% 10% 40% 40%
Cost per year ($12,461,759) ($13,085,611.88) ($53,382,720.96) ($54,769,202.59)
Land Cost 12,655,060$ ($12,655,060) ($12,655,060)Site - Infrastructure $30 per SF @ 36,600 ($1,098,014)Hard Costs + Soft Costs $460 per SF @ 220,500 ($101,430,000)Marketing and Legal Allow ($250,000) ($500,000) ($300,000)Parking (Above ground) $20,000 per stall @ 0Parking (Below ground) $35,000 per stall @ 162 ($5,659,500)Proportion of Open Space $0 per SF @ - $0
Developers FeeWST 9.5% @ ($108,187,514) ($10,277,814)Affordable Housing Payment in Lieu $15.50 per SF @ 162,750 ($2,522,625)
Total Development Costs ($146,354,354)
Annual Cash Flow Income $0 $0 $0 $0 $121,634,811 $57,304,265 $20,524,779 $0 $0Asset Value 7.0% Exit Cap Rate $0 $0 $0 $0 $71,482,525 $19,182,036 $0 $0 $0Transaction Cost 3.0% $0.00 $0.00 $0.00 $0.00 ($2,144,476) ($575,461) $0.00 $0.00 $0.00Total Development Costs ($146,354,354) ($25,116,819) ($13,085,612) ($53,382,721) ($54,769,203) $0 $0 $0 $0 $0
Unleveraged Net Cash Flow ($25,116,819) ($13,085,612) ($53,382,721) ($54,769,203) $121,634,811 $57,304,265 $20,524,779 $0 $0Finance/ Source
Debt/ Service 6.0% $0 $0 ($114,641,039) $0 $0 $0 $0Principal Payment ($108,151,924) $0 $0 $0 $0Interest Repayment ($6,489,115) $0 $0 $0 $0
Principal Repayment at exitEquity (Cash + Land) 35% $50,664,189.91 $25,116,819 $13,085,612 $0
(Cash Contribution) $12,461,759 $13,085,612 $0Debt 65% $53,382,721 $54,769,203Equity Amount $25,116,819 $38,202,431 $38,202,431 $38,202,431 $38,202,431 $38,202,431 $38,202,431 $0 $0Accumulated Debt Amount $53,382,721 $108,151,924 $0 $0 $0 $0 $0(Principal Payment Start) 1 13 25 37 49 61 73(Principal Payment End) 12 24 36 48 60 72 84
Return on EquityEquity Cash Flow ($25,116,819) ($13,085,612) $0 $0 $6,993,772 $57,304,265 $20,524,779 $0 $0 $0 $0Tax Concequences $0 $0 $0 $0 $0 $0 $0 $0 $0 $0 $0Total Benefit ($25,116,819) ($13,085,612) $0 $0 $6,993,772 $57,304,265 $20,524,779 $0 $0 $0 $0Cumulative Total Benefit ($25,116,819) ($38,202,431) ($38,202,431) ($38,202,431) ($31,208,659) $26,095,606 $46,620,385 $0 $0 $0 $0
Net Present Value 8% $18,372,145Cash on Cash Return per year 13.8% 113.1% 40.5%Cash on Cash Return on Project $46,620,385 92.02%Unleveraged IRR Before Taxes 12.7%Leveraged IRR Before Taxes 18.0%
2013 2014 2015 2016 2017 2018 2019 2020 2021 2022 2023Sources
EquityLand $12,655,060 $0 $0 $0 $0 $0 $0 $0 $0 $0 $0Cash $12,461,759 $13,085,612 $0 $0 $0 $0 $0 $0 $0 $0 $0
Debt $0 $0 $53,382,721 $54,769,203 $0 $0 $0 $0 $0 $0 $0Sales Proceeds $0 $0 $0 $0 $121,634,811 $57,304,265 $20,524,779 $0 $0 $0 $0
TOTAL $25,116,819 $13,085,612 $53,382,721 $54,769,203 $121,634,811 $57,304,265 $20,524,779 $0 $0 $0 $0Uses
Development Cost $25,116,819 $13,085,612 $53,382,721 $54,769,203 $0 $0 $0 $0 $0 $0 $0Debt Service $0
Principal Repay $0 $0 $0 $0 $108,151,924 $0 $0 $0 $0 $0 $0Interest Repayment $0 $0 $0 $0 $6,489,115 $0 $0 $0 $0 $0 $0
Return on Equity $0 $0 $0 $0 $6,993,772 $57,304,265 $20,524,779 $0 $0 $0 $0TOTAL $25,116,819 $13,085,612 $53,382,721 $54,769,203 $121,634,811 $57,304,265 $20,524,779 $0 $0 $0 $0
Included in the other items
CONDOMINIUMS TOWER
Permiting & Planning Construction Operation
(30% Presales)
NAIOP Real Estate Challenge
Block 25
Total Condominium Hotel Retail Retail Parking Open SpaceDESIGN ASSUMPTIONS
GROSS SF 553,284 220,500 116,000 55,600 161,184 0Efficiency Factor 81% 80% 65% 89% 95% 100% RENTABLE SF 446,565 176,400 67,400 49,640 153,125 0Average Unit SF NA 1,200 400 NA 350 NA
PARKING STALLS 437 1 per Unit 50% of Occupancy NAExclude: For sale and hotel gurst spaces
COST ASSUMPTIONS LAND VALUE PER DEVELOPMENT UNIT $45/NSF $86,089/Unit $37,937/Unit $51/NSF $23/NSF NA
SITE - INFRASTRUCTURE ( $ / SF OF SITE ) $30 $30 $30 $30 $30 $0HARD COSTS + SOFT COSTS ( $ / Gross SF ) NA $460 $240 General: $220/SF
Restaurant: $220/SFGym: $180/SFMovie: $180/SF
See Below Parking Cost NA
TENANT IMPROVEMENT ($ / Net SF ) NA Included Building Shell Included Building Shell General: $100/SFRestaurant: $100/SF
Gym: $80/SFMovie: $80/SF
Included Parking Bld Cost NA
PARKING ABOVE GRADE ($ / STALL) $20,000 / Stall (350 SF per stall)PARKING BELOW GRADE ($ / STALL) $35,000 / Stall (350 SF per stall)
BASE YR. OPERATING EXPENSES ( $ / Gross SF / YR ) NA Cost of Sales: 3% of sales revenue
Expense Rate: 80% of total revenue
General: $1.15/SFRestaurant: $1.15/SF
Gym: $2.0/SFMovie: $2.0/SF
10% Gross Revenue NA
Upscale/Luxyry
INCOME ASSUMPTIONSRENTAL INCOME ( $ / Net SF / MO )
NA NA NA
General: $30/SFRestaurant: $34/SF
Gym: $28/SFMovie: $25/SF
See below Parking Income NASALE INCOME ( $ / USABLE SF ) NA $1,200k/Unit Rev PAR$165 NAPARKING INCOME ( $ / SF / MO )
NA$50k/Unit $25k/Unit
See Parking SectionMonthly Parking Fee: $150Hourly Parking Rate: $5.0 NA
VALUE ASSUMPTIONDiscount Rate 8.00% 8.00% 8.00% 7.00% 8.00% NA
Exit Capitalization Rate NA NA 6.00% 6.00% 8.00% NAVALUE per NSF ( NPV / NSF ) $99.5 $104.2 $232.0 NA
NPV $44,432,338 $18,372,145 $15,637,270 NAUnleveraged IRR Before Taxes 0.0% 12.7% 11.1% NA
Leveraged IRR Before Taxes 16.9% 18.0% 17.2% NA
DEBT ASSUMPTIONSLOAN TO VALUE 67% 65% 54% 45% 21% NA
Average DEBT SERVICE COVERAGE 8.06 0.00 2.79 2.17 17.75 NATOTAL DEBT $151,968,399 $108,151,924 $28,066,740 $13,334,842 $2,414,893 NA
TOTAL EQUITY(Inclu Land) $75,925,070 $38,202,431 $20,179,807 $9,063,394 $8,479,439 NA
Financial Underwriting Summary
$10,422,922$85.2
14.1%17.2%
Total 208 lots, (3.2 per 1,000 SF)
Hard Cost + Soft Cost NotesExcludes 9.5% Washington State Sales TaxAssumes 2013 pricingConstruction Costs assume Leed Silver certificationIncluded 10% contingency
Year 0 Year 1 Year 2 Year 3 Year 4 Year 5 Year 6 Year 7 Year 8 Year 9 Year 10
Input Unit Unit Value Total 2013 2014 2015 2016 2017 2018 2019 2020 2021 2022 2023
AssumptionsAvg Inflation Factor 3%Number of Condominium Units 147Floor Plate SF 10,500 Total SF 220,500
# Stories 21 Average Unit Size 1,200 Net Usable Area 176,400
Efficiency Factor 80%Average Sale price per unit 1,200,000 Sale Price per SF $1,000Parking units 162 110% Parking Unit Price $50,000
Income
61% 29% 10%
Projected Condominum Unit Sales - - - - 89 42 15 0 0
Projected Parking Unit Sales 99 47 16 0 0Condominium Unit Sale Revenues $120,339,402 $56,725,644 $20,259,159 $0 $0Parlking Units Sale Revenues $5,571,269 $2,644,946 $900,407 $0 $0Marketing and Legal Allow ($300,000) ($200,000)HOA $1 SF/Year ($198,540) ($85,207)Cost of Sales 3% - - ($3,777,320) ($1,781,118) ($634,787) $0 $0
Income -$ -$ -$ -$ $121,634,811 $57,304,265 $20,524,779 $0 $0
Development Costs
Built per year % 10% 10% 40% 40%
Cost per year ($12,461,759) ($13,085,611.88) ($53,382,720.96) ($54,769,202.59)
Land Cost 12,655,060$ ($12,655,060) ($12,655,060)Site - Infrastructure $30 per SF @ 36,600 ($1,098,014)Hard Costs + Soft Costs $460 per SF @ 220,500 ($101,430,000)Marketing and Legal Allow ($250,000) ($500,000) ($300,000)Parking (Above ground) $20,000 per stall @ 0Parking (Below ground) $35,000 per stall @ 162 ($5,659,500)Proportion of Open Space $0 per SF @ - $0
Developers FeeWST 9.5% @ ($108,187,514) ($10,277,814)Affordable Housing Payment in Lieu $15.50 per SF @ 162,750 ($2,522,625)
Total Development Costs ($146,354,354)
Annual Cash Flow Income $0 $0 $0 $0 $121,634,811 $57,304,265 $20,524,779 $0 $0Asset Value 7.0% Exit Cap Rate $0 $0 $0 $0 $71,482,525 $19,182,036 $0 $0 $0Transaction Cost 3.0% $0.00 $0.00 $0.00 $0.00 ($2,144,476) ($575,461) $0.00 $0.00 $0.00Total Development Costs ($146,354,354) ($25,116,819) ($13,085,612) ($53,382,721) ($54,769,203) $0 $0 $0 $0 $0
Unleveraged Net Cash Flow ($25,116,819) ($13,085,612) ($53,382,721) ($54,769,203) $121,634,811 $57,304,265 $20,524,779 $0 $0Finance/ Source
Debt/ Service 6.0% $0 $0 ($114,641,039) $0 $0 $0 $0Principal Payment ($108,151,924) $0 $0 $0 $0Interest Repayment ($6,489,115) $0 $0 $0 $0
Principal Repayment at exitEquity (Cash + Land) 35% $50,664,189.91 $25,116,819 $13,085,612 $0
(Cash Contribution) $12,461,759 $13,085,612 $0Debt 65% $53,382,721 $54,769,203Equity Amount $25,116,819 $38,202,431 $38,202,431 $38,202,431 $38,202,431 $38,202,431 $38,202,431 $0 $0Accumulated Debt Amount $53,382,721 $108,151,924 $0 $0 $0 $0 $0(Principal Payment Start) 1 13 25 37 49 61 73(Principal Payment End) 12 24 36 48 60 72 84
Return on EquityEquity Cash Flow ($25,116,819) ($13,085,612) $0 $0 $6,993,772 $57,304,265 $20,524,779 $0 $0 $0 $0Tax Concequences $0 $0 $0 $0 $0 $0 $0 $0 $0 $0 $0Total Benefit ($25,116,819) ($13,085,612) $0 $0 $6,993,772 $57,304,265 $20,524,779 $0 $0 $0 $0Cumulative Total Benefit ($25,116,819) ($38,202,431) ($38,202,431) ($38,202,431) ($31,208,659) $26,095,606 $46,620,385 $0 $0 $0 $0
Net Present Value 8% $18,372,145Cash on Cash Return per year 13.8% 113.1% 40.5%Cash on Cash Return on Project $46,620,385 92.02%Unleveraged IRR Before Taxes 12.7%Leveraged IRR Before Taxes 18.0%
2013 2014 2015 2016 2017 2018 2019 2020 2021 2022 2023Sources
EquityLand $12,655,060 $0 $0 $0 $0 $0 $0 $0 $0 $0 $0Cash $12,461,759 $13,085,612 $0 $0 $0 $0 $0 $0 $0 $0 $0
Debt $0 $0 $53,382,721 $54,769,203 $0 $0 $0 $0 $0 $0 $0Sales Proceeds $0 $0 $0 $0 $121,634,811 $57,304,265 $20,524,779 $0 $0 $0 $0
TOTAL $25,116,819 $13,085,612 $53,382,721 $54,769,203 $121,634,811 $57,304,265 $20,524,779 $0 $0 $0 $0Uses
Development Cost $25,116,819 $13,085,612 $53,382,721 $54,769,203 $0 $0 $0 $0 $0 $0 $0Debt Service $0
Principal Repay $0 $0 $0 $0 $108,151,924 $0 $0 $0 $0 $0 $0Interest Repayment $0 $0 $0 $0 $6,489,115 $0 $0 $0 $0 $0 $0
Return on Equity $0 $0 $0 $0 $6,993,772 $57,304,265 $20,524,779 $0 $0 $0 $0TOTAL $25,116,819 $13,085,612 $53,382,721 $54,769,203 $121,634,811 $57,304,265 $20,524,779 $0 $0 $0 $0
Included in the other items
CONDOMINIUMS TOWER
Permiting & Planning Construction Operation
(30% Presales)
Year 0 Year 1 Year 2 Year 3 Year 4 Year 5 Year 6 Year 7 Year 8 Year 9 Year 10
Input Unit Unit Value Total 2013 2014 2015 2016 2017 2018 2019 2020 2021 2022 2023
AssumptionsAvg Inflation Factor 3%Number of Condominium Units 147Floor Plate SF 10,500 Total SF 220,500
# Stories 21 Average Unit Size 1,200 Net Usable Area 176,400
Efficiency Factor 80%Average Sale price per unit 1,200,000 Sale Price per SF $1,000Parking units 162 110% Parking Unit Price $50,000
Income
61% 29% 10%
Projected Condominum Unit Sales - - - - 89 42 15 0 0
Projected Parking Unit Sales 99 47 16 0 0Condominium Unit Sale Revenues $120,339,402 $56,725,644 $20,259,159 $0 $0Parlking Units Sale Revenues $5,571,269 $2,644,946 $900,407 $0 $0Marketing and Legal Allow ($300,000) ($200,000)HOA $1 SF/Year ($198,540) ($85,207)Cost of Sales 3% - - ($3,777,320) ($1,781,118) ($634,787) $0 $0
Income -$ -$ -$ -$ $121,634,811 $57,304,265 $20,524,779 $0 $0
Development Costs
Built per year % 10% 10% 40% 40%
Cost per year ($12,461,759) ($13,085,611.88) ($53,382,720.96) ($54,769,202.59)
Land Cost 12,655,060$ ($12,655,060) ($12,655,060)Site - Infrastructure $30 per SF @ 36,600 ($1,098,014)Hard Costs + Soft Costs $460 per SF @ 220,500 ($101,430,000)Marketing and Legal Allow ($250,000) ($500,000) ($300,000)Parking (Above ground) $20,000 per stall @ 0Parking (Below ground) $35,000 per stall @ 162 ($5,659,500)Proportion of Open Space $0 per SF @ - $0
Developers FeeWST 9.5% @ ($108,187,514) ($10,277,814)Affordable Housing Payment in Lieu $15.50 per SF @ 162,750 ($2,522,625)
Total Development Costs ($146,354,354)
Annual Cash Flow Income $0 $0 $0 $0 $121,634,811 $57,304,265 $20,524,779 $0 $0Asset Value 7.0% Exit Cap Rate $0 $0 $0 $0 $71,482,525 $19,182,036 $0 $0 $0Transaction Cost 3.0% $0.00 $0.00 $0.00 $0.00 ($2,144,476) ($575,461) $0.00 $0.00 $0.00Total Development Costs ($146,354,354) ($25,116,819) ($13,085,612) ($53,382,721) ($54,769,203) $0 $0 $0 $0 $0
Unleveraged Net Cash Flow ($25,116,819) ($13,085,612) ($53,382,721) ($54,769,203) $121,634,811 $57,304,265 $20,524,779 $0 $0Finance/ Source
Debt/ Service 6.0% $0 $0 ($114,641,039) $0 $0 $0 $0Principal Payment ($108,151,924) $0 $0 $0 $0Interest Repayment ($6,489,115) $0 $0 $0 $0
Principal Repayment at exitEquity (Cash + Land) 35% $50,664,189.91 $25,116,819 $13,085,612 $0
(Cash Contribution) $12,461,759 $13,085,612 $0Debt 65% $53,382,721 $54,769,203Equity Amount $25,116,819 $38,202,431 $38,202,431 $38,202,431 $38,202,431 $38,202,431 $38,202,431 $0 $0Accumulated Debt Amount $53,382,721 $108,151,924 $0 $0 $0 $0 $0(Principal Payment Start) 1 13 25 37 49 61 73(Principal Payment End) 12 24 36 48 60 72 84
Return on EquityEquity Cash Flow ($25,116,819) ($13,085,612) $0 $0 $6,993,772 $57,304,265 $20,524,779 $0 $0 $0 $0Tax Concequences $0 $0 $0 $0 $0 $0 $0 $0 $0 $0 $0Total Benefit ($25,116,819) ($13,085,612) $0 $0 $6,993,772 $57,304,265 $20,524,779 $0 $0 $0 $0Cumulative Total Benefit ($25,116,819) ($38,202,431) ($38,202,431) ($38,202,431) ($31,208,659) $26,095,606 $46,620,385 $0 $0 $0 $0
Net Present Value 8% $18,372,145Cash on Cash Return per year 13.8% 113.1% 40.5%Cash on Cash Return on Project $46,620,385 92.02%Unleveraged IRR Before Taxes 12.7%Leveraged IRR Before Taxes 18.0%
2013 2014 2015 2016 2017 2018 2019 2020 2021 2022 2023Sources
EquityLand $12,655,060 $0 $0 $0 $0 $0 $0 $0 $0 $0 $0Cash $12,461,759 $13,085,612 $0 $0 $0 $0 $0 $0 $0 $0 $0
Debt $0 $0 $53,382,721 $54,769,203 $0 $0 $0 $0 $0 $0 $0Sales Proceeds $0 $0 $0 $0 $121,634,811 $57,304,265 $20,524,779 $0 $0 $0 $0
TOTAL $25,116,819 $13,085,612 $53,382,721 $54,769,203 $121,634,811 $57,304,265 $20,524,779 $0 $0 $0 $0Uses
Development Cost $25,116,819 $13,085,612 $53,382,721 $54,769,203 $0 $0 $0 $0 $0 $0 $0Debt Service $0
Principal Repay $0 $0 $0 $0 $108,151,924 $0 $0 $0 $0 $0 $0Interest Repayment $0 $0 $0 $0 $6,489,115 $0 $0 $0 $0 $0 $0
Return on Equity $0 $0 $0 $0 $6,993,772 $57,304,265 $20,524,779 $0 $0 $0 $0TOTAL $25,116,819 $13,085,612 $53,382,721 $54,769,203 $121,634,811 $57,304,265 $20,524,779 $0 $0 $0 $0
Included in the other items
CONDOMINIUMS TOWER
Permiting & Planning Construction Operation
(30% Presales)BLOCK 25 CONDOMINIUM TOWER
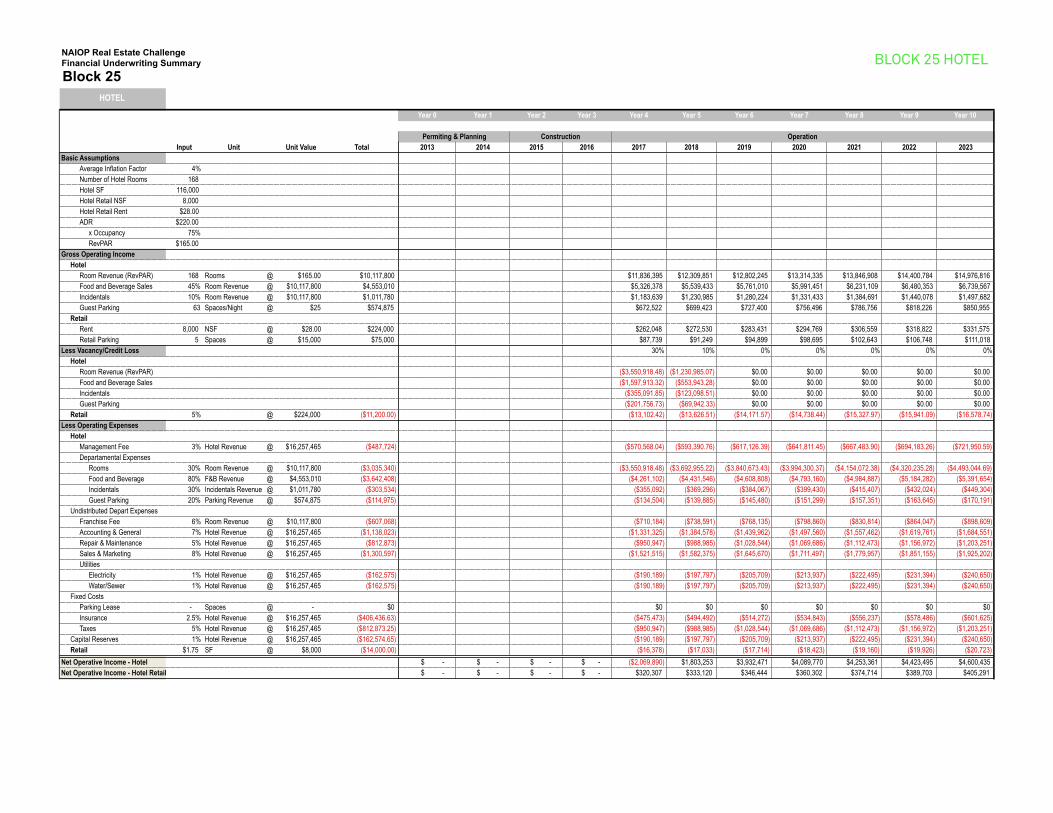
NAIOP Real Estate Challenge
Block 25
Total Condominium Hotel Retail Retail Parking Open SpaceDESIGN ASSUMPTIONS
GROSS SF 553,284 220,500 116,000 55,600 161,184 0Efficiency Factor 81% 80% 65% 89% 95% 100% RENTABLE SF 446,565 176,400 67,400 49,640 153,125 0Average Unit SF NA 1,200 400 NA 350 NA
PARKING STALLS 437 1 per Unit 50% of Occupancy NAExclude: For sale and hotel gurst spaces
COST ASSUMPTIONS LAND VALUE PER DEVELOPMENT UNIT $45/NSF $86,089/Unit $37,937/Unit $51/NSF $23/NSF NA
SITE - INFRASTRUCTURE ( $ / SF OF SITE ) $30 $30 $30 $30 $30 $0HARD COSTS + SOFT COSTS ( $ / Gross SF ) NA $460 $240 General: $220/SF
Restaurant: $220/SFGym: $180/SFMovie: $180/SF
See Below Parking Cost NA
TENANT IMPROVEMENT ($ / Net SF ) NA Included Building Shell Included Building Shell General: $100/SFRestaurant: $100/SF
Gym: $80/SFMovie: $80/SF
Included Parking Bld Cost NA
PARKING ABOVE GRADE ($ / STALL) $20,000 / Stall (350 SF per stall)PARKING BELOW GRADE ($ / STALL) $35,000 / Stall (350 SF per stall)
BASE YR. OPERATING EXPENSES ( $ / Gross SF / YR ) NA Cost of Sales: 3% of sales revenue
Expense Rate: 80% of total revenue
General: $1.15/SFRestaurant: $1.15/SF
Gym: $2.0/SFMovie: $2.0/SF
10% Gross Revenue NA
Upscale/Luxyry
INCOME ASSUMPTIONSRENTAL INCOME ( $ / Net SF / MO )
NA NA NA
General: $30/SFRestaurant: $34/SF
Gym: $28/SFMovie: $25/SF
See below Parking Income NASALE INCOME ( $ / USABLE SF ) NA $1,200k/Unit Rev PAR$165 NAPARKING INCOME ( $ / SF / MO )
NA$50k/Unit $25k/Unit
See Parking SectionMonthly Parking Fee: $150Hourly Parking Rate: $5.0 NA
VALUE ASSUMPTIONDiscount Rate 8.00% 8.00% 8.00% 7.00% 8.00% NA
Exit Capitalization Rate NA NA 6.00% 6.00% 8.00% NAVALUE per NSF ( NPV / NSF ) $99.5 $104.2 $232.0 NA
NPV $44,432,338 $18,372,145 $15,637,270 NAUnleveraged IRR Before Taxes 0.0% 12.7% 11.1% NA
Leveraged IRR Before Taxes 16.9% 18.0% 17.2% NA
DEBT ASSUMPTIONSLOAN TO VALUE 67% 65% 54% 45% 21% NA
Average DEBT SERVICE COVERAGE 8.06 0.00 2.79 2.17 17.75 NATOTAL DEBT $151,968,399 $108,151,924 $28,066,740 $13,334,842 $2,414,893 NA
TOTAL EQUITY(Inclu Land) $75,925,070 $38,202,431 $20,179,807 $9,063,394 $8,479,439 NA
Financial Underwriting Summary
$10,422,922$85.2
14.1%17.2%
Total 208 lots, (3.2 per 1,000 SF)
Hard Cost + Soft Cost NotesExcludes 9.5% Washington State Sales TaxAssumes 2013 pricingConstruction Costs assume Leed Silver certificationIncluded 10% contingency
BLOCK 25 HOTEL
Year 0 Year 1 Year 2 Year 3 Year 4 Year 5 Year 6 Year 7 Year 8 Year 9 Year 10
Input Unit Unit Value Total 2013 2014 2015 2016 2017 2018 2019 2020 2021 2022 2023Basic Assumptions
Average Inflation Factor 4%Number of Hotel Rooms 168 Hotel SF 116,000 Hotel Retail NSF 8,000 Hotel Retail Rent $28.00ADR $220.00
x Occupancy 75%RevPAR $165.00
Gross Operating IncomeHotel
Room Revenue (RevPAR) 168 Rooms @ $165.00 $10,117,800 $11,836,395 $12,309,851 $12,802,245 $13,314,335 $13,846,908 $14,400,784 $14,976,816Food and Beverage Sales 45% Room Revenue @ $10,117,800 $4,553,010 $5,326,378 $5,539,433 $5,761,010 $5,991,451 $6,231,109 $6,480,353 $6,739,567Incidentals 10% Room Revenue @ $10,117,800 $1,011,780 $1,183,639 $1,230,985 $1,280,224 $1,331,433 $1,384,691 $1,440,078 $1,497,682Guest Parking 63 Spaces/Night @ $25 $574,875 $672,522 $699,423 $727,400 $756,496 $786,756 $818,226 $850,955
RetailRent 8,000 NSF @ $28.00 $224,000 $262,048 $272,530 $283,431 $294,769 $306,559 $318,822 $331,575Retail Parking 5 Spaces @ $15,000 $75,000 $87,739 $91,249 $94,899 $98,695 $102,643 $106,748 $111,018
Less Vacancy/Credit Loss 30% 10% 0% 0% 0% 0% 0%Hotel
Room Revenue (RevPAR) ($3,550,918.48) ($1,230,985.07) $0.00 $0.00 $0.00 $0.00 $0.00Food and Beverage Sales ($1,597,913.32) ($553,943.28) $0.00 $0.00 $0.00 $0.00 $0.00Incidentals ($355,091.85) ($123,098.51) $0.00 $0.00 $0.00 $0.00 $0.00Guest Parking ($201,756.73) ($69,942.33) $0.00 $0.00 $0.00 $0.00 $0.00
Retail 5% @ $224,000 ($11,200.00) ($13,102.42) ($13,626.51) ($14,171.57) ($14,738.44) ($15,327.97) ($15,941.09) ($16,578.74)Less Operating Expenses
HotelManagement Fee 3% Hotel Revenue @ $16,257,465 ($487,724) ($570,568.04) ($593,390.76) ($617,126.39) ($641,811.45) ($667,483.90) ($694,183.26) ($721,950.59)Departamental Expenses
Rooms 30% Room Revenue @ $10,117,800 ($3,035,340) ($3,550,918.48) ($3,692,955.22) ($3,840,673.43) ($3,994,300.37) ($4,154,072.38) ($4,320,235.28) ($4,493,044.69)Food and Beverage 80% F&B Revenue @ $4,553,010 ($3,642,408) ($4,261,102) ($4,431,546) ($4,608,808) ($4,793,160) ($4,984,887) ($5,184,282) ($5,391,654)Incidentals 30% Incidentals Revenue @ $1,011,780 ($303,534) ($355,092) ($369,296) ($384,067) ($399,430) ($415,407) ($432,024) ($449,304)Guest Parking 20% Parking Revenue @ $574,875 ($114,975) ($134,504) ($139,885) ($145,480) ($151,299) ($157,351) ($163,645) ($170,191)
Undistributed Depart ExpensesFranchise Fee 6% Room Revenue @ $10,117,800 ($607,068) ($710,184) ($738,591) ($768,135) ($798,860) ($830,814) ($864,047) ($898,609)Accounting & General 7% Hotel Revenue @ $16,257,465 ($1,138,023) ($1,331,325) ($1,384,578) ($1,439,962) ($1,497,560) ($1,557,462) ($1,619,761) ($1,684,551)Repair & Maintenance 5% Hotel Revenue @ $16,257,465 ($812,873) ($950,947) ($988,985) ($1,028,544) ($1,069,686) ($1,112,473) ($1,156,972) ($1,203,251)Sales & Marketing 8% Hotel Revenue @ $16,257,465 ($1,300,597) ($1,521,515) ($1,582,375) ($1,645,670) ($1,711,497) ($1,779,957) ($1,851,155) ($1,925,202)Utilities
Electricity 1% Hotel Revenue @ $16,257,465 ($162,575) ($190,189) ($197,797) ($205,709) ($213,937) ($222,495) ($231,394) ($240,650)Water/Sewer 1% Hotel Revenue @ $16,257,465 ($162,575) ($190,189) ($197,797) ($205,709) ($213,937) ($222,495) ($231,394) ($240,650)
Fixed CostsParking Lease - Spaces @ - $0 $0 $0 $0 $0 $0 $0 $0Insurance 2.5% Hotel Revenue @ $16,257,465 ($406,436.63) ($475,473) ($494,492) ($514,272) ($534,843) ($556,237) ($578,486) ($601,625)Taxes 5% Hotel Revenue @ $16,257,465 ($812,873.25) ($950,947) ($988,985) ($1,028,544) ($1,069,686) ($1,112,473) ($1,156,972) ($1,203,251)
Capital Reserves 1% Hotel Revenue @ $16,257,465 ($162,574.65) ($190,189) ($197,797) ($205,709) ($213,937) ($222,495) ($231,394) ($240,650)Retail $1.75 SF @ $8,000 ($14,000.00) ($16,378) ($17,033) ($17,714) ($18,423) ($19,160) ($19,926) ($20,723)
Net Operative Income - Hotel -$ -$ -$ -$ ($2,069,890) $1,803,253 $3,932,471 $4,089,770 $4,253,361 $4,423,495 $4,600,435Net Operative Income - Hotel Retail -$ -$ -$ -$ $320,307 $333,120 $346,444 $360,302 $374,714 $389,703 $405,291Development Costs
Built per year % 15% 15% 35% 35%Cost per year ($5,168,828) ($5,375,581) ($13,044,744) ($13,566,534)
Land Cost $6,373,428 ($6,373,428) ($6,373,428)Site - Infrastructure $30 per SF @ 18,433 ($552,989)Hard Costs + Soft Costs $240 per SF @ 116,000 ($27,840,000)TI $0Parking (Above ground) $20,000 per stall @ 34 ($685,429)Parking (Below ground) $35,000 per stall @ 34 ($1,180,500)Proportion of Open Space $0 per SF @ - $0Developers FeeWST 9.5% @ ($30,258,918) ($2,874,597)
Total Development Costs ($43,529,116)
Annual Cash FlowNet Operating Income $0 $0 $0 $0 ($1,749,582) $2,136,373 $4,278,916 $4,450,072 $4,628,075 $4,813,198 $5,005,726Asset Value 6.0% Exit Cap Rate $0 $0 $0 $0 ($29,159,705) $35,606,214 $71,315,262 $74,167,872 $77,134,587 $80,219,970 $83,428,769Transaction Cost 3.0% $0.00 $0.00 $0.00 $0.00 $0.00 $0.00 $0.00 $0.00 $0.00 $0.00 ($6,674,302)
Total Development Costs ($43,529,116) ($11,542,256) ($5,375,581) ($13,044,744) ($13,566,534) $0 $0 $0 $0 $0 $0 $0
Unleveraged Net Cash Flow ($11,542,256) ($5,375,581) ($13,044,744) ($13,566,534) ($1,749,582) $2,136,373 $4,278,916 $4,450,072 $4,628,075 $4,813,198 $81,760,194Finance/ Source 2.79 Average DSCR 1.41 2.83 2.94 3.06 3.18 3.31
Debt/ Service 3.5% ($473,125.44) ($982,335.89) ($1,512,386) ($1,512,386) ($1,512,386) ($1,512,386) ($1,512,386) ($1,512,386) ($1,512,386)Principal Repayment 30 years ($538,637) ($557,794) ($577,633) ($598,178) ($619,453) ($641,485) ($664,301)Principal Repayment at exit ($23,869,257)Equity (Cash + Land) 46% $20,179,807 $11,542,256 $5,375,581 $0 $0 $3,261,969 $0 $0 $0 $0 $0 $0
(Cash Contribution) $5,168,828 $5,375,581 $3,261,969Debt 54% $13,517,870 $14,548,870Equity Amount $11,542,256 $16,917,838 $16,917,838 $16,917,838 $20,179,807 $20,179,807 $20,179,807 $20,179,807 $20,179,807 $20,179,807 $20,179,807Debt Amount $13,517,870 $28,066,740 $27,528,103 $26,970,309 $26,392,675 $25,794,497 $25,175,044 $24,533,559 $23,869,257(Principal Payment Start) 1 13 25 37 49 61 73(Principal Payment End) 12 24 36 48 60 72 84
Return on EquityEquity Cash Flow ($11,542,256) ($5,375,581) $0 ($3,261,969) $623,986 $2,766,529 $2,937,686 $3,115,689 $3,300,812 $56,378,550
Tax Concequences $0 $0 $0 $0 $0 $0 $0 $0 $0 $0 $0Total Benefit ($11,542,256) ($5,375,581) $0 $0 ($3,261,969) $623,986 $2,766,529 $2,937,686 $3,115,689 $3,300,812 $56,378,550Cumulative Total Benefit ($11,542,256) ($16,917,838) ($16,917,838) ($16,917,838) ($20,179,807) ($19,555,820) ($16,789,291) ($13,851,605) ($10,735,916) ($7,435,105) $48,943,445
Net Present Value 8% $15,637,270Cash on Cash Return per year -16.2% 3.1% 13.7% 14.6% 15.4% 16.4% 279.4%Cash on Cash Return on Project $48,943,445 242.54%Unleveraged IRR Before Taxes 11.1%Leveraged IRR Before Taxes 17.2%
2013 2014 2015 2016 2017 2018 2019 2020 2021 2022 2023Sources
EquityLand $6,373,428 $0 $0 $0 $0 $0 $0 $0 $0 $0 $0Cash $5,168,828 $5,375,581 $0 $0 $3,261,969 $0 $0 $0 $0 $0 $0
Debt $0 $0 $13,517,870 $14,548,870 $0 $0 $0 $0 $0 $0 $0NOI $0 $0 $0 $0 ($1,749,582) $2,136,373 $4,278,916 $4,450,072 $4,628,075 $4,813,198 $5,005,726Sale $0 $0 $0 $0 $0 $0 $0 $0 $0 $0 $76,754,468
TOTAL $11,542,256 $5,375,581 $13,517,870 $14,548,870 $1,512,386 $2,136,373 $4,278,916 $4,450,072 $4,628,075 $4,813,198 $81,760,194Uses
Development Cost $11,542,256 $5,375,581 $13,044,744 $13,566,534 $0 $0 $0 $0 $0 $0 $0Debt Service $0 $0 $473,125 $982,336 $1,512,386 $1,512,386 $1,512,386 $1,512,386 $1,512,386 $1,512,386 $1,512,386Principal Repayment $23,869,257Return on Equity $0 $0 $0 $0 $0 $623,986 $2,766,529 $2,937,686 $3,115,689 $3,300,812 $56,378,550
TOTAL $11,542,256 $5,375,581 $13,517,870 $14,548,870 $1,512,386 $2,136,373 $4,278,916 $4,450,072 $4,628,075 $4,813,198 $81,760,194
No of Rooms Percentage Room RateWater View Room 50 30% 250 75Marcer Street 34 20% 180 36Court Yard 84 50% 220 110
168 100% ADR 221
Included in the other items
Operation
HOTEL
Permiting & Planning Construction

NAIOP Real Estate Challenge
Block 25
Total Condominium Hotel Retail Retail Parking Open SpaceDESIGN ASSUMPTIONS
GROSS SF 553,284 220,500 116,000 55,600 161,184 0Efficiency Factor 81% 80% 65% 89% 95% 100% RENTABLE SF 446,565 176,400 67,400 49,640 153,125 0Average Unit SF NA 1,200 400 NA 350 NA
PARKING STALLS 437 1 per Unit 50% of Occupancy NAExclude: For sale and hotel gurst spaces
COST ASSUMPTIONS LAND VALUE PER DEVELOPMENT UNIT $45/NSF $86,089/Unit $37,937/Unit $51/NSF $23/NSF NA
SITE - INFRASTRUCTURE ( $ / SF OF SITE ) $30 $30 $30 $30 $30 $0HARD COSTS + SOFT COSTS ( $ / Gross SF ) NA $460 $240 General: $220/SF
Restaurant: $220/SFGym: $180/SFMovie: $180/SF
See Below Parking Cost NA
TENANT IMPROVEMENT ($ / Net SF ) NA Included Building Shell Included Building Shell General: $100/SFRestaurant: $100/SF
Gym: $80/SFMovie: $80/SF
Included Parking Bld Cost NA
PARKING ABOVE GRADE ($ / STALL) $20,000 / Stall (350 SF per stall)PARKING BELOW GRADE ($ / STALL) $35,000 / Stall (350 SF per stall)
BASE YR. OPERATING EXPENSES ( $ / Gross SF / YR ) NA Cost of Sales: 3% of sales revenue
Expense Rate: 80% of total revenue
General: $1.15/SFRestaurant: $1.15/SF
Gym: $2.0/SFMovie: $2.0/SF
10% Gross Revenue NA
Upscale/Luxyry
INCOME ASSUMPTIONSRENTAL INCOME ( $ / Net SF / MO )
NA NA NA
General: $30/SFRestaurant: $34/SF
Gym: $28/SFMovie: $25/SF
See below Parking Income NASALE INCOME ( $ / USABLE SF ) NA $1,200k/Unit Rev PAR$165 NAPARKING INCOME ( $ / SF / MO )
NA$50k/Unit $25k/Unit
See Parking SectionMonthly Parking Fee: $150Hourly Parking Rate: $5.0 NA
VALUE ASSUMPTIONDiscount Rate 8.00% 8.00% 8.00% 7.00% 8.00% NA
Exit Capitalization Rate NA NA 6.00% 6.00% 8.00% NAVALUE per NSF ( NPV / NSF ) $99.5 $104.2 $232.0 NA
NPV $44,432,338 $18,372,145 $15,637,270 NAUnleveraged IRR Before Taxes 0.0% 12.7% 11.1% NA
Leveraged IRR Before Taxes 16.9% 18.0% 17.2% NA
DEBT ASSUMPTIONSLOAN TO VALUE 67% 65% 54% 45% 21% NA
Average DEBT SERVICE COVERAGE 8.06 0.00 2.79 2.17 17.75 NATOTAL DEBT $151,968,399 $108,151,924 $28,066,740 $13,334,842 $2,414,893 NA
TOTAL EQUITY(Inclu Land) $75,925,070 $38,202,431 $20,179,807 $9,063,394 $8,479,439 NA
Financial Underwriting Summary
$10,422,922$85.2
14.1%17.2%
Total 208 lots, (3.2 per 1,000 SF)
Hard Cost + Soft Cost NotesExcludes 9.5% Washington State Sales TaxAssumes 2013 pricingConstruction Costs assume Leed Silver certificationIncluded 10% contingency
BLOCK 25 RETAIL
Year 0 Year 1 Year 2 Year 3 Year 4 Year 5 Year 6 Year 7 Year 8 Year 9 Year 10
Input Unit Unit Value Total 2013 2014 2015 2016 2017 2018 2019 2020 2021 2022 2023Space Program
Avg Inflation Factor 3%Total GSF 55,600 SF 0 0 0 0 55,600 55,600 55,600 55,600 55,600 55,600 55,600 General 22,200 SF 22,200 22,200 22,200 22,200 22,200 22,200 22,200
Restaurant 10,400 SF 10,400 10,400 10,400 10,400 10,400 10,400 10,400 Gym 15,000 SF 15,000 15,000 15,000 15,000 15,000 15,000 15,000
Movie Theater 8,000 SF 8,000 8,000 8,000 8,000 8,000 8,000 8,000NSF 89% 0 0 0 0 49640 49640 49640 49640 49640 49640 49640
General 90% 0 0 0 0 19,820 19,820 19,820 19,820 19,820 19,820 19,820 Restaurant 90% 0 0 0 0 9,285 9,285 9,285 9,285 9,285 9,285 9,285
Gym 90% 0 0 0 0 13,392 13,392 13,392 13,392 13,392 13,392 13,392 Movie Theater 85% 0 0 0 0 7,142 7,142 7,142 7,142 7,142 7,142 7,142
Net Operating Income Gross Revenue $12,624,440 $0 $0 $0 $0 $1,647,570 $1,696,997 $1,747,907 $1,800,344 $1,854,354 $1,909,985 $1,967,284
General $5,128,005 $0 $0 $0 $0 $669,237 $689,314 $709,994 $731,294 $753,232 $775,829 $799,104 Restaurant $2,722,617 $0 $0 $0 $0 $355,319 $365,978 $376,958 $388,266 $399,914 $411,912 $424,269
Gym $3,233,877 $0 $0 $0 $0 $422,042 $434,703 $447,744 $461,176 $475,011 $489,262 $503,940 Movie Theater $1,539,941 $0 $0 $0 $0 $200,972 $207,001 $213,211 $219,608 $226,196 $232,982 $239,971
Rent (NNN) per s.f. #DIV/0! #DIV/0! #DIV/0! #DIV/0! $33 $34 $35 $36 $37 $38 $40 General $30.00 $30.00 $30.90 $31.83 $32.78 $33.77 $34.78 $35.82 $36.90 $38.00 $39.14 $40.32
Restaurant $34.00 $34.00 $35.02 $36.07 $37.15 $38.27 $39.42 $40.60 $41.82 $43.07 $44.36 $45.69 Gym $28.00 $28.00 $28.84 $29.71 $30.60 $31.51 $32.46 $33.43 $34.44 $35.47 $36.53 $37.63
Movie Theater $25.00 $25.00 $25.75 $26.52 $27.32 $28.14 $28.98 $29.85 $30.75 $31.67 $32.62 $33.60Vacancy & Credit Loss ($1,005,763) $0 $0 $0 $0 ($411,892) $0 $0 $0 $0 ($593,871) $0
General ($555,224) $0 $0 $0 $0 ($167,309) $0 $0 $0 $0 ($387,915) $0 Restaurant ($294,786) $0 $0 $0 $0 ($88,830) $0 $0 $0 $0 ($205,956) $0
Gym ($105,510) $0 $0 $0 $0 ($105,510) $0 $0 $0 $0 $0 $0 Movie Theater ($50,243) $0 $0 $0 $0 ($50,243) $0 $0 $0 $0 $0 $0
Vacancy & Credit Loss (%) General 25% 0% 0% 0% 0% 50% 0%
Restaurant 25% 0% 0% 0% 0% 50% 0% Gym 25% 0% 0% 0% 0% 0% 0%
Movie Theater 25% 0% 0% 0% 0% 0% 0%Operations & Maintenance Expenses ($720,032) $0 $0 $0 $0 ($93,969) ($96,788) ($99,691) ($102,682) ($105,763) ($108,936) ($112,204)
General ($220,175) $0 $0 $0 $0 ($28,734) ($29,596) ($30,484) ($31,399) ($32,341) ($33,311) ($34,310) Restaurant ($103,145) $0 $0 $0 $0 ($13,461) ($13,865) ($14,281) ($14,709) ($15,151) ($15,605) ($16,073)
Gym ($258,725) $0 $0 $0 $0 ($33,765) ($34,778) ($35,822) ($36,896) ($38,003) ($39,143) ($40,317) Movie Theater ($137,987) $0 $0 $0 $0 ($18,008) ($18,548) ($19,105) ($19,678) ($20,268) ($20,876) ($21,503)Expense per s.f. #DIV/0! #DIV/0! #DIV/0! #DIV/0! $1.69 $1.74 $1.79 $1.85 $1.90 $1.96 $2.02
General $1.15 $1.15 $1.18 $1.22 $1.26 $1.29 $1.33 $1.37 $1.41 $1.46 $1.50 $1.55 Restaurant $1.15 $1.15 $1.18 $1.22 $1.26 $1.29 $1.33 $1.37 $1.41 $1.46 $1.50 $1.55
Gym $2.00 $2.00 $2.06 $2.12 $2.19 $2.25 $2.32 $2.39 $2.46 $2.53 $2.61 $2.69 Movie Theater $2.00 $2.00 $2.06 $2.12 $2.19 $2.25 $2.32 $2.39 $2.46 $2.53 $2.61 $2.69
Net Operating Income $10,898,645 $0 $0 $0 $0 $1,141,709 $1,600,209 $1,648,215 $1,697,662 $1,748,592 $1,207,179 $1,855,081Development Costs
Built per year % 15.0% 15.0% 35.0% 35.0%Cost per year ($2,880,617) ($2,880,617) ($6,721,439) ($6,721,439) $0 $0 $0 $0 $0 $0 $0
Land Cost ($2,512,272) ($2,512,272) ($2,512,272)Site - Infrastructure $30 per SF @ 55,600 ($1,668,000)
Hard Costs + Soft Costs ($11,312,000) General $220 per SF @ 22,200 ($4,884,000)
Restaurant $220 per SF @ 10,400 ($2,288,000) Gym $180 per SF @ 15,000 ($2,700,000)
Movie Theater $180 per SF @ 8,000 ($1,440,000)Tenant Improvement ($4,558,000)
General $100 per SF @ 19,980 ($1,998,000) Restaurant $100 per SF @ 9,360 ($936,000)
Gym $80 per SF @ 13,500 ($1,080,000) Movie Theater $80 per SF @ 6,800 ($544,000)
Proportion of Open Space $0 per SF @ - $0Developers Fee
Other Fees $0WST 9.5% @ 17,538,000 ($1,666,110)
Total Development Costs ($21,716,382)Annual Cash Flow
Net Operating Income $0 $0 $0 $0 $1,141,709 $1,600,209 $1,648,215 $1,697,662 $1,748,592 $1,207,179 $1,855,081Asset Value 6.0% Exit Cap Rate $0 $0 $0 $0 $19,028,475 $26,670,150 $27,470,254 $28,294,362 $29,143,192 $20,119,645 $30,918,013
Transaction Cost 3.0% ($927,540)
Total Development Costs ($21,716,382) ($5,392,889) ($2,880,617) ($6,721,439) ($6,721,439) $0 $0 $0 $0 $0 $0 $0
Unleveraged Net Cash Flow $19,172,736 ($5,392,889) ($2,880,617) ($6,721,439) ($6,721,439) $1,141,709 $1,600,209 $1,648,215 $1,697,662 $1,748,592 $1,207,179 $31,845,553Finance/ Source 2.17 Average DSCR 1.59 2.23 2.29 2.36 2.43 1.68 2.58
Debt/ Service 3.5% $0 $0 ($215,134) ($466,719) ($718,553) ($718,553) ($718,553) ($718,553) ($718,553) ($718,553) ($718,553)Principal Repayment 30 years ($8,957) ($9,276) ($9,605) ($9,947) ($10,301) ($10,667) ($11,047)
Principal Repayment at exit ($13,265,042)Equity (Cash+Land) 55% $11,944,010 $5,392,889 $2,880,617 $789,889
(Cash Contribution) $6,551,122 $2,880,617 $2,880,617 $789,889Debt 45% $13,334,842 $6,146,684 $7,188,158
Equity (Cash + Land) $5,392,889 $8,273,505 $9,063,394 $9,063,394 $9,063,394 $9,063,394 $9,063,394 $9,063,394 $9,063,394 $9,063,394 $9,063,394Debt Amount $0 $0 $6,146,684 $13,334,842 $13,325,885 $13,316,609 $13,307,004 $13,297,057 $13,286,756 $13,276,089 $13,265,042
(Principal Payment Start) 1 13 25 37 49 61 73(Principal Payment End) 12 24 36 48 60 72 84
Return on EquityEquity Cash Flow ($5,392,889) ($2,880,617) ($789,889) $0 $423,156 $881,656 $929,662 $979,109 $1,030,039 $488,626 $17,861,958
Tax Concequences $0 $0 $0 $0 $0 $0 $0 $0 $0 $0 $0Total Benefit ($5,392,889) ($2,880,617) ($789,889) $0 $423,156 $881,656 $929,662 $979,109 $1,030,039 $488,626 $17,861,958
Cumulative Total Benefit ($5,392,889) ($8,273,505) ($9,063,394) ($9,063,394) ($8,640,238) ($7,758,582) ($6,828,919) ($5,849,810) ($4,819,772) ($4,331,146) $13,530,812
Operation
RETAIL
Included in the other items
Permiting & Planning Construction
Return Retail + Retail Parking Net Present Value 7% $10,422,922Cash on Cash Return per year 6.5% 13.5% 14.2% 14.9% 15.7% 7.5% 272.7%Cash on Cash Return on Project $13,530,812 113.29%Combined Net Cash Flow ($11,325,133) ($5,427,811) ($8,970,248) ($6,721,439) $2,272,928 $3,924,261 $4,041,989 $4,163,248 $4,288,146 $3,822,920 $67,207,101Unleveraged IRR Before Taxes 14.1%Combined Equity Cash Flow ($11,325,133) ($5,427,811) ($789,889) $0 $1,424,248 $3,075,581 $3,193,309 $3,314,568 $3,439,466 $2,974,239 $50,691,125Leveraged IRR Before Taxes 17.2%
2013 2014 2015 2016 2017 2018 2019 2020 2021 2022 2023Sources
EquityLand $2,512,272 $0 $0 $0 $0 $0 $0 $0 $0 $0 $0Cash $2,880,617 $2,880,617 $789,889 $0 $0 $0 $0 $0 $0 $0 $0
Debt $0 $0 $6,146,684 $7,188,158 $0 $0 $0 $0 $0 $0 $0NOI $0 $0 $0 $0 $1,141,709 $1,600,209 $1,648,215 $1,697,662 $1,748,592 $1,207,179 $1,855,081Sale $0 $0 $0 $0 $0 $0 $0 $0 $0 $0 $29,990,473
TOTAL $5,392,889 $2,880,617 $6,936,572 $7,188,158 $1,141,709 $1,600,209 $1,648,215 $1,697,662 $1,748,592 $1,207,179 $31,845,553Uses
Development Cost $5,392,889 $2,880,617 $6,721,439 $6,721,439 $0 $0 $0 $0 $0 $0 $0Debt Service $0 $0 $215,134 $466,719 $718,553 $718,553 $718,553 $718,553 $718,553 $718,553 $718,553Principal Repayment $13,265,042Return on Equity $0 $423,156 $881,656 $929,662 $979,109 $1,030,039 $488,626 $17,861,958
TOTAL $5,392,889 $2,880,617 $6,936,572 $7,188,158 $1,141,709 $1,600,209 $1,648,215 $1,697,662 $1,748,592 $1,207,179 $31,845,553$0 $0 $0 $0 $0 $0 $0 $0 $0 $0 $0
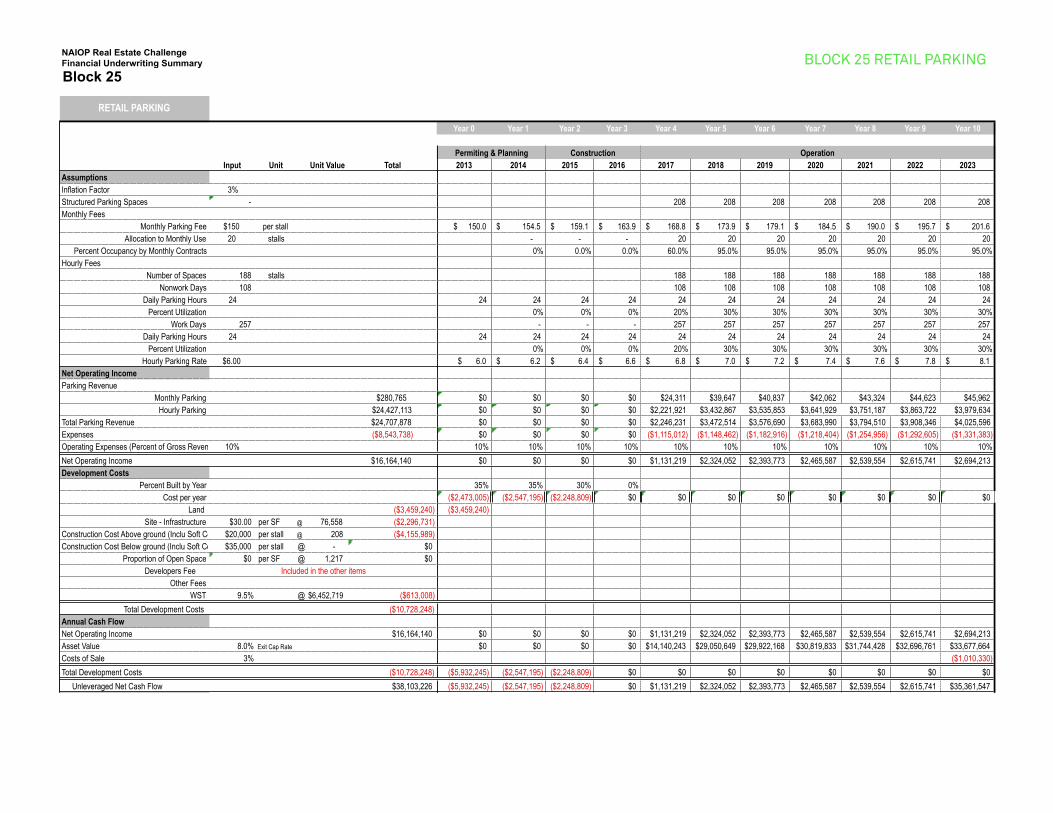
NAIOP Real Estate Challenge
Block 25
Total Condominium Hotel Retail Retail Parking Open SpaceDESIGN ASSUMPTIONS
GROSS SF 553,284 220,500 116,000 55,600 161,184 0Efficiency Factor 81% 80% 65% 89% 95% 100% RENTABLE SF 446,565 176,400 67,400 49,640 153,125 0Average Unit SF NA 1,200 400 NA 350 NA
PARKING STALLS 437 1 per Unit 50% of Occupancy NAExclude: For sale and hotel gurst spaces
COST ASSUMPTIONS LAND VALUE PER DEVELOPMENT UNIT $45/NSF $86,089/Unit $37,937/Unit $51/NSF $23/NSF NA
SITE - INFRASTRUCTURE ( $ / SF OF SITE ) $30 $30 $30 $30 $30 $0HARD COSTS + SOFT COSTS ( $ / Gross SF ) NA $460 $240 General: $220/SF
Restaurant: $220/SFGym: $180/SFMovie: $180/SF
See Below Parking Cost NA
TENANT IMPROVEMENT ($ / Net SF ) NA Included Building Shell Included Building Shell General: $100/SFRestaurant: $100/SF
Gym: $80/SFMovie: $80/SF
Included Parking Bld Cost NA
PARKING ABOVE GRADE ($ / STALL) $20,000 / Stall (350 SF per stall)PARKING BELOW GRADE ($ / STALL) $35,000 / Stall (350 SF per stall)
BASE YR. OPERATING EXPENSES ( $ / Gross SF / YR ) NA Cost of Sales: 3% of sales revenue
Expense Rate: 80% of total revenue
General: $1.15/SFRestaurant: $1.15/SF
Gym: $2.0/SFMovie: $2.0/SF
10% Gross Revenue NA
Upscale/Luxyry
INCOME ASSUMPTIONSRENTAL INCOME ( $ / Net SF / MO )
NA NA NA
General: $30/SFRestaurant: $34/SF
Gym: $28/SFMovie: $25/SF
See below Parking Income NASALE INCOME ( $ / USABLE SF ) NA $1,200k/Unit Rev PAR$165 NAPARKING INCOME ( $ / SF / MO )
NA$50k/Unit $25k/Unit
See Parking SectionMonthly Parking Fee: $150Hourly Parking Rate: $5.0 NA
VALUE ASSUMPTIONDiscount Rate 8.00% 8.00% 8.00% 7.00% 8.00% NA
Exit Capitalization Rate NA NA 6.00% 6.00% 8.00% NAVALUE per NSF ( NPV / NSF ) $99.5 $104.2 $232.0 NA
NPV $44,432,338 $18,372,145 $15,637,270 NAUnleveraged IRR Before Taxes 0.0% 12.7% 11.1% NA
Leveraged IRR Before Taxes 16.9% 18.0% 17.2% NA
DEBT ASSUMPTIONSLOAN TO VALUE 67% 65% 54% 45% 21% NA
Average DEBT SERVICE COVERAGE 8.06 0.00 2.79 2.17 17.75 NATOTAL DEBT $151,968,399 $108,151,924 $28,066,740 $13,334,842 $2,414,893 NA
TOTAL EQUITY(Inclu Land) $75,925,070 $38,202,431 $20,179,807 $9,063,394 $8,479,439 NA
Financial Underwriting Summary
$10,422,922$85.2
14.1%17.2%
Total 208 lots, (3.2 per 1,000 SF)
Hard Cost + Soft Cost NotesExcludes 9.5% Washington State Sales TaxAssumes 2013 pricingConstruction Costs assume Leed Silver certificationIncluded 10% contingency
BLOCK 25 RETAIL PARKING
Year 0 Year 1 Year 2 Year 3 Year 4 Year 5 Year 6 Year 7 Year 8 Year 9 Year 10Year 0 Year 1 Year 2 Year 3 Year 4 Year 5 Year 6 Year 7 Year 8 Year 9 Year 10
Input Unit Unit Value Total 2013 2014 2015 2016 2017 2018 2019 2020 2021 2022 2023AssumptionsInflation Factor 3%Structured Parking Spaces - 208 208 208 208 208 208 208Monthly Fees
Monthly Parking Fee $150 per stall 150.0$ 154.5$ 159.1$ 163.9$ 168.8$ 173.9$ 179.1$ 184.5$ 190.0$ 195.7$ 201.6$ Allocation to Monthly Use 20 stalls - - - 20 20 20 20 20 20 20
Percent Occupancy by Monthly Contracts 0% 0.0% 0.0% 60.0% 95.0% 95.0% 95.0% 95.0% 95.0% 95.0%Hourly Fees
Number of Spaces 188 stalls 188 188 188 188 188 188 188 Nonwork Days 108 108 108 108 108 108 108 108
Daily Parking Hours 24 24 24 24 24 24 24 24 24 24 24 24 Percent Utilization 0% 0% 0% 20% 30% 30% 30% 30% 30% 30%
Work Days 257 - - - 257 257 257 257 257 257 257 Daily Parking Hours 24 24 24 24 24 24 24 24 24 24 24 24
Percent Utilization 0% 0% 0% 20% 30% 30% 30% 30% 30% 30%Hourly Parking Rate $6.00 6.0$ 6.2$ 6.4$ 6.6$ 6.8$ 7.0$ 7.2$ 7.4$ 7.6$ 7.8$ 8.1$
Net Operating IncomeParking Revenue
Monthly Parking $280,765 $0 $0 $0 $0 $24,311 $39,647 $40,837 $42,062 $43,324 $44,623 $45,962Hourly Parking $24,427,113 $0 $0 $0 $0 $2,221,921 $3,432,867 $3,535,853 $3,641,929 $3,751,187 $3,863,722 $3,979,634
Total Parking Revenue $24,707,878 $0 $0 $0 $0 $2,246,231 $3,472,514 $3,576,690 $3,683,990 $3,794,510 $3,908,346 $4,025,596Expenses ($8,543,738) $0 $0 $0 $0 ($1,115,012) ($1,148,462) ($1,182,916) ($1,218,404) ($1,254,956) ($1,292,605) ($1,331,383)Operating Expenses (Percent of Gross Revenue) 10% 10% 10% 10% 10% 10% 10% 10% 10% 10% 10% 10%
Net Operating Income $16,164,140 $0 $0 $0 $0 $1,131,219 $2,324,052 $2,393,773 $2,465,587 $2,539,554 $2,615,741 $2,694,213Development Costs
Percent Built by Year 35% 35% 30% 0%Cost per year ($2,473,005) ($2,547,195) ($2,248,809) $0 $0 $0 $0 $0 $0 $0 $0
Land ($3,459,240) ($3,459,240)Site - Infrastructure $30.00 per SF @ 76,558 ($2,296,731)
Construction Cost Above ground (Inclu Soft Cost) $20,000 per stall @ 208 ($4,155,989)Construction Cost Below ground (Inclu Soft Cost) $35,000 per stall @ - $0
Proportion of Open Space $0 per SF @ 1,217 $0Developers Fee
Other FeesWST 9.5% @ $6,452,719 ($613,008)
Total Development Costs ($10,728,248)Annual Cash FlowNet Operating Income $16,164,140 $0 $0 $0 $0 $1,131,219 $2,324,052 $2,393,773 $2,465,587 $2,539,554 $2,615,741 $2,694,213Asset Value 8.0% Exit Cap Rate $0 $0 $0 $0 $14,140,243 $29,050,649 $29,922,168 $30,819,833 $31,744,428 $32,696,761 $33,677,664Costs of Sale 3% ($1,010,330)
Total Development Costs ($10,728,248) ($5,932,245) ($2,547,195) ($2,248,809) $0 $0 $0 $0 $0 $0 $0 $0
Unleveraged Net Cash Flow $38,103,226 ($5,932,245) ($2,547,195) ($2,248,809) $0 $1,131,219 $2,324,052 $2,393,773 $2,465,587 $2,539,554 $2,615,741 $35,361,547Finance/ Source 17.7 Average DSCR 8.7 17.9 18.4 18.9 19.5 20.1 20.7
Debt/ Service 3.5% $0 $0 ($81,563) ($84,521) ($130,127) ($130,127) ($130,127) ($130,127) ($130,127) ($130,127) ($130,127)Principal Repayment 30 years ($1,622) ($1,680) ($1,740) ($1,801) ($1,865) ($1,932) ($2,001)
Principal Repayment at exit ($2,402,253)Equity (Cash+Land) 79% $8,479,439 $5,932,245 $2,547,195
(Cash Contribution) $5,020,199 $2,473,005 $2,547,195Debt 21% $2,414,893 $2,330,372 $84,521
Equity Amount $5,932,245 $8,479,439 $8,479,439 $8,479,439 $8,479,439 $8,479,439 $8,479,439 $8,479,439 $8,479,439 $8,479,439 $8,479,439Debt Amount $0 $0 $2,330,372 $2,414,893 $2,413,271 $2,411,592 $2,409,852 $2,408,051 $2,406,185 $2,404,253 $2,402,253
(Principal Payment Start) 1 13 25 37 49 61 73(Principal Payment End) 12 24 36 48 60 72 84
Return on EquityEquity Cash Flow ($5,932,245) ($2,547,195) $0 $0 $1,001,092 $2,193,925 $2,263,646 $2,335,459 $2,409,427 $2,485,613 $32,829,167
Tax Concequences $0 $0 $0 $0 $0 $0 $0 $0 $0 $0 $0Total Benefit ($5,932,245) ($2,547,195) $0 $0 $1,001,092 $2,193,925 $2,263,646 $2,335,459 $2,409,427 $2,485,613 $32,829,167
Cumulative Total Benefit ($5,932,245) ($8,479,439) ($8,479,439) ($8,479,439) ($7,478,347) ($5,284,423) ($3,020,777) ($685,317) $1,724,109 $4,209,723 $37,038,890
Net Present Value 8% $13,406,335Cash on Cash Return per year 11.8% 25.9% 26.7% 27.5% 28.4% 29.3% 387.2%Cash on Cash Return on Project $37,038,890 436.81%Unleveraged IRR Before Taxes 20.3%Leveraged IRR Before Taxes 21.8%
2013 2014 2015 2016 2017 2018 2019 2020 2021 2022 2023Sources
EquityLand $3,459,240 $0 $0 $0 $0 $0 $0 $0 $0 $0 $0Cash $2,473,005 $2,547,195 $0 $0 $0 $0 $0 $0 $0 $0 $0
Debt $0 $0 $2,330,372 $84,521 $0 $0 $0 $0 $0 $0 $0NOI $0 $0 $0 $0 $1,131,219 $2,324,052 $2,393,773 $2,465,587 $2,539,554 $2,615,741 $2,694,213Sale $0 $0 $0 $0 $0 $0 $0 $0 $0 $0 $32,667,334
TOTAL $5,932,245 $2,547,195 $2,330,372 $84,521 $1,131,219 $2,324,052 $2,393,773 $2,465,587 $2,539,554 $2,615,741 $35,361,547Uses
Development Cost $5,932,245 $2,547,195 $2,248,809 $0 $0 $0 $0 $0 $0 $0 $0Debt Service $0 $0 $81,563 $84,521 $130,127 $130,127 $130,127 $130,127 $130,127 $130,127 $130,127Principal Repayment $2,402,253Return on Equity $0 $1,001,092 $2,193,925 $2,263,646 $2,335,459 $2,409,427 $2,485,613 $32,829,167
TOTAL $5,932,245 $2,547,195 $2,330,372 $84,521 $1,131,219 $2,324,052 $2,393,773 $2,465,587 $2,539,554 $2,615,741 $35,361,547$0 $0 $0 $0 $0 $0 $0 $0 $0 $0 $0
Because of Land Value contribution
Permiting & Planning Construction Operation
RETAIL PARKING
Included in the other items
Because of Equity %

South Lake Union Growth Trends
Seattle Age Distribution Seattle Population by Neighborhood
Appendix: Market Data