Embed Size (px)
Citation preview
C101-E169
UV-VIS Spectrophotometer
UV-2600iUV-2700i
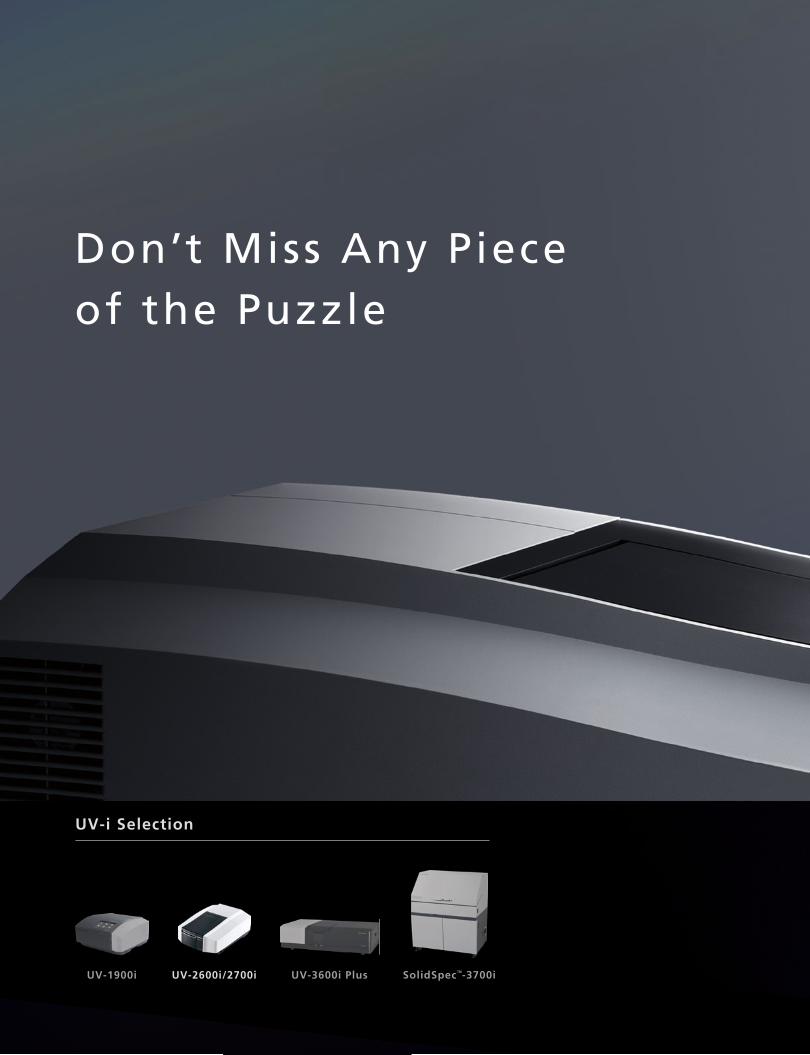
Don’t Miss Any Pieceof the Puzzle
UV-i Selection
UV-1900i UV-2600i/2700i UV-3600i Plus SolidSpec™-3700i
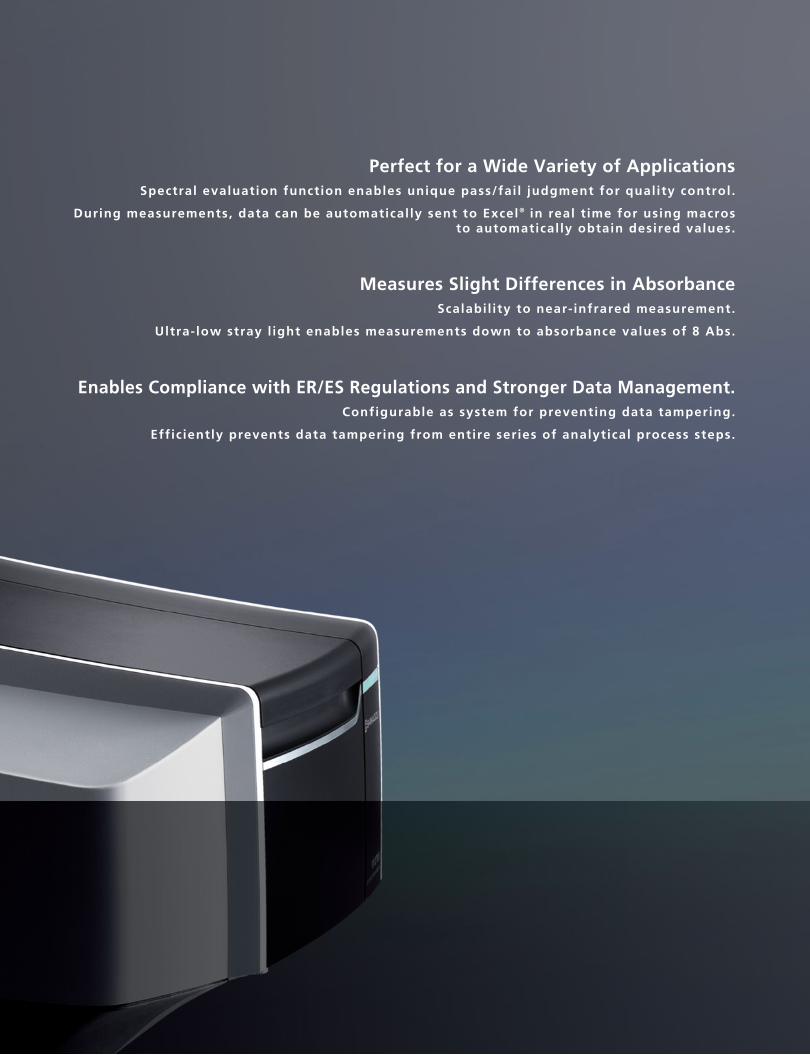
Perfect for a Wide Variety of ApplicationsSpectral evaluation function enables unique pass/fai l judgment for quality control.
During measurements, data can be automatical ly sent to Excel® in real t ime for using macrosto automatical ly obtain desired values.
Measures Slight Differences in AbsorbanceScalabil ity to near-infrared measurement.
Ultra-low stray l ight enables measurements down to absorbance values of 8 Abs.
Enables Compliance with ER/ES Regulations and Stronger Data Management.Configurable as system for preventing data tampering.
Efficiently prevents data tampering from entire series of analytical process steps.
Single monochromator UV-2600iDouble monochromator UV-2700i
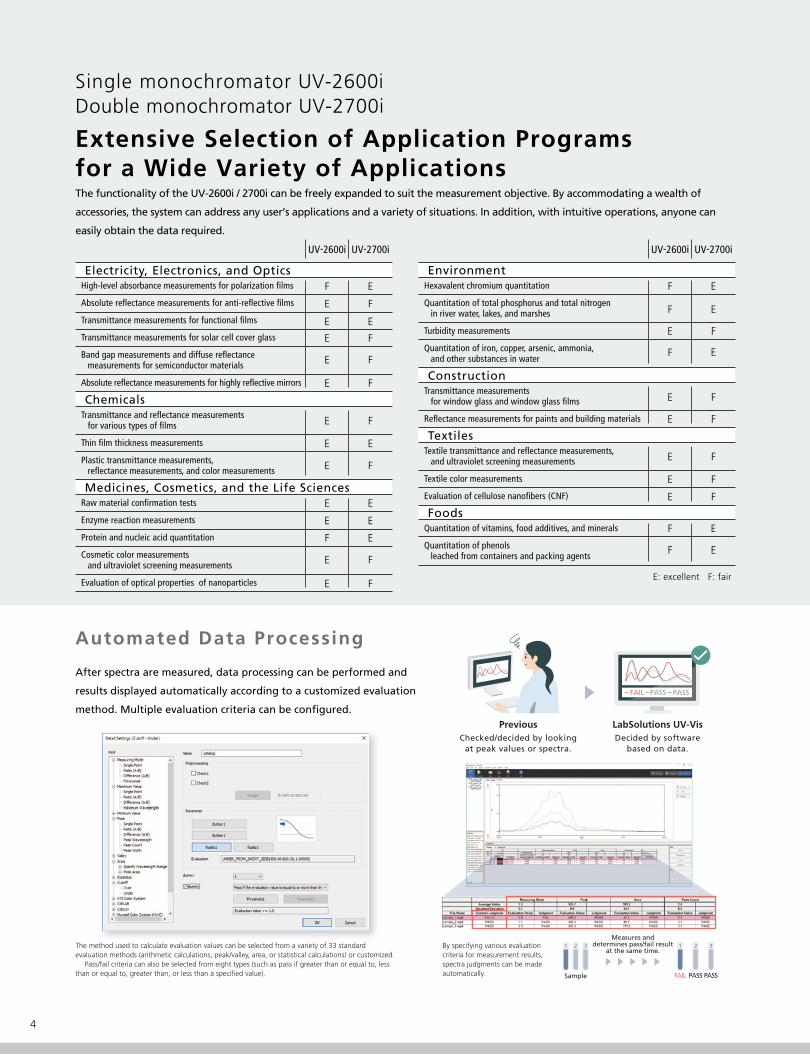
Extensive Selection of Application Programs for a Wide Variety of ApplicationsThe functionality of the UV-2600i / 2700i can be freely expanded to suit the measurement objective. By accommodating a wealth of
accessories, the system can address any user’s applications and a variety of situations. In addition, with intuitive operations, anyone can
easily obtain the data required.
Electricity, Electronics, and OpticsHigh-level absorbance measurements for polarization films
Absolute reflectance measurements for anti-reflective films
Transmittance measurements for functional films
Transmittance measurements for solar cell cover glass
Band gap measurements and diffuse reflectancemeasurements for semiconductor materials
Absolute reflectance measurements for highly reflective mirrors
ChemicalsTransmittance and reflectance measurements
for various types of films
Thin film thickness measurements
Plastic transmittance measurements,reflectance measurements, and color measurements
Medicines, Cosmetics, and the Life SciencesRaw material confirmation tests
Enzyme reaction measurements
Protein and nucleic acid quantitation
Cosmetic color measurementsand ultraviolet screening measurements
Evaluation of optical properties of nanoparticles
UV-2600i UV-2700i
F E
E F
E E
E F
E F
E F
E F
E E
E F
E E
E E
F E
E F
E F
EnvironmentHexavalent chromium quantitation
Quantitation of total phosphorus and total nitrogenin river water, lakes, and marshes
Turbidity measurements
Quantitation of iron, copper, arsenic, ammonia,and other substances in water
ConstructionTransmittance measurements
for window glass and window glass films
Reflectance measurements for paints and building materials
TextilesTextile transmittance and reflectance measurements,
and ultraviolet screening measurements
Textile color measurements
Evaluation of cellulose nanofibers (CNF)
FoodsQuantitation of vitamins, food additives, and minerals
Quantitation of phenolsleached from containers and packing agents
UV-2600i UV-2700i
F E
F E
E F
F E
E F
E F
E F
E F
E F
F E
F E
E: excellent F: fair
Automated Data Processing
After spectra are measured, data processing can be performed and
results displayed automatically according to a customized evaluation
method. Multiple evaluation criteria can be configured.
The method used to calculate evaluation values can be selected from a variety of 33 standard evaluation methods (arithmetic calculations, peak/valley, area, or statistical calculations) or customized.
Pass/fail criteria can also be selected from eight types (such as pass if greater than or equal to, less than or equal to, greater than, or less than a speci�ed value).
1 2 3
Sample
Measures anddetermines pass/fail result
at the same time.1 2 3
PASSFAIL PASS
By specifying various evaluation criteria for measurement results, spectra judgments can be made automatically.
Decided by softwarebased on data.
LabSolutions UV-VisPreviousChecked/decided by looking
at peak values or spectra.
4
Band Gap Measurements forSemiconductors
Electricity, Electronics,and Optics
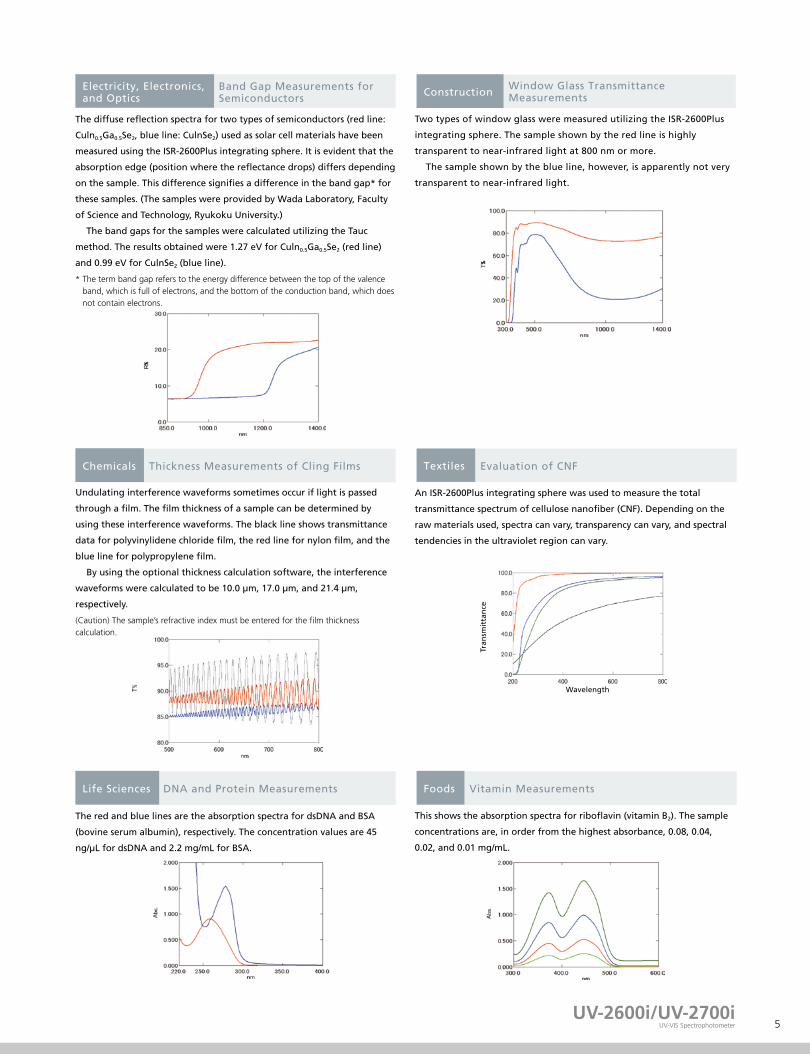
The diffuse re�ection spectra for two types of semiconductors (red line:
Culn0.5Ga0.5Se2, blue line: CulnSe2) used as solar cell materials have been
measured using the ISR-2600Plus integrating sphere. It is evident that the
absorption edge (position where the re�ectance drops) differs depending
on the sample. This difference signi�es a difference in the band gap* for
these samples. (The samples were provided by Wada Laboratory, Faculty
of Science and Technology, Ryukoku University.)
The band gaps for the samples were calculated utilizing the Tauc
method. The results obtained were 1.27 eV for Culn0.5Ga0.5Se2 (red line)
and 0.99 eV for CulnSe2 (blue line).
* The term band gap refers to the energy difference between the top of the valence band, which is full of electrons, and the bottom of the conduction band, which does not contain electrons.
Chemicals Thickness Measurements of Cling Films
Undulating interference waveforms sometimes occur if light is passed
through a �lm. The �lm thickness of a sample can be determined by
using these interference waveforms. The black line shows transmittance
data for polyvinylidene chloride �lm, the red line for nylon �lm, and the
blue line for polypropylene �lm.
By using the optional thickness calculation software, the interference
waveforms were calculated to be 10.0 μm, 17.0 μm, and 21.4 μm,
respectively.
(Caution) The sample’s refractive index must be entered for the �lm thickness calculation.
Life Sciences DNA and Protein Measurements
The red and blue lines are the absorption spectra for dsDNA and BSA
(bovine serum albumin), respectively. The concentration values are 45
ng/μL for dsDNA and 2.2 mg/mL for BSA.
ConstructionWindow Glass TransmittanceMeasurements
Two types of window glass were measured utilizing the ISR-2600Plus
integrating sphere. The sample shown by the red line is highly
transparent to near-infrared light at 800 nm or more.
The sample shown by the blue line, however, is apparently not very
transparent to near-infrared light.
Textiles Evaluation of CNF
An ISR-2600Plus integrating sphere was used to measure the total
transmittance spectrum of cellulose nano�ber (CNF). Depending on the
raw materials used, spectra can vary, transparency can vary, and spectral
tendencies in the ultraviolet region can vary.
Tran
smit
tan
ce
Wavelength
Foods Vitamin Measurements
This shows the absorption spectra for ribo�avin (vitamin B2). The sample
concentrations are, in order from the highest absorbance, 0.08, 0.04,
0.02, and 0.01 mg/mL.
UV-2600i/UV-2700iUV-VIS Spectrophotometer 5
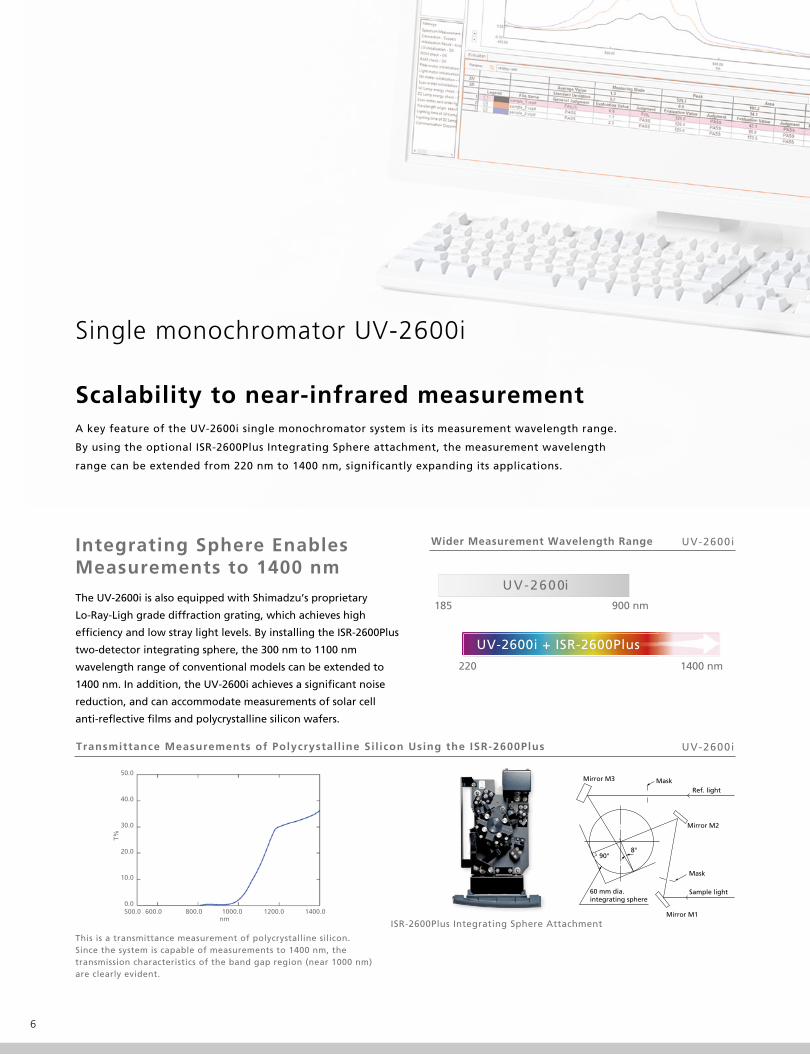
Single monochromator UV-2600i
Scalability to near-infrared measurementA key feature of the UV-2600i single monochromator system is its measurement wavelength range.
By using the optional ISR-2600Plus Integrating Sphere attachment, the measurement wavelength
range can be extended from 220 nm to 1400 nm, significantly expanding its applications.
Integrating Sphere EnablesMeasurements to 1400 nm
The UV-2600i is also equipped with Shimadzu’s proprietary
Lo-Ray-Ligh grade diffraction grating, which achieves high
efficiency and low stray light levels. By installing the ISR-2600Plus
two-detector integrating sphere, the 300 nm to 1100 nm
wavelength range of conventional models can be extended to
1400 nm. In addition, the UV-2600i achieves a significant noise
reduction, and can accommodate measurements of solar cell
anti-reflective films and polycrystalline silicon wafers.
Wider Measurement Wavelength Range UV-2600i
UV-2600i185 900 nm
UV-2600i + ISR-2600Plus
220 1400 nm
UV-2600iTransmittance Measurements of Polycrystal l ine Si l icon Using the ISR-2600Plus
T%
50.0
40.0
30.0
20.0
10.0
0.0500.0 600.0 800.0 1000.0 1200.0 1400.0
nm
This is a transmittance measurement of polycrystalline silicon. Since the system is capable of measurements to 1400 nm, the transmission characteristics of the band gap region (near 1000 nm) are clearly evident.
Ref. lightMask
Mask
Mirror M3
Mirror M2
Mirror M1
Sample light
8°90°
60 mm dia.integrating sphere
ISR-2600Plus Integrating Sphere Attachment
6
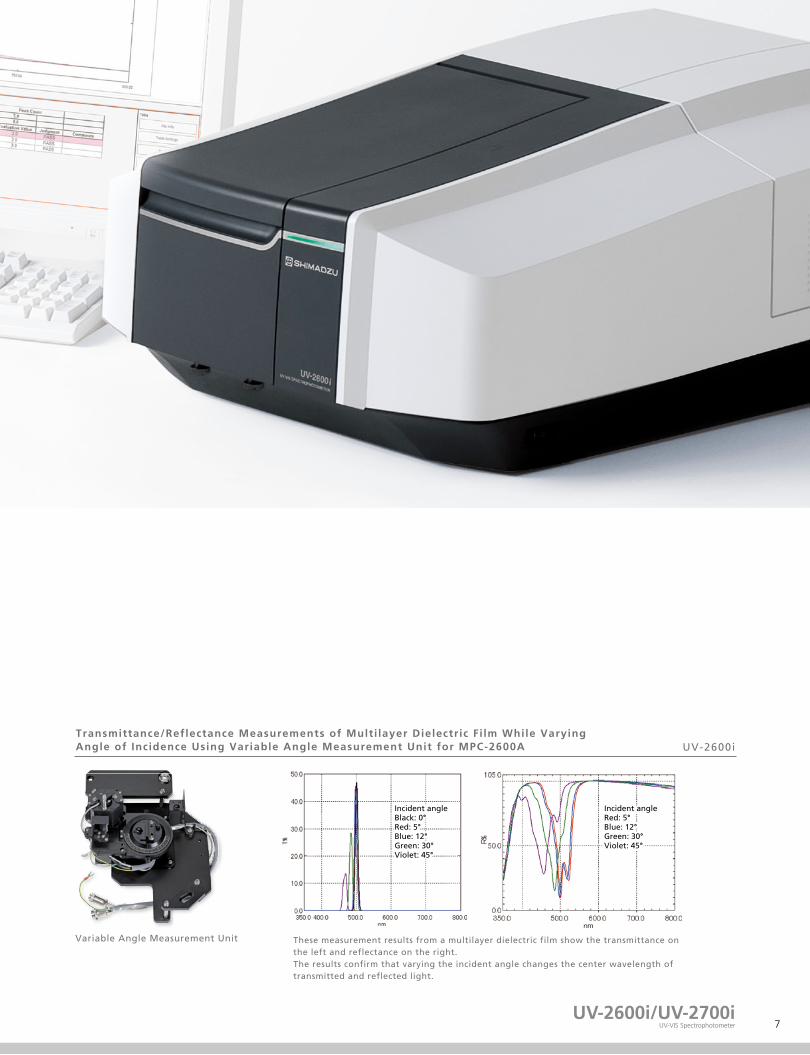
These measurement results from a multilayer dielectric film show the transmittance on the left and reflectance on the right.The results confirm that varying the incident angle changes the center wavelength of transmitted and reflected light.
UV-2600iTransmittance/Reflectance Measurements of Multi layer Dielectric Fi lm While VaryingAngle of Incidence Using Variable Angle Measurement Unit for MPC-2600A
Incident angleBlack: 0°Red: 5°Blue: 12°Green: 30°Violet: 45°
Incident angleBlack: 0°Red: 5°Blue: 12°Green: 30°Violet: 45°
Incident angleRed: 5°Blue: 12°Green: 30°Violet: 45°
Incident angleRed: 5°Blue: 12°Green: 30°Violet: 45°
Variable Angle Measurement Unit
UV-2600i/UV-2700iUV-VIS Spectrophotometer 7
Lo-Ray-Ligh grade diffraction grating
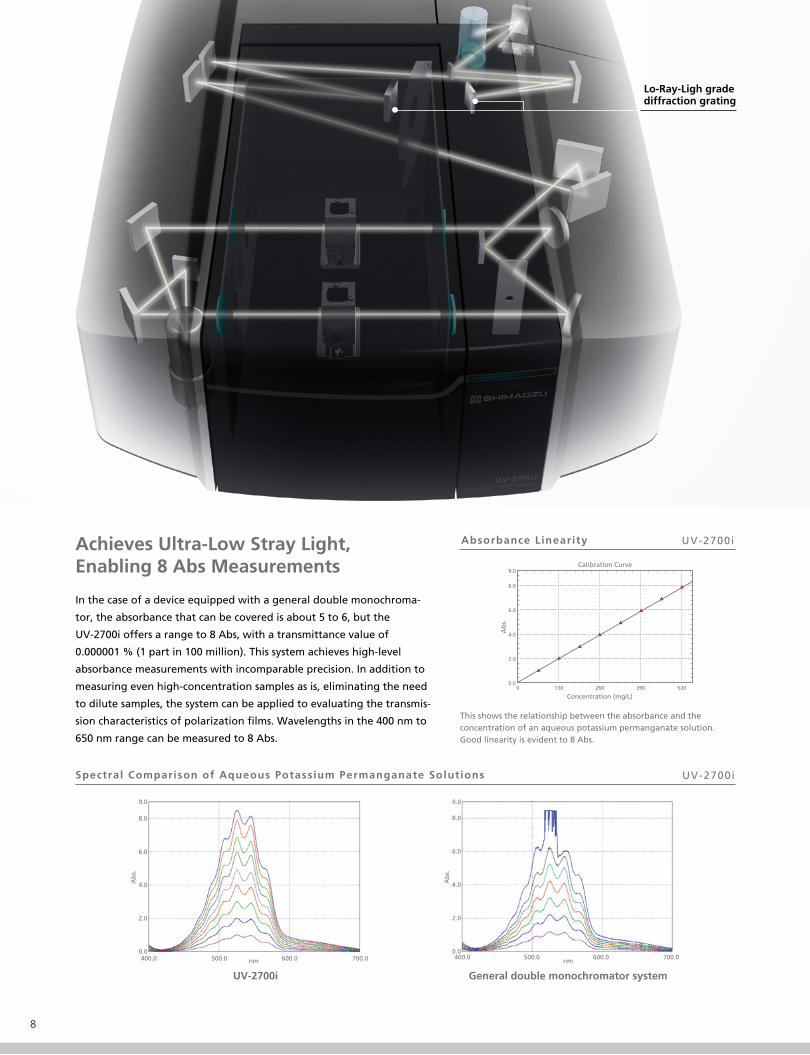
Achieves Ultra-Low Stray Light,Enabling 8 Abs Measurements
In the case of a device equipped with a general double monochroma-
tor, the absorbance that can be covered is about 5 to 6, but the
UV-2700i offers a range to 8 Abs, with a transmittance value of
0.000001 % (1 part in 100 million). This system achieves high-level
absorbance measurements with incomparable precision. In addition to
measuring even high-concentration samples as is, eliminating the need
to dilute samples, the system can be applied to evaluating the transmis-
sion characteristics of polarization films. Wavelengths in the 400 nm to
650 nm range can be measured to 8 Abs.
Absorbance Linearity UV-2700i
Calibration Curve
Ab
s.
9.0
8.0
6.0
4.0
2.0
0.00 130 260 390 520
Concentration (mg/L)
This shows the relationship between the absorbance and the concentration of an aqueous potassium permanganate solution. Good linearity is evident to 8 Abs.
Spectral Comparison of Aqueous Potassium Permanganate Solutions UV-2700i
Ab
s.
9.0
8.0
6.0
4.0
2.0
0.0400.0 500.0 nm 600.0 700.0
UV-2700i
9.0
8.0
6.0
4.0Ab
s.
2.0
0.0400.0 500.0 nm 600.0 700.0
General double monochromator system
8
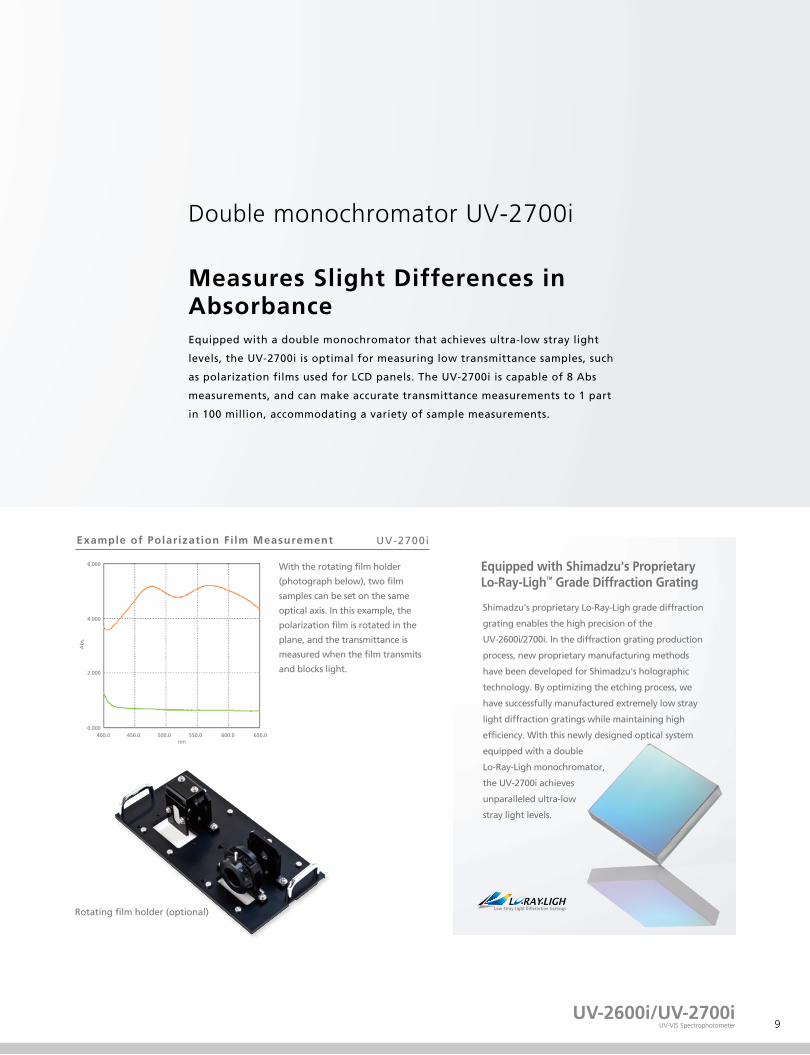
Double monochromator UV-2700i
Measures Slight Differences inAbsorbanceEquipped with a double monochromator that achieves ultra-low stray light
levels, the UV-2700i is optimal for measuring low transmittance samples, such
as polarization films used for LCD panels. The UV-2700i is capable of 8 Abs
measurements, and can make accurate transmittance measurements to 1 part
in 100 million, accommodating a variety of sample measurements.
Example of Polarization Fi lm Measurement UV-2700i
Ab
s.
6.000
4.000
2.000
0.000400.0 450.0 500.0 550.0 600.0 650.0
nm
With the rotating film holder
(photograph below), two film
samples can be set on the same
optical axis. In this example, the
polarization film is rotated in the
plane, and the transmittance is
measured when the film transmits
and blocks light.
Rotating film holder (optional)
Equipped with Shimadzu's ProprietaryLo-Ray-Ligh™ Grade Diffraction Grating
Shimadzu's proprietary Lo-Ray-Ligh grade diffraction
grating enables the high precision of the
UV-2600i/2700i. In the diffraction grating production
process, new proprietary manufacturing methods
have been developed for Shimadzu's holographic
technology. By optimizing the etching process, we
have successfully manufactured extremely low stray
light diffraction gratings while maintaining high
efficiency. With this newly designed optical system
equipped with a double
Lo-Ray-Ligh monochromator,
the UV-2700i achieves
unparalleled ultra-low
stray light levels.
UV-2600i/UV-2700iUV-VIS Spectrophotometer 9
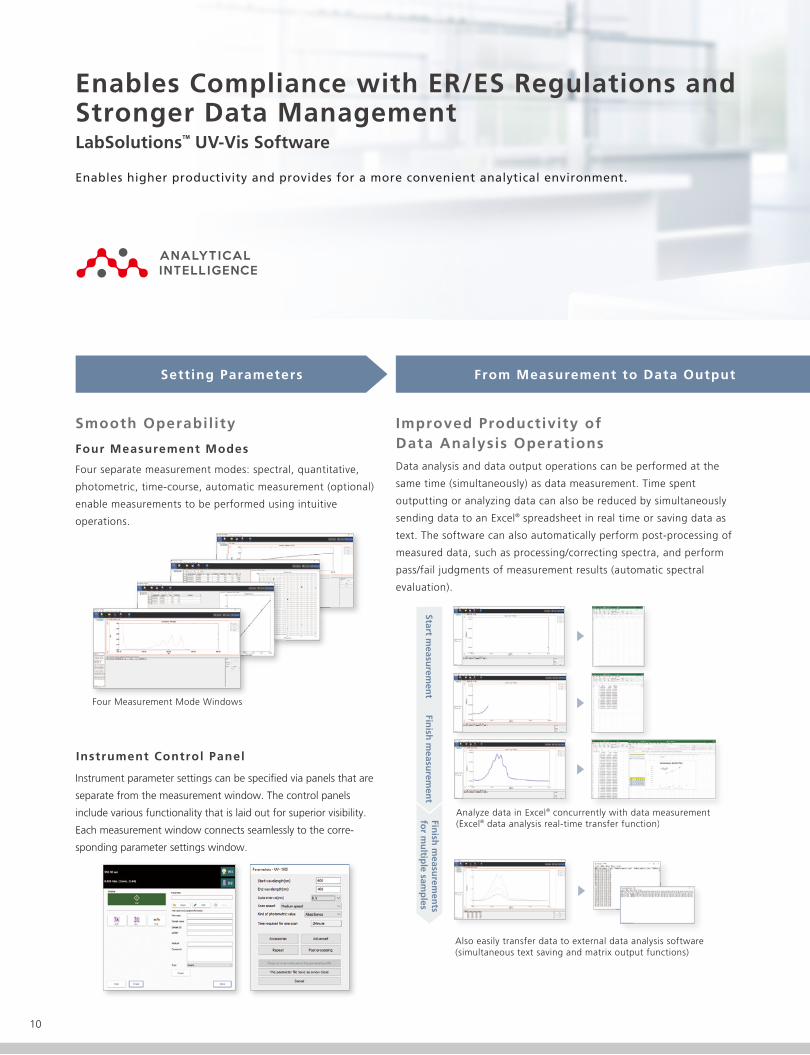
Enables Compliance with ER/ES Regulations andStronger Data ManagementLabSolutions™ UV-Vis Software
Enables higher productivity and provides for a more convenient analytical environment.
Setting Parameters
Smooth Operabil ity
Four Measurement Modes
Four separate measurement modes: spectral, quantitative,
photometric, time-course, automatic measurement (optional)
enable measurements to be performed using intuitive
operations.
Four Measurement Mode Windows
Instrument Control Panel
Instrument parameter settings can be speci�ed via panels that are
separate from the measurement window. The control panels
include various functionality that is laid out for superior visibility.
Each measurement window connects seamlessly to the corre-
sponding parameter settings window.
From Measurement to Data Output
Improved Productivity ofData Analysis OperationsData analysis and data output operations can be performed at the
same time (simultaneously) as data measurement. Time spent
outputting or analyzing data can also be reduced by simultaneously
sending data to an Excel® spreadsheet in real time or saving data as
text. The software can also automatically perform post-processing of
measured data, such as processing/correcting spectra, and perform
pass/fail judgments of measurement results (automatic spectral
evaluation).
Also easily transfer data to external data analysis software (simultaneous text saving and matrix output functions)
Analyze data in Excel® concurrently with data measurement(Excel® data analysis real-time transfer function)
Start measu
remen
tFin
ish m
easurem
ent
Finish
measu
remen
tsfo
r mu
ltiple sam
ples
Analyze data in Excel® concu ently with data measurementtransfer function)
10
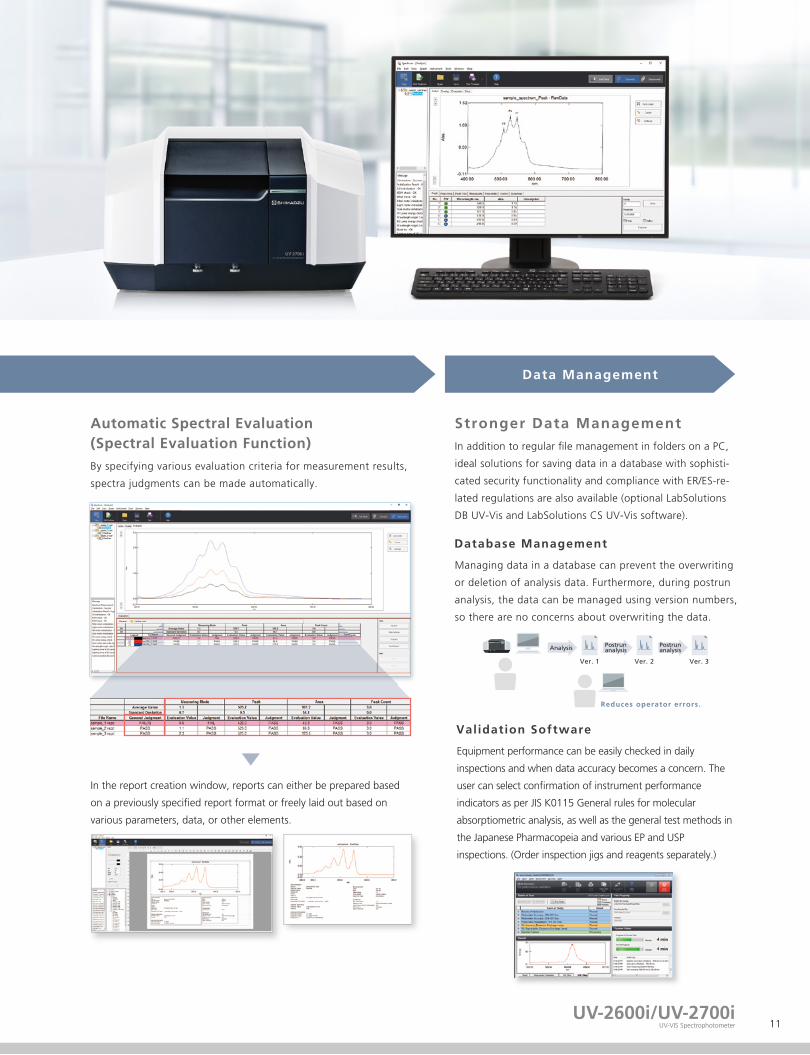
By specifying various evaluation criteria for measurement results,
spectra judgments can be made automatically.
Automatic Spectral Evaluation(Spectral Evaluation Function)
In the report creation window, reports can either be prepared based
on a previously speci�ed report format or freely laid out based on
various parameters, data, or other elements.
Stronger Data ManagementIn addition to regular �le management in folders on a PC,
ideal solutions for saving data in a database with sophisti-
cated security functionality and compliance with ER/ES-re-
lated regulations are also available (optional LabSolutions
DB UV-Vis and LabSolutions CS UV-Vis software).
Database Management
Managing data in a database can prevent the overwriting
or deletion of analysis data. Furthermore, during postrun
analysis, the data can be managed using version numbers,
so there are no concerns about overwriting the data.
Data Management
Ver. 1 Ver. 2 Ver. 3
Reduces operator errors.
Analysis Postrunanalysis
Postrunanalysis
Validation Software
Equipment performance can be easily checked in daily
inspections and when data accuracy becomes a concern. The
user can select con�rmation of instrument performance
indicators as per JIS K0115 General rules for molecular
absorptiometric analysis, as well as the general test methods in
the Japanese Pharmacopeia and various EP and USP
inspections. (Order inspection jigs and reagents separately.)
UV-2600i/UV-2700iUV-VIS Spectrophotometer 11
Stronger Data ManagementComprehensive DataIntegrity Compliance
The system enables full compliance with data integrity
requirements, not only for chromatography equipment,
but also UV-VIS spectrophotometers and other spectral
analysis instruments.
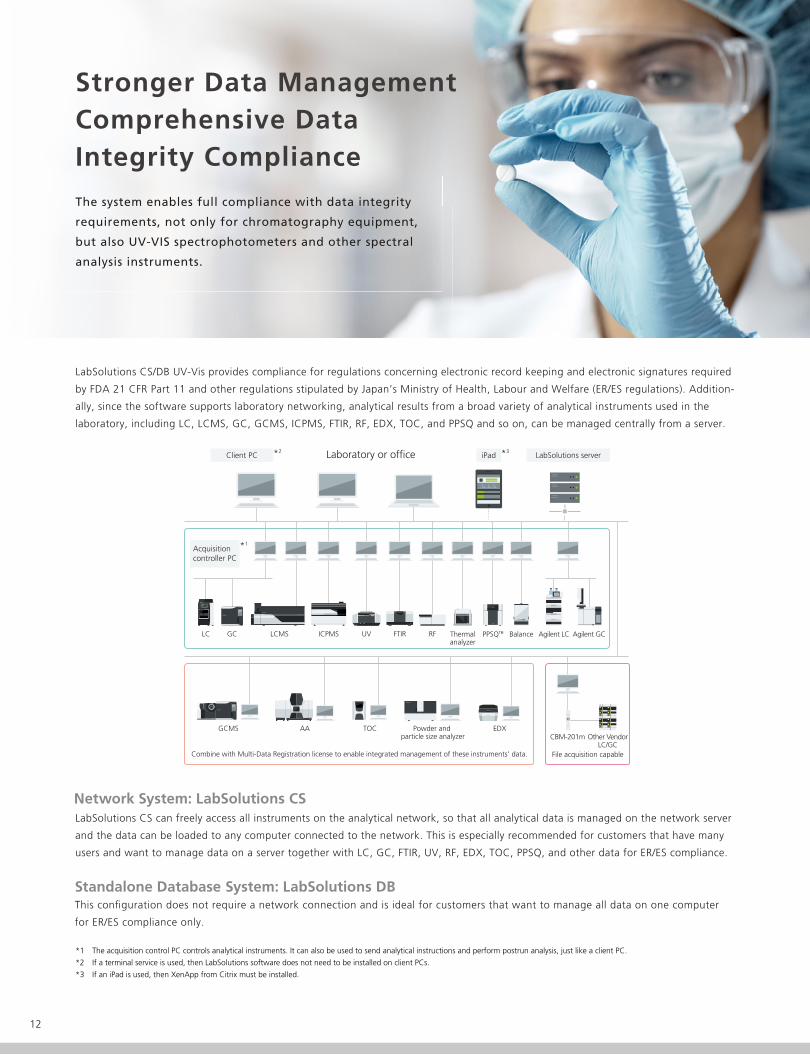
LabSolutions CS/DB UV-Vis provides compliance for regulations concerning electronic record keeping and electronic signatures required
by FDA 21 CFR Part 11 and other regulations stipulated by Japan’s Ministry of Health, Labour and Welfare (ER/ES regulations). Addition-
ally, since the software supports laboratory networking, analytical results from a broad variety of analytical instruments used in the
laboratory, including LC, LCMS, GC, GCMS, ICPMS, FTIR, RF, EDX, TOC, and PPSQ and so on, can be managed centrally from a server.
Laboratory or of�ceClient PC *2iPad *3
LabSolutions server
Acquisition controller PC
*1
LC GC LCMS ICPMS UV FTIR RF Thermalanalyzer
PPSQ™ Balance Agilent LC Agilent GC
GCMS AA TOC Powder and particle size analyzer
EDX
Combine with Multi-Data Registration license to enable integrated management of these instruments’ data.
CBM-201m Other VendorLC/GC
File acquisition capable
Network System: LabSolutions CSLabSolutions CS can freely access all instruments on the analytical network, so that all analytical data is managed on the network server
and the data can be loaded to any computer connected to the network. This is especially recommended for customers that have many
users and want to manage data on a server together with LC, GC, FTIR, UV, RF, EDX, TOC, PPSQ, and other data for ER/ES compliance.
Standalone Database System: LabSolutions DBThis con�guration does not require a network connection and is ideal for customers that want to manage all data on one computer
for ER/ES compliance only.
*1 The acquisition control PC controls analytical instruments. It can also be used to send analytical instructions and perform postrun analysis, just like a client PC.
*2 If a terminal service is used, then LabSolutions software does not need to be installed on client PCs.
*3 If an iPad is used, then XenApp from Citrix must be installed.
12
Pertinent Information isManaged for Every Project
LabSolutions DB UV-Vis and CS UV-Vis provide a project
management function enabling management suited to
tasks and system operations. This function enables
equipment and user management, security policy, and
data processing to be set on a project by project basis,
thereby improving the ef�ciency of data searches and
management tasks.
Management can be suited to tasks!
Project A Project B
Authorization
LabSolutions server
Project
Adata Project
Bdata
Access OK
Access OK
Only shows data related to the project for more convenient data searching.
Visualization of a Series of Analysis Operations
Creating a report set* provides visibility of the individual analytical
operations involved in the overall analytical process. When analytical
operations are visible, it is easier to check for operating errors, which
helps improve the ef�ciency and reliability of checking processes.
* Report sets include test methods and test results for a series of samples analyzed,
and also a corresponding operation log (a record of all operating events from login
to logout), which is automatically extracted from the data and summarized in a
single report.
Data File
Report Set*
Analysis report
Operation history
Sample information
Analysis condition Data history
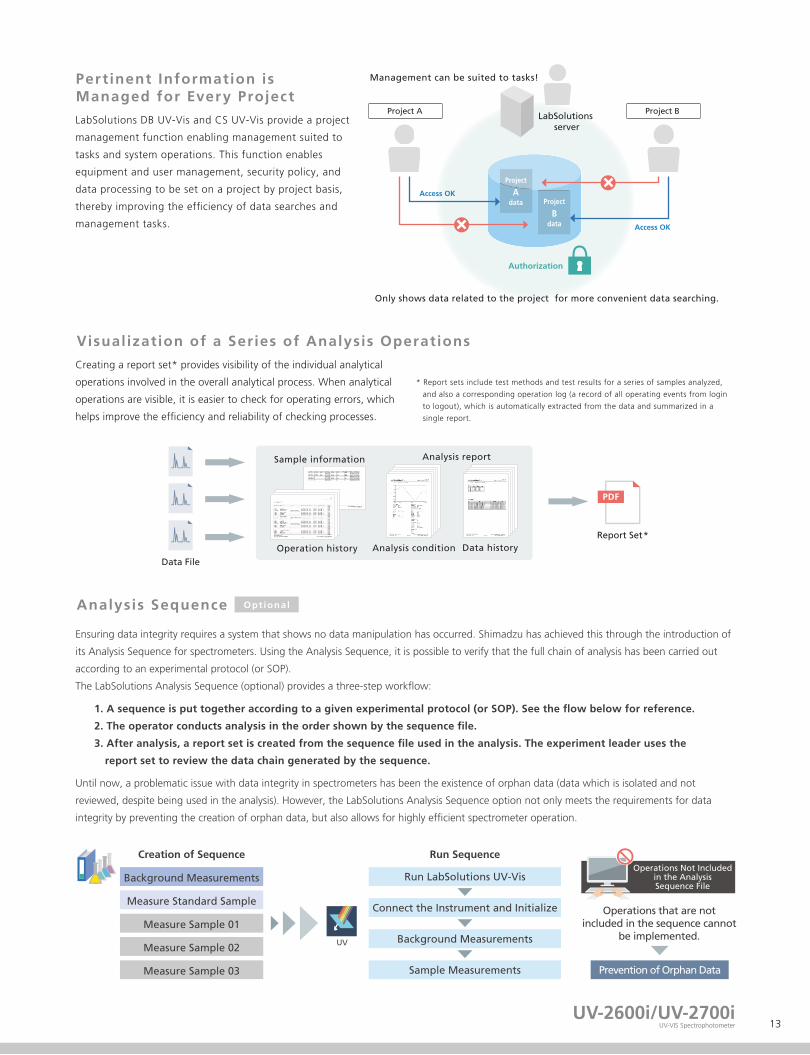
Analysis Sequence Optional
Ensuring data integrity requires a system that shows no data manipulation has occurred. Shimadzu has achieved this through the introduction of
its Analysis Sequence for spectrometers. Using the Analysis Sequence, it is possible to verify that the full chain of analysis has been carried out
according to an experimental protocol (or SOP).
The LabSolutions Analysis Sequence (optional) provides a three-step work�ow:
1. A sequence is put together according to a given experimental protocol (or SOP). See the �ow below for reference.
2. The operator conducts analysis in the order shown by the sequence �le.
3. After analysis, a report set is created from the sequence �le used in the analysis. The experiment leader uses the
report set to review the data chain generated by the sequence.
Until now, a problematic issue with data integrity in spectrometers has been the existence of orphan data (data which is isolated and not
reviewed, despite being used in the analysis). However, the LabSolutions Analysis Sequence option not only meets the requirements for data
integrity by preventing the creation of orphan data, but also allows for highly ef�cient spectrometer operation.
Run Sequence
UV
Creation of Sequence
Background Measurements
Measure Standard Sample
Measure Sample 01
Measure Sample 02
Measure Sample 03
Run LabSolutions UV-Vis
Connect the Instrument and Initialize
Background Measurements
Sample Measurements
Operations Not Includedin the AnalysisSequence File
Operations that are notincluded in the sequence cannot
be implemented.
Prevention of Orphan Data
UV-2600i/UV-2700iUV-VIS Spectrophotometer 13
Optional Software
An autosampler can be used to automate analysis in
order to avoid the trouble of having to replace cells
and enable simultaneous analysis of many samples.
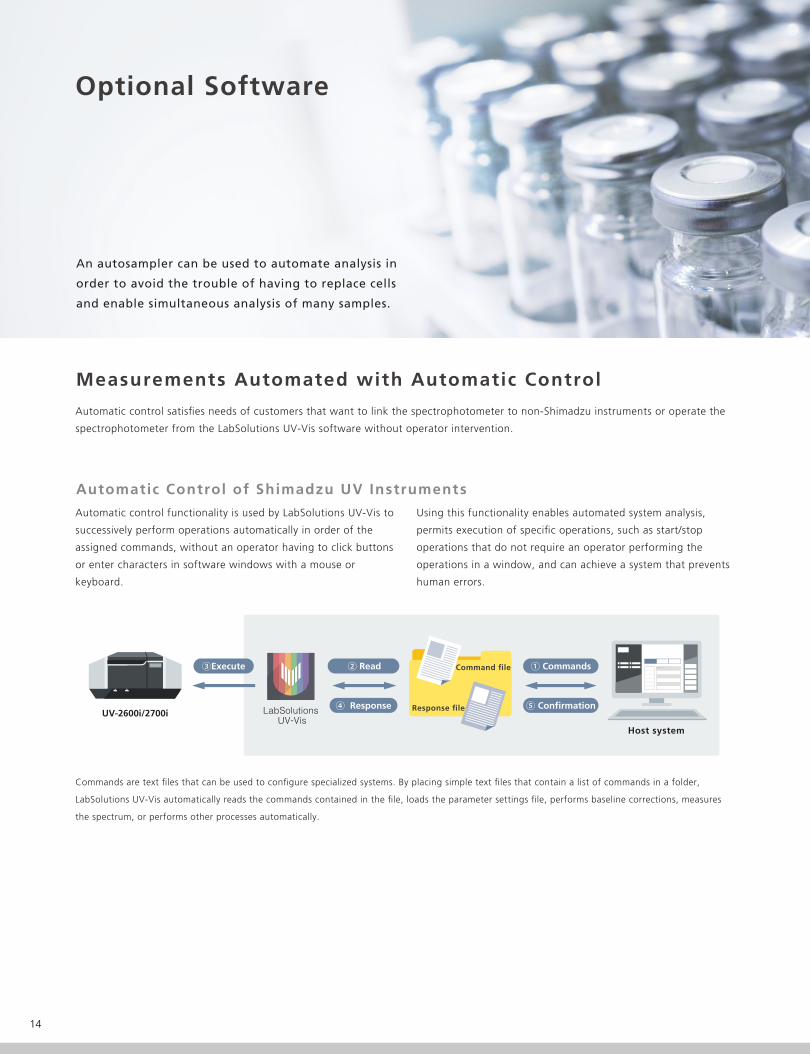
Automatic control satis�es needs of customers that want to link the spectrophotometer to non-Shimadzu instruments or operate the
spectrophotometer from the LabSolutions UV-Vis software without operator intervention.
Commands are text �les that can be used to con�gure specialized systems. By placing simple text �les that contain a list of commands in a folder,
LabSolutions UV-Vis automatically reads the commands contained in the �le, loads the parameter settings �le, performs baseline corrections, measures
the spectrum, or performs other processes automatically.
Measurements Automated with Automatic Control
Automatic Control of Shimadzu UV Instruments
Automatic control functionality is used by LabSolutions UV-Vis to
successively perform operations automatically in order of the
assigned commands, without an operator having to click buttons
or enter characters in software windows with a mouse or
keyboard.
Using this functionality enables automated system analysis,
permits execution of speci�c operations, such as start/stop
operations that do not require an operator performing the
operations in a window, and can achieve a system that prevents
human errors.
② Read
Host system
③Execute ① Commands
⑤ Con�rmation
Command �le
Response �leLabSolutions UV-Vis
④ ResponseUV-2600i/2700i
14
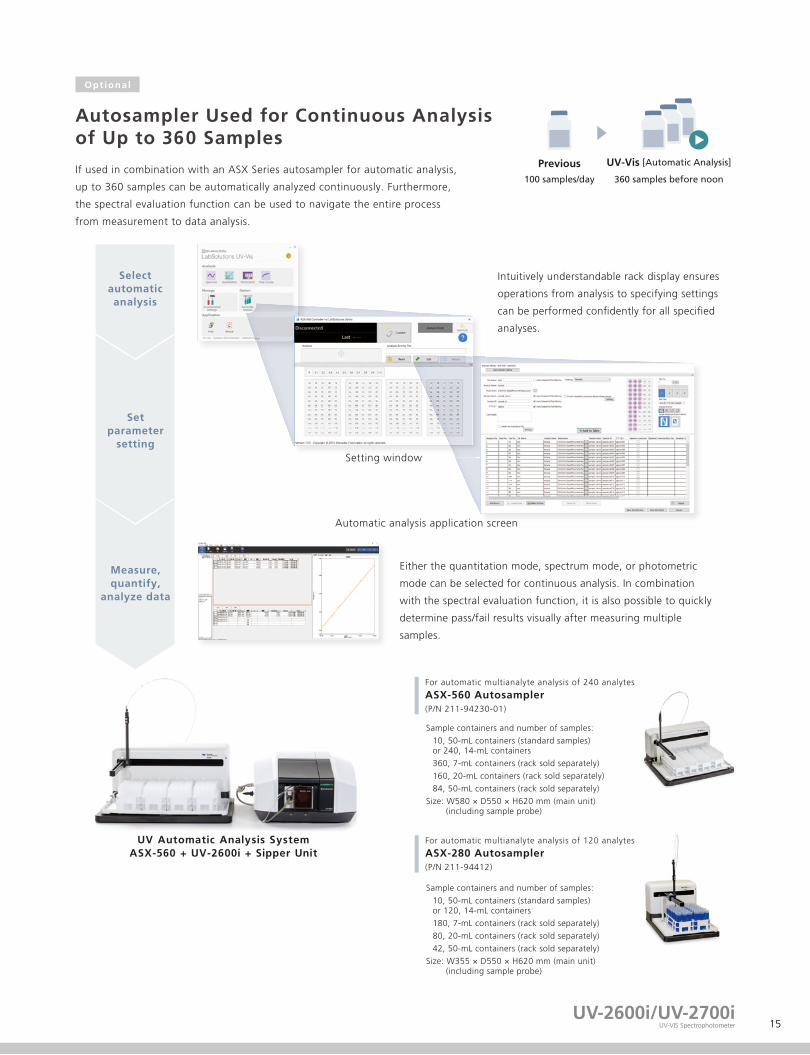
If used in combination with an ASX Series autosampler for automatic analysis,
up to 360 samples can be automatically analyzed continuously. Furthermore,
the spectral evaluation function can be used to navigate the entire process
from measurement to data analysis.
Autosampler Used for Continuous Analysisof Up to 360 Samples
Setparameter
settingSetting window
Automatic analysis application screen
Measure,quantify,
analyze data
Either the quantitation mode, spectrum mode, or photometric
mode can be selected for continuous analysis. In combination
with the spectral evaluation function, it is also possible to quickly
determine pass/fail results visually after measuring multiple
samples.
Intuitively understandable rack display ensures
operations from analysis to specifying settings
can be performed con�dently for all speci�ed
analyses.
UV-Vis [Automatic Analysis]Previous100 samples/day 360 samples before noon
Optional
Selectautomaticanalysis
UV Automatic Analysis SystemASX-560 + UV-2600i + Sipper Unit
For automatic multianalyte analysis of 240 analytes
ASX-560 Autosampler(P/N 211-94230-01)
Sample containers and number of samples:
10, 50-mL containers (standard samples) or 240, 14-mL containers
360, 7-mL containers (rack sold separately)
160, 20-mL containers (rack sold separately)
84, 50-mL containers (rack sold separately)
Size: W580 × D550 × H620 mm (main unit) (including sample probe)
For automatic multianalyte analysis of 120 analytes
ASX-280 Autosampler(P/N 211-94412)
Sample containers and number of samples:
10, 50-mL containers (standard samples) or 120, 14-mL containers
180, 7-mL containers (rack sold separately)
80, 20-mL containers (rack sold separately)
42, 50-mL containers (rack sold separately)
Size: W355 × D550 × H620 mm (main unit) (including sample probe)
UV-2600i/UV-2700iUV-VIS Spectrophotometer 15
Automated Analysis Software(P/N 207-25807-91)
This software controls the ASX-560/280 autosampler. CETAC connection kit is required to connect the device to the ASX separately.
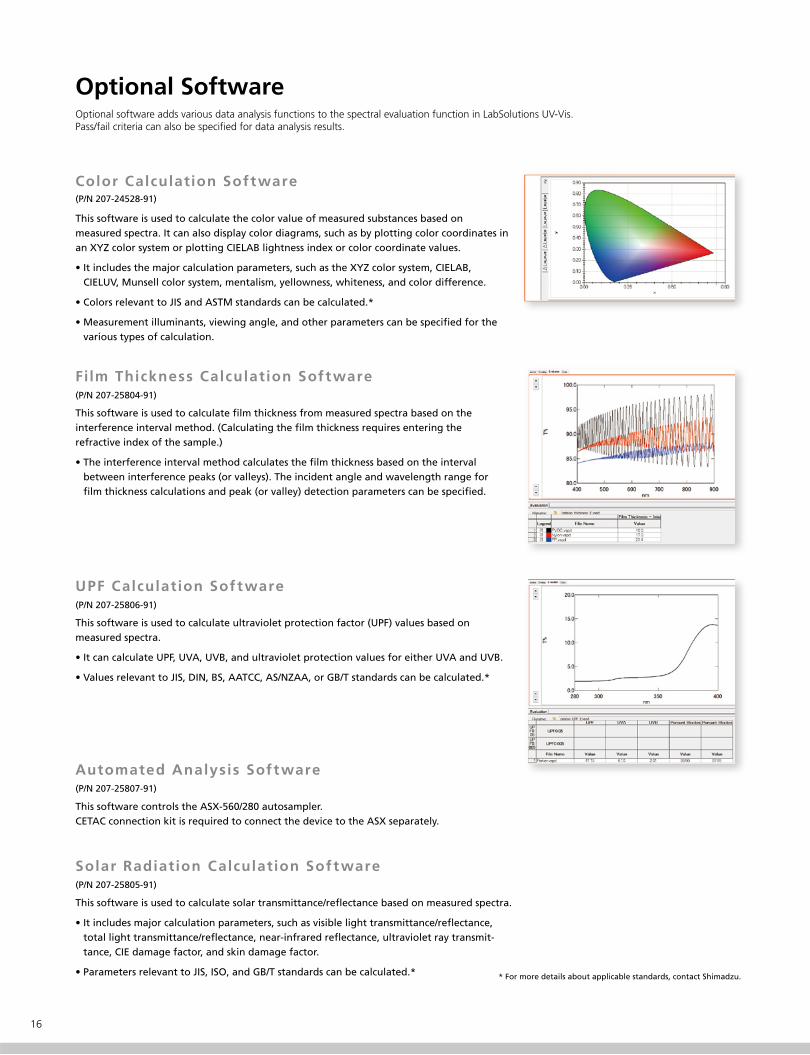
Optional SoftwareOptional software adds various data analysis functions to the spectral evaluation function in LabSolutions UV-Vis.Pass/fail criteria can also be speci�ed for data analysis results.
Color Calculation Software(P/N 207-24528-91)
This software is used to calculate the color value of measured substances based on measured spectra. It can also display color diagrams, such as by plotting color coordinates in an XYZ color system or plotting CIELAB lightness index or color coordinate values.
• It includes the major calculation parameters, such as the XYZ color system, CIELAB, CIELUV, Munsell color system, mentalism, yellowness, whiteness, and color difference.
• Colors relevant to JIS and ASTM standards can be calculated.*
• Measurement illuminants, viewing angle, and other parameters can be speci�ed for the various types of calculation.
Film Thickness Calculation Software(P/N 207-25804-91)
This software is used to calculate �lm thickness from measured spectra based on the interference interval method. (Calculating the �lm thickness requires entering the refractive index of the sample.)
• The interference interval method calculates the �lm thickness based on the interval between interference peaks (or valleys). The incident angle and wavelength range for �lm thickness calculations and peak (or valley) detection parameters can be speci�ed.
UPF Calculation Software(P/N 207-25806-91)
This software is used to calculate ultraviolet protection factor (UPF) values based on measured spectra.
• It can calculate UPF, UVA, UVB, and ultraviolet protection values for either UVA and UVB.
• Values relevant to JIS, DIN, BS, AATCC, AS/NZAA, or GB/T standards can be calculated.*
Solar Radiation Calculation Software(P/N 207-25805-91)
This software is used to calculate solar transmittance/re�ectance based on measured spectra.
• It includes major calculation parameters, such as visible light transmittance/re�ectance, total light transmittance/re�ectance, near-infrared re�ectance, ultraviolet ray transmit-tance, CIE damage factor, and skin damage factor.
• Parameters relevant to JIS, ISO, and GB/T standards can be calculated.* * For more details about applicable standards, contact Shimadzu.
16
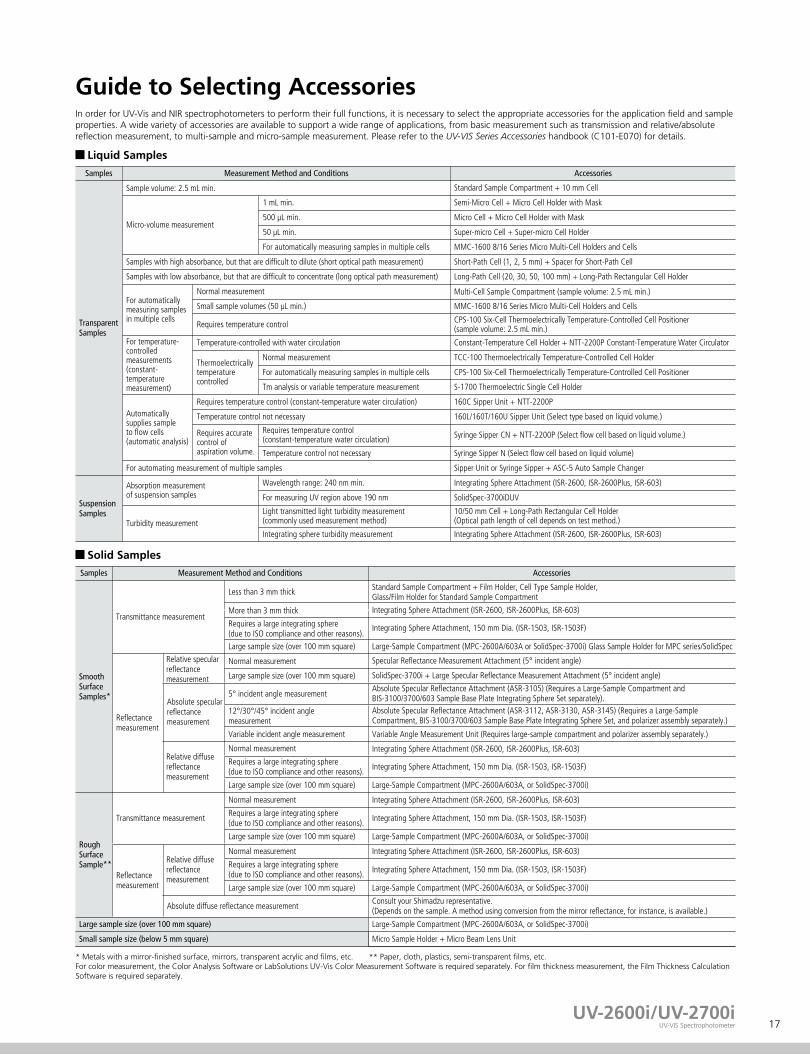
Guide to Selecting Accessories
Small sample size (below 5 mm square) Micro Sample Holder + Micro Beam Lens Unit
Solid Samples
Samples Measurement Method and Conditions Accessories
SmoothSurfaceSamples*
Transmittance measurement
Less than 3 mm thick Standard Sample Compartment + Film Holder, Cell Type Sample Holder, Glass/Film Holder for Standard Sample Compartment
More than 3 mm thick Integrating Sphere Attachment (ISR-2600, ISR-2600Plus, ISR-603)
Requires a large integrating sphere(due to ISO compliance and other reasons).
Integrating Sphere Attachment, 150 mm Dia. (ISR-1503, ISR-1503F)
Reflectancemeasurement
Relative specularreflectancemeasurement
Normal measurement Specular Reflectance Measurement Attachment (5° incident angle)
Large sample size (over 100 mm square) SolidSpec-3700i + Large Specular Reflectance Measurement Attachment (5° incident angle)
Absolute specularreflectancemeasurement
5° incident angle measurementAbsolute Specular Reflectance Attachment (ASR-3105) (Requires a Large-Sample Compartment andBIS-3100/3700/603 Sample Base Plate Integrating Sphere Set separately).
12°/30°/45° incident anglemeasurement
Absolute Specular Reflectance Attachment (ASR-3112, ASR-3130, ASR-3145) (Requires a Large-SampleCompartment, BIS-3100/3700/603 Sample Base Plate Integrating Sphere Set, and polarizer assembly separately.)
Relative diffusereflectancemeasurement
Normal measurement Integrating Sphere Attachment (ISR-2600, ISR-2600Plus, ISR-603)
Requires a large integrating sphere(due to ISO compliance and other reasons). Integrating Sphere Attachment, 150 mm Dia. (ISR-1503, ISR-1503F)
Large sample size (over 100 mm square) Large-Sample Compartment (MPC-2600A/603A, or SolidSpec-3700i)
RoughSurfaceSample**
Transmittance measurement
Normal measurement Integrating Sphere Attachment (ISR-2600, ISR-2600Plus, ISR-603)
Requires a large integrating sphere(due to ISO compliance and other reasons). Integrating Sphere Attachment, 150 mm Dia. (ISR-1503, ISR-1503F)
Large sample size (over 100 mm square) Large-Sample Compartment (MPC-2600A/603A, or SolidSpec-3700i)
Reflectancemeasurement
Relative diffusereflectancemeasurement
Integrating Sphere Attachment (ISR-2600, ISR-2600Plus, ISR-603)
Requires a large integrating sphere(due to ISO compliance and other reasons).
Normal measurement
Integrating Sphere Attachment, 150 mm Dia. (ISR-1503, ISR-1503F)
Large sample size (over 100 mm square) Large-Sample Compartment (MPC-2600A/603A, or SolidSpec-3700i)
Absolute diffuse reflectance measurement Consult your Shimadzu representative.(Depends on the sample. A method using conversion from the mirror reflectance, for instance, is available.)
Large sample size (over 100 mm square) Large-Sample Compartment (MPC-2600A/603A, or SolidSpec-3700i)
* Metals with a mirror-�nished surface, mirrors, transparent acrylic and �lms, etc. ** Paper, cloth, plastics, semi-transparent �lms, etc.For color measurement, the Color Analysis Software or LabSolutions UV-Vis Color Measurement Software is required separately. For �lm thickness measurement, the Film Thickness CalculationSoftware is required separately.
Liquid Samples
Samples Measurement Method and Conditions Accessories
TransparentSamples
Sample volume: 2.5 mL min. Standard Sample Compartment + 10 mm Cell
Micro-volume measurement
1 mL min. Semi-Micro Cell + Micro Cell Holder with Mask
500 μL min. Micro Cell + Micro Cell Holder with Mask
50 μL min. Super-micro Cell + Super-micro Cell Holder
For automatically measuring samples in multiple cells MMC-1600 8/16 Series Micro Multi-Cell Holders and Cells
Samples with high absorbance, but that are difficult to dilute (short optical path measurement) Short-Path Cell (1, 2, 5 mm) + Spacer for Short-Path Cell
Samples with low absorbance, but that are difficult to concentrate (long optical path measurement) Long-Path Cell (20, 30, 50, 100 mm) + Long-Path Rectangular Cell Holder
For automaticallymeasuring samplesin multiple cells
Normal measurement Multi-Cell Sample Compartment (sample volume: 2.5 mL min.)
Small sample volumes (50 μL min.) MMC-1600 8/16 Series Micro Multi-Cell Holders and Cells
Requires temperature control CPS-100 Six-Cell Thermoelectrically Temperature-Controlled Cell Positioner(sample volume: 2.5 mL min.)
For temperature-controlledmeasurements(constant-temperaturemeasurement)
Temperature-controlled with water circulation Constant-Temperature Cell Holder + NTT-2200P Constant-Temperature Water Circulator
Thermoelectricallytemperaturecontrolled
Normal measurement TCC-100 Thermoelectrically Temperature-Controlled Cell Holder
For automatically measuring samples in multiple cells CPS-100 Six-Cell Thermoelectrically Temperature-Controlled Cell Positioner
Tm analysis or variable temperature measurement S-1700 Thermoelectric Single Cell Holder
Automaticallysupplies sampleto flow cells(automatic analysis)
Requires temperature control (constant-temperature water circulation) 160C Sipper Unit + NTT-2200P
Temperature control not necessary 160L/160T/160U Sipper Unit (Select type based on liquid volume.)
Requires accuratecontrol ofaspiration volume.
Requires temperature control(constant-temperature water circulation) Syringe Sipper CN + NTT-2200P (Select flow cell based on liquid volume.)
Temperature control not necessary Syringe Sipper N (Select flow cell based on liquid volume)
For automating measurement of multiple samples Sipper Unit or Syringe Sipper + ASC-5 Auto Sample Changer
SuspensionSamples
Absorption measurementof suspension samples
Wavelength range: 240 nm min. Integrating Sphere Attachment (ISR-2600, ISR-2600Plus, ISR-603)
For measuring UV region above 190 nm SolidSpec-3700iDUV
Turbidity measurementLight transmitted light turbidity measurement(commonly used measurement method)
10/50 mm Cell + Long-Path Rectangular Cell Holder(Optical path length of cell depends on test method.)
Integrating sphere turbidity measurement Integrating Sphere Attachment (ISR-2600, ISR-2600Plus, ISR-603)
Large sample size (over 100 mm square) Large-Sample Compartment (MPC-2600A/603A or SolidSpec-3700i) Glass Sample Holder for MPC series/SolidSpec
Variable incident angle measurement Variable Angle Measurement Unit (Requires large-sample compartment and polarizer assembly separately.)
In order for UV-Vis and NIR spectrophotometers to perform their full functions, it is necessary to select the appropriate accessories for the application �eld and sample properties. A wide variety of accessories are available to support a wide range of applications, from basic measurement such as transmission and relative/absolute re�ection measurement, to multi-sample and micro-sample measurement. Please refer to the UV-VIS Series Accessories handbook (C101-E070) for details.
UV-2600i/UV-2700iUV-VIS Spectrophotometer 17
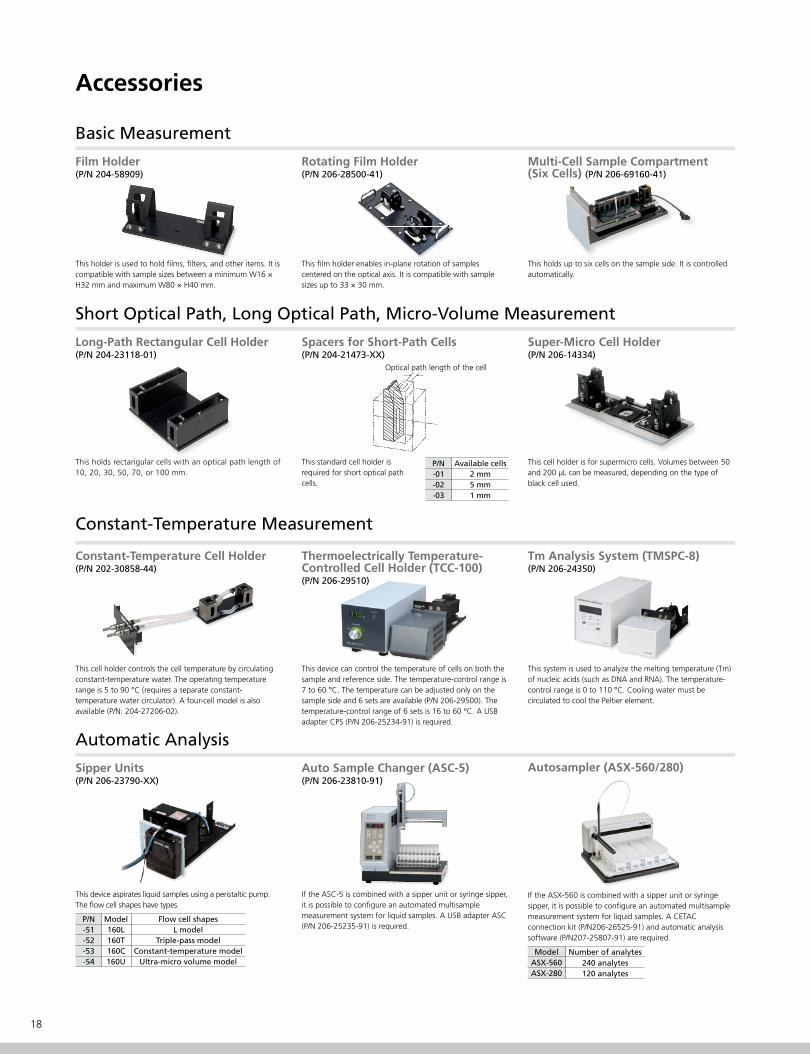
Accessories
Basic Measurement
This holder is used to hold �lms, �lters, and other items. It is compatible with sample sizes between a minimum W16 × H32 mm and maximum W80 × H40 mm.
This �lm holder enables in-plane rotation of samples centered on the optical axis. It is compatible with sample sizes up to 33 × 30 mm.
This holds up to six cells on the sample side. It is controlled automatically.
Short Optical Path, Long Optical Path, Micro-Volume Measurement
This cell holder is for supermicro cells. Volumes between 50 and 200 μL can be measured, depending on the type of black cell used.
This holds rectangular cells with an optical path length of 10, 20, 30, 50, 70, or 100 mm.
This standard cell holder is required for short optical path cells.
Film Holder(P/N 204-58909)
Rotating Film Holder(P/N 206-28500-41)
Multi-Cell Sample Compartment(Six Cells) (P/N 206-69160-41)
Long-Path Rectangular Cell Holder(P/N 204-23118-01)
Spacers for Short-Path Cells(P/N 204-21473-XX)
Super-Micro Cell Holder(P/N 206-14334)
Optical path length of the cell
P/N-01-02-03
Available cells2 mm5 mm1 mm
This cell holder controls the cell temperature by circulating constant-temperature water. The operating temperature range is 5 to 90 °C (requires a separate constant-temperature water circulator). A four-cell model is alsoavailable (P/N: 204-27206-02).
This device can control the temperature of cells on both the sample and reference side. The temperature-control range is 7 to 60 °C. The temperature can be adjusted only on the sample side and 6 sets are available (P/N 206-29500). The temperature-control range of 6 sets is 16 to 60 °C. A USB adapter CPS (P/N 206-25234-91) is required.
This system is used to analyze the melting temperature (Tm) of nucleic acids (such as DNA and RNA). The temperature-control range is 0 to 110 °C. Cooling water must becirculated to cool the Peltier element.
This device aspirates liquid samples using a peristaltic pump.The �ow cell shapes have types.
If the ASC-5 is combined with a sipper unit or syringe sipper, it is possible to con�gure an automated multisample measurement system for liquid samples. A USB adapter ASC (P/N 206-25235-91) is required.
Constant-Temperature Cell Holder(P/N 202-30858-44)
Thermoelectrically Temperature-Controlled Cell Holder (TCC-100)(P/N 206-29510)
Tm Analysis System (TMSPC-8)(P/N 206-24350)
Sipper Units(P/N 206-23790-XX)
Auto Sample Changer (ASC-5)(P/N 206-23810-91)
Constant-Temperature Measurement
Automatic Analysis
P/N-51-52-53-54
Model160L160T160C160U
Flow cell shapesL model
Triple-pass modelConstant-temperature model
Ultra-micro volume model
If the ASX-560 is combined with a sipper unit or syringe sipper, it is possible to con�gure an automated multisample measurement system for liquid samples. A CETAC connection kit (P/N206-26525-91) and automatic analysis software (P/N207-25807-91) are required.
Autosampler (ASX-560/280)
ModelASX-560ASX-280
Number of analytes240 analytes120 analytes
18
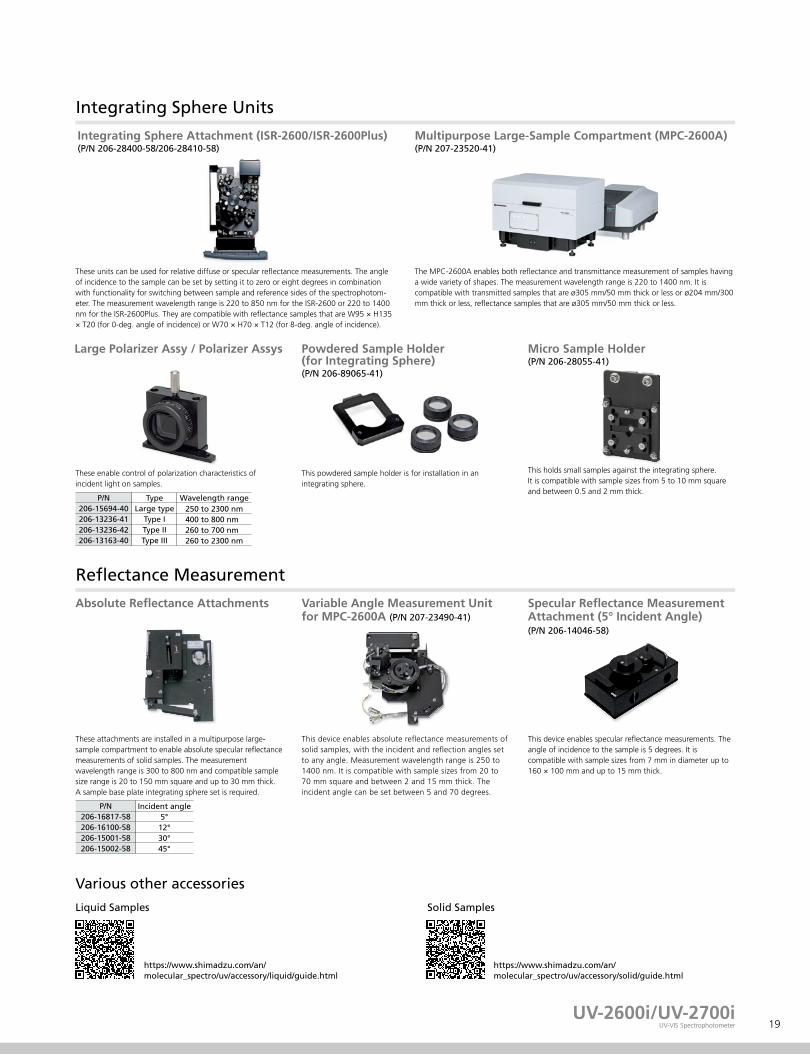
These units can be used for relative diffuse or specular re�ectance measurements. The angle of incidence to the sample can be set by setting it to zero or eight degrees in combination with functionality for switching between sample and reference sides of the spectrophotom-eter. The measurement wavelength range is 220 to 850 nm for the ISR-2600 or 220 to 1400 nm for the ISR-2600Plus. They are compatible with re�ectance samples that are W95 × H135 × T20 (for 0-deg. angle of incidence) or W70 × H70 × T12 (for 8-deg. angle of incidence).
The MPC-2600A enables both re�ectance and transmittance measurement of samples having a wide variety of shapes. The measurement wavelength range is 220 to 1400 nm. It is compatible with transmitted samples that are ø305 mm/50 mm thick or less or ø204 mm/300 mm thick or less, re�ectance samples that are ø305 mm/50 mm thick or less.
These enable control of polarization characteristics of incident light on samples.
This powdered sample holder is for installation in an integrating sphere.
This holds small samples against the integrating sphere.It is compatible with sample sizes from 5 to 10 mm square and between 0.5 and 2 mm thick.
These attachments are installed in a multipurpose large-sample compartment to enable absolute specular re�ectance measurements of solid samples. The measurement wavelength range is 300 to 800 nm and compatible sample size range is 20 to 150 mm square and up to 30 mm thick. A sample base plate integrating sphere set is required.
This device enables absolute re�ectance measurements of solid samples, with the incident and re�ection angles set to any angle. Measurement wavelength range is 250 to 1400 nm. It is compatible with sample sizes from 20 to 70 mm square and between 2 and 15 mm thick. The incident angle can be set between 5 and 70 degrees.
Absolute Re�ectance Attachments Variable Angle Measurement Unit for MPC-2600A (P/N 207-23490-41)
Specular Re�ectance Measurement Attachment (5° Incident Angle)(P/N 206-14046-58)
This device enables specular re�ectance measurements. The angle of incidence to the sample is 5 degrees. It is compatible with sample sizes from 7 mm in diameter up to 160 × 100 mm and up to 15 mm thick.
Integrating Sphere Attachment (ISR-2600/ISR-2600Plus)(P/N 206-28400-58/206-28410-58)
Multipurpose Large-Sample Compartment (MPC-2600A)(P/N 207-23520-41)
Large Polarizer Assy / Polarizer Assys Powdered Sample Holder(for Integrating Sphere)(P/N 206-89065-41)
Micro Sample Holder(P/N 206-28055-41)
Integrating Sphere Units
Re�ectance Measurement
Various other accessories
P/N206-15694-40206-13236-41206-13236-42206-13163-40
TypeLarge type
Type IType IIType III
Wavelength range250 to 2300 nm400 to 800 nm260 to 700 nm260 to 2300 nm
P/N206-16817-58206-16100-58206-15001-58206-15002-58
Incident angle5°12°30°45°
https://www.shimadzu.com/an/molecular_spectro/uv/accessory/solid/guide.html
https://www.shimadzu.com/an/molecular_spectro/uv/accessory/liquid/guide.html
Solid SamplesLiquid Samples
UV-2600i/UV-2700iUV-VIS Spectrophotometer 19
UV
-2600i / UV
-2700i
-Automated support functions utilizing digital technology, such as M2M, IoT, and Arti�cial Intelligence (AI), that enable higher productivity and maximum reliability.-Allows a system to monitor and diagnose itself, handle any issues during data acquisition without user input, and automatically behave as if it were operated by an expert.-Supports the acquisition of high quality, reproducible data regardless of an operator’s skill level for both routine and demanding applications.
SolidSpec, LabSolutions, the Analytical Intelligence logo, Lo-Ray-Ligh and PPSQ are trademarks of Shimadzu Corporation.Excel is either a registered trademark or a trademark of Microsoft Corporation in the United States and/or other countries.iPad is a trademark of Apple Inc., registered in the U.S. and other countries.Xenapp is a trademark of Citrix Systems, Inc. and/or one or more of its subsidiaries, and may be registered in the United States Patent and Trademark Of�ce and in other countries.
www.shimadzu.com/an/
For Research Use Only. Not for use in diagnostic procedures. This publication may contain references to products that are not available in your country. Please contact us to check the availability of these products in your country.Company names, products/service names and logos used in this publication are trademarks and trade names of Shimadzu Corporation, its subsidiaries or its af�liates, whether or not they are used with trademark symbol “TM” or “®”.Third-party trademarks and trade names may be used in this publication to refer to either the entities or their products/services, whether or not they are used with trademark symbol “TM” or “®”.Shimadzu disclaims any proprietary interest in trademarks and trade names other than its own.
The contents of this publication are provided to you “as is” without warranty of any kind, and are subject to change without notice. Shimadzu does not assume any responsibility or liability for any damage, whether direct or indirect, relating to the use of this publication.
© Shimadzu Corporation, 2019First Edition: December 2019, Printed in Japan 3655-10901-30ANS