Embed Size (px)
Citation preview

©2011 Waters Corporation | COMPANY CONFIDENTIAL 1
Utilizing UPLC for Atline &
Online Process Development
and Analysis of IPM
Tony Wiklund
Nordic Application Chemist
Craig Dobbs
+1.508.482.2578

©2011 Waters Corporation | COMPANY CONFIDENTIAL 2
Process Analytical Technology
Process Analytical Technology (PAT) is a system for designing, analyzing, and controlling manufacturing processes through timely measurements (during processing) of critical quality and performance attributes of raw and inprocess materials, to ensure final product quality.
— The term analytical in PAT is viewed broadly to include chemical, physical, microbiological, mathematical, and risk analysis conducted in an integrated manner.
— The emphasis in PAT is on the manufacturing process. Quality cannot be tested into products; it should be built-in by design.
— PAT is nothing new, the Chemical Industry has been using it since the 1940‘s.

©2011 Waters Corporation | COMPANY CONFIDENTIAL 3
Inprocess Sample Analysis from Manufacturing

©2011 Waters Corporation | COMPANY CONFIDENTIAL 4
QC Testing Observation in Pharmaceutical Manufacturing
G.K. Raju, MIT PHARMI, Pharmaceutical Manufacturing: New Technology Opportunities, presentation at USFDA 16NOV01

©2011 Waters Corporation | COMPANY CONFIDENTIAL 5
PAT Recommendation for Pharmaceutical Manufacturing
G.K. Raju, MIT PHARMI, Pharmaceutical Manufacturing: New Technology Opportunities, presentation at USFDA 16NOV01

©2011 Waters Corporation | COMPANY CONFIDENTIAL 6
Quality is Paramount, but PAT must also Drive Profitability
Positive impact on business drivers
— Is the Project a ―science experiment‖ or is it financially driven?
o Consistent quality output is an expected baseline
— Well defined ROI (return on investment)
Ma
rgin
/Revenue
Ris
k &
Costs
Asset U
tilizatio
n
Increasing Productivity and Efficiency while Decreasing Costs drive
Profitability

©2011 Waters Corporation | COMPANY CONFIDENTIAL 7
Current PAT implementation
Unit Operation PAT Technology Applied
Benefits in Product Manufacture
Particle size reduction and milling
NIR Spectroscopy Monitor and control API milling process and inprocess agglomerates
Blending and mixing NIR SpectroscopyRaman Spectroscopy
Identify safe-zone and most appropriate mixingtime
Granulation NIR, Raman, XPRD SpectroscopyAcoustic EmissionThermal Effusivity
Justify granulation process parameter ranges with controlled granulation quality
Drying NIR Spectroscopy Identify drying curve and endpoint
Coating NIR SpectroscopyRaman Spectroscopy
Determine coating rate and endpoint
Unit dosing NIR SpectroscopyRaman Spectroscopy
Detect drug distribution uniformity and identify process deviations
Ahmed et al, American Pharmaceutical Review - PAT Initiative in Generic Product Development

©2011 Waters Corporation | COMPANY CONFIDENTIAL 8
Limitations of Current PAT Technologies
Poor Sensitivity
—Dependent on strong compound signal
—Limits of Detection (LOD)
Limited Quantitation capability
—Dependent on dissimilar compound spectra
—Limits of Quantitation (LOQ)
Minimal Dynamic Range
Minimal Resolution
Still requires a ―Reference Standard‖ or ―Gold Standard‖
Technique for comparison and validation
Vibrational spectroscopic data not easily compared/correlated
to data from Discovery, Research, Development, and QC

©2011 Waters Corporation | COMPANY CONFIDENTIAL 9
Product Life CycleAnalytical Support
VibrationalSpectroscopy
DATA and INFORMATICSSpecific to Manufacturing

©2011 Waters Corporation | COMPANY CONFIDENTIAL 10
Product Life CycleAnalytical Support
DATA and INFORMATICS

©2011 Waters Corporation | COMPANY CONFIDENTIAL 11
PATROL UPLC Systems
Embed PATROL Laboratory System Video

©2011 Waters Corporation | COMPANY CONFIDENTIAL 12
HPLC for Inprocess AnalysisReference Standard
LC is a major analytical technique in every QC lab
— But it is not a major tool for Online/Atline analysis
What perceptions are impacting the lack of LC adoption on
the production floor?
— Too slow, too slow too slow; not ―real-time‖, it just takes too
long to get an answer
— Long run times delay processes
— Not rugged enough for continuous operation
— Requires considerable maintenance
— Excessive down-time
— Too expensive to operate
— Requires consumables and highly skilled technicians
— Not automated
— Real-time Online/Atline LC Systems don‘t exist

©2011 Waters Corporation | COMPANY CONFIDENTIAL 13
PATROL UPLC Process Analyzer
Key Requirements for an
inprocess analyzer
Real-time results
Ease of Use
Flexible
Rugged & Robust
Serviceability

©2011 Waters Corporation | COMPANY CONFIDENTIAL 14
UPLC SeparationsA New Category of Liquid Chromatography

©2011 Waters Corporation | COMPANY CONFIDENTIAL 15
Increased Speed without Sacrificing Resolution or Selectivity
2.5 µm – 75 mm
F = 500 µL/min
Injection = 2.5 µL
Rs (2,3) = 2.34
5 µm – 150 mm
F = 200 µL/min
Injection = 5.0 µL
Rs (2,3) = 2.28
3.5 µm – 100 mm
F = 300 µL/min
Injection = 3.3 µL
Rs (2,3) = 2.32
1.7 µm – 50 mm
F = 600 µL/min
Injection = 1.7 µL
Rs (2,3) = 2.29
AU
0.00
0.10
0.20
Minutes
0.00 0.50 1.00 1.50 2.00 2.50 3.00 3.50 4.00
AU
0.00
0.10
0.20
Minutes
0.00 2.00 4.00 6.00 8.00 10.00A
U
0.00
0.10
0.20
Minutes
0.00 0.20 0.40 0.60 0.80 1.00 1.20 1.40 1.60 1.80 2.00
AU
0.00
0.10
0.20
Minutes
0.00 0.20 0.40 0.60 0.80 1.00 1.10

©2011 Waters Corporation | COMPANY CONFIDENTIAL 16
Original HPLC MethodTOO SLOW for Online Analysis
Transfer to UPLC and optimize
30 minute cycle time

©2011 Waters Corporation | COMPANY CONFIDENTIAL 17
New UPLC Methodreal-TIME LC™ Analysis
Overlay of 10 Replicate Injections
Real-time results
Ease of Use
Flexible
Rugged & Robust
Serviceability

©2011 Waters Corporation | COMPANY CONFIDENTIAL 18
Key Requirements for a UPLC based Process Monitor
Ease of Use
Trade You Seats?

©2011 Waters Corporation | COMPANY CONFIDENTIAL 19
―Typical‖ Analytical LC Workflow
Sample comesinto Lab
Log sampleinto System
4 mins
LabelLC vial
Draw Sample into syringe and aliquot/filter to sample vials
5 mins
Dilute sample andaliquot to LC vial
10 mins
Log sampleinto LC System
& assign method
5 mins
ResultsPlace LC vial in designated
SM position
1 min2 mins
Label sample vials
5 mins
32 minutes 6 potential mistakes

©2011 Waters Corporation | COMPANY CONFIDENTIAL 20
Scan sampleinto System
1 min
―Possible‖ Analytical LC Workflow
Sample comesinto Lab
Draw into syringe and aliquot/filter LC vial
3 mins
Insert LC vial in PSM
2 mins
Results
6 minutes 0 potential mistakes
©2011 Waters Corporation | COMPANY CONFIDENTIAL 21
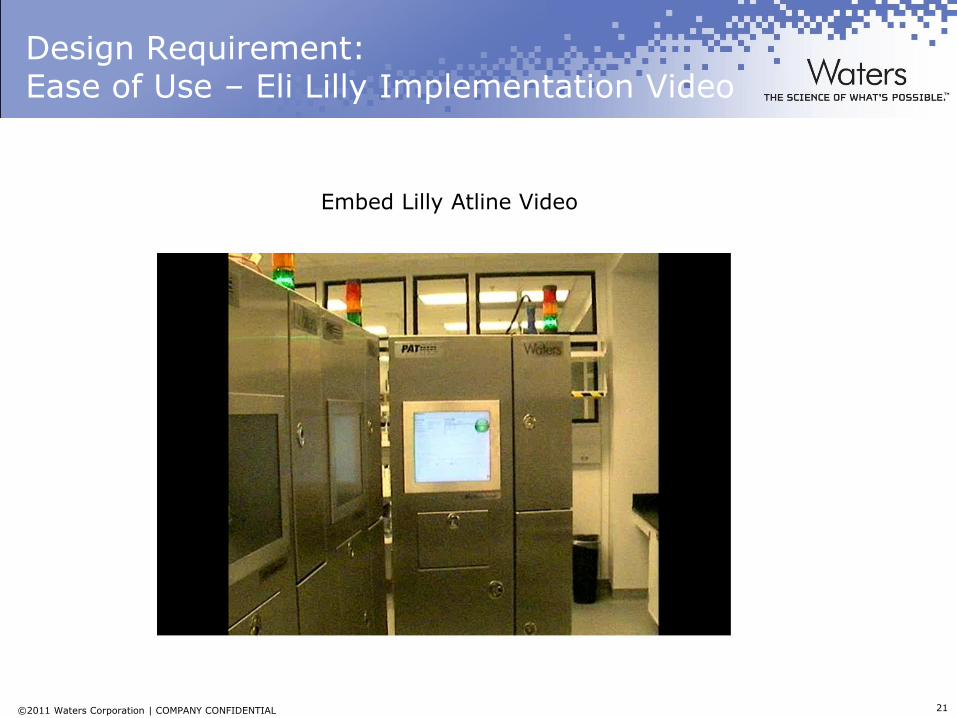
Design Requirement:Ease of Use – Eli Lilly Implementation Video
Embed Lilly Atline Video

©2011 Waters Corporation | COMPANY CONFIDENTIAL 22
Software – Primary GUI

©2011 Waters Corporation | COMPANY CONFIDENTIAL 23
Key Requirements for a UPLC based Process Monitor
Real-time results
Ease of Use
Flexible
Rugged & Robust
Serviceability
©2011 Waters Corporation | COMPANY CONFIDENTIAL 24
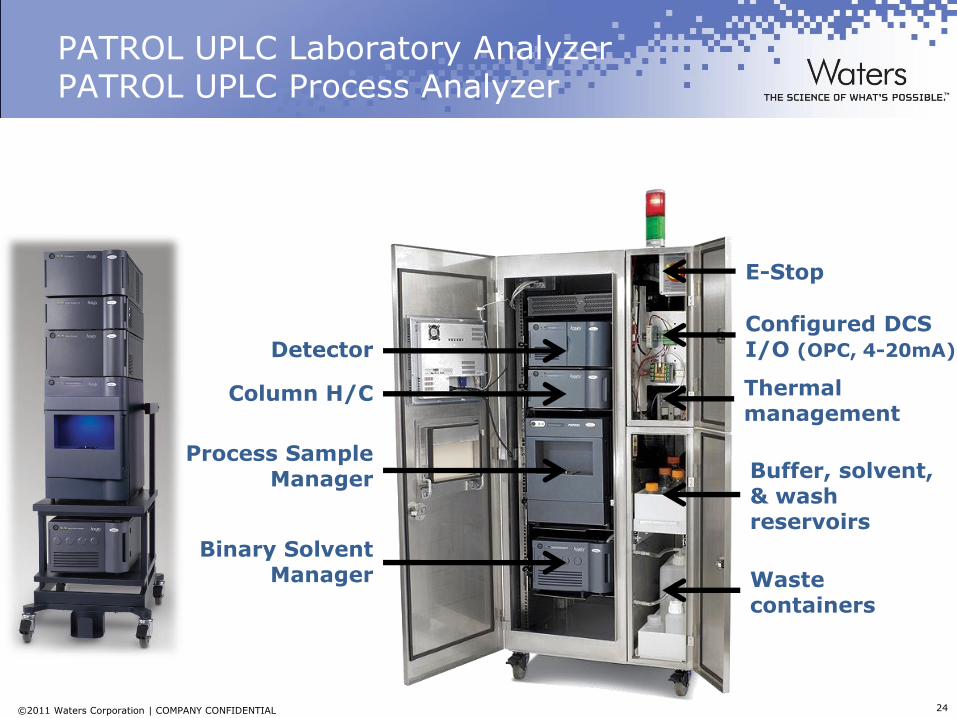
PATROL UPLC Laboratory AnalyzerPATROL UPLC Process Analyzer
Configured DCS I/O (OPC, 4-20mA)
Thermal management
E-Stop
Buffer, solvent, & wash reservoirs
Waste containers
Detector
Column H/C
Process Sample Manager
Binary Solvent Manager

©2011 Waters Corporation | COMPANY CONFIDENTIAL 25
Online Process Sample ManagerFluidic Components
Process Pump
Process Valve
Sample Pump Inject
Valve
DiluentPump
Priming Valve
Sampling Valve
Courtesy of Bob Tacconi

©2011 Waters Corporation | COMPANY CONFIDENTIAL 26
Process Sample Manager Specifications
Parameter Specification
Sample Identification Online Automatic, Barcode, or Manual
Sample Temperature range 40C - 300C
Minimum Sample Volume 0.5mL (vial residual)
Sample Volume consumed/Cycle <100uL
Injection Volume Fixed loop; 1uL, 2uL, 5uL
Injection Linearity >0.999
Injection Cycle Time <90 seconds, load ahead capability
Sample Carryover <0.01%
Standard Identification Barcode or Manual Entry
Standard Temperature range 40C – 300C

©2011 Waters Corporation | COMPANY CONFIDENTIAL 27
Process Sample Manager Specifications
Parameter Specification
Minimum Standard Volume 0.5mL (vial residual)
Std Volume consumed/Injection <100uL
Dilution Range No dilution to 1:50 programmable
Dilution Precision <1%RSD (caffeine sample)
Dilution Linearity >0.9999 R2 (caffeine sample)
Dilution Time <90secs load ahead capability
Dilution Volume <500uL
Injection wash volume <1.0mL
Injection wash time <0.5mins
Injection, Dilution, Wash Cycle <3.0 minutes
PSM vial positions 32 positions, samples and standards

©2011 Waters Corporation | COMPANY CONFIDENTIAL 28
Atline Dilution CapabilitiesLinearity (n = 6)
R2 = 0.999941/x WeightingExcellent linearity across the entire
dilution range
Aqueous rProtein sample diluted with 6M urea
Undiluted2x Dilution4x Dilution10x Dilution20x Dilution100x Dilution
Dilution %RSD
Undiluted 0.11
2x 0.48
4x 0.70
10x 0.49
20x 0.59
100x 0.66
©2011 Waters Corporation | COMPANY CONFIDENTIAL 29
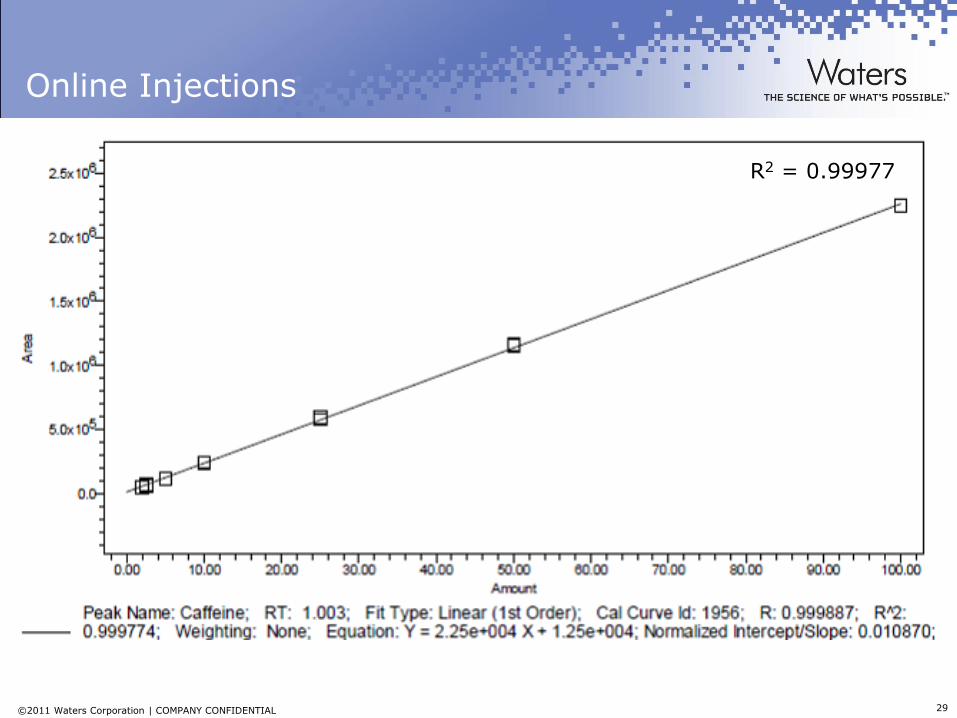
Online Injections
R2 = 0.99977

©2011 Waters Corporation | COMPANY CONFIDENTIAL 30
Key Requirements for a UPLC based Process Monitor
Real-time results
Ease of Use
Flexible (H/W & S/W)
Rugged & Robust
Serviceability

©2011 Waters Corporation | COMPANY CONFIDENTIAL 31
Batch Reaction Monitoring by Online UPLC
Map the formation of the
API and the consumption of
the starting material as the
reaction progresses.
The large, linear dynamic
range of the detector allows
for the simultaneous
monitoring of any low level
impurities.
Injection #1
Injection #14
Injection #37
Injection #60

©2011 Waters Corporation | COMPANY CONFIDENTIAL 32
Making a Decision
Monitor API formation to determine endpoint
Process Impurity 1
Process Impurity 2
Process Impurity 3
Process Impurity 4
Monitor appearance of impurities to determine endpoint

©2011 Waters Corporation | COMPANY CONFIDENTIAL 33
Batch Reaction Monitoring by Online UPLC
0
10
20
30
40
50
60
70
80
90
100
0 10 20 30 40 50 60
Pe
ak A
rea
%
Injection #
API Starting Material Process Impurity 1 Process Impurity 2 Process Impurity 3 Process Impurity 4
Map the reaction progress for process understanding and optimization
Quench reaction prior to process impurity 4(CQA) exceeding 0.1%, eliminating additional processing while maximizing yield

©2011 Waters Corporation | COMPANY CONFIDENTIAL 34
Benefits of Batch Reaction Monitoring by Online UPLC
Pro
cess I
mpuri
ty 1
Pro
cess I
mpuri
ty 2
Pro
cess I
mpuri
ty 3
Sta
rtin
g M
ate
rial
API
Pro
cess I
mpuri
ty 4
AU
0.000
0.015
0.030
0.045
0.060
Minutes0.00 0.25 0.50 0.75 1.00 1.25 1.50
Injection #25
Quantify low level components in the presence of a high concentration API
Reaction Aliquot
Starting Material
API ProcessImp#1
Process Imp#2
Process Imp#3
ProcessImp#4
1 98.56 1.38
5 89.54 10.43
13 51.03 48.84 0.04 0.06
17 38.49 61.25 0.01 0.10 0.12
25 23.09 75.83 0.05 0.43 0.55 0.04
29 18.27 79.74 0.09 0.81 1.02 0.07
33 14.58 81.96 0.13 1.42 1.77 0.13

©2011 Waters Corporation | COMPANY CONFIDENTIAL 35
Interfacing the PATROL UPLC Laboratory Analyzer to the UNIQSIS FloSyn™ System
A continuous flow reactor can be
directly connected to the PATROL
UPLC Analyzer for online analysis
©2011 Waters Corporation | COMPANY CONFIDENTIAL 36
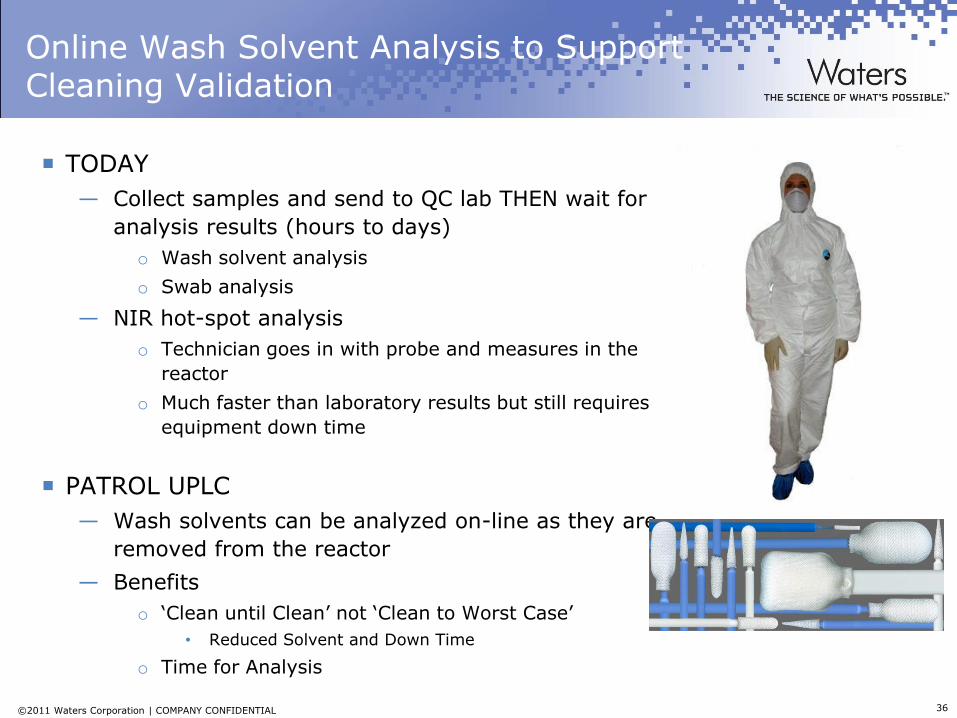
TODAY
— Collect samples and send to QC lab THEN wait for
analysis results (hours to days)
o Wash solvent analysis
o Swab analysis
— NIR hot-spot analysis
o Technician goes in with probe and measures in the
reactor
o Much faster than laboratory results but still requires
equipment down time
PATROL UPLC
— Wash solvents can be analyzed on-line as they are
removed from the reactor
— Benefits
o ‗Clean until Clean‘ not ‗Clean to Worst Case‘
• Reduced Solvent and Down Time
o Time for Analysis
Online Wash Solvent Analysis to Support Cleaning Validation

©2011 Waters Corporation | COMPANY CONFIDENTIAL 37
Power of UPLC™/UV:One Cleaning Validation Analytical Method
AU
0.00
0.20
0.40
0.60
0.80
1.00
1.20
1.40
1.60
1.80
2.00
Minutes
0.00 0.10 0.20 0.30 0.40 0.50 0.60 0.70 0.80 0.90 1.00
1
23
4
5
6/7*
8
A pharmaceutical company had 8 individual cleaning
validation methods for 8 different API‘s.
The goal is to develop one analytical method for all 8 API‘s.
With UPLC™, one UV method with LOD‘s from 0.1 to 2 ppm
was successfully developed.
*APIs 6 and 7 are never
manufactured sequentially
©2011 Waters Corporation | COMPANY CONFIDENTIAL 38
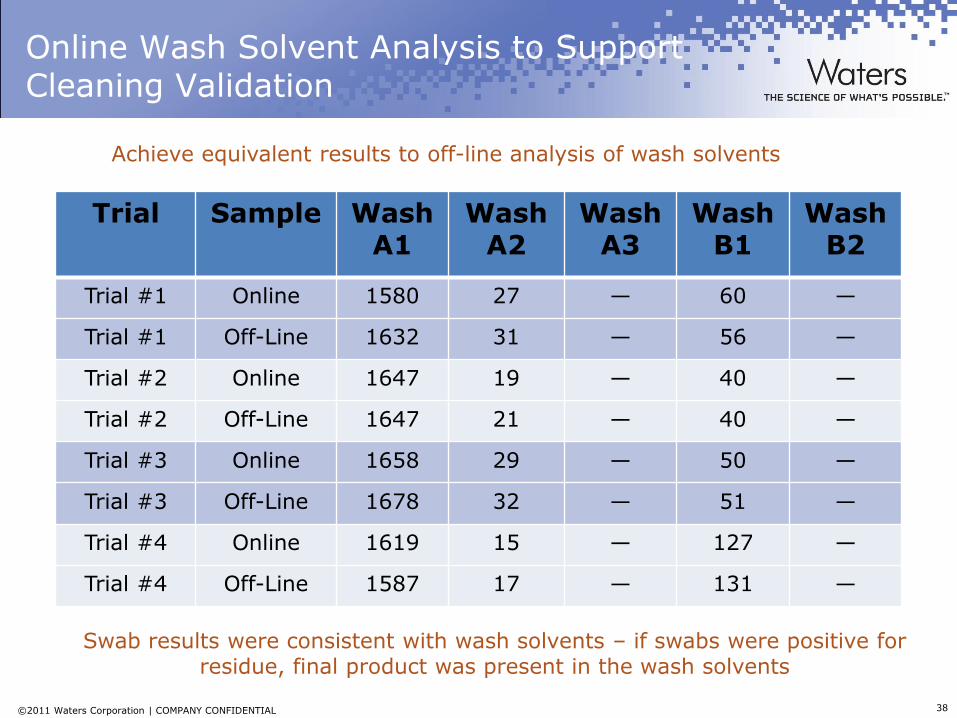
Online Wash Solvent Analysis to Support Cleaning Validation
Trial Sample Wash A1
Wash A2
Wash A3
Wash B1
Wash B2
Trial #1 Online 1580 27 — 60 —
Trial #1 Off-Line 1632 31 — 56 —
Trial #2 Online 1647 19 — 40 —
Trial #2 Off-Line 1647 21 — 40 —
Trial #3 Online 1658 29 — 50 —
Trial #3 Off-Line 1678 32 — 51 —
Trial #4 Online 1619 15 — 127 —
Trial #4 Off-Line 1587 17 — 131 —
Swab results were consistent with wash solvents – if swabs were positive for residue, final product was present in the wash solvents
Achieve equivalent results to off-line analysis of wash solvents

©2011 Waters Corporation | COMPANY CONFIDENTIAL 39
Online Wash Solvent Analysis by UPLC Meets the Required Sensitivity Levels
Starting Material R2 = 0.9990Final Product R2 = 0.9996
100ng/mLCompound LOD
(s/n = 3)LOQ
(s/n = 10)
Starting Material 31 ng/mL 102 ng/mL
Final Product 24 ng/mL 80 ng/mL
Results were consistent whether monitored online or off-line for multiple batches
Positive results by swab testing also resulted in positive results for online analysis

©2011 Waters Corporation | COMPANY CONFIDENTIAL 40
Automated Process AnalysisBiopharm Downstream Processing
DOWNSTREAMUPSTREAM

©2011 Waters Corporation | COMPANY CONFIDENTIAL 41
Downstream ProcessingBiopharmaceutical Purity Analysis
COLLECT WASTE
0 12 hours
Main Peak widths are measured in Hours

©2011 Waters Corporation | COMPANY CONFIDENTIAL 42
Original InProcess HPLC Separation
Biopharmaceutical Downstream Analysis
40 minute Cycle Time

©2011 Waters Corporation | COMPANY CONFIDENTIAL 43
Downstream ProcessingBiopharmaceutical Purity Analysis
0 12 hours
Main Peak widths are measured in Hours
40 minute HPLC analysis
A minimum of 160L
requires reprocessing
Initial process recovery
yield 40%
Final recovery yield after
reprocessing
58%
COLLECT WASTEREPROCESS

©2011 Waters Corporation | COMPANY CONFIDENTIAL 44
PATROL UPLC InProcess SeparationBiopharmaceutical Downstream Analysis
3 minute Cycle Time (+90% Reduction)- No loss of information

©2011 Waters Corporation | COMPANY CONFIDENTIAL 45
Downstream ProcessingBiopharmaceutical Purity Analysis
0 12 hours
Main Peak widths are measured in Hours
3.5 minute UPLC analysis
No fractions need to be
reworked
Total initial process
recovery yield
of 87% (40%/58%)
6 month ROI
COLLECT WASTE

©2011 Waters Corporation | COMPANY CONFIDENTIAL 46
Process Stream Sampling
For samples requiring physical filtration and/or aseptic
sampling, PATROL can be integrated with multiple
technologies
— Flownamics
— Bayer Technologies
— Sentry IsoLOK
— Nova Biomedical

©2011 Waters Corporation | COMPANY CONFIDENTIAL 47
PATROL System Application Flexibility and Robustness
Real-time results
Ease of Use
Flexible (Applications)
Rugged & Robust
Serviceability

©2011 Waters Corporation | COMPANY CONFIDENTIAL 48
―Hot Swap‖
Prequalified Modules
Metrology Service
Qualification Services
Uptime and Serviceability
Real-time results
Ease of Use
Flexible (Applications)
Rugged & Robust
Serviceability

©2011 Waters Corporation | COMPANY CONFIDENTIAL 49
UPLC for Inprocess Analysis
UPLC enables LC to have “real time” speed
— Routine analysis in <4 minutes
User Friendly
— Doesn‘t require extensive sample handling or prep
— Full automation from sample to report
Large linear dynamic range with excellent selectivity and
sensitivity
— Ability to quantitate major components and low-level impurities
Single technology from Discovery through Manufacturing
— Archived data for Quality by Design efficiency
UPLC performance for use on the Manufacturing Floor

©2011 Waters Corporation | COMPANY CONFIDENTIAL 50
www.waters.com/patrol

©2011 Waters Corporation | COMPANY CONFIDENTIAL 51
Thanks to:
Tanya Sylvain Bob Rob JennJenkins Cormier Tacconi Herbert Burzynski