Embed Size (px)
Citation preview

i
Utilizing culturally appropriate diet assessment
tools: Proposal for comprehensive data collection of
dietetic information in South Asian populations
by
Karthika Yogaratnam
B.Sc. (Honours) McMaster University, 2014
B.A. (Honours), McMaster University, 2016
PROJECT SUBMITTED IN PARTIAL FULFILLMENT OF
THE REQUIREMENTS FOR THE DEGREE OF
MASTER OF PUBLIC HEALTH
in the
Faculty of Health Sciences
© Karthika Yogaratnam 2018
SIMON FRASER UNIVERSITY
Spring 2018
All rights reserved. However, in accordance with the Copyright Act of Canada, this work may be reproduced, without authorization, under the conditions for Fair Dealing. Therefore, limited reproduction of this work for the purposes of private
study, research, criticism, review and news reporting is likely to be in accordance with the law, particularly if cited appropriately.
ii
Approval
Name: Karthika Yogaratnam
Degree: Master of Public Health
Title: Utilizing culturally appropriate diet assessment tools: Proposal for comprehensive data collection of dietetic information in South Asian populations
Examining Committee: Chair: Dr. Malcolm Steinberg Program Director Faculty of Health Sciences
Dr. David Whitehurst Senior Supervisor Assistant Professor Faculty of Health Sciences
Rachel Douglas Supervisor Evaluation Specialist, Population Health Observatory Fraser Health
Dr. Kimberly Miller External Examiner Knowledge Translation Leader Sunny Hill Children’s Centre
Date Defended/Approved: April 9th, 2018
iii
Abstract
Context: The growing prevalence of type 2 diabetes among South Asians has been
identified as a public health concern globally, sparking interest in improving dietary data
collection strategies from individuals within this population. Peer-reviewed research has
suggested that dietary assessments, coupled with diet and lifestyle modifications, can
improve disease outcomes. Research also suggests that the collection of dietary
information needs to be culturally appropriate for the population of interest.
Objective: To provide an overview of the use of culturally modified diet assessment
tools, and their success in data collection, within nutritional epidemiology literature.
Methods: Papers published between January 2006 and January 2018 were identified
from 3 electronic databases, supplemented with manual searches of reference lists. The
data extraction focused on whether culturally appropriate diet assessment tools had
been used with minority or South Asian populations, and whether they yielded response
rates >60%.
Results: Twenty-four papers were identified. Food frequency questionnaires (n = 18)
were the most commonly administered diet assessment, and often used in conjunction
with a 24-hour diet recall. In studies where both tools where used (n = 6), the response
rates were found to be >60%. All studies included in the review had used a culturally
adapted version of the diet assessment tool.
Conclusion: Although diet assessment methods can be effective for data collection, the
use of culturally adapted tools and interviewer-based administration are important for
improved data quality and completeness among minority populations. However, prior to
implementation of any tool in a larger scale study, pilot testing of the tools on a
representative sample of the study population will be required.
Keywords: diet assessments; food frequency questionnaire; ASA24-Canada diet
recall; data collection; Punjabi Sikh; South Asians
iv
Acknowledgements
I would like to take this opportunity to thank the following individuals who helped
make this capstone process possible:
First, I would like to thank both Dr. David Whitehurst and Dr. Kimberly Miller for
providing me with opportunity to work under their supervision and mentorship. I
am also grateful for Dr. Whitehurst for stepping into the supervisory role on such
short notice, and his guidance throughout this project.
Thank you to Rachel Douglas and the SEHAT team (Dr. Arun Garg, Roman
Bhangoo, Deljit Bains, Ruby Bassi, and Karin Rai) for providing me with their
unwavering support and enthusiasm. I am incredibly grateful for Rachel’s
understanding and flexibility throughout this process, as it was invaluable to the
success of my capstone and provided an amazing opportunity to work with her
and the team. The team’s willingness to accommodate my timeline and needs for
the project made this experience much more comprehensive, as my inclusion in
team meetings and discussions enhanced my learning along the way.
Finally, thank you to my family & friends (and friends who have become family),
who have provided their unwavering support throughout my graduate journey.
v
Table of Contents
Approval ............................................................................................................................... ii Abstract ............................................................................................................................... iii Acknowledgements ............................................................................................................. iv Table of Contents ................................................................................................................ v List of Tables ...................................................................................................................... vii List of Figures .................................................................................................................... viii List of Abbreviations ............................................................................................................ ix Glossary .............................................................................................................................. x
1. Introduction ............................................................................................................. 1 Population Demographics ........................................................................................ 1 SAHI study population ............................................................................................. 2 Public Health Concern: South Asian Diet and Health ............................................. 3 Fraser Health: SAHI’s Previous Strategies ............................................................. 6 Research Question .................................................................................................. 8
2. Methods ................................................................................................................... 9 2.1. Data Sources and Search Strategy ......................................................................... 9 2.2. Selection Criteria ...................................................................................................... 9 2.3. Data Extraction....................................................................................................... 10
3. Results ................................................................................................................... 11 3.1. Reported Response Rates of Previous Research ................................................ 11 3.2. Assessment of Dietary Intake ................................................................................ 12 3.3. Current Diet Assessment Methodologies .............................................................. 14
3.3.1. Weighed diet records ...................................................................................... 15 3.3.2. 24-hour diet recall ........................................................................................... 16 3.3.3. Food frequency questionnaire ........................................................................ 17 3.3.4. Novel diet assessment tools ........................................................................... 18
4. SEHAT Pilot Project Proposed Tools ................................................................. 20 4.1. Current Standardized Assessment ........................................................................ 20
4.1.1. SHARE Food Frequency Questionnaire ........................................................ 21 4.2. Web-based Assessment ........................................................................................ 22
4.2.1. SurveyMonkey 24HDR ................................................................................... 22 4.2.2. ASA24-Canada-2016 ..................................................................................... 23
4.3. SEHAT-specific Diet Assessment Protocol ........................................................... 24 4.3.1. Rationale for using a combination of tools ..................................................... 25
5. Discussion ............................................................................................................. 27
References ....................................................................................................................... 32
Appendix A1. PRISMA Literature Review Search Strategy ................................. 39

vi
Appendix A2. Database Search Strategy ............................................................... 40
Appendix B. Results of Literature Review ............................................................. 41
Appendix C. SEHAT New Diet Survey .................................................................... 47
Appendix D. SEHAT Participant Diet Log .............................................................. 51
Appendix E. B & B Baseline Survey – Screener: Brief 24 HDR ........................... 52
Appendix F. Langar Hall Observation Log ............................................................ 53
Appendix G. SHARE South Asian FFQ .................................................................. 54
Appendix H. Overview of the ASA24 Respondent Websites and
Considerations Related to Data Security and Participant Confidentiality ..................................................................................... 58
Appendix I. Critical Reflection................................................................................. 74

vii
List of Tables
Table 1. Inclusion & exclusion criteria for studies using diet assessments, and/or reporting response rates ........................................................................... 10
Table 2. Advantages and limitations of current diet assessment methods. .................... 14
Table 3. Strengths and limitations of digital diet assessment methods. .......................... 18
Table 4. Order and content of ASA24 diet recall's multiple pass system. ....................... 24
Table 5. Results of studies included to determine the effectiveness of existing diet assessment tools. ..................................................................................... 41

viii
List of Figures
Figure 1. South Asian Population residing in the Fraser Health region (by census). ........ 1
Figure 2. Systematic phases of diet assessments. .......................................................... 12
Figure 3. Framework for individual diet assessments. ..................................................... 13
Figure 4. Flow chart of literature review search strategy. ................................................ 39

ix
List of Abbreviations
24 HDR 24 Hour Diet Recall
BMI Body Mass Index
CNF Canadian Nutrient File
CVD Cardiovascular Disease
FFQ Food Frequency Questionnaire
FHA Fraser Health Authority
FPQ Food Propensity Questionnaire
M-CHAT The Multicultural Community Health Assessment Trial
MALASA The Mediators of Atherosclerosis in South Asians Living in America
NCI National Cancer Institute
PDA Personal Digital Assistant
SAHI South Asian Health Institute
SES Socioeconomic Status
SHARE The Study of Health Assessment and Risk in Ethnic groups
T2D Type 2 Diabetes
WHO World Health Organization

x
Glossary
Acculturation Concept related to culture that is used as a descriptive variable, assuming that cultural knowledge, attitudes, and beliefs lead to certain behaviours and influence health choices
Culture Within the context of healthcare, culture is defined as distinct learned and shared values, beliefs, and practices that associated with health-related behaviour or influence the acceptance of health-related messages
Cultural competence In health care, cultural competence is defined as a system that acknowledges and incorporates—at all levels—the importance of culture, the assessment of cross-cultural relations, awareness of the dynamics that result from cultural differences, expansion of cultural knowledge, and adaptation of services to meet culturally unique needs
Ethnicity A concept recognizing that people tend to identify themselves with social groupings based on unique cultural grounds—including language, lifestyle, religion, food and origins
South Asian South Asian ethnicity is defined as having descended from the South Asian subcontinent—including Bangladesh, Bhutan, India, Nepal, Pakistan or Sri Lanka
‘Western’ Western culture is a term used broadly to refer to a tradition of social norms, ethical and moral values, customs, belief and political systems, and specific artifacts and technologies that either originated or have an association with Europe
Health literacy The degree to which individuals can access, process, and understand basic health information and services in order to make informed and appropriate health decisions
.

1
1. Introduction
Population Demographics
Between 2006 and 2016, the population of Canada increased in number by
nearly 11%, while simultaneously expanding in ethnic diversity1. The 2011
National Health Survey (NHS), found that the major source countries contributing
to the demographic shift in Canada, were India and China2. Approximately 25%
of the visible minorities in Canada identify as South Asians—a population group
comprised of individuals from Bangladeshi, Indian, Pakistani, and Sri Lankan
origins1,3. South Asians encompassed nearly 15% of the visible minority
population living in the Fraser Health region (see Figure 1), launching the South
Asian Health Institute (SAHI) in 2013—aimed to support the development of
culturally appropriate health promotion practices to improve the health of this
population4,5. SAHI was created by Fraser Health as a means to better
understand health needs of the South Asian population, and to support programs
and services that are aimed at improving health outcomes of this population
using innovation and evidence-based care strategies5.
Figure 1. South Asian Population residing in the Fraser Health region (by census)5.
2
SAHI study population
South Asian immigration into Canada began to increase into the 1900s, bringing
in individuals who were younger, educated, and in good health upon arrival5. The
progressive degeneration of their health after settling in Canada has been
hypothesized to be due to the ‘healthy immigrant effect’, whereby immigrants
arrive in a better state of health than their Canadian-born counterparts, however
as their length of residency increases their health declines6. The deterioration in
health is assumed to be caused by the changes in meal patterns, among other
factors such as decreased physical activity, where there has been a stark
increase in the consumption of convenience foods and take-out meals throughout
the day7. The hypothesis is that the adaptation of Western food practices, while
still maintaining aspects of their traditional diets, may play a role in the increased
disease burden seen across South Asian populations7-9.
The family unit, especially in the intergenerational context, plays a central role in
the Punjabi Sikh identity10. When implementing behavioural changes at the
individual level, the intersections between culture, gender and gendered roles,
and class need to be taken into consideration—as food preparation and
consumption are highly regarded as forms of familial affection and care practices
10,11. Gender roles also play a significant role in food consumption patterns, as
females are often responsible for meal preparation—rendering men unaware of
what goes into the foods they consume at meal times10. The communal nature of
food has also been documented within Gurdwaras (Sikh temples), where
offerings notably contain large amounts of fat and sugar5,10.
Acknowledging the heterogeneity of South Asians in Canada, the sub-group of
interest for the purpose of SEHAT’s* pilot research project will be the Punjabi
Sikh populations of Abbotsford and Surrey, British Columbia. This South Asian
* Under SAHI’s broader mandate, in mid-2015, the SEHAT Wellness Ambassadors, a health promotion program, was developed to address the increased rates of chronic disease among the South Asian population living in the Fraser Health region, where “Apnee Sehat” translates to “My Health” in Punjabi5.

3
sub-group originates from the Northern Indian province of Punjab10. According to
the NHS data, Sikhs accounted for nearly 5% of Vancouver’s population7,12. With
such a large subgroup of this population residing across British Columbia,
culturally appropriate health information and data collection methods are
required.
Public Health Concern: South Asian Diet and Health
The expansion of cultural diversity in Canada highlights the growing need for
cultural competency in research and clinical practice. In order to understand the
specific health needs of the population served, cultural differences in dietary
patterns and food preparation must be considered and documented. Compared
to their European counterparts, South Asians have a higher prevalence of
glucose intolerance and diabetes7,13,14. However, culturally relevant research,
educational and clinical tools are still lacking for this population.
The nature of diet patterns and food preparation among South Asians vary
significantly across subgroups9. Migration and years lived in host country may
play a large role in current dietary patterns9. Dietary acculturation is a
phenomenon that is considered context-specific, and differences in sociocultural
environments and food changes may invoke differing responses across ethnic
groups7,8,15. However, the acculturation hypothesis warrants the need for more
research in order to understand the differential dietary habits across generations
as well9.
Although many families still continue to prepare and consume traditional meals,
research shows that the consumption of ‘Western’ foods does occur—especially
for breakfast, lunch, or as snacks throughout the day, even branching into the
occasional take-out dinners7. This change in dietary behaviour has been noted
globally, where South Asians residing in Britain have been found to consume
diets higher in fat and energy, those who immigrated to Scotland consume more
fats (particularly saturated fats), and those living in Canada consume less fats but

4
higher quantities of sugar and total carbohydrates7. These variations highlight the
need for researchers to be attentive to the importance of understanding not only
cultural influences of food, but how language, environmental, social and historical
contexts shape the dietary behaviours of South Asian populations7. Little
research has explored the influence of family or household dietary patterns10, as
much of the research conducted has been focused on individual health
behaviours.
In a study that looked at the cultural connections surrounding lifestyle changes
made by Punjabi Sikh men following a myocardial infarction, it was found that
participants were willing to change their dietary patterns but were often unable to
do so when the family unit played a large role in food consumption behaviour10.
The use of high-fat dairy, especially when cooking with ghee (i.e. clarified butter,
and whole milk), is of common practice among South Asian households10.
Research conducted in the United States has found that there were three
prevalent dietary patterns across this population: an increased consumption of
animal protein, sweets, fried snacks, high-fat dairy, and sugar-sweetened
beverages; and a lower consumption of vegetables, fruits, nuts and legumes,
which have been previously identified as contributors to weight gain, adiposity,
and ß-cell dysfunction16,17,18.
Non-communicable diseases are notably the leading cause of morbidity and
mortality on a global scale19. Analysis of type II diabetes (T2D) rates has shown
the prevalence to be greater among migrant populations, specifically among
South Asians, where research has found a greater prevalence and early onset
compared to other ethnic subgroups20. Certain metabolic risk factors, such as
waist circumference, dyslipidemia, and deregulated glucose and insulin, underlie
the oxidative stressors that trigger the early onset of CVD and T2D within this
population16,21. As such, counselling for dietary information is a critical practice
for prevention and treatment of medical conditions, and is often undertaken in
primary care22. Physicians reported that the integration of electronic diet
assessment tools may be helpful in facilitating discussions with patients about

5
their current diet quality, and how they can assist them in determining changes in
these eating behaviours22. Most also report the potential ease and importance of
administering, at the least, basic diet assessment tools which report food groups,
portion sizes and whether patients are preparing foods at home or eating out, to
address concerns in appointments with patients—especially if physicians do not
have prior training in nutrition22,23.
Health literacy plays a large role in the management of chronic diseases and can
often serve as a barrier for racialized† or minority populations. Language and
literacy barriers can affect medication adherence and self-care practices, as
these vary widely—as knowledge, attitudes and cultural norms differ within this
heterogeneous population24. Lower health literacy levels among newer
immigrants can especially be a barrier to not only accessing health services but
also from participating in clinical research, as many do not understand English,
and may not be able to read or write in their native language24-26.
With an increased chronic disease burden among South Asians, the paradox of a
low body mass index (BMI)‡ and a high incidence of obesity and its related co-
morbidities emphasized the importance of culturally specific health measures5,27.
Modifiable lifestyle behaviours, including diet and exercise, are often found at the
center of population-level public health strategies for risk mitigation, diabetes
prevention and management16,28. However, these health behaviour parameters
among South Asians are not as well documented, and thus are of particular
† Race, as a social construction, often defined through biological concepts—using arbitrary physical traits (i.e. skin colour, hair texture)—creating a racial hierarchy based on visible differences in physical characteristics87. Racialized groups are socially constructed categories, through the process of racialization, resulting in these groups receiving unequal and differential treatment, compared to members of the dominant group87. Many individuals who belong to a racialized community, may face continued inequalities (social, economic, political, and health related)—regardless of being a newcomer, Canadian-born, or having resided in Canada for many years88.
‡ Recent recommendations for BMI cut-offs have been developed for South Asians, where the overweight cut-off begins at 23.0 kg/m2, due to tendency towards central adiposity for this population5. As such, this recommendation needs to be taken into consideration when assessing these individuals for health-related concerns.

6
interest for public health research for better health promotion and nutrition
education for this community5,7.
Using European-defined BMI cut-offs has been shown to be problematic,
especially in different ethnic groups due to variations in lipid distribution and
glucose profiles29. This one-size fits all approach to assessments underestimates
the risk factors in populations of non-European descent and is an issue that
stems into assessments of health and diet-related factors19,29,30. With diet
assessments, using a ‘standardized’ tool is not possible, as food consumptions
patterns and behaviours vary within and across populations, with differences in
cultural and environmental exposures31. As such, clinicians and researchers
need to tailor health services and assessment methods to better reflect the
literacy levels of South Asians. This includes understanding specific cultural
norms and beliefs, as well making efforts to integrate community-based
participation to better inform their respective practices.
Fraser Health: SAHI’s Previous Strategies
As a community-based health promotion program with the South Asian
population in the Fraser region, initial focus of the SEHAT program was to work
with local Sikh Gurdwaras to change cooking practices and provide information
about healthy eating to the congregation. Previous program monitoring for the
SEHAT program had developed and used various tools to collect the dietary
information from participants at the individual level.
Previous tools employed by SAHI include the ‘SEHAT Program Participant Diet
Log’, the ‘New Diet Survey’, ‘B & B Baseline Survey’, and the ‘Langar Hall
Observational Log. The ‘New Diet Survey’ (see Appendix C) is a short food
screening tool that aimed to collect basic health and food intake (particularly
added sugar, salt and fat consumption) information from community members
who frequent the local Gurdwaras. The ‘SEHAT Program Diet Log’ (see
Appendix D) is a form of a 24-Hour Diet Recall (24 HDR)/food diary that

7
participants were required to fill out for 3 consecutive days (2 weekdays and 1
weekend). The B & B Baseline Survey (see Appendix E) is a short 24 HDR tool,
intended to collect information about the beverage consumption and typical meal
patterns of South Asian employees working at B & B Truss, a manufacturing
company located in the Lower Mainland, Surrey, BC. The Langar Hall
Observational log (see Appendix F), is a tool used by SAHI’s research team to
estimate food consumption patterns at Gurdwaras in Surrey, based on patterns
using a naturalistic observation strategy.
Each of the previous strategies employed resulted in extremely low participant
response rates (RR) and poor-quality data, where questionnaires were
incomplete, which may be the result of not using a culturally appropriate
assessment tool with the population. For the SEHAT Program Participant Diet
logs, of the 15 participants who initially consented to complete the logs, four diet
logs were completed and sent back for analysis (RR = 26.7%). For both the diet
survey and the B & B Truss 24 HDR, response rates were much higher (~100%)
due to interviewer administration of both tools, offered in both English and
Punjabi (n = 40, & n = 44, respectively). However, data quality suffered due to
difficulties with recall, estimation of portion sizes and potential misclassification of
food items. This could have been mitigated by improved interviewer training, but
implementation timelines did not allow for this during the initial pilot.
The Langar Hall Observation logs serve as a tool that allows the researchers to
estimate what individual and group diet behaviours are in the temple setting.
However, since they are based on arbitrary estimates of food portions seen on
plates, this tool introduces observer bias and measurement error for the intended
research. Food models and photos of serving sizes accompanied the observation
tool to help mitigate this, but observations were still quite subjective.

8
Research Question
Based on the background information on the health outcomes of South Asians,
and the inadequate data collection from prior research strategies, Fraser Health
Authority is seeking out methodologies to improve the response rate and data
quality of health-related questionnaires administered to the population of interest.
To address Fraser Health’s questions, the subsequent chapters of this review are
structured in two phases: (i) a literature review will be conducted to identify
significant methodological challenges with dietary assessments of South Asian
populations in Canada, particularly to identify challenges in using and collecting
culturally tailored information and (ii) suggestions for future directions for Fraser
Health’s future pilot project.
Chapter 2 describes the methodology for the literature review process,
highlighting the inclusion, exclusion criteria and the search strategies used.
Chapter 3 encompasses a review addressing whether current diet assessment
tools are effective measures of dietary patterns when used in research and
clinical practice, and whether online dietary assessment tools have been found to
be effective means of data collection.
Secondary objectives are addressed in Chapter 4 and are meant to gauge
whether a combination of existing tools will be culturally and linguistically
appropriate methods to improve participant response rates. Specifically, whether
this strategy can be administered to 30-to-60-year-old Punjabi Sikh community
members living in both Abbotsford and Surrey, B.C., as part of Fraser Health’s
future pilot project. Next steps will be to assess whether the interview-
administered SHARE study FFQ and the ASA24-Canadian online 24 HDR, and a
web-based self-administered 24 HDR may yield greater participant response
rates among this population.

9
2. Methods
This is not intended to be a comprehensive review of dietary assessment
methodologies, as those are widely available in existing literature.
2.1. Data Sources and Search Strategy
After an initial general search, the findings lead to a more refined, structured
search of the literature for articles published in the English-language between
January 2006 and January 2018 from the following databases: PubMed, Medline,
and Science Direct, along with manual searches conducted for previously cited
references, grey literature including publications and dissertations by Health
Authorities and other government bodies. The search strategy used was
comprised of the following MeSH terms: ‘culturally appropriate’, ‘dietary data
collection’, ‘diet assessment’, ‘clinical practice’, ‘research’, ‘South Asians’, ‘food
frequency questionnaires’, ‘24-hour recalls’, ‘weighed food diaries’, ‘ethnic foods’,
‘minority group’, ‘diet surveillance’, ‘nutrition’, ‘health literacy’, ‘nutritional
epidemiology’, ‘reductionist theory’, and their combinations. The database search
strategy is provided in Appendix A2.
2.2. Selection Criteria
Eligibility of papers was identified using a two-staged approach, with an initial
general search of the evidence available on diet assessment tools using Google
Scholar. Due to the broad nature of the initial search and the search engine used,
this stage allowed for identification of exclusion criteria to be applied during the
second search. Reference to use of one or more diet assessment tools as a
measurement tool, and ‘response rates’ as an outcome measure were sufficient
for inclusion during this stage. The initial stage also required that papers be
written in English and published in peer-reviewed journals. All full text papers
were collected for those that met the inclusion criteria from the initial search.

10
The second stage was the opportunity to further refine the inclusion criteria
(Table 1) for the review, specifically that the diet assessment tools were used to
obtain data from minority or South Asian population groups. Studies and reviews
focused on the validation of diet assessment methods for children, adolescents,
and pregnant or breastfeeding women, were excluded as a result.
Table 1. Inclusion & exclusion criteria for studies using diet assessments, and/or reporting response rates
Inclusion Criteria Exclusion Criteria
• Studies using culturally
appropriate dietary assessment
tools
• Studies using combined dietary
assessment methods
• Studies conducted in Canada,
USA, Europe and South Asia
(specifically India, Sri Lanka)
• Studies conducted on: children, adolescents,
pregnant or breastfeeding women
• Reviews of dietary assessment tools
• Studies explaining the development of dietary
assessment tools
• Articles written in a language other than English
• Studies reporting <60% response rates of
administered dietary assessments
2.3. Data Extraction
The data extraction focused on whether culturally appropriate diet assessment
tools have been administered in previous research with minority or South Asian
populations, and when reported, whether the tools used yielded response rates
of significance. Specific considerations for response rates were made to identify
methodologies applicable for the population seen through Fraser Health, where
previous strategies were not effective in garnering responses from participants
(<20%). Due to the nature and scope of this review, ethics approval was not
required.

11
3. Results
3.1. Reported Response Rates of Previous Research
The search resulted in 24 research studies included in the following review (see
Appendix B). Across existing evidence on diet assessment tools that have been
administered in research, multiple studies (see Appendix B) have found the use
of culturally tailored tools to garner better participant response rates and data
quality in terms of completeness9,31-42. Research conducted on a subsample of a
specific population selected from larger ongoing trials, have found that using
specific tools that are user-friendly, easy to administer, and provide participants
with detailed information (i.e. common household measures in addition to
western-style measurements of cups and spoons), participants are more
compliant and provide more complete data43-47. Improvements in data quality
were observed when the tools administered were reflective of the participants’
food consumption patterns39. Using diet assessment tools that are easy to
understand, both culturally and linguistically30, and include foods that participants
are familiar with, assist in gathering good quality data40-42.
For the types of diet assessment tools administered, most studies have applied
the use of a single, population-specific food screener9 or FFQ8,15,36,38,39-41,44,46-48,
whereas some studies have combined multiple tools (24HDR, electronic diet
assessments) to assess population and individual level dietary behaviours31-
35,37,42,49,50. When multiple tools were administered in conjunction, the resulting
response rates were much greater (Table 5), which may have been a result of
the interview-based administration method used across these studies.
These aspects must be taken into consideration when developing a pilot or large-
scale study that may require the use of online data collection tools.
Based on the evidence currently available from clinical research settings, further
exploration of the existing and widely used diet assessment methodologies is

12
required to assess which methods are best suited for Fraser Health’s research
needs.
3.2. Assessment of Dietary Intake
In nutritional epidemiology, one of the significant challenges faced by researchers
is the assessment of habitual dietary intake31,51,52. In fact, there is a marked
difference in trying to establish the dietary patterns of specific ethnic groups, as
their inclusion in research is constrained by the interaction of multiple barriers
(i.e., language, culture, low SES), culminating in their underrepresentation in diet-
disease studies51. Figure 2 provides a visual representation of the diet
assessment system, from data collection to processing and classification of food
composition and dietary behaviours53. The simplification of the systematic
process involved in diet assessments, as highlighted in figure 2, provides an
opportunity for researchers to identify and integrate tools to understand the
influence of culture on dietary intakes—ideally within the ‘input’ phase. However,
insufficient development and validation of culturally sound diet assessment tools,
further hinders the understanding of food consumption patterns cross-culturally51.
Figure 2. Systematic phases of diet assessments53.
Limitations in health assessments are not exclusive to disease-specific
parameters but extend to lifestyle and behaviour assessments. The cultural

13
diversity of the Canadian population poses a number of complexities for health
providers and researchers, as the diversification requires improved methods of
data collection and analysis to reflect these changes30.
Accuracy in assessing dietary intakes has emerged as a significant challenge in
nutritional epidemiology, especially in trying to establish associations between
diet and health32,48,54. When conducting large prospective cohort studies,
researchers are often limited in the DA methodologies that would provide them
with the most accurate representation of usual intake55. Resulting in the use of
short-term tools (see Figure 3) that allow for extrapolation of estimates about
participants’ food consumption patterns without imposing participant burden,
which would lead to poor response rate and quality55.
Prior epidemiological research has approached diet-disease associations using a
reductionist lens, with examination of individual nutrients or foods groups
Figure 3. Framework for individual diet assessments55.

14
identified as risk factors for chronic disease outcomes56-58. This warrants a need
to assess the holistic nature of diet-health interactions, as well as differences at
the individual, community and population levels.
3.3. Current Diet Assessment Methodologies
Current standardized diet assessment tools vary in applicability, and their use in
research depends greatly on the methodology employed by researchers. Table 2
summarizes the frequently used diet assessment methods, along with the
specific advantages and limitations of each strategy59-61,62. The most recent study
to explore dietary behaviours of the Punjabi Sikh population in Vancouver had
used a brief food screener to assess dietary intake, however acknowledged the
shortcomings of this strategy, as they were unable to accurately capture the
heterogeneous characteristics of their diets9. Future strategies may require the
use of multiple diet assessment methods in order to ensure that the full scope of
specific cultural diet information is collected63.
Table 2. Advantages and limitations of current diet assessment methods.
Study Design Advantages Limitations
Weighed diet
records
Cross-sectional, Prospective,
Short term; cross-cultural comparisons; low cognitive difficulty; captures details of food prep. & eating occasion; does not rely on memory
High reactivity; requires >20 minutes to complete; requires participants to measure accurately – potential for errors with low literacy levels; not reflective of habitual intake; requires high motivation
24 HDR
Cross-sectional, Prospective, Intervention
“Gold standard”; Captures details of food preparation & eating occasion; total diet; short term; cross-cultural comparisons; low cognitive difficulty; low reactivity; interviewer administered
Recall bias; underreporting; random error; limited to past 24 hours; requires training of interviewers; requires ~20-30 minutes to complete expensive; inaccurate portion size estimates; not reflective of habitual intake
FFQ
Cross-sectional, Retrospective, Prospective, Intervention
Can capture total diet & constituents; long-term; observes diet intake over long period (past week/month/year); easy to administer; cost-effective; less labour intensive; less time-
Systematic errors & recall bias; inaccurate estimates of portion sizes; high cognitive difficulty; needs to be specific to population of interest - no cross-cultural

15
consuming; effective at identifying at-risk populations; better estimate of habitual intake; low reactivity
comparisons can be made; finite list of foods presented
Food Screeners
Cross-sectional, Retrospective, Prospective, Intervention
Easy to administer, long-term; less time-consuming; cost-effective; low reactivity
Only looks at parts of a diet; does not capture details of food prep. & eating occasion, no cross-cultural comparisons; recall bias
3.3.1. Weighed diet records
The weighed or estimated diet record (or food diary) is an assessment method
that requires participants to record all foods and beverages they consume over a
specified period of time (usually anywhere from 24 hours, to 3 to 7 days)49,64.
Often this method of recording warrants the need for participants to weigh their
food and beverage consumption, which allows for the most accurate depiction of
individual food intake61. Due to the level of detail required by participants when
completing the diet record, there are no restrictions placed on the types of food
recorded, thus allowing for cross-cultural utility49. Although weighed food records
were once acknowledged to be the gold standard61,65 among diet assessment
methods, there are still many limitations found with this tool.
Although the detail collected through weighed or estimated diet records provide
more accurate information about individual dietary behaviours, this can be
hindered by one’s literacy levels—especially when they are unfamiliar with
standard measurement tools49,61. Since there is no method of validation available
for this self-reported food record, researchers are often limited to assumptions of
participant literacy levels, and their ability to make accurate estimations of portion
sizes34. Often participants tend to be more reactive to such methods, due to the
required documenting of all foods and beverages consumed over the course of
the tracking period, which can often lead to alterations of usual intake, or
underreporting43,61,64. Aside from the low participant compliance, the data
analysis for these records can become quite expensive for researchers43.

16
3.3.2. 24-hour diet recall
Similar to the weighed or estimated food records, 24-hour diet recalls (24 HDRs)
are considered to be a more accurate form of data collection66. Usually
administered by a dietitian during a one-on-one interview with participants, they
are able to collect detailed information about their food and beverage
consumption over the previous 24 hours55. Interviewers can probe individuals for
more information by providing prompts (i.e., food photographs, pictures of portion
sizes, etc.) based on the details the participant provides, which avoids any
omissions that may go unrecorded through self-report methods67. The
importance of well-trained interviewers becomes critical when using this method
of data collection, as they need to be aware of food and food consumption
practices in order to probe for more detailed answers67. Since there is no
limitation on the types of foods that can be recorded, the 24 HDR can also be a
useful tool in describing average food intake at the population level49. There is no
direct need for participants to have a high literacy level since these records are
administered via interview67.
Similar to the food records, 24 HDRs are not without their limitations. The
requirement for participants to recall their food and beverage intake, from the
previous 24 hours, can lead to high participant burden and recall bias61,64,65. Due
to the nature of the interview, participants may not recall all foods consumed67.
This method often requires a multiple pass method, whereby an average intake
can be documented over the course of multiple days61,67. The required training
and cost of implementing interviewers to administer the 24 HDR can serve as a
hindrance for researchers, as it is an expensive method of data collection for
large cohort studies67. Amongst the South Asian population, use of a 24 HDR
may not accurately portray average intake as it does not track variations that may
occur seasonally, which may neglect food consumption patterns during festivities
or holidays throughout the year35.
17
3.3.3. Food frequency questionnaire
The food frequency questionnaire (FFQ) has become the most commonly used
diet assessment tool in large epidemiological studies, specifically when
researchers want to estimate habitual intake patterns and identify diet-disease
associations36,50,66. Due to the specific nature of the FFQ, dependent on the
population of interest and cultural variations in food intake, the FFQ must be
validated for that population and often cannot be used across studies67,68.
Since researchers are required to adapt their FFQs for each specific population,
the ability to culturally tailor FFQs, makes them the easy to develop and
administer67. FFQs have the ability to track seasonal variations in food
consumption patterns, as well as can assess habitual intake with the
administration of a single questionnaire44,55. Due to the low respondent burden,
these self-reported questionnaires can be easily administered in large scale
studies, making them the most practical, cost-effective and accessible tool
available to researchers43,65.
As with the previous methods, FFQs have their limitations, particularly with the
length of the questionnaires67. Depending on the frequency of administration, the
FFQ may not provide enough information about habitual intake if the
questionnaire does not include a comprehensive food list43,61,65,67. The required
validation of the tool against the 24 HDR serves as a limitation due to the
variations in data collection across the two methods61. FFQs also require
participants to recall their dietary habits over a longer period of time (typically
over the last year), which may lead to recall bias, underreporting, and an overall
misinterpretation of their habitual intake patterns43,61,65,67.
Despite the limitations listed, the FFQ still stands to be the most cost-effective
strategy for dietary data collection in larger cohort studies, as long as the tool
used has been previously validated for the current study population. For the
purpose of the pilot project, Fraser Health will be administering the FFQ

18
developed for the SHARE study, that was developed and validated for use with
South Asians living in Canada16,81.
3.3.4. Novel diet assessment tools
Aside from being able to use a combination of diet assessment tools in research,
new developments have been made to ease the process of administering these
tools, as researchers have developed multiple web-based diet tools that allow for
ease of data collection and analysis22,45,62,69,70.
As shown in Table 3, all three diet assessment tools have the capacity to be
administered online70. These tools employ various technological instruments,
including but not limited to, interactive computer and web-based technology,
personal digital assistants, mobile devices, cameras, tape recorders, sensor
technology62. By employing technology in this process, researchers are able to
facilitate simple data recording, and are able to access the information
immediately37.
Table 3. Strengths and limitations of digital diet assessment methods.
24-H diet recall Diet records FFQ
Required technology
Software, internet Software, internet, PDA, mobile phone, smartphone application
Skip algorithms, questions with multiple details, pictures of foods
Strengths
Standardized data collection (reduced interviewer bias); reduced time and costs; improved feasibility
Standardized real-time data collection; reduced time and costs; improved feasibility
Collection of complex information; high accuracy of data
Limitations Self-report bias Self-report bias; requires
participant training for technology
Measurement errors of the FFQ methodology
These advances have the ability to improve the validity and accuracy of the
dietary data that is collected, and has the potential to reduce participant

19
burden52,70-72. However, these methods are not immune to the limitation of self-
report bias, and the requirement of high technological literacy from participants70.

20
4. SEHAT Pilot Project Proposed Tools
The rationale of the proposed pilot project is to assess the strategies that will be
required for improved participant response rate and data quality. As their
previous experience with data collection has shown, when participants are
approached on a voluntary basis, there is little to no response from individuals,
and even when incentives are provided, there is little improvement. The use of
thorough and culturally appropriate tools may assist in improving the quality of
the data collected and participant interest and feedback.
4.1. Current Standardized Assessment
Measuring usual dietary intake is the main objective of diet assessment methods
used widely in epidemiological research73. Often this involves developing or
administering an assessment tool that can capture the average intake over the
course of one year, which is meant to account for the variability seen in dietary
behaviours among individuals73. However, researchers are aware that all diet
assessment methods do have certain limitations that limit their utility in studies, in
most cases due to the lack of appropriateness of the tool for the population of
interest74. Due to the variability in diet patterns, researchers are advised to collect
a sample of dietary information from their study population in order to develop a
tool that is culturally appropriate and tailored to their specific population39,73.
Between 1995 and 1996, Kelemen and colleagues developed various cultural
food frequency questionnaires to be administered to South Asian, Chinese and
European populations in Canada38. They found that most existing FFQs had
quite restrictive food lists, that often neglected to include foods their participants
were consuming, and as a result they modified an existing FFQ used for the
Canadian Study of Diet, Lifestyle and Health (CSDLH)38. To ensure that the food
lists created were reflective of the populations studied, colleagues of the three
different origins were consulted to validate the FFQs38. The FFQ developed for
South Asians resulted in a 163-item questionnaire, with 61 items unique to South

21
Asian diets, and were translated for the various language requirements for their
main study, SHARE38,75.
Participants recruited for the SHARE study (resided in either Hamilton, Ontario,
Canada or Edmonton, Alberta, Canada) were asked to complete the FFQ at
home, instructed to provide detailed information about the foods consumed
(volume of bowls and cups used, weights of prepacked foods, recipes of
homemade meals, etc.)38. Researchers validated the FFQ against 7-day diet
records to ensure that the tool was comparable and deemed that it should be
generalizable to other South Asian populations living in North America38.
One of the main objectives of the FFQ developed was to have ethnic FFQs that
would capture information to determine diet-disease associations in these
populations, and subsequently lead to ethnically-specific diet interventions38.
With the SEHAT population for the propose pilot project, the SHARE South Asian
FFQ will be used to determine whether the FFQ is generalizable to this
population in British Columbia, and whether it captures individual dietary
behaviour patterns and changes over time.
4.1.1. SHARE Food Frequency Questionnaire
Since 1996, the SHARE South Asian FFQ has been used in prior research,
MASALA and M-CHAT studies, and continues to be adapted as the nutrient
database develops overtime75,76. The current version to be used with SEHAT’s
pilot project consists of fourteen pages and 167-items (see Appendix G for
sample of FFQ).
For the purpose of SEHAT’s pilot project, the SHARE FFQ would be best used
with interviewer administration, during the initial recruitment, as it will allow
interviewers to provide more clarification to participants and allow them to
administer the questionnaire in both English and Punjabi as needed.

22
4.2. Web-based Assessment
Using technology to aid in the collection of dietary information has been thought
to improve the assessment process22. There are various forms of technological
assessment tools that have been developed for diet assessment purposes, of
which the web-based technologies have been used for larger cohort
studies22,62,70. The web-based assessments are easier to facilitate and simplify
the recording process for users and allow researchers quick access to the
collected data70. They are thought to improve the validity, reliability and accuracy
of the assessment tool, and reduce costs to researchers and the level of
participant burden experienced by users37,52,65,71. These novel methods of diet
assessments are preferred as they allow for collection of data from populations
that may have lower literacy levels, the elderly, while providing higher quality
data55,77.
As alluded to earlier, 24HDRs are considered to be the most high-quality diet
assessment tool available to researchers, however are quite impractical to
implement in larger scale studies due to the associated costs (i.e. trained
interviewers, multiple records, cost of analyzing data, etc.) and burden on
participants78. The Automated Self-Administered 24-h (ASA24) diet recall tool
was developed by the U.S. National Cancer Institute77,78, and is a publicly
available, free web-based tool that researchers can employ in studies78. This
web-based diet assessment tool uses a multiple pass method to ensure that
respondents are providing as much detailed information as possible78.
4.2.1. SurveyMonkey 24HDR
In order to assess the 24HDR with this population, Fraser Health will use a
SurveyMonkey online survey tool administered onsite at the Gurdwaras. This tool
will be a brief questionnaire developed for the purpose of the pilot study, in order
to assess whether having a simplified version of a diet recall questionnaire will
result in a better response rate among participants.

23
This tool will be a modified version of the B&B Truss questionnaire that will
inquire about their dietary intake over the previous 24 hours, while taking into
consideration added sugar intake through recording beverage consumption. By
implementing this tool as an online tool, the option of completing the
questionnaire on-site or at home can be left up to the discretion of the
participants, reducing participant burden.
4.2.2. ASA24-Canada-2016
Since its development and use across U.S. based research studies78, the NCI
has developed a Canadian version of the online tool, accessible to researchers79,
(see Appendix H for their provided overview of this tool).
The ASA24-Canada-2016 is the latest version of the diet assessment tool
released in October 201679. With this update, modifications were made to the
existing tool to reflect foods unique to Canada, changing brand names and
restaurant items to those available here, as well as the inclusion of metric units
for measurement79. The nutrient database used for the ASA24-Canada is based
on the Canadian Nutrient File (CNF2015)79. With the updated version of the diet
assessment tool, the NCI has released a mobile version of the tool that can be
used by respondents, and the Canada-specific tool is currently available in both
English and French language options79.
Although the tool may not be offered in Punjabi, which would make it much more
culturally specific for the use in the proposed pilot project, the multiple pass
system used, with an extensive food list and database, may be useful in
collecting information from the population of interest here in B.C. Similar to the
FFQ to be developed for the pilot project, the ASA24 would be best administered
by an interviewer onsite, however upon registration, the interviewer can provide
participants with a web-link to access and complete the diet recall on their own
accord. However, in order to ensure participant compliance and to guarantee
data completeness and quality, interviewer administration would be ideal.

24
Table 4 highlights the multiple mass method used for the ASA24, that prompts
users to complete the survey by providing as much detail as they can recall,
which can be useful for ensuring data quality78.
Table 4. Order and content of ASA24 diet recall's multiple pass system.
ASA24 passes Description of information collected
Meal-Based Quick List Respondents asked to report meal name, and time. Option to report: location, television or computer use,
and who they ate with. Foods and drinks consumed are reported without details by browsing or searching
the database.
Meal Gap Review Respondents are asked whether they consumed anything during any 3-hour gaps between eating
occasions, between midnight and first eating occasion, and between the last eating occasion and midnight.
“Yes” responses return the respondent to the Quick list to add foods or drinks.
Details Respondents are asked for details about the foods and drinks recorded in the Quick list, including form,
preparation methods, amount eaten, and any additions.
Forgotten Foods Respondents are asked about the consumption of commonly forgotten foods and drinks and report them as
needed by returning to the Quick list.
Final Review Respondents are prompted to review all of the foods and drinks reported for the intake day; can make edits
and add meals and foods as desired.
Last Chance Respondents are given another opportunity to add foods or drinks.
Usual Intake Respondents are asked: “Was the amount of food that you are yesterday more than usual, usual, or less
than usual?”
Supplement Module
(optional)
Respondents are asked to provide information about the types and doses of supplements consumed by
completing Quick List, Detail, and Final Review passes.
4.3. SEHAT-specific Diet Assessment Protocol
For the purpose of the pilot project, the use of existing diet assessment tools will
allow the team to the necessary information to assess whether they will need to
develop a separate tool for the SEHAT study population. The process of

25
developing and validating a new diet assessment tool can be costly and requires
trained researchers and staff to administer a sample diet assessment in order to
create a new database specific to the population to be observed.
The concurrent use of two existing validated tools, and one simplified web-based
tool, will allow for collection of the pertinent dietary information and can then be
used to assess whether a more specific and modified tool may be required for the
population of interest.
4.3.1. Rationale for using a combination of tools
The administration of the two diet assessment tools will be dependent on the
timeline established for the pilot project. Using a FFQ can be useful in
retrospective research studies, whereas a 24-HDR can be beneficial for
collecting information about recent intake for prospective studies80. As previous
research has found33, that the combination of repeated 24-HDRs and a FFQ
resulted improved participation rates, suggesting that this approach is most
feasible for collecting more detailed dietary information for epidemiological
research. Since the main objective for the pilot project will be to improve
participant response rates, the combined use of both tools may assist in
achieving the desired outcome among this specific population.
Ideally to achieve adequate data collection, the FFQ should be administered at 2
or 3 time-points within the study timeline—one immediately after recruitment and
the second prior to the conclusion of the study participation. The 24-HDRs can be
collected more frequently throughout the study period, and this should be
administered at specific time points for the study duration (i.e. biweekly, monthly,
etc.). In order to establish the appropriate timeline for administration of these diet
assessment tools, and the required number of days for the repeated 24-HDR, the
study timeline and budget must be predetermined.
Having the FFQ administered at the beginning and end of the study can capture
the changes in diet behaviours that may have taken place over the course of the

26
study. Since the FFQ would be geared towards capturing average intake over a
specified period of time, depending on the duration of the pilot project, this may
be useful in providing the researchers with the necessary information to tailor the
current nutrition programs to better reflect these changes. The use of the online
24-HDR will be a beneficial supplement for collecting dietary information,
especially from participants who prefer the web-based assessment for its
convenience and ease of use.

27
5. Discussion
With the steady rise in chronic conditions, and the need to develop a better
understanding of diet-disease relationships, the use of appropriate evaluation
tools is important. For South Asians, who are at an increased risk of chronic
conditions such as type II diabetes, hypertension, and dyslipidemia21, this is a
cause for concern. Especially since this population has a notably high intake of
added sugars, carbohydrates, sodium and fat17,18. Prior research (through diet
screeners) conducted by Fraser Health has found these patterns to be
consistent, however the data required for further analysis were lacking. This
invoked the need to explore options that would enable the team to utilize a
validated method for data collection which would yield better responses from
participants and improve the quality of the data collected.
Through a search of the literature, the most feasible options available for the
team included the implementation of a FFQ, and a 24-HDR. The use of combined
diet assessment strategies has garnered better response rates in previous
research. With the use of a culturally-tailored FFQ, prepared specifically for
South Asian populations, this tool can be implemented with ease to collect
detailed information about individual dietary behaviours. Since the tool includes
food items that resonate with the population of interest and offers measurement
values for portion sizes that may reflect participants’ daily practice, it makes this
an ideal option for use with the current population. In addition to tailoring tools
culturally, they need to be linguistically appropriate as well, or researchers must
be able to provide translation services during interviews to meet the needs of
individuals who may have lower literacy levels. This would ensure that
participants are able to comprehend the questions being asked and would likely
be inclined to provide more accurate answers, which would improve data quality.
Implementing the web-based diet assessment, ASA24-Canada, provides another
data collection strategy that may improve data quality, especially when
participants are required answer each question in detail before moving onto the

28
next. With the prompts and food models that the website provides, used in
conjunction with an interview-administration strategy onsite, there may be a
notable improvement in the quality of data collected—even from a small sample
size. While the lone web-based DA tool can be an effective strategy, including an
additional online tool that may provide more information about participants’
willingness to respond. Offering a simplified version of a 24 HDR that can be self-
administered through a user-friendly survey website, SurveyMonkey, may appeal
to the lower age range of the population of interest for the purpose of the
proposed pilot project (i.e. the 30 to 40-year-old demographic).
Assessing the dietary behaviours of a large proportion of Vancouver’s second
largest minority population has been implemented in prior research9, however
has been limited by the scope of the study protocols, or the assessment tools
available at the time of the study.
Limitations
As with any research, there are limitations with the proposed tools for the pilot
project. Due to the scope of the current review, the focus was not dependent on
finding the best strategy to collect dietary information on specific macro- or
micronutrients, however, with the proposed diet assessment tools, since they
have been previously administered and used widely in ongoing research projects,
that may not pose a significant limitation during the full-scale study at a later time.
In trying to find data about research conducted on South Asians in Canada, it
was apparent that there is a lacking body of evidence for this population. Much of
the literature excluded for the purpose of this review were primarily studies
conducted on pregnant or breastfeeding women, children and adolescents, and
were not considered applicable to the population of interest. As such, there may
have been advantages and limitations of the existing tools that would not have
been taken into consideration in this review. However, with Fraser Health’s pilot
project, the objective will be to discover which of the chosen tools will yield better

29
response rates from the Punjabi Sikh community, with an age range of 30 to 60-
year olds.
Within South Asian communities, the communal and gendered nature of food
needs to be considered prior to data collection to ascertain whether it would be
more appropriate to administer these tools with the family unit as a whole, rather
than just one member of the family. Since much of the food preparation is done
by the women in the household, including them as a part of the research process
would be critical in obtaining accurate measures of the ingredients used during
the cooking process, which can provide more insight into the food preparation
process that others in the family may not be familiar with. Gathering the
information from the family, rather than just the individual would add to the quality
of the collected data.
For health-related research on South Asians, much of the focus is placed on
finding causal factors of disease, and most often in doing so, researchers make
use of evaluation and assessment tools that are not developed to capture the
necessary information, as the tools are developed based on research conducted
in Caucasian populations. This poses significant limitations for researchers who
wish to explore risk factors that are unique to minority populations, when there
are no baseline tools available for that process.
The work of Kelemen and colleagues38 has broadened the data collection
methodologies that are now available for research in minority populations and is
where the SHARE FFQ originated. Though this tool has been previously
validated for South Asians in Canada, one potential limitation is that it may not
account for recent immigration patterns. One of the major limitations across
epidemiological studies looking at dietary behaviours is the use of length of
residency to account for trends of acculturation, as seen in the analysis by Lesser
et al.44. Many diet tools have only been administered in short-term, cross-
sectional studies, which does not take into consideration the changes in dietary
behaviours over time, and as a result may underestimate or overestimate the

30
health risks associated with certain food intake patterns. Participants may also be
reluctant to completing the ASA24-Canada tool if the coverage of South Asian
specific foods are not provided, as that was among the limitations of the previous
tools administered among this population. That being said, the pilot project for
Fraser Health is intended to be a short, cross-sectional study that is primarily
focused on the data collection process, thus in developing the full-scale study,
this limitation must be taken into consideration—especially when planning the
study timeline, and for grant writing purposes.
Although the 24-HDR is a valid and effective tool when administered correctly,
failure to probe for details, and flexibility in how the data is collected may offset
the goals of the pilot project. To ensure that the tool is effective in improving data
quality, interviewer must be well-trained in how to properly administer the tool
and must be prepared to offer the tool in the languages required to meet the
needs of the population. In the past, Fraser Health volunteers have translated
tools, like the B&B Truss tool, in Punjabi during the administration process.
Although this strategy does allow for improved outreach, it may compromise the
integrity of the data collected, as the information may be interpreted differently by
different interviewers. To avoid this, standard operating procedures (SOPs) must
be created to ensure that all interviewer undergo the same standardized training
prior to administering any of assessments.
For all three assessment tools, another limitation, albeit one that can be
assessed and controlled for, is the attention required to how the data will be
analyzed. In partnering with McMaster University, to use their database and
online version of the FFQ, there is a cost associated for researchers, which may
serve as a hindrance to accessing the full potential of the tool and the collected
data. Though the paper-based version can be administered, later analysis of the
data will require a trained individual for inputting, cleaning and analysing the data
collected. The methods required for that process must be outlined prior to
commencing the project, as it may hinder access to interpretation of the results at
a later stage. This is applicable to the SurveyMonkey tool, considerations for

31
what the tool will be measuring and the scoring system it will follow must be
established prior to administration.
After discussion about the potential sample groups that will be used to pilot the
efficacy of the proposed DA tools, there are a few potential limitations that may
arise. Although there are programs in place at these locations geared towards
improving the nutritional quality of the foods served at the temples, whether those
strategies are being followed through and implemented on an individual level at
the home has not been thoroughly identified. Previously, Fraser Health’s
recruitment strategy was based on voluntary participation, where participants
were approached and asked to provide their time during meals at the Gurdwaras
to answer the surveys. Using this approach, the refusal rate observed was quite
high, as participants either did not understand the importance of the data being
collected, or simply were not interested in providing information about their
dietary habits. This may serve as a limitation since the proposed tools involve
more rigorous questions that require an upwards of 30 minutes to complete,
participants may pass on the opportunity to provide their input due to the time
commitment. This may be overcome with the use of incentives and emphasis on
the fact that the interview is a one-time procedure, acknowledging the potential
for bias that may be introduced.
Future Directions
The SEHAT team will need to develop standardized procedures for application of
these tools in their research practice, even for the cross-sectional pilot project.
This process will allow them to identify any of the administrative or
methodological problems that may arise when using these tools with the current
population. Considerations will be needed for adequate incentives to garner
improved response rates among participants recruited, following the necessary
ethical guidelines. Addressing the aforementioned concerns in designing the pilot
project will assist in effective implementation of culturally appropriate diet
assessment tools in yielding the improved results.

32
References
1. Statistics Canada. (2017a, February 8). Population size and growth in Canada: Key
results from the 2016 Census. The Daily. Retrieved from
http://www.statcan.gc.ca/daily-quotidien/170208/dq170208a-eng.htm.
2. Laher, N. (2017). Diversity, aging, and intersectionality in Ontario home care: Why
we need an intersectional approach to respond to home care needs. Wellesley
Institute: Toronto, ON.
3. Garduño‐Diaz, S. D., & Khokhar, S. (2012). Prevalence, risk factors and
complications associated with type 2 diabetes in migrant South
Asians. Diabetes/Metabolism Research and Reviews, 28(1), 6-24.
4. Statistics Canada. (2013a). British Columbia (Code 59) [Table]: National household
survey, 2011. [Catalogue number 99-004-XWE]. Retrieved from
http://www12.statcan.gc.ca/nhs-enm/2011/dp-
pd/prof/details/Page.cfm?Lang=E&Geo1=PR&Code1=59&Data=Count&SearchTe
xt=British%20Columbia&SearchType=Begins&SearchPR=01&A1=All&B1=All&Geo
Level=PR&GeoCode=59.
5. Fraser Health Authority [FHA]. (2015). South Asian Health Report. Fraser Health
Authority: Vancouver, BC.
6. Ng, E. (2011). The healthy immigrant effect and mortality rates. Health Reports,
22(4), C1.
7. Chapman, G. E., Ristovski-Slijepcevic, S., & Beagan, B. L. (2011). Meanings of food,
eating and health in Punjabi families living in Vancouver, Canada. Health Education
Journal, 70(1), 102-112.
8. Raza, Q., Nicolaou, M., Snijder, M. B., Stronks, K., & Seidell, J. C. (2017). Dietary
acculturation among the South-Asian Surinamese population in the Netherlands:
The HELIUS study. Public Health Nutrition, 20(11), 1983-1992.
9. Kandola, K., Sandhu, S., & Tang, T. (2016). Immigration and dietary patterns in
South Asian Canadians at risk for diabetes. Journal of Diabetes and its
Complications, 30(8), 1462-1466.
10. Galdas, P. M., Oliffe, J. L., Wong, S. T., Ratner, P. A., Johnson, J. L., & Kelly, M. T.
(2012). Canadian Punjabi Sikh men's experiences of lifestyle changes following
myocardial infarction: Cultural connections. Ethnicity & Health, 17(3), 253-266.
11. Oliffe, J. L., Grewal, S., Bottorff, J. L., Dhesi, J., Bindy, H., Kang, K., . . . Hislop, T.
G. (2010). Masculinities, diet and senior Punjabi Sikh immigrant men: Food for
western thought? Sociology of Health & Illness, 32(5), 761-776.
12. Statistics Canada. (2013b, May 8). 2011 National household survey: Immigration,
place of birth citizenship, ethnic origin, visible minorities, language and religion. The
Daily. Retrieved from http://www.statcan.gc.ca/daily-quotidien/130508/dq130508b-
eng.htm.
13. Mian, S. I., & Brauer, P. M. (2009). Dietary education tools for South Asians with
diabetes. Canadian Journal of Dietetic Practice and Research, 70(1), 28-35.

33
14. Creamer, J., Attridge, M., Ramsden, M., Cannings‐John, R., & Hawthorne, K.
(2016). Culturally appropriate health education for type 2 diabetes in ethnic minority
groups: An updated Cochrane review of randomized controlled trials. Diabetic
Medicine, 33(2), 169-183.
15. Talegawkar, S. A., Kandula, N. R., Gadgil, M. D., Desai, D., & Kanaya, A. M. (2016).
Dietary intakes among South Asian adults differ by length of residence in the
USA. Public Health Nutrition, 19(2), 348-355.
16. Anand, S. S., Yusuf, S., Vuksan, V., Devanesen, S., Teo, K. K., Montague, P. A., ...
& Hegele, R. A. (2000). Differences in risk factors, atherosclerosis, and
cardiovascular disease between ethnic groups in Canada: The study of health
assessment and risk in ethnic groups (SHARE). The Lancet, 356(9226), 279-284.
17. Nöthlings, U., Boeing, H., Maskarinec, G., Sluik, D., Teucher, B., Kaaks, R., ... &
Amiano, P. (2011). Food intake of individuals with and without diabetes across
different countries and ethnic groups. European Journal of Clinical Nutrition, 65(5),
635-641.
18. Gadgil, M. D., Anderson, C. A. M., Kandula, N. R., Kanaya, A. M. (2015). Dietary
patterns are associated with metabolic risk factors in South Asians living in the
United States. The Journal of Nutrition, 145(6), 1211-1217.
19. World Health Organization (WHO). (2017). Global Health Observatory (GHO) data:
Noncommunicable diseases (NCD). Retrieved May 15, 2017, from
http://www.who.int/gho/ncd/en/.
20. Dreyer, G., Hull, S., Aitken, Z., Chesser, A., & Yaqoob, M. M. (2009). The effect of
ethnicity on the prevalence of diabetes and associated chronic kidney disease. QJM:
An International Journal of Medicine, 102(4), 261-269.
21. Razak, F., Anand, S., Vuksan, V., Davis, B., Jacobs, R., Teo, K. K., & Yusuf, S.
(2005). Ethnic differences in the relationships between obesity and glucose-
metabolic abnormalities: A cross-sectional population-based study. International
Journal of Obesity, 29(6), 656-667.
22. Bonilla, C., Brauer, P., Royall, D., Keller, H., Hanning, R. M., & DiCenso, A. (2015).
Use of electronic dietary assessment tools in primary care: an interdisciplinary
perspective. BMC Medical Informatics and Decision Making, 15(1), 14.
23. Schoendorfer, N., Gannaway, D., Jukic, K., Ulep, R., & Schafer, J. (2017). Future
doctors' perceptions about incorporating nutrition into standard care
practice. Journal of the American College of Nutrition, 36(7), 565-571.
24. Estacio, E. V., McKinley, R. K., Saidy-Khan, S., Karic, T., Clark, L., & Kurth, J.
(2015). Health literacy: Why it matters to South Asian men with diabetes. Primary
Health Care Research & Development, 16(2), 214-218.
25. Quay, T. A., Frimer, L., Janssen, P. A., & Lamers, Y. (2017). Barriers and facilitators
to recruitment of South Asians to health research: A scoping review. BMJ
Open, 7(5), e014889.
26. Gholap, N., Davies, M., Patel, K., Sattar, N., & Khunti, K. (2011). Type 2 diabetes
and cardiovascular disease in South Asians. Primary Care Diabetes, 5(1), 45-56.
27. Misra, A., Tandon, N., Ebrahim, S., Sattar, N., Alam, D., Shrivastava, U., ... & Jafar,
T. H. (2017). Diabetes, cardiovascular disease, and chronic kidney disease in South

34
Asia: Current status and future directions. BMJ: British Medical Journal
(Online), 357.
28. Muilwijk, M., Stronks, K., Qureshi, S. A., Beune, E., Celis-Morales, C., Gill, J., ... &
van Valkengoed, I. G. (2017). Dietary and physical activity strategies to prevent type
2 diabetes in South Asian adults: Protocol for a systematic review. BMJ Open, 7(6),
e012783.
29. Razak, F., Anand, S. S., Shannon, H., Vuksan, V., Davis, B., Jacobs, R., ... & Yusuf,
S. (2007). Defining obesity cut points in a multiethnic population. Circulation,
115(16), 2111-2118.
30. Szczepura, A. (2011). Nutrition in an ethnically diverse society: What are some of
the key challenges? Proceedings of the Nutrition Society, 70(2), 252-262.
31. Sudha, V., Radhika, G., Sathya, R. M., Ganesan, A., & Mohan, V. (2006).
Reproducibility and validity of an interviewer-administered semi-quantitative food
frequency questionnaire to assess dietary intake of urban adults in southern
India. International Journal of Food Sciences and Nutrition, 57(7-8), 481-493.
32. Liu, L., Wang, P. P., Roebothan, B., Ryan, A., Tucker, C. S., Colbourne, J., ... & Sun,
G. (2013). Assessing the validity of a self-administered food-frequency
questionnaire (FFQ) in the adult population of Newfoundland and Labrador,
Canada. Nutrition Journal, 12(1), 49.
33. Illner, A. K., Harttig, U., Tognon, G., Palli, D., Salvini, S., Bower, E., ... & Lund, E.
(2011). Feasibility of innovative dietary assessment in epidemiological studies using
the approach of combining different assessment instruments. Public Health
Nutrition, 14(6), 1055-1063.
34. Bejar, L. M., Sharp, B. N., & García-Perea, M. D. (2016). The e-EPIDEMIOLOGY
mobile phone app for dietary intake assessment: comparison with a food frequency
questionnaire. JMIR Research Protocols, 5(4), e208.
35. Jayawardena, R., Byrne, N. M., Soares, M. J., Katulanda, P., & Hills, A. P. (2016).
Validity of a food frequency questionnaire to assess nutritional intake among Sri
Lankan adults. SpringerPlus, 5(1), 162.
36. Sharma, S. (2010). Assessing diet and lifestyle in the Canadian Arctic Inuit and
Inuvialuit to inform a nutrition and physical activity intervention programme. Journal
of Human Nutrition and Dietetics, 23(s1), 5-17.
37. Hongu, N., Pope, B. T., Bilgiç, P., Orr, B. J., Suzuki, A., Kim, A. S., ... & Roe, D. J.
(2015). Usability of a smartphone food picture app for assisting 24-hour dietary
recall: A pilot study. Nutrition Research and Practice, 9(2), 207-212.
38. Kelemen, L. E., Anand, S. S., Vuksan, V., Yi, Q., Teo, K. K., Devanesen, S., & Yusuf,
S. (2003). Development and evaluation of cultural food frequency questionnaires for
South Asians, Chinese, and Europeans in North America. Journal of the American
Dietetic Association, 103(9), 1178-1184.
39. Sharma, S., Cao, X., Roache, C., Buchan, A., Reid, R., & Gittelsohn, J. (2010).
Assessing dietary intake in a population undergoing a rapid transition in diet and
lifestyle: The Arctic Inuit in Nunavut, Canada. British Journal of Nutrition, 103(5),
749-759.

35
40. Sharma, S., & Cruickshank, J. K. (2001). Cultural differences in assessing dietary
intake and providing relevant dietary information to British African–Caribbean
populations. Journal of Human Nutrition and Dietetics, 14(6), 449-456.
41. Sharma, S., Cao, X., Gittelsohn, J., Ho, L. S., Ford, E., Rosecrans, A., ... & Zinman,
B. (2008). Dietary intake and development of a quantitative food-frequency
questionnaire for a lifestyle intervention to reduce the risk of chronic diseases in
Canadian First Nations in north-western Ontario. Public Health Nutrition, 11(8), 831-
840.
42. Ribas-Barba, L., Serra-Majem, L., Román-Vinas, B., Ngo, J., & García-Álvarez, A.
(2009). Effects of dietary assessment methods on assessing risk of nutrient intake
adequacy at the population level: from theory to practice. British Journal of
Nutrition, 101(S2), S64-S72.
43. Carroll, R. J., Midthune, D., Subar, A. F., Shumakovich, M., Freedman, L. S.,
Thompson, F. E., & Kipnis, V. (2012). Taking advantage of the strengths of 2
different dietary assessment instruments to improve intake estimates for nutritional
epidemiology. American Journal of Epidemiology, 175(4), 340-347.
44. Lesser, I. A., Gasevic, D., & Lear, S. A. (2014). The association between
acculturation and dietary patterns of South Asian immigrants. PloS one, 9(2),
e88495.
45. Raatz, S. K., Scheett, A. J., Johnson, L. K., & Jahns, L. (2015). Validity of electronic
diet recording nutrient estimates compared to dietitian analysis of diet records:
randomized controlled trial. Journal of Medical Internet Research, 17(1), e21.
46. Mohan, V., Radhika, G., Sathya, R. M., Tamil, S. R., Ganesan, A., & Sudha, V.
(2009). Dietary carbohydrates, glycaemic load, food groups and newly detected type
2 diabetes among urban Asian Indian population in Chennai, India (Chennai Urban
Rural Epidemiology Study 59). British Journal of Nutrition, 102(10), 1498-1506.
47. Radhika, G., Sathya, R. M., Ganesan, A., Saroja, R., Vijayalakshmi, P., Sudha, V.,
& Mohan, V. (2011). Dietary profile of urban adult population in South India in the
context of chronic disease epidemiology (CURES–68). Public Health
Nutrition, 14(4), 591-598.
48. Garduño‐Diaz, S. D., & Khokhar, S. (2013). South Asian dietary patterns and their
association with risk factors for the metabolic syndrome. Journal of Human Nutrition
and Dietetics, 26(2), 145-155.
49. Liu, B., Young, H., Crowe, F. L., Benson, V. S., Spencer, E. A., Key, T. J., ... & Beral,
V. (2011). Development and evaluation of the Oxford WebQ, a low-cost, web-based
method for assessment of previous 24 h dietary intakes in large-scale prospective
studies. Public Health Nutrition, 14(11), 1998-2005.
50. Olendzki, B., Procter-Gray, E., Magee, M. F., Youssef, G., Kane, K., Churchill, L., ...
& Li, W. (2017). Racial differences in misclassification of healthy eating based on
food frequency questionnaire and 24-hour dietary recalls. The Journal of Nutrition,
Health & Aging, 21(7), 787-798.
51. Beukers, M. H., Dekker, L. H., De Boer, E. J., Perenboom, C. W. M., Meijboom, S.,
Nicolaou, M., ... & Brants, H. A. M. (2015). Development of the HELIUS food
frequency questionnaires: Ethnic-specific questionnaires to assess the diet of a

36
multiethnic population in the Netherlands. European Journal of Clinical
Nutrition, 69(5), 579-584.
52. Sharp, D. B., & Allman-Farinelli, M. (2014). Feasibility and validity of mobile phones
to assess dietary intake. Nutrition, 30(11), 1257-1266.
53. Wenhold, F. A. (2018). Technology in dietary assessment. Public Health
Nutrition, 21(2), 257-259.
54. Boushey, C. J., Spoden, M., Zhu, F. M., Delp, E. J., & Kerr, D. A. (2017). New mobile
methods for dietary assessment: Review of image-assisted and image-based
dietary assessment methods. Proceedings of the Nutrition Society, 76(3), 283-294.
55. Illner, A. K., Nöthlings, U., Wagner, K., Ward, H., & Boeing, H. (2010). The
assessment of individual usual food intake in large-scale prospective
studies. Annals of Nutrition and Metabolism, 56(2), 99-105.
56. Moeller, S. M., Reedy, J., Millen, A. E., Dixon, L. B., Newby, P. K., Tucker, K. L., ...
& Guenther, P. M. (2007). Dietary patterns: Challenges and opportunities in dietary
patterns research. Journal of the Academy of Nutrition and Dietetics, 107(7), 1233-
1239.
57. NutriGen Alliance Investigators, de Souza, R. J., Zulyniak, M. A., Desai, D., Shaikh,
M. R., Campbell, N. C., ... & Atkinson, S. A. (2016). Harmonization of food-frequency
questionnaires and dietary pattern analysis in 4 ethnically diverse birth cohorts–
3. The Journal of Nutrition, 146(11), 2343-2350.
58. Fardet, A., & Rock, E. (2014). Toward a new philosophy of preventive nutrition: from
a reductionist to a holistic paradigm to improve nutritional
recommendations. Advances in Nutrition: An International Review Journal, 5(4),
430-446.
59. Serra-Majem, L., Andersen, L. F., Henríque-Sánchez, P., Doreste-Alonso, J.,
Sánchez-Villegas, A., Ortiz-Andrelluchi, A., ... & La Vecchia, C. (2009). Evaluating
the quality of dietary intake validation studies. British Journal of Nutrition, 102(S1),
S3-S9.
60. Tucker, K. L. (2007). Assessment of usual dietary intake in population studies of
gene–diet interaction. Nutrition, Metabolism and Cardiovascular Diseases, 17(2),
74-81.
61. LeCroy, M. N., & Stevens, J. (2017). Dietary intake and habits of South Asian
immigrants living in Western countries. Nutrition Reviews, 75(6), 391-404.
62. Shim, J.-S., Oh, K., & Kim, H.C. (2014). Dietary assessment methods in
epidemiologic studies. Epidemiology and Health, 36, e2014009.
63. National Institutes of Health, National Cancer Institute. (n.d.) Dietary Assessment
Primer, Comparing Dietary Assessment Instruments. Retrieved January 10, 2018,
from https://dietassessmentprimer.cancer.gov/profiles/table.html
64. Wrieden, W., Peace, H., Armstrong, J., & Barton, K. (2003, September). A short
review of dietary assessment methods used in National and Scottish Research
Studies. In Briefing Paper Prepared for: Working Group on Monitoring Scottish
Dietary Targets Workshop. Edinburgh.
65. Harray, A. J., Boushey, C. J., Pollard, C. M., Delp, E. J., Ahmad, Z., Dhaliwal, S. S.,
... & Kerr, D. A. (2015). A novel dietary assessment method to measure a healthy

37
and sustainable diet using the mobile food record: Protocol and
methodology. Nutrients, 7(7), 5375-5395.
66. Thompson, F. E., & Subar, A. F. (2013). Dietary assessment methodology.
In Nutrition in the Prevention and Treatment of Disease (Third Edition) (pp. 5-46).
67. Garduño‐Diaz, S. D., Husain, W., Ashkanani, F., & Khokhar, S. (2014). Meeting
challenges related to the dietary assessment of ethnic minority populations. Journal
of Human Nutrition and Dietetics, 27(4), 358-366.
68. Kipnis, V., Midthune, D., Freedman, L., Bingham, S., Day, N. E., Riboli, E., ... &
Carroll, R. J. (2002). Bias in dietary-report instruments and its implications for
nutritional epidemiology. Public Health Nutrition, 5(6a), 915-923.
69. Illner, A. K., Freisling, H., Boeing, H., Huybrechts, I., Crispim, S. P., & Slimani, N.
(2012). Review and evaluation of innovative technologies for measuring diet in
nutritional epidemiology. International journal of epidemiology, 41(4), 1187-1203.
70. Benedik, E., Koroušić Seljak, B., Hribar, M., Rogelj, I., Bratanič, B., Orel, R., & Fidler
Mis, N. (2015). Comparison of a Web-Based Dietary Assessment Tool with Software
for the Evaluation of Dietary Records/Primerjava Spletne Aplikacije in
Računalniškega Programa Za Ovrednotenje Prehranskih Dnevnikov. Slovenian
Journal of Public Health, 54(2), 91-97.
71. Timon, C. M., van den Barg, R., Blain, R. J., Kehoe, L., Evans, K., Walton, J., ... &
Gibney, E. R. (2016). A review of the design and validation of web-and computer-
based 24-h dietary recall tools. Nutrition Research Reviews, 29(2), 268-280.
72. Dressler, W. W. (1993). Health in the African American community: Accounting for
health inequalities. Medical Anthropology Quarterly, 7(4), 325-345.
73. Hankin, J. H., & Wilkens, L. R. (1994). Development and validation of dietary
assessment methods for culturally diverse populations. The American Journal of
Clinical Nutrition, 59(1), 198S-200S
74. Cade, J. E., Burley, V. J., Warm, D. L., Thompson, R. L., & Margetts, B. M. (2004).
Food-frequency questionnaires: A review of their design, validation and utilisation.
Nutrition Research Reviews, 17(1), 5-22.
75. Wang, E. T., de Koning, L., & Kanaya, A. M. (2010). Higher protein intake is
associated with diabetes risk in South Asian Indians: The metabolic syndrome and
atherosclerosis in South Asians living in America (MASALA) study. Journal of the
American College of Nutrition, 29(2), 130-135.
76. Lear, S. A., Birmingham, C., Chockalingam, A., & Humphries, K. H. (2006). Study
design of the multicultural community health assessment trial (M-CHAT): A
comparison of body fat distribution in four distinct populations. Ethnicity & Disease,
16(1), 96-100.
77. Kirkpatrick, S. I., Gilsing, A. M., Hobin, E., Solbak, N. M., Wallace, A., Haines, J., ...
& Sacco, J. E. (2017). Lessons from studies to evaluate an online 24-hour recall for
use with children and adults in Canada. Nutrients, 9(2), 100.
78. Subar, A. F., Kirkpatrick, S. I., Mittl, B., Zimmerman, T. P., Thompson, F. E., Bingley,
C., ... & Potischman, N. (2012). The Automated Self-Administered 24-hour dietary
recall (ASA24): A resource for researchers, clinicians, and educators from the

38
National Cancer Institute. Journal of the Academy of Nutrition and Dietetics, 112(8),
1134-1137.
79. National Cancer Institute, Epidemiology and Genomics Research Program. (2018,
February 06). Automated self-administered 24-hour (ASA24®) dietary assessment
tool. Retrieved February 13, 2018, from
https://epi.grants.cancer.gov/asa24/respondent/canada.html.
80. Thompson, F. E., & Byers, T. (1994). Dietary assessment resource manual. Journal
of Nutrition, 124(11 Supplement), 2245S-2317S.
81. Touvier, M., Kesse-Guyot, E., Méjean, C., Pollet, C., Malon, A., Castetbon, K., &
Hercberg, S. (2011). Comparison between an interactive web-based self-
administered 24 h dietary record and an interview by a dietitian for large-scale
epidemiological studies. British Journal of Nutrition, 105(7), 1055-1064.
82. Pasick, R. J., D'onofrio, C. N., & Otero-Sabogal, R. (1996). Similarities and
differences across cultures: Questions to inform a third generation for health
promotion research. Health Education Quarterly, 23(1_suppl), 142-161.
83. Betancourt, J. R., Green, A. R., Carrillo, J. E., & Ananeh-Firempong, O. (2003).
Defining cultural competence: A practical framework for addressing racial/ethnic
disparities in health and health care. Public Health Reports, 118(4), 293-302.
84. Jones, C. A., Mawani, S., King, K. M., Allu, S. O., Smith, M., Mohan, S., & Campbell,
N. R. (2011). Tackling health literacy: Adaptation of public hypertension educational
materials for an Indo-Asian population in Canada. BMC Public Health, 11(1), 24.
85. Moher, D., Liberati, A., Tetzlaff, J., Altman, D. G., & Prisma Group. (2009). Preferred
reporting items for systematic reviews and meta-analyses: The PRISMA
statement. PLoS Medicine, 6(7), e1000097.
86. Khan, S. A., Jackson, R. T., & Momen, B. (2016). The relationship between diet
quality and acculturation of immigrated South Asian American adults and their
association with metabolic syndrome. PloS one, 11(6), e0156851.
87. Galabuzi, G. E. (2001). Canada’s creeping economic apartheid: The economic
segregation and social marginalization of racialised groups. Toronto, ON: CSJ
Foundation for Research and Education.
88. Khandor, E., & Koch, A. (2011). The global city: Newcomer health in Toronto.
Toronto, ON: Toronto Public Health.

39
Appendix A1. PRISMA Literature Review Search Strategy
Figure 4. Flow chart of literature review search strategy65.
Records identified through
database searching (n = 743)
Additional records identified
through other sources (n = 236)
Records after duplicates removed (n = 464)
Records screened
(n = 252)
Records
excluded
(n = 212)
Full-text articles
assessed for eligibility
(n = 146)
Full-text
articles
excluded
(n = 122)
Quantitative studies
included in review
(n = 24)
Iden
tifi
cati
on
S
cre
en
ing
E
lig
ibilit
y
Inclu
ded
Reasons for Stage I
exclusion:
Not a peer-reviewed article;
non-English language; not
related to diet assessment;
not original research
Reasons for Stage II
exclusion:
Not related to diet
assessment; review papers;
papers on pregnant or
breastfeeding women,
children, adolescents;
papers reporting <60%
response rate
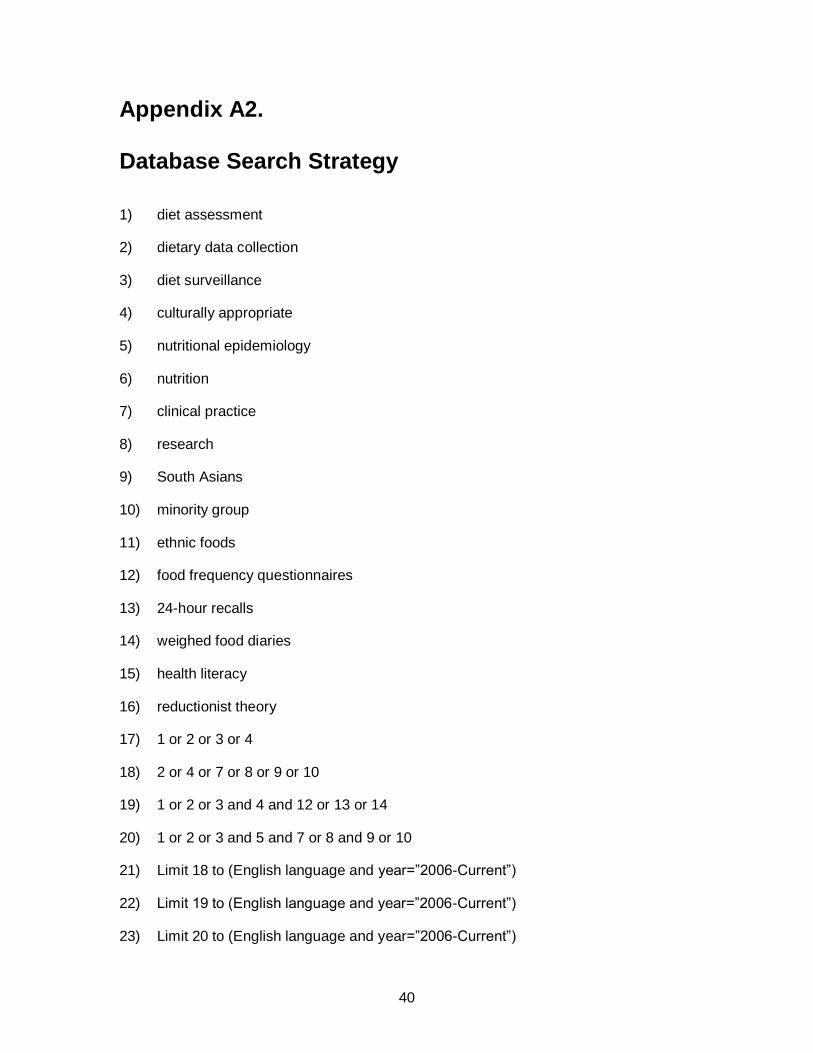
40
Appendix A2. Database Search Strategy
1) diet assessment
2) dietary data collection
3) diet surveillance
4) culturally appropriate
5) nutritional epidemiology
6) nutrition
7) clinical practice
8) research
9) South Asians
10) minority group
11) ethnic foods
12) food frequency questionnaires
13) 24-hour recalls
14) weighed food diaries
15) health literacy
16) reductionist theory
17) 1 or 2 or 3 or 4
18) 2 or 4 or 7 or 8 or 9 or 10
19) 1 or 2 or 3 and 4 and 12 or 13 or 14
20) 1 or 2 or 3 and 5 and 7 or 8 and 9 or 10
21) Limit 18 to (English language and year=”2006-Current”)
22) Limit 19 to (English language and year=”2006-Current”)
23) Limit 20 to (English language and year=”2006-Current”)

41
Appendix B. Results of Literature Review
Table 5. Results of studies included to determine the effectiveness of existing diet assessment tools.
Study Measure(s) Population Diet Assessment Tool
Used
Response Rates
Raza et al. (8) FFQ 2418 participants sampled from
HELIUS study; South-Asian
Surinamese (females: n = 558,
males: n = 410) & Dutch (females: n
= 796, males: n = 654); Mean age =
46 - 49 years
Ethnic-specific 220-item
FFQ
Not reported
Kandola et al.
(9)
Block screener Convenience sample of 428 South
Asian Canadians in the metro
Vancouver area; length of residency
in Canada: 24 years +/- 15 years;
mean age = 65 years +/- 10 years;
males: n = 247, females: n = 177
Culturally adapted rapid
Block screener: 5-point
Likert scale,
422/428 = 98.6%
Talegawkar et
al. (15)
SHARE FFQ South Asian sample from MALASA
study; n = 874 (women = 47%);
Mean age: 55.5 years +/- 9.34
years; Length of residency in USA:
27.0 years +/- 10.8 years
SHARE FFQ: culturally
appropriate tool,
developed and validated
for South Asians in
Canada
Not reported
Sudha et al.
(31)
FFQ + 24HDR 125 participants from CURES,
males: n = 34, females: n = 68;
mean age = 40.9 years +/- 12.8
years
Semi-quantitative 222-item
FFQ & 24 HDR
81.6% (102/125)
Liu et al. (32) 24HDR + FFQ 432 participants, Newfoundland
(NL), Canada, adults; aged 35 - 70
years
Hawaii FFQ modified for
NL food consumption
habits, 169-item list; FFQ +
24 HDR
Response rate = 93%
(n = 400), only 195
included in analysis
with complete data

42
Garduño‐Diaz
et al. (48)
FFQ 100 South Asian men (n = 34,
mean age = 44 years) and women
(n = 66, mean age = 46 years) from
Leeds, U.K.
Interview-administered
FFQ: 229-item developed
to cover western and
eastern foods, portion size
estimates using Western-
style measures (cups,
spoons), and South Asian
style measures ('katoris')
Not reported
Illner et al.
(55)
24-HDR;
FPQ/FFQ
(European Food
Propensity
Questionnaire -
EFPQ)
n = 400 from 5 cohort studies (80
from each: EPIC-San Sebastian,
Spain; EPIC-Florence, Italy; EPIC-
Potsdam, Germany; Norwegian
Women and Cancer study
(NOWAC), Norway; Estonian
Genome Center (EGC), Estonia)
Country-specific versions
of 24-HDR administered,
except in EGC, English
version; multilingual EFPQ
based on 102-item FFQ
validated for EPIC-
Potsdam; recalls; 56.3% (n
= 225) completed 3 recalls
EFPQ Response
Rates: of 261 enrolled
in pilot, n = 143 (54.8%)
completed the web-
based EFPQ, n = 118
(45.2%) completed the
paper EFPQ: EPIC-San
Sebastian (n = 55: 14
web [57.1%], 41 paper
[56.1%]), EPIC-
Florence (n = 50: 24
web [33.3%], 26 paper
[53.9%]), EPIC-
Potsdam (n = 56: 19
web [36.8%], 37 paper
[62.2%], EGC (n = 70:
65 web [44.6%], 5
paper [80.0%],
NOWAC (n = 30: 21
web [100.0%], 9 paper
[100.0%]); 24-HDR
Reponse Rates: 63.0%
(n = 252) completed
one recall; 60.3% (n =
241) completed 2
Liu et al. (49) Oxford WebQ +
24 HDR
116 women (n = 84) and men (n =
32) Oxford, UK; mean age = 42
years (range: 19-82 years); 72%
women
Oxford WebQ: avg
completion time = 14 mins;
interview-administered
24HDR = 30 mins to
complete

43
Bejar et al.
(34)
e-
EPIDEMIOLOGY
app; FFQ
120 medical and pharmaceutical
students from the University of
Seville, female (n = 85), male (n =
34)
App + FFQ 99%
Carroll et al.
(43)
1-12 24 HR
recalls; single
calibrated FFQ;
combination of
24HR recall &
FFQ
1997-1998 Eating at America's
Table Study (EATS) population data
24HR recall: multiple pass
method; FFQ: National
Cancer Institute's Diet
History Questionnaire;
965 respondents with
successful completion
of 4 telephone-
administered 24 HR
recalls over 1 year, and
1 FFQ at the end of the
year
*data analysis of 965
completed records
Jayawardena
et al. (35)
FFQ; 7-d
weighed-intake
dietary record
(7DWR)
100 adults recruited from urban and
rural areas of Sri Lanka; mean age
= 46.5 years +/- 8.3 years; females:
n = 65, males: n = 35
FFQ + 7DWR 77%
Sharma et al.
(39)
QFFQ 3 communities in Nunavut (A [n =
1500], B [n = 800], C [n = 1000]), 3
communities in Northwest
Territories (D [n = 3500], E [n =
900], F [n = 400]); Median ages: 39
- 46 years
QFFQ Community A = 0.047%
(n = 71, M = 30%, W =
70%)
Community B = 0.093%
(n = 74, M = 9%, W =
91%)
Community C = 0.066%
(n = 66, M = 12%, W =
88%)
Community D = 0.019%
(n = 66, M = 23%, W.=
77%)
Community E = 0.097%
(n = 87, M = 22%, W =
78%)
Community F = 0.193%
(n = 77, M = 27%, W =
73%)

44
Olendzki et al.
(50)
FFQ + 24HDR 49 Caucasian and 44 African-
American, community-dwelling,
Washington, D.C. women, mean
age = 74.2 years +/- 7.0 years
GNA FFQ + 24 HDR to
compare racial differences
- found limitations in
analysis for racial
disparities
Not reported
Lesser et al.
(44)
SHARE FFQ 207 participants of South Asian
origin, 30 - 65 year old men and
women; age ranges: 46 - 53 years
SHARE FFQ, culturally
appropriate (validated)
FFQ for South Asians
living in Canada
Not reported
Touvier et al.
(81)
Web-based 24-H
Recall
France, 147 volunteers aged 48-75
years, 59.2% women
24-H Recall web-based +
interview administered:
meal-based approach,
100% response rate,
92.7% of participants
found the interface to
be user-friendly, 96.8%
appreciated help
provided by dietician
during interview recall,
completion time: web =
31 mins +/- 29 mins;
interview = 27 mins +/-
13 mins; median time
for both = 25 mins
Raatz et al.
(45)
3-day diet record Grand Forks, North Dakota; n = 19
(11 women, 8 men), crossover-
designed clinical trial
4 weeks of completing the
3-d DR, 4-week washout
where participants filled in
a DR via web using
Nutrihand, or Tap & Track
app for Apple
100% (n = 228 DRs =
12/participant)
Hongu et al.
(37)
Recaller - tracker
app; 24HR recall
interview
19 - 28 year olds (23 males, 22
females) college students (Arizona),
mean age = 22.8 years +/- 2.6
years
Recaller app: 6 days/week
x 3 weeks;
Students took photos of
every meal: 3,315 total
photos (female avg.
84.5 [30-144 photos];
male avg. 56.0 [33-118
images])

45
Kelemen et al.
(38)
FFQ 342 South Asians (mean age: men
= 48.4 +/- 8.1; women = 51.3 +/-
8.9), 317 Chinese (mean age: men
= 48.2 +/- 9.8; women = 45.8 +/-
8.6), 326 Europeans (mean age:
men = 54.6 +/- 12.2; women = 52.5
+/- 11.5)
FFQ: 163 items SA FFQ;
169 items Chinese FFQ;
157 items European
SA (95%, 71%),
Chinese (89%, 82%),
Europeans (98%, 85%)
Sharma et al.
(36)
QFFQ 2 communities in Nunavut, 87 (n =
39 men, n = 44 women); Mean
age: men = 45 years, women = 49
years
Culturally appropriate
QFFQ for Inuit population
73%; completed recalls
collected (total: n = 47
community 1, n = 40
community 2)
Sharma et al.
(40)
FFQ 25-79 year olds, African-Caribbean
origin (Immigrants: 60% Jamaica,
6% Barbados, 14% other Caribbean
islands)
FFQ: West Indian &
European foods, 108
items, food models &
standard household
measures;
83% (n = 255)
Sharma et al.
(41)
24-HDR 8 First Nations communities (Oji-
Cree and Ojibway) in north-western
Ontario, n = 140, (mean ages: FN
men [n = 47] = 18-74, 42 +/- 14; FN
women [n = 75] = 19-80, 44 +/- 17)
24-HDR 92% (n = 129; 65
remote communities,
64 semi-remote
communities)
Ribas-Barba
et al. (42)
24-HDR, FFQ Catalan population, 10-85 years (n
= 2160, 954 men & 1106 women);
Canary Islands population, 6-75
years (n = 1747, 821 men & 926
women)
24-HDR Catalan pop'n = 62%;
Canary Island pop'n =
NIR; Final sample
included in pooled
analysis:
n = 2542, 1223 men &
1319 women
Mohan et al.
(46)
FFQ >20 years, n = 1843 (sampled from
CURES study, Chennai, India
(cross-sectional study)
FFQ: 222 items, meal-
based semi-quantitative,
common household
measures for portion size
estimates;
100%

46
Radhika et al.
(47)
FFQ 2042 South Asians (recruited from
the Chennai Urban Rural
Epidemiological Study (CURES)),
917 men, 1125 women; Mean age:
40.7 years +/- 12.8
FFQ 87%

47
Appendix C. SEHAT New Diet Survey
Introduction:
We are conducting this survey to learn more about the eating patterns of the
South Asian population. We are working with the temple kitchens to learn more
about how langar is being prepared. We would like to help everyone make
healthy food choices.
1. Is most of your diet…
(a) home cooked
(b) from restaurants/take out (pizza, samosa, shahi paneer)
2. How often do you eat home cooked food?
(a) Daily
(b) 2-6 times per week
(c) Once per week
(d) 2-3 times a month
(e) Once a month
3.i) How often do you order pizza, samosa, shahi paneer, etc.?
(a) Daily
(b) 2-6 times per week
(c) Once per week
(d) 2-3 times a month

48
(e) Once a month
(f) Other (describe __________________________________________________)
ii) What food do you order? ___________________________________________
4. How often do you eat at the temple?
(a) Daily
(b) 2-6 times per week
(c) Once per week
(d) 2-3 times a month
(e) Once a month
(f) Other (describe __________________________________________________)
5. When eating at the temple, do you take…
Roti? Y N How many? _____
Rice? Y N
Both? Y N Kheer? Y N
6. Which healthy foods would you like to see more of?
___________________________________________________
7. Which foods do you think are less healthy?
____________________________________________________
8. Have you made any changes to your diet because of health concerns?
Yes No
If yes, please describe: Why?
____________________________________________________________________

49
9. a. How many fresh fruit and vegetable servings do you have each day? (1
serving= ½ cup)
_____________________________________________________________________
b. Do you provide fresh fruit and vegetables at home for your family? If not, why
not?
_____________________________________________________________________
10 a. When you use milk for drinking and cooking, do you prefer:
i) homo milk ii) 2% iii) 1% iv) skim
b. If you use only whole milk, would you consider using 2%, 1%, or skim at times?
Y N
If not, why not? ________________________________________________________
11. What kinds of food do you consider a treat?
_____________________________________________
How often do you have treats?
Daily 2-6x/week 1x/week 2-3x/month 1x/month
12. Do you add extra sugar to your food/drinks during preparation? After it’s
cooked/made?
______________________________________________________________________
13. Do you add extra salt to your food during preparation? After it’s cooked?
______________________________________________________________________
14. Which of these foods do you think could increase your blood cholesterol?
cookies nuts ghee rusk

50
15. Which of these food preparation/cooking methods can help reduce the amount
of fat in your diet?
Bake Pan fry Deep fry Barbequing
16. Which of these foods do you think can turn to sugar in your body and can
increase blood sugar?
Naan Rice Peanut butter Oatmeal
17. How often do you drink the following (every meal, 1/day, 2x/week, 3x/week):
Pop _______
Chai with sugar _______
Fruit juice _______
Flavored drink (Sunny Delight) _______
Coffee with sugar _______
Water _______
Plain milk _______
Lassi with sugar or salt _______
Thank you for your help!

51
Appendix D. SEHAT Participant Diet Log
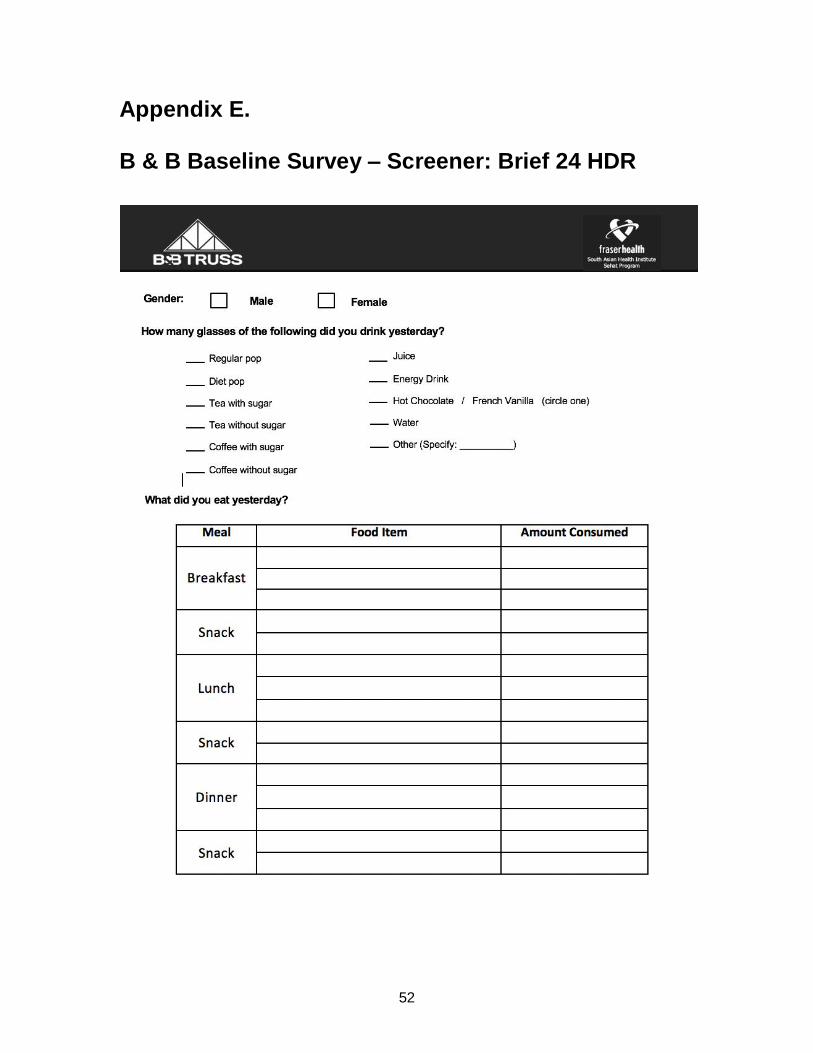
52
Appendix E. B & B Baseline Survey – Screener: Brief 24 HDR
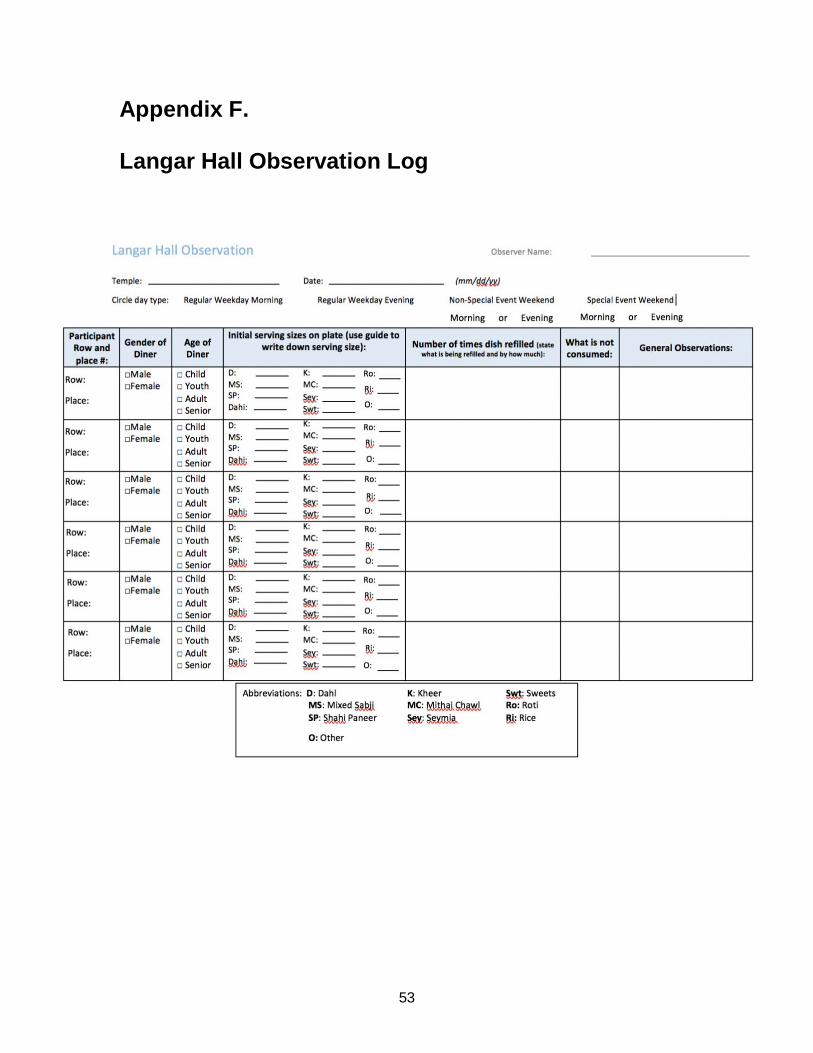
53
Appendix F. Langar Hall Observation Log

54
Appendix G. SHARE South Asian FFQ
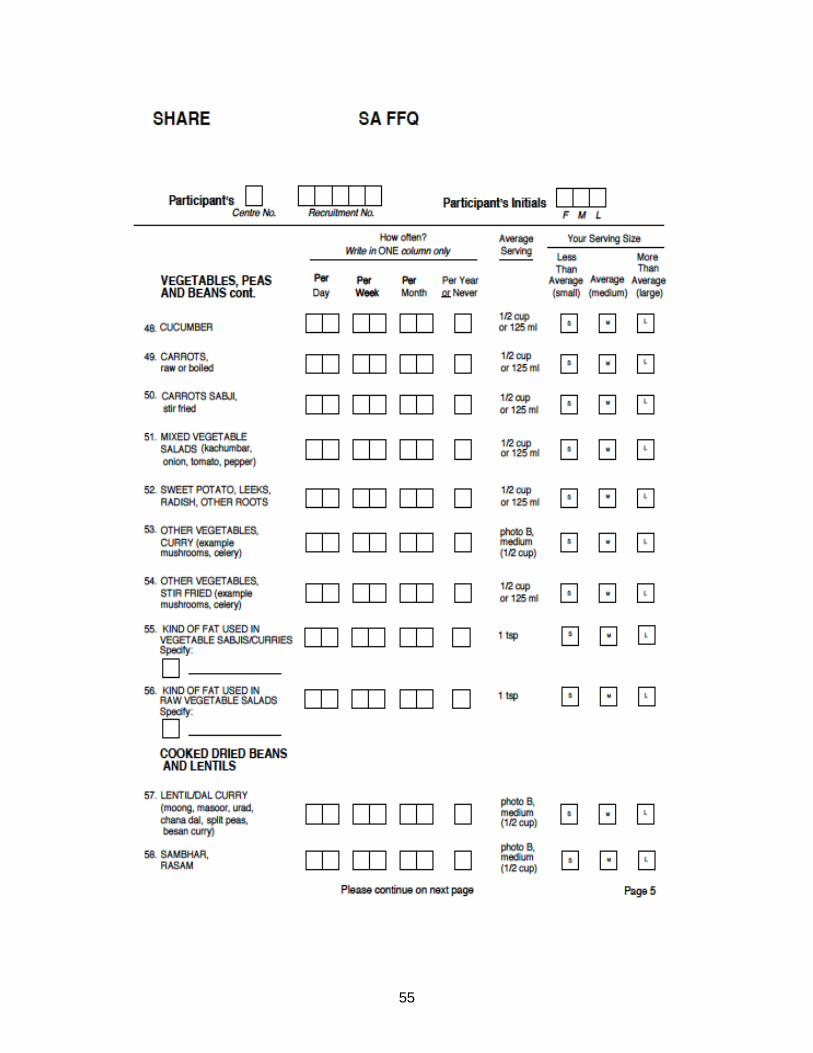
55

56
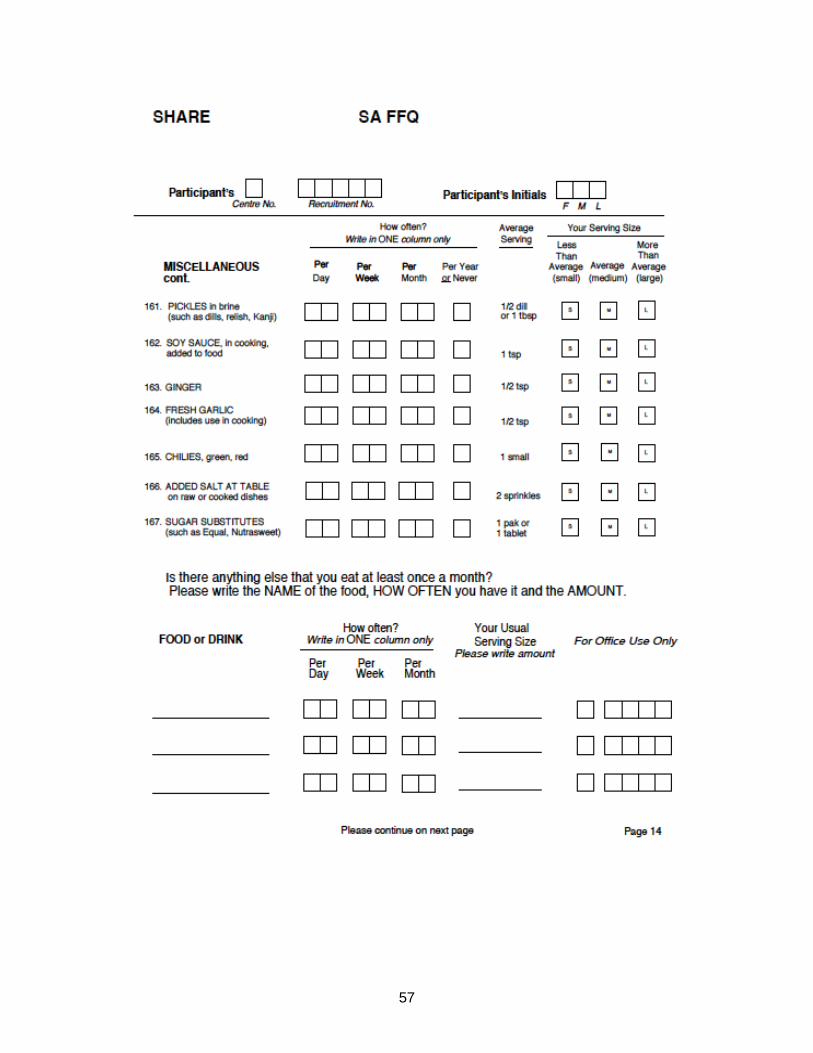
57

58
Appendix H.
Overview of the ASA24 Respondent Websites and
Considerations Related to Data Security and Participant Confidentiality79
Extensive evidence has demonstrated that 24-hour dietary recalls provide the highest
quality, least biased dietary data. Traditional 24-hour recalls, however, are expensive
and impractical for large-scale research because they rely on trained interviewers and
multiple administrations to estimate usual intakes. As a result, researchers often make
use of food frequency questionnaires, which are less expensive but contain substantial
error.
To address this challenge, investigators at the National Cancer Institute (NCI) created
the Automated Self-Administered 24-hour Dietary Assessment Tool (ASA24), a freely-
available, web-based tool that enables multiple automated self-administered 24-hour
recalls and food records. The ASA24 system was developed under contract with
Westat®, a social science research firm located in Rockville, MD, and builds on the Food
Intake Recording Software System (FIRSSt) developed by Dr. Tom Baranowski of the
Baylor College of Medicine. An External Working Group provided advice about the
needs and interests of potential users.
The ASA24 system consists of a Respondent Website used to collect recall and food
record data and a Researcher Website used to manage study logistics and obtain data
analyses. The ASA24-2016 Respondent Website is compatible with mobile devices and
is available in English and Spanish. ASA24-2016 allows for the collection of both recalls
and food records. This document provides an overview of the methodology and main
features of the ASA24-2016 Respondent Website, as well as information on security of
the data collected and protections to the confidentiality of the participants of studies that
make use of the ASA24 system. Images of the main Respondent site screens are also
included.

59
5.1.1.1. ASA24 Respondent Website Methodology
Respondents asked to complete a recall are guided through the 24-hour recall interview
using a modified version of the United States Department of Agriculture’s (USDA)
Automated Multiple-Pass Method (AMPM). The steps in the interview process include:
1. Meal-based Quick List 2. Meal Gap Review 3. Detail Pass 4. Final Review 5. Forgotten Foods 6. Last Chance 7. Usual Intake Question
A food record in ASA24-2016 can consist of one or more days of data collection as
determined by the Researcher during study setup. Respondents are instructed to
complete a food record in real time. The methodology for food records was adapted from
the ASA24-2016 methodology for 24-hour recalls described above.
The steps in the food record process are:
1. Meal-based Quick List 2. Detail Pass 3. Meal Gap Review
Finished reporting for the day? If no, go back to step 1. If yes, go to step 4.
4. Final Review 5. Forgotten Foods 6. Last Chance 7. Usual Intake Question
5.1.1.2. Meal-based Quick List
During the first pass of a 24-hour recall, Respondents are asked to provide a list of the
foods and drinks consumed at each meal occasion during the previous 24-hour recall
period from midnight-to-midnight or for the past 24-hours (starting at the time of the first
login).
For food records, Respondents first provide a list of foods and drinks for the meal they
are reporting. After reporting all foods and drinks for that meal, they immediately proceed
to the Detail Pass.

60
Respondents are required to search to find foods, drinks, or supplements; search results
can then be filtered if desired. Foods, drinks, and supplements reported at each meal
are recorded in the My Foods and Drinks panel within the instrument. In addition to
selecting an eating occasion (e.g., breakfast, lunch, snack), Respondents are also
prompted to specify the time of the occasion before reporting the foods and drinks
consumed. The Researcher can opt to collect additional contextual information including
where meals were eaten, television and computer use during meals, and whether the
meal was eaten alone or with others by turning on the corresponding module during
study setup.
5.1.1.3. Meal Gap Review
For 24-hour recalls, once Respondents finish creating their My Foods and Drinks list at
the end of the Quick List step, they are asked if they consumed anything during any 3-
hour gaps between eating occasions. For a food record, the Meal Gap Review follows
the Detail Pass. For the midnight-to-midnight version of a 24-hour recall and for food
records, Respondents are also asked if they consumed anything between midnight and
the first eating occasion, and between the last eating occasion and midnight regardless
of the length of time gaps. During a Gap Review, Respondents have the opportunity to
return to the Quick List pass to add a meal(s) and the foods, drinks, and supplements
consumed at them.
5.1.1.4. Detail Pass
Respondents are asked for details about the foods and drinks they recorded during the
Quick List, including form (e.g., raw), preparation methods (e.g., grilled or roasted), the
amount eaten, and any additions (e.g., sugar, coffee cream, salad dressing). An option
is available to probe Respondents about the source (e.g. grocery store, farmer's market,
etc.) of where reported foods and drinks were obtained.
5.1.1.5. Final Review
Respondents are prompted to review all of the foods and drinks reported for the intake
day, and make edits and add meals, foods, drinks, and supplements as necessary.

61
5.1.1.6. Forgotten Foods
Following the Final Review, Respondents are asked questions probing about the
consumption of commonly forgotten foods and drinks (e.g., snack foods, fruits,
vegetables, cheese, water, coffee, tea) and supplements. Respondents must select
either "Yes" or "No" for each food or drink probed. For any "Yes" response, the
Respondent will be returned to the Quick List to add the forgotten item(s).
5.1.1.7. Last Chance
After Forgotten Foods, Respondents are asked if they have reported all that they
consumed. If Respondents want to add more foods, drinks, or supplements, they will be
returned to the Quick List to add more items; otherwise, they will move forward to the
Usual Intake Question.
5.1.1.8. Usual Intake Question
The final question asks: Was the amount of food that you ate yesterday more than usual,
usual, or less than usual? This question probes whether this was a typical day's intake.
5.1.1.9. Supplement Module
Supplements include vitamins, minerals, and other supplements including prescription
supplements. The supplements included are based on those reported in the National
Health and Nutrition Examination Survey (NHANES). This module can be turned on or
off by the Researcher during study setup. Respondents are able to report supplements
similar to how they report foods and drinks throughout the day as part of a meal
regardless of whether the module is turned on or off. However, if the module is turned
on, Respondents are cued in several places to include supplement intakes in their
report.
5.1.1.10. Respondent Nutrition Report
For 24-hour recalls and food records collected using the U.S. version of the ASA24-2016
system, Researchers can select an optional module to allow Respondents to receive a
Respondent Nutrition Report. This Report provides information to Respondents regarding
how their intake on a single reporting day compares to U.S. dietary guidance and nutrient
requirements.

62
When this optional module is selected by Researchers, for their 24-hour recall or food
record, Respondents are asked their age and sex, and if female, if they are pregnant or
lactating. For 24-hour recalls, the ASA24 system later presents Respondents with a
Nutrition Report. The Respondent Nutrition Report provided to Respondents is also
available to Researchers on the Researcher website. For food records, Researchers can
choose to provide the report to the Respondent after obtaining it from the Researcher
website. Note that the Respondent Nutrition Report will only be generated if the
Respondent provides their age, sex and pregnancy/lactation status.
5.1.1.11. ASA24 Respondent Website Features
The ASA24 Respondent Website guides the participant through the completion of either
a 24-hour recall for the previous day or, a single or multiple day food record. The ASA24
instrument:
• Flows as per modified United States Department of Agriculture
(USDA) Automated Multiple-Pass Method (AMPM) for 24-hour recalls, which was
further adapted for collection of food records;
• Allows researchers to specify timing of recall, either from midnight-to-midnight or
for the past 24-hours from time of login;
• Asks Respondents to report eating occasion and time of consumption;
• Enables Respondents to search to find foods, drinks and supplements;
o Presents Respondents with search results for misspelled and related food
items;
o ASA24-2016 includes >17,500 misspellings and synonyms in the U.S.
version (>13,000 in the Canadian version and >14,500 in the Australian
version);
• Asks detailed questions about food form, preparation, portion size, and additions
using an extensive branching question database with greater than 13 million
pathways so that food codes can be assigned;
• Uses images to assist Respondents in reporting portion size;
• Allows the Respondent to add or modify food, drink, and supplement choices at
multiple points during the recall or record;

63
• Includes optional modules to query where meals were eaten, whether meals
were eaten alone or with others, television and computer use during meals, and
source of foods consumed;
• Includes an optional module to query dietary supplement intake;
• Is available in English and Spanish, except for ASA24-Canada, which is available
in English and French;
• Is accessible by individuals using assistive technologies, such as screen readers.
• The 2016 version includes an optional Respondent Nutrition Report that
Researchers can choose to make available to Respondents. The Respondent
Nutrition Report will provide feedback on nutrient and food group intake in
comparison with U.S. dietary guidance. This report is available only for
Respondents completing food recalls or records using the U.S. version of
ASA24-2016.
5.1.1.12. Data Security and Protections to Confidentiality of Participants Using the ASA24 System
Researchers using the ASA24 system do not provide the NCI, Westat, or the ASA24
system with any identifying data for participants of their studies. Rather, researchers
specify a unique numeric identifier for each Respondent and download system-
generated usernames and encrypted passwords that they provide to Respondents so
that they may access the application.
The ASA24 system also does not collect any identifying data directly from Respondents.
However, IP address information is accessed for the purpose of routing information
between the server and the respondent's computer—often the IP address is that of the
user's Internet Service Provider (ISP). IP addresses are not stored or tracked by the
ASA24 system. However, logs of connections are kept in the hosting environment for
audit trail purposes. This information is not mined in any way but would be available if
there were a legal obligation to release it.
Response data are secured at the hosting site using industry standard security controls,
including firewalls and encryption. All data entered into the ASA24 system at the
Respondent’s computer is encrypted by the internet browser (e.g., Internet Explorer,
Firefox) before they are transmitted to our servers using Secure Socket Layer (SSL)
Technology. SSL allows for the authentication of the sending and receiving computers.

64
Only a particular study’s investigator(s) and the ASA24 operations team can access
response data. Access is gained through usernames and strong passwords.
5.1.1.13. ASA24 Respondent Website Screen Shots
Screen layouts will vary depending upon the screen size of the device.
Figure i. The Respondent can choose to complete the ASA24 records or recalls in English or Spanish.
Figure ii. An introductory screen prompts the participant to report everything that she or he had to eat or
drink for the desired period.

65
Figure iii. The meal details screen collects information on the eating occasion and time, and displays optional modules that can be selected by the researcher to query where meals were eaten, whether meals were eaten alone or with others, and television and computer use during meals. This is the first step in the meal-based Quick List.

66
Figure iv. The Find Foods & Drinks screen is used to select foods, drinks, and supplements to be added to a meal during the Quick List Pass during the reporting period assigned by the Researcher.

67
Figure v. Respondents complete the Quick List pass by adding meals and selecting foods, drinks, and supplements. The food, drink, and supplement terms are based on the National Health and Nutrition Examination Survey (NHANES).

68
Figure vi. In a recall, after the Respondent reports the foods, drinks and supplements consumed and selects the Next button in Figure 5, gaps between meals are identified (Meal Gap Review pass) After reviewing the gaps, the Respondent selects the ‘Add Details’ button.

69
Figures vii.a-c: The detail pass prompts the Respondent to report the details of each food, drink, and supplement including the specific type or how it was prepared, anything added to it, and the amount that was consumed.
Figure vii.a.
Figure vii.b.

70
Figure vii.c.
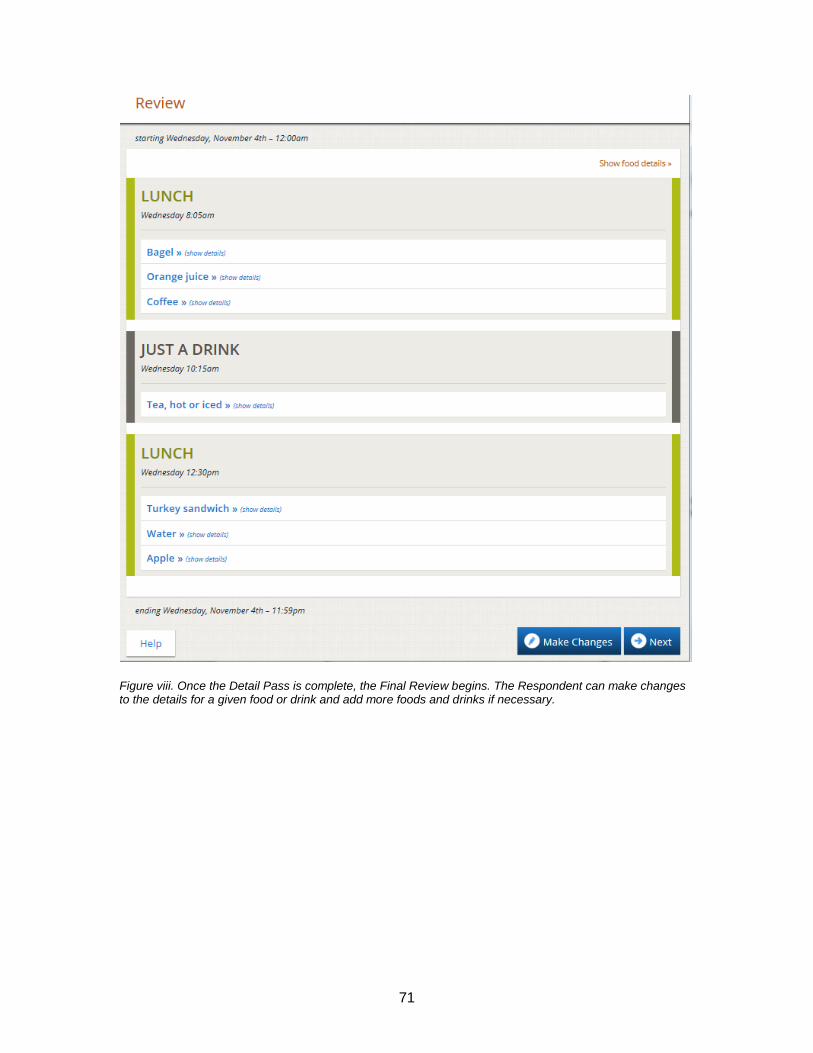
71
Figure viii. Once the Detail Pass is complete, the Final Review begins. The Respondent can make changes to the details for a given food or drink and add more foods and drinks if necessary.

72
Figure ix. The forgotten foods pass queries the Respondent about frequently forgotten foods. Responding yes to one or more categories will result in a prompt to add the forgotten foods or drinks.
Figure x. The Last Chance Pass provides Respondents one more opportunity to edit their intake.
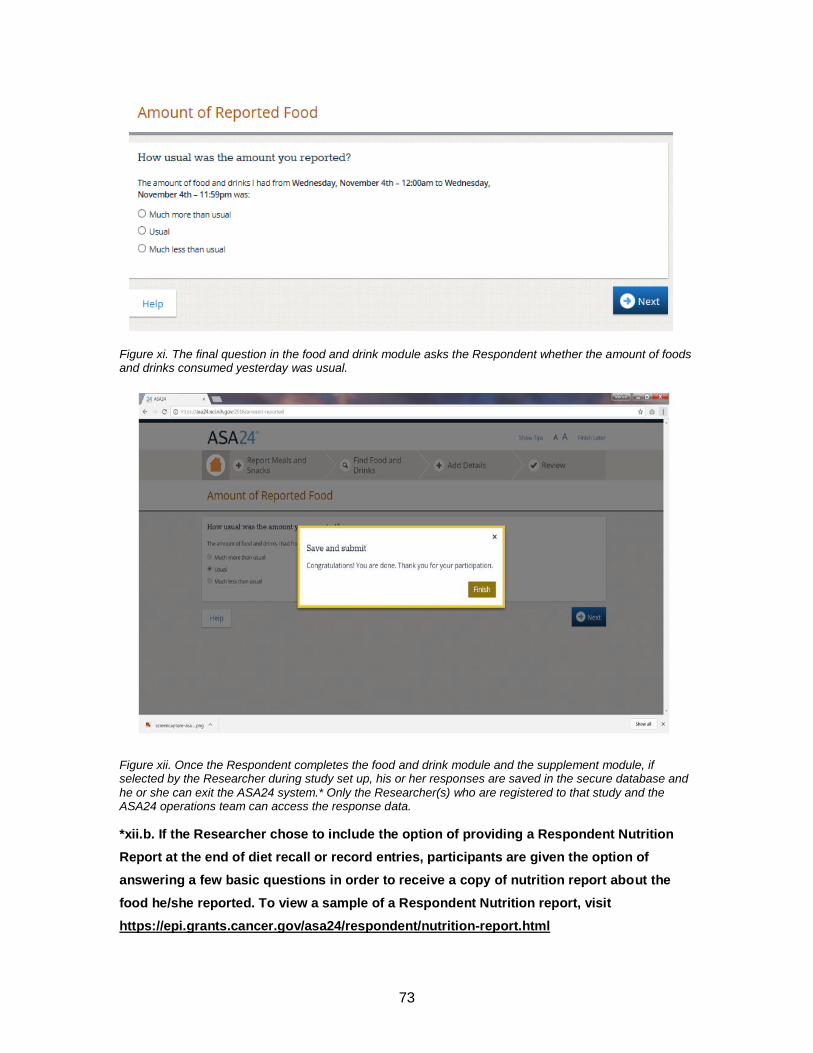
73
Figure xi. The final question in the food and drink module asks the Respondent whether the amount of foods and drinks consumed yesterday was usual.
Figure xii. Once the Respondent completes the food and drink module and the supplement module, if selected by the Researcher during study set up, his or her responses are saved in the secure database and
he or she can exit the ASA24 system.* Only the Researcher(s) who are registered to that study and the ASA24 operations team can access the response data.
*xii.b. If the Researcher chose to include the option of providing a Respondent Nutrition
Report at the end of diet recall or record entries, participants are given the option of
answering a few basic questions in order to receive a copy of nutrition report about the
food he/she reported. To view a sample of a Respondent Nutrition report, visit
https://epi.grants.cancer.gov/asa24/respondent/nutrition-report.html

74
Appendix I. Critical Reflection
Having the opportunity to focus my capstone project on finding culturally appropriate
methodologies for conducting research in minority populations was highly rewarding, as
through completing the literature review I was able to gauge how much work has been
done to improve data collection strategies among South Asian populations. This was
one of the biggest challenges encountered during my search, as the data for this
growing subset of Canada’s population still remains to be quite understudied. Though
cultural competency is beginning to emerge within research, a gap still persists within
nutritional epidemiology—which is already quite a complex field. Aside from nutrition,
health promotion efforts that are currently done in South Asian populations, and the
successes or failures encountered, are not well documented, which poses limitations for
future program development and evaluations. Understanding that many community-
based programs are often financially constrained may lend an explanation as to why
they are not well-established, however, generalizing data collected from the population
at large to inform new programs and policies is not reflective of the priority population.
I was extremely grateful for having worked with such a unique team at Fraser Health
(FH) for the duration of my capstone project. Working closely with FH’s Evaluation
Specialist, Rachel Douglas, and the SEHAT team was an enriching experience, as I had
an opportunity to learn more about the work that is being done to enhance the wellbeing
of the South Asian population in Surrey. That was an important factor in why I chose to
pursue this project and complete my capstone with FH, as I hope to establish a career in
health promotion, specifically with minority populations. This project provided insight into
the various factors that need to be taken into consideration for the planning and
development of health promotion initiatives, especially the importance of stakeholder
engagement.
Working with Dr. Whitehurst, provided me with an opportunity to expand on my
knowledge of research methodologies, particularly in learning the importance of
conducting a rigorous literature review and summarizing that evidence. This project
integrated various aspects of the public health competencies we were exposed to at the

75
beginning of this journey, which lead to the initiation of a research pilot project. I am
pleased that this project has informed the basis of their pilot study, that will allow for a
greater understanding of how to improve data collection with the South Asian community
in the Fraser Region. Though the capstone experience was enlightening and enriching, I
wish there was additional time to see the pilot project through and engage directly with
community members. This would have provided an opportunity to thoroughly understand
the iterative process of conducting a research pilot, and the changes that would need to
be made to ensure each stakeholder’s needs are met. However, I do believe that this
has set the stage for FH to further refine their research methodologies as they continue
to work with this community.
As I approach the end of my MPH degree, I have had time to truly reflect on my
experience within the program overall. It was not until I sat down to write this reflection,
that I realized how quickly the past two years have gone by, but not without priceless
memories and a vast wealth of information and skills that I will carry forward with me into
the next chapter of my career as a public health practitioner.


![QueryProcessingofSchemaDesign ProblemsforData-driven ...summit.sfu.ca/system/files/iritems1/17559/etd10419_XMeng.pdf · MongoDB[2])astheirdatamanagementsystems.Also,SoftwareasaService(SaaS),which](https://img.dokumen.tips/doc/110x75/5ec9e2c5134a521b41312b8e/queryprocessingofschemadesign-problemsfordata-driven-mongodb2astheirdatamanagementsystemsalsosoftwareasaservicesaaswhich.jpg)