Embed Size (px)
Citation preview

Louisiana State UniversityLSU Digital Commons
LSU Master's Theses Graduate School
2012
Utilization of machined skin collimation forelectron therapyRyan Kenneth PoseyLouisiana State University and Agricultural and Mechanical College
Follow this and additional works at: https://digitalcommons.lsu.edu/gradschool_theses
Part of the Physical Sciences and Mathematics Commons
This Thesis is brought to you for free and open access by the Graduate School at LSU Digital Commons. It has been accepted for inclusion in LSUMaster's Theses by an authorized graduate school editor of LSU Digital Commons. For more information, please contact [email protected].
Recommended CitationPosey, Ryan Kenneth, "Utilization of machined skin collimation for electron therapy" (2012). LSU Master's Theses. 457.https://digitalcommons.lsu.edu/gradschool_theses/457

UTILIZATION OF MACHINED SKIN COLLIMATION FOR ELECTRON THERAPY
A Thesis
Submitted to the Graduate Faculty of the
Louisiana State University and
Agricultural and Mechanical College
in partial fulfillment of the
requirements for the Degree of
Master of Science
in
The Department of Physics and Astronomy
by
Ryan Kenneth Posey
B.A., University of Mississippi, 2005
December 2012

ii
Acknowledgements
This research was supported in part by .decimal, Inc. (Sanford, FL), and I thank them.
Also, I thank Mary Bird Perkins Cancer Center for providing the required resources and
facilities.
I acknowledge Dr. Mich Price for his serving as my supervisor for the bulk of this work.
Upon his departure, I extend my most sincere gratitude to my adviser, Dr. Wayne Newhauser,
for assuming that role and for his many hours of careful consideration of and unwavering
attention, both to this project and to my countless questions. Without the help of Dr. Newhauser,
I almost certainly would not have completed this endeavor. I would also like to thank Dr.
Kenneth Hogstrom for contributing his expertise on the electron beam to this investigation and,
on a larger scale, for believing me when I indicated to him my intentions of becoming a medical
physicist. Without Dr. Hogstrom’s help, advice, and understanding, I would never have reached
my current advancement toward that profession. Additionally, I want to thank my remaining
committee members: Dr. John Gibbons, Dr. Robert Fields, Dr. Mette Gaarde, and especially
Connel Chu. Connel spent many hours discussing with me the clinical aspects of this project,
and I would like to convey my appreciation to him for his time and perspective.
I want to thank the other students, faculty, and staff that frequently assisted me with the
various (and numerous) obstacles encountered throughout this investigation, particularly James
Kavanaugh, Dr. Robert Carver, John Chapman, David Perrin, Frank Apollo and the dosimetry
staff. Finally, I want to thank Ms. Yvonne Thomas and Mrs. Susan Hammond for their continual
assistance and support above and beyond their duty—I will dearly miss you both.

iii
Table of Contents
Acknowledgements ......................................................................................................................... ii
List of Tables .................................................................................................................................. v
List of Figures ................................................................................................................................ vi
Abstract ........................................................................................................................................... x
Chapter 1: Introduction .............................................................................................................. 1
Chapter 2: Properties and Techniques for Fabrication of eSCs ................................................. 6
Determination of Skin Collimator Attributes for Clinical Use ................................ 6 2.1
2.1.1 Skin Collimators Made from Lead ........................................................................... 6
2.1.2 Skin Collimators Made from Cerrobend................................................................... 9
2.1.3 Machined (Brass) Skin Collimators ........................................................................ 14
Chapter 3: Specific Aim 1—Dosimetric Influence of eSC Bevel Angle ................................. 22
Methods and Materials ........................................................................................... 22 3.1
3.1.1 Variation of the Angle of the Aperture Edge .......................................................... 22
3.1.2 Variation of Gantry Angle from Nominal Delivery Angle ..................................... 22
3.1.3 Effects of Beveled Collimator Edges—Experimental Setup .................................. 25
3.1.4 Effects of Beveled Collimator Edges—Film Dosimetry ........................................ 29
3.1.5 Comparison of Measured Dose Distributions ......................................................... 33
Results for Specific Aim 1 ..................................................................................... 34 3.2
3.2.1 Collimator Scattered Dose ...................................................................................... 34
3.2.2 Penumbral Width .................................................................................................... 35
3.2.3 90% Dose Area ....................................................................................................... 36
Chapter 4: Specific Aim 2—Dimensional Accuracy of the Machined eSC ............................ 49
Methods and Materials ........................................................................................... 49 4.1
4.1.1 Skin Collimation Evaluation Cycle ........................................................................ 49
4.1.2 Cylindrical Phantom Case....................................................................................... 50
4.1.3 Anthropomorphic Head Phantom Cases – Case 1 (Nasolabial Fold)
and Case 2 (Whole Nose) ....................................................................................... 52
4.1.4 Comparison of Brass Machined Skin Collimation to Planned Skin Collimation—
Dimensional Characteristics ................................................................................... 53
Results for Specific Aim 2 ..................................................................................... 54 4.2

iv
4.2.1 Dimensional Accuracy of Machined eSC Devices ................................................. 54
4.2.2 Thickness Comparisons of Machined eSC Devices ............................................... 58
4.2.3 Agreement of Machined eSC Distal Surfaces ........................................................ 58
4.2.4 Agreement of Machined eSC Aperture Edges ........................................................ 59
4.2.5 Other Observations ................................................................................................. 59
4.2.6 Summary of Specific Aim 2 Results ....................................................................... 59
Chapter 5: Specific Aim 3—Dosimetric Equivalence of the Machined eSC .......................... 64
Methods and Materials ........................................................................................... 64 5.1
5.1.1 Experimental Setup ................................................................................................. 64
5.1.2 Data Analysis .......................................................................................................... 65
5.1.3 Comparison of Measured Dose Distributions ......................................................... 67
5.1.4 Leakage ................................................................................................................... 67
Results for Specific Aim 3 ..................................................................................... 67 5.2
5.2.1 Collimator Scattered Dose ...................................................................................... 68
5.2.2 Field Width and 90% Dose Area ............................................................................ 71
5.2.3 Penumbral Width .................................................................................................... 71
5.2.4 Radiation Leakage .................................................................................................. 72
Chapter 6: Discussion of Results and Clinical Recommendations .......................................... 81
Collimating Material .............................................................................................. 81 6.1
Bevel Angle and Collimator Scatter (Aim 1) ......................................................... 81 6.2
Collimator Thickness (Aim 2 and 3) ...................................................................... 83 6.3
Validation of Fabrication of Brass eSC (Aim 2) .................................................... 84 6.4
Dosimetric Equivalence of Brass eSC (Aim 3) ...................................................... 85 6.5
Chapter 7: Conclusions ............................................................................................................ 87
Conclusions ............................................................................................................ 87 7.1
Proposed Future Work ............................................................................................ 87 7.2
References ..................................................................................................................................... 90
Vita ................................................................................................................................................ 93

v
List of Tables
Table 3.1: Results from a survey of aperture bevel angles and thicknesses measured from fifteen
eSCs made of Cerrobend that were previously used in our clinic. ....................... 26
Table 3.2: The field setups used to measure the selected ranges of bevel and gantry angle
variations ............................................................................................................... 27
Table 3.3: The specific field setups used to measure the effects of bevel and gantry angle
variations for Ep,0 = 6 MeV. .................................................................................. 27
Table 3.4: 90% relative dose area [mm2] for all measured combinations of bevel angle and
relative gantry angle for 6 MeV beams................................................................. 42
Table 3.5: R90 depth on central axis for all measured combinations of bevel angle and relative
gantry angle for a 6 MeV beam ............................................................................ 43
Table 3.6: Penumbral widths measured from data collected with variations in eSC
bevel angle ............................................................................................................ 46
Table 4.1: Volumetric comparison of the planned eSC to the machined brass eSC .................... 60
Table 5.1: Quantitative comparisons of cylindrical phantom data .............................................. 77
Table 5.2: Penumbral widths measured from data collected with the cylindrical phantom ........ 79

vi
List of Figures
Figure 1.1: Comparison of dose distributions for a 6 MeV, 3×3 cm2 beam .................................. 2
Figure 2.1: eSC lateral extention ................................................................................................... 7
Figure 2.2: Clinical example of scalp irradiation incorporating lead eSC and an acrylic scatter
plate (Hogstrom 1991). ........................................................................................... 8
Figure 2.3: Clinical example of whole nose irradiation using lead eSC to collimate the beam
beneath tissue-compensating bolus (Million et al. 1991) ....................................... 8
Figure 2.4: Schematic diagram depicting the conventions used to describe the aperture bevel
angles (ϴB°) in this study ...................................................................................... 10
Figure 2.5: eSC “shadow”............................................................................................................ 11
Figure 2.6: Design procedure within the TPS, step one .............................................................. 16
Figure 2.7: Design procedure within the TPS, step two .............................................................. 17
Figure 2.8: Design procedure within the TPS, step three ............................................................ 18
Figure 2.9: Design procedure within the TPS, step four.............................................................. 19
Figure 2.10: Design procedure within the TPS, step five ............................................................ 20
Figure 2.11: Design procedure within the TPS, step six.............................................................. 21
Figure 3.1: Collection of patient Cerrobend skin collimators used to determine common
clinical attributes ................................................................................................... 23
Figure 3.2: Approximate locations of protractor measurements are marked with yellow lines
around the aperture edge ....................................................................................... 24
Figure 3.3: The gantry angle is referenced in this study with respect to the nominal gantry
position .................................................................................................................. 24
Figure 3.4: Example setup of the phantom apparatus used for bevel angle measurements ......... 27

vii
Figure 3.5: Example isodose distributions of 12 MeV preliminary bevel data—0°, +10°,
+20°, and +30° bevels with a 0° gantry angle ...................................................... 28
Figure 3.6: Common errors seen in film dosimetry of high energy electrons related to
imprecise experimental setup as demonstrated by Dutreix and Dutreix (1969) ... 32
Figure 3.7: Measured RCF calibration dose points with a piecewise polynomial fit. ................. 32
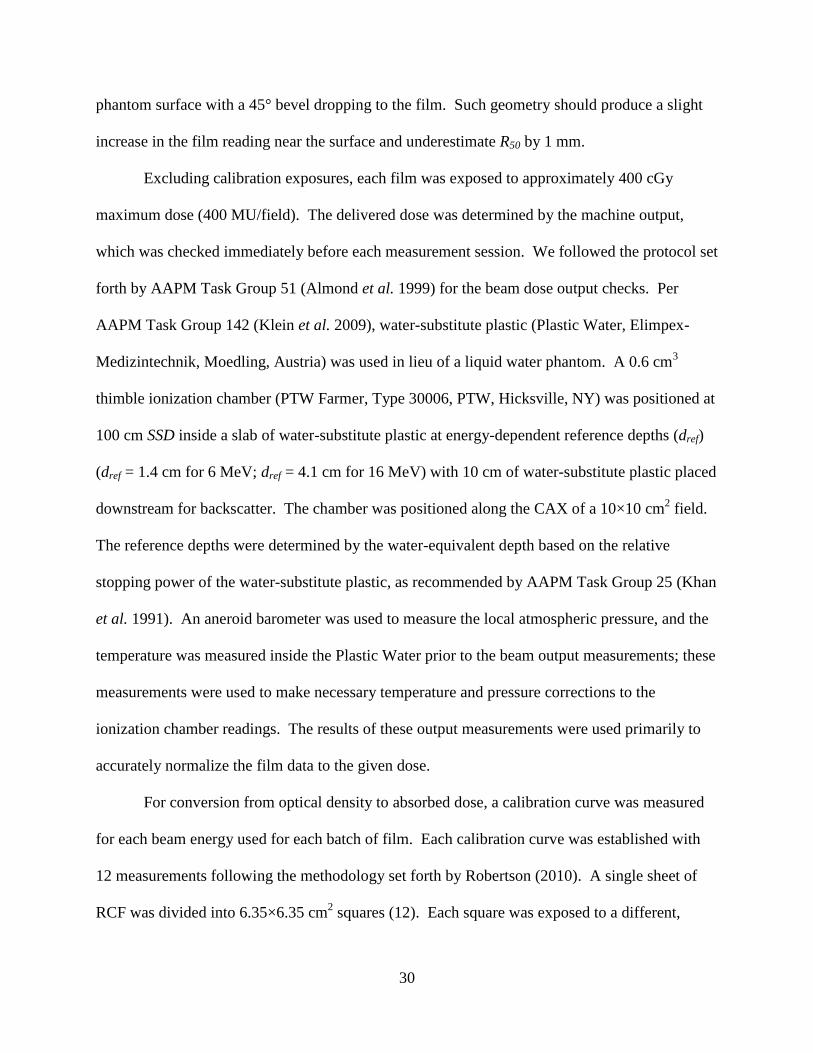
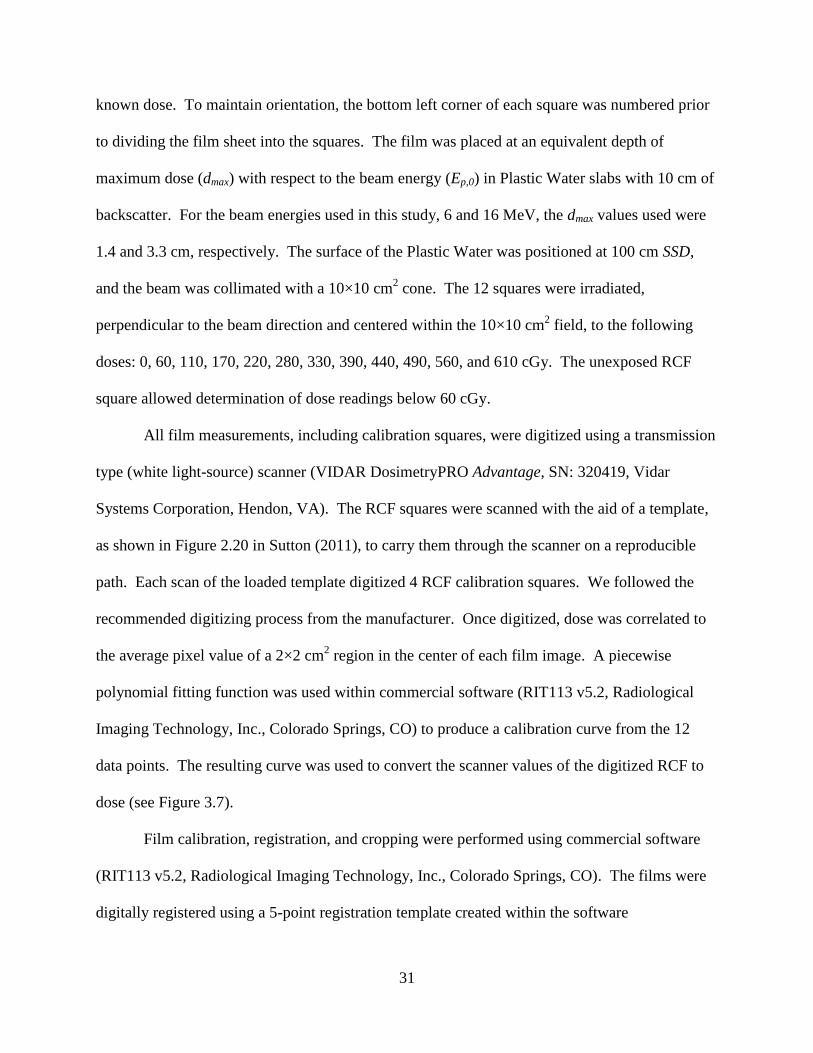
Figure 3.8: Isodose plots of the measured dosimetric data for the investigation into the
dosimetric effects of eSC bevel angles ................................................................. 37
Figure 3.9: Isodose plots of the measured dosimetric data for the investigation into the
dosimetric effects of eSC bevel angles ................................................................. 39
Figure 3.10: Isodose plots of the measured dosimetric data for the investigation into the
dosimetric effects of eSC bevel angles ................................................................. 41
Figure 3.11: Uniformity within 90% plotted from bevel angle dosimetric measurements ......... 43
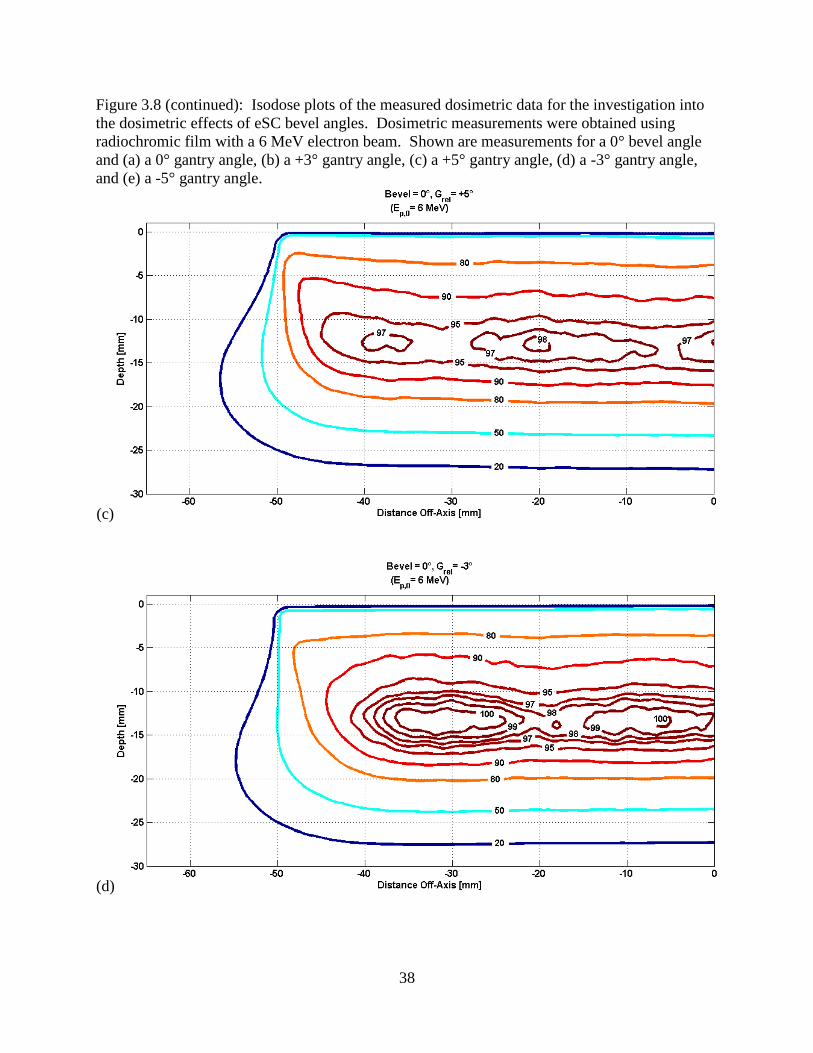
Figure 3.12: Lateral profile plots plotted from bevel angle dosimetric measurements ............... 44
Figure 3.13: Profile relative dose maxima plotted from bevel angle dosimetric
measurements ........................................................................................................ 45
Figure 3.14: Measured 90% relative dose area comparison. The bevel angle was held
constant at 0° and the gantry was varied at 0°, ±3°, and ±5° ................................ 46
Figure 3.15: Measured 90% relative dose area comparison of bevel angles. Relative gantry
angle was held constant at 0° for Cerrobend eSCs with bevel angles of 0°,
+10°, and -10° ....................................................................................................... 47
Figure 3.16: Measured 90% relative dose area comparison of bevel angles. Relative gantry
angle was held constant at -5° for Cerrobend eSCs with bevel angles of 0°,
+10°, and -10° ....................................................................................................... 47
Figure 3.17: Measured 90% relative dose area comparison of bevel angles. The bevel angle
was held constant at +10° with the gantry varied at 0°, +5°, and -5° ................... 48
Figure 3.18: Measured 90% relative dose area comparison of bevel angles. The bevel angle
was held constant at -10° with the gantry varied at 0°, +5°, and -5° .................... 48

viii
Figure 4.1: MVCT fusion of the anthropomorphic head phantom (case #2) eSC ....................... 51
Figure 4.2: 3D rendering of the BEV for the cylindrical phantom taken from the TPS .............. 51
Figure 4.3: The HIWO polystyrene cylindrical phantom (Kavanaugh 2011) ............................. 52
Figure 4.4: Anthropomorphic head phantom PTVs ..................................................................... 55
Figure 4.5: Cylindrical phantom eSC and the head phantom case #1 and case #2 eSC—
[a] brass, Cerrobend, and lead and [b] brass and the wax replicas ....................... 56
Figure 4.6: kVCT and MVCT fusion images of the cylindrical phantom case .......................... 61
Figure 4.7: kVCT and MVCT fusion images of the head phantom (case #1) ............................. 62
Figure 4.8: kVCT and MVCT fusion images of the head phantom (case #2) ............................. 63
Figure 5.1: Cylindrical phantom experimental setup with Cerrobend eSC ................................. 66
Figure 5.2: Percent depth dose plots before and after the correction of the surface effect .......... 69
Figure 5.3: Plots of the uniformity within 90% relative dose region before and after the
correction of the surface effect. ............................................................................ 70
Figure 5.4: Isodose plot of the measured dosimetric data collected using the cylindrical
phantom................................................................................................................. 73
Figure 5.5: Isodose plot of the measured dosimetric data collected using the cylindrical
phantom................................................................................................................. 74
Figure 5.6: Uniformity within 90% relative dose region taken from the measured dosimetric
data collected using the cylindrical phantom ........................................................ 76
Figure 5.7: Differential dose area histogram within 90% dose region taken from the
measured dosimetric data collected using the cylindrical phantom...................... 77
Figure 5.8: Profiles taken from the measured dosimetric data collected using the cylindrical
phantom................................................................................................................. 78

ix
Figure 5.9: Isodose overlay of the measured dosimetric data collected using the cylindrical
phantom—brass eSC v. Cerrobend eSC v. lead eSC ............................................ 79
Figure 5.10: 90% relative dose area comparison taken from the measured dosimetric data
collected using the cylindrical phantom—brass eSC v. Cerrobend eSC v.
lead eSC ................................................................................................................ 80
Figure 5.11: Leakage profiles taken from measured dosimetric data collected using the
cylindrical phantom .............................................................................................. 80

x
Abstract
Purpose: Electron skin collimation (eSC) sharpens the penumbra, allowing electron
radiotherapy of cancers while minimizing dose to adjacent normal tissue, e.g., protecting the eye
in treating eyelid and nose cancers. This study assessed the clinical potential for milled brass
eSCs to replace manually-fabricated lead or Cerrobend eSCs.
Methods: Aim one was to measure the influence of eSC edge angle on the dose distributions,
which were measured under edges of lead eSCs for combinations of three bevel (0°,±10°) and
five gantry (0°,±3°,±5°) angles for a 6-MeV beam. Aim two was to validate the dimensional
conformity of three machined brass eSCs, one designed for a cylindrical phantom and two for an
anthropomorphic head phantom. eSC shapes were compared using megavoltage computed
tomography (MVCT) of brass eSCs, kilovoltage computed tomography (kVCT) of wax replicas,
and physical measurements. Aim three compared dose distributions in the cylindrical phantom
for a brass eSC (≈ 7×9 cm2) with those for lead and Cerrobend eSCs at 16-MeV. All dose
distributions were the average of three radiochromic EBT2 film measurements.
Results: Aim one showed all combinations of (0°,±10°) bevel and (0°,±3°,±5°) gantry angles to
have insignificant effect on penumbral width (≈ 0.5 mm). Increased dose from scatter, as great as
11% near the edge, was clinically insignificant because of low surface dose for 6 MeV beams
and insignificant change in R90. Aim two showed MVCT, kVCT, and physical measurements
useful for quality assurance. Also, it revealed that distal eSC surfaces matched designs (≤ 2 mm),
that thicknesses deviated ≤ 1.5 mm from design, and that two of three eSCs had aperture edges
focused ≈20 cm above the eSC generating errors up to 3 mm. Aim three showed the brass eSC to
have comparable radiation leakage, penumbral width, field width, and coverage of distal 90%
dose contour, but increased scatter dose (3-10%).

xi
Conclusions: Results indicated that machined brass eSC holds good potential for replacing lead
or Cerrobend eSCs. Prior to clinical utilization, two recommendations are (1) to eliminate the
cause of incorrect divergence in the aperture edges and (2) to determine the bevel angle that
minimizes scatter dose from brass eSC edges.

1
Chapter 1: Introduction
Skin cancer is a major health care problem in the United States; in 2010 and 2011,
approximately 75,000 new cases of skin cancers were diagnosed, resulting in nearly 12,000
deaths (Jemal et al. 2010; Siegel et al. 2011). With the departure of orthovoltage x-ray machines
from the clinic, as Co-60 and linear accelerators became the machine of choice in the 1960s and
1970s (Brahme 1987), electron therapy became an essential clinical modality for the treatment of
skin and other superficial cancers. Some of the advantages of this treatment modality include a
characteristically high surface dose, a sharp surface dose buildup (<10 mm) of delta rays, a
relatively uniform dose plateau as dose slowly builds up due to multiple Coulomb scatter, and a
steep distal dose fall-off (Hogstrom 2003). Electrons have been used to treat cancer target
volumes within 6 cm of the surface, primarily in the head, neck, and chest wall (Hogstrom 2003).
These include superficial or skin lesions, involving basal cell and squamous cell carcinomas
(primarily of the head and neck) (Tapley 1976), total limb electron irradiation (Wooden et al.
1996), and total skin electron irradiation (TSEI) for the treatment of mycosis fungoides
(Karzmark et al. 1987; Khan et al. 1991). The function of skin collimation in electron therapy is
to minimize the penumbra when treating in close proximity to critical structures, which is
especially important for low energy electron beams, small fields, extended treatment distances,
using bolus (on or off the patient surface), and using arc therapy (Hogstrom 2003).
Electron skin collimation (eSC) is often used in the head and neck region due to the
typically small field size, as well as the proximity of critical structures to the treatment volume
(Hogstrom 2003). For small field sizes, eSC sharpens the penumbra allowing better dose
homogeneity and, as a result, improves coverage of the therapeutic region (i.e., within the 90%
dose contour), as shown in Figure 1.1 (Hogstrom 1991). As such, the treatments of small lesions

2
(e.g., on the eyelids and inner canthi) can be significantly enhanced with the incorporation of
eSC (Tapley 1976). Bolus is frequently used in the treatment of the nose due to the irregular
surface of the nose and tissue inhomogeneities, and in such cases, eSC is often used to restore
penumbral sharpness beneath the bolus (Million et al. 1991) (see Figure 2.3).
Figure 1.1: Comparison of dose distributions for a 6 MeV, 3×3 cm
2 beam. (a) A larger field
size is reduced to a 3×3 cm2 field size using eSC. (b) The 3×3 cm
2 field size is collimated by the
treatment head collimators (10 cm air gap), which results in diminished penumbral sharpness and
a reduction of the coverage of the 90% dose region (Hogstrom 1991).
Despite the improvements made by eSC in certain situations, utilization of eSC remains
somewhat limited because of challenges associated with its on-site fabrication (e.g., time, labor,
expertise, cost, and toxicity of materials). Additionally, with the widespread incorporation of x-
ray multi-leaf collimators (xMLC) on linear accelerators, the number of mould rooms dedicated
to the fabrication of in-house collimation (x-ray blocks) and treatment aids (compensators) has
dwindled. In an effort to expand the availability and convenience of electron skin collimation, a
commercial medical device manufacturer (.decimal, Inc., Sanford, FL) is developing the
capability to provide custom skin collimators milled from brass whose shape is based on patient-
specific CT data. Prototype eSCs are manufactured from brass using a computer numerical
control (CNC) milling machine. The eSC can be designed relatively easily within a commercial
Treatment Planning System (TPS), and the coordinates of the skin collimator contours, based on
the CT coordinate system, can be used to generate data electronically delivered to the eSC
3
manufacturer for machining. An eSC requires approximately an hour to design and upload to the
manufacturer. The manufacturer should be able to mill the eSC and mail it to the clinic within a
24-48 hour time period at a reasonable cost. Comparatively, approximately 12 hours of clinical
staff time is required for in-house design and construction. In principle, milled collimators
should be more accurate than in-house fabrication (i.e., better fit the patient surface, more exact
aperture shape, and more uniform thickness than Cerrobend). However, the literature does not
contain any reports on the dosimetric performance of a third-party milled eSC device.
The practice at our clinic (Mary Bird Perkins Cancer Center) has been to construct
Cerrobend skin collimators with “open” beveled edges defining the aperture. “Open” beveled
edges, as compared to straight edges, allow fine tuning of the gantry angle (±5°) by the radiation
oncologist after fabrication without modifying the projected electron field on the patient and also
should prevent small rotational setup errors from having a substantial dosimetric impact. With a
straight edge, the upstream surface of the skin collimator will define the edge on the side of the
eSC to which the gantry is rotated (e.g., a 5° rotation will shrink the field edge positioned on
central axis by approximately 1 mm for an eSC with a thickness of 1 cm), while on the opposite
side of the eSC, the number of electrons grazing the collimator edge increases. Although “open”
beveled eSC edges removes the former issue, it increases the number of electrons grazing the
collimating edge surface, which further impacts the collimator-scattered electrons striking the
patient. Verhaegen et al. (2001) reported some results of how the electron dose distribution is
perturbed by the presence of eSC, particularly near the eSC aperture edge and under the eSC.
Near the eSC edge, a lobe of increased dose is formed by scattered electrons at a seemingly
predictable angle relative to the nominal beam direction at the surface. Based on Monte Carlo
calculations, their results showed that, in general, a decrease in electron beam energy caused an

4
increase in the angle of the lobe of increased dose and that this effect is almost independent of
eSC thickness. The literature contains some other studies that address electrons scattering at a
collimator edge (Beardmore 2007; Chi et al. 2005; Lax and Brahme 1980), but the applicability
of these studies to optimizing the design of eSCs is limited. As such, there is incomplete
knowledge of the dosimetric impact of the selection of the edge angle of collimators for the
treatment of skin lesions.
The purpose of this study was to evaluate the potential for a commercial device
manufacturer to mill brass skin collimators that are clinically acceptable (i.e., comparable or
better than skin collimators of lead or Cerrobend currently being fabricated in-house). One key
eSC design feature, the angle of the aperture edges and its effects on the dose distribution via
collimator scatter, will be examined. Also, dosimetric features of a milled brass eSC will be
compared with that of lead eSC and Cerrobend eSC that were fabricated using the current in-
house methods. The results of this study will be important because they should provide
information useful for determining the clinical potential of a milled brass eSC system.
The hypothesis of this project was [1] that a third-party milled brass eSC, with its
collimating edge parallel to the mean direction of the divergent electron beam, can be milled
accurately, i.e., within design parameters and [2] that it will be dosimetrically equivalent to
current lead and Cerrobend eSCs, with edges parallel to the beam central axis and an open bevel
angle of 10°, respectively.
For [1] “accuracy” was assessed using the following criteria:
eSC brass thickness will agree with design thickness within ± 1 mm.
Distal surface of the eSC will agree with the skin surface within 2 mm.
The eSC edge will agree with the design of the aperture within ± 2 mm.

5
For [2], dosimetric equivalence was assessed using the following criteria:
Change of R90 on central axis will be ≤ 1 mm
Change in maximum dose value will be ≤ 5%
Change in penumbral width (P80-20) will be ≤ 2 mm
This hypothesis was tested by completing the following specific aims:
Aim 1: Measure the influence of collimator edge angle on the properties of dose
distribution. The influence of the collimator edge angle (0°, ±10°) on the lateral penumbral
width and dose uniformity in a simple, homogeneous, box-shaped phantom was evaluated for a 6
MeV electron beam with multiple gantry angles (0°, ±3°, ±5°).
Aim 2: Validate the dimensional conformity of the machined brass eSC to the planned eSC
design. The dimensional accuracy of the machined eSCs (thickness, shape of the distal surface,
and shape of the aperture) was examined using an MVCT fusion of the brass eSC as well as a
kVCT fusion of a wax replica of the brass eSC with the design. Also, manual measurements
were used. Results were compared with the design shapes determined by the TPS. Calculated
distances within the CT coordinate system were used to verify design conformity and also to
discern any observable differences in the CT fusions from potential imaging artifacts.
Aim 3: Evaluate the dosimetric performance of a machined brass eSC and compare to that
for the current standard of care (lead or Cerrobend eSC). The results of dosimetric
validation tests, which were collected using collimators fabricated according to the current
standard of care (Cerrobend collimation and lead collimation fabricated in-house), as well as the
proposed standard of care (milled brass collimators fabricated off-site), were compared to assess
dosimetric equivalence of the collimating materials. Dosimetric performance was evaluated by
measurement of the dose distribution in a cylindrical phantom for a 16 MeV electron beam
incident on an irregular eSC aperture (≈ 7×9 cm2).

6
Chapter 2: Properties and Techniques for Fabrication of eSCs
2.1 Determination of Skin Collimator Attributes for Clinical Use
2.1.1 Skin Collimators Made from Lead
A significant portion of electron skin collimators (eSCs) used for electron radiotherapy is
manually fabricated using multiple thin sheets (≈1.5 mm) of lead. Lead (Z = 82, ρ = 11.34
g/cm3) is well suited for skin collimator fabrication due to its relatively high linear stopping
power and malleability at room temperature. This malleability facilitates fabrication of electron
skin collimation (eSC) that closely follows the contour of the patient’s surface. Due to the
hazardous nature of lead to humans, handling precautions must be observed and guidelines must
be followed at the time of its disposal. Since skin collimators serve to shape the electron beam
incident on the patient, the collimator must be of sufficient thickness to stop the primary
electrons, i.e., reduce the transmission of dose to the expected level of bremsstrahlung outside
the collimator’s aperture. To determine this minimum thickness, tPb, the following equation was
utilized:
[ ] ≈ ( [ ]
) , (2.1)
where Ep,0 is the most probably electron beam energy at the surface (Khan et al. 1991). This
“rule-of-thumb” applies to the interval of clinically utilized electron beam energies (4 to 20
MeV).
The shape of the treatment field is delineated by the physician, using either CT data or
patient anatomy. The aperture shape of the eSC is then produced based on the specifications of
the physician’s drawing. The eSC is fabricated using the following process: first, using mould
technique (e.g., Watkins (1981)), a plaster stone bust positive of the region of the patient
containing the treatment field was created that included the area to be irradiated. The treatment

7
field was then directly drawn on the patient-surrogate by the physician, or in some cases, it was
drawn on the patient, for which case it was carried through in the moulding process (Watkins
1981). A ball-pein hammer is typically used to conform the lead eSC to the contour of the
patient surface.
Using the physician-defined aperture shape, the aperture was cut from a number of lead
sheets. The eSC was laterally extended to intercept the penumbra formed by the upstream
collimation, consisting of an electron applicator with or without an applicator insert (Hogstrom
2003) (Figure 2.1). The malleability of lead makes precise dimensional accuracy of the aperture
difficult to achieve. The lead eSC edges are usually approximately perpendicular to the patient
surface due to the lack of precision in common fabrication methods, and the outer portion of the
eSC is sometimes flared away from the patient surface (see Figure 2.2), typically to
accommodate patient setup and improve comfort. Two clinical examples are shown in Figures
2.2 and 2.3.
Figure 2.1: eSC lateral extention. (a) A side view of a hypothetical treatment setup shows the
larger field formed within the treatment head that is further reduced downstream by the eSC. A
beam’s eye view is shown in (b) to further illustrate that the eSC should be laterally extended to
intercept the penumbra formed by the upstream collimation (Hogstrom 1991).

8
Figure 2.2: Clinical example of scalp irradiation incorporating lead eSC and an acrylic scatter
plate (Hogstrom 1991).
Figure 2.3: Clinical example of whole nose irradiation using lead eSC to collimate the beam
beneath tissue-compensating bolus (Million et al. 1991). Shown are the lead eSC on the patient
without bolus (upper-left), the bolus placed on top of the lead eSC (lower-left), and an
illustration of the expected impact of the bolus on the dose distribution (right) without eSC.

9
2.1.2 Skin Collimators Made from Cerrobend
In addition to lead eSC, Cerrobend (MT-A158, MED-TEC, Orange City, IA), or
Lipowitz’s alloy, is commonly utilized as an eSC material. This is due to Cerrobend’s low
melting point (158°F), which allows for easy casting of the material. To fabricate Cerrobend
collimation, molten Cerrobend is poured into a mould and becomes rigid as it cools to room
temperature. This rigidity allows for precise shaping of the eSC edges with the use of a rotary
machining tool. Cerrobend is an alloy of bismuth (50%), lead (26.7%), tin (13.3%), and
cadmium (10%), with an effective atomic number (Zeff) of 76.8 and density of 9.4 g/cm3. To
determine the required Cerrobend collimator thickness (tCerr) to adequately shield proximal
healthy tissues, a modified form of Equation 2.1 was used:
( ) (2.2)
The 20% increase in the required thickness of the Cerrobend, compared to lead, comes from the
ratio of the density of lead (11.3 g/cm3) to Cerrobend (9.4 g/cm
3) (Khan et al. 1991).
In contrast to lead collimators, which typically had edges parallel to the beam central
axis, our clinic has traditionally preferred for Cerrobend eSC to have a “positive” (convergent)
bevel angle (Figure 2.4).
Due in part to the characteristic customized fit of Cerrobend eSC, the positioning of the
collimator on the patient surface is highly reproducible. As such, patient setup errors (e.g., head
rotation) could translate into beam angle inaccuracies with respect to the aperture. For example,
if an aperture has a perpendicular or negative (divergent) bevel angle, deviation from the
prescribed beam angle (with respect to the patient) can potentially cause a portion of the incident
beam to be scattered by the proximal (upstream) surface of the skin collimator aperture edge,
creating an increase in dose near the surface and a distal cold region, or “shadow,” in a portion of

10
the treatment field (Lax and Brahme 1980). Consequently, a positive bevel angle is preferred to
prevent a setup error from resulting in a “shadow” being cast over a portion of the treatment area
(Figure 2.5).
Figure 2.4: Schematic diagram depicting the conventions used to describe the aperture bevel
angles (ϴB°) in this study. A positive bevel angle may also be referred to as “convergent” or as
being “beveled out.” Likewise, a negative bevel may be described as “divergent” or “beveled
in.” Also visible in the figure is the convention used to describe gantry rotation (ϴG°); the
downward-pointing arrows are representative of the beam central axis and indicate the beam
direction.
In the present study, three patient-like skin collimators were fabricated using the
following technique. To fabricate a Cerrobend skin collimator, a plaster stone positive of the
region of the patient containing the treatment field was created. The treatment field was then
directly drawn on the patient-surrogate by the physician. A thin line was etched into the stone
that follows the physician-defined field shape. A wall (of Styrofoam, used for Cerrobend
shielding block construction, or a clay-like modeling compound) was then built around the stone
to dam the molten Cerrobend that was poured onto the bust. When necessary, modeling
compound was used to create small spaces between the skin collimator and any surface
structures that may hinder or prevent the separation of the eSC from the stone bust.
After the Cerrobend was poured and cooled, the stone bust was carefully pried away from
the hardened Cerrobend. The appropriate thickness of the skin collimator, per Equation 2.2, was
achieved using a soldering iron to remove excess Cerrobend from the surface of the eSC.
11
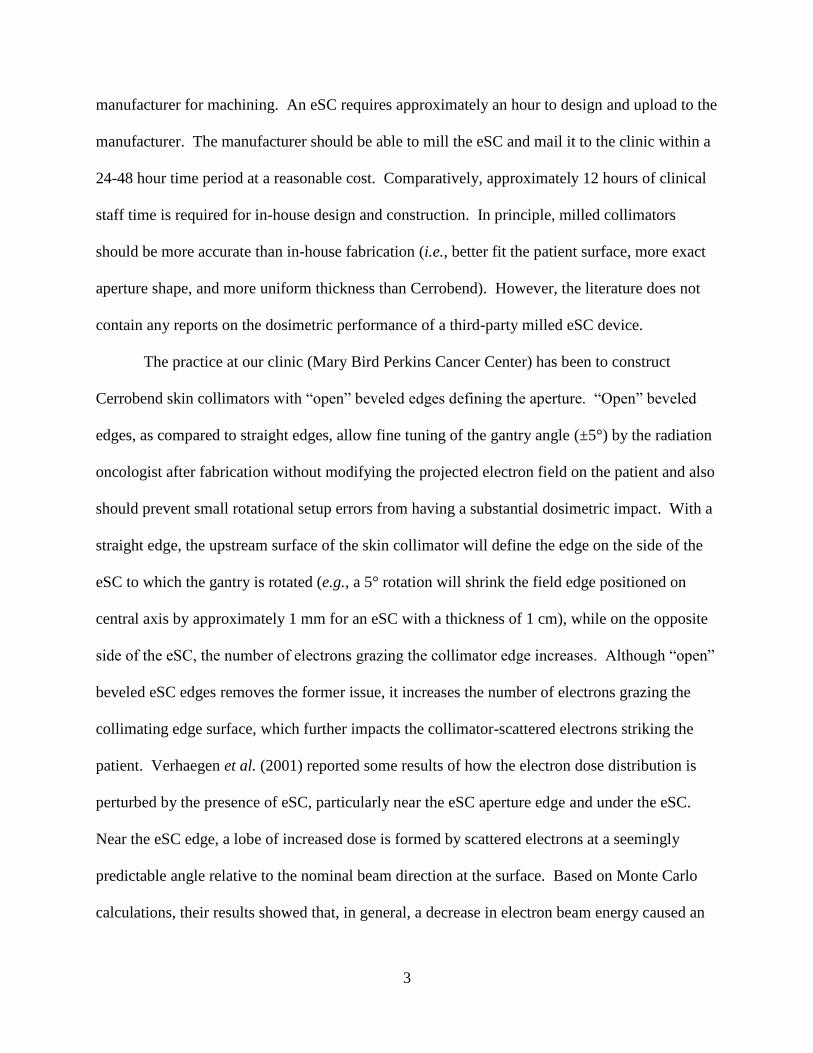
Figure 2.5: eSC “shadow”—Displayed (approximately to scale) are isodose plots for a 6 MeV
electron beam with the gantry angle (ϴG°) offset to -5° using Cerrobend eSC with (a) a +10°
bevel angle, (b) a 0° bevel angle, and (c) a -10° bevel angle. The distal surface of the eSC was
positioned 50 mm OAX, and the beam edge defined by the eSC is illustrated with a dashed red
line.
For (a) a +10° bevel angle, the geometric distance of the beam edge from 50 mm OAX at the
surface ([A]; green line, arrows) was zero. The penumbral width (P90-10) at a depth of 10 mm
([B]; orange arrows) was 8.2 mm. The distance of the projected beam edge at the depth of
maximum dose (dmax = 14 mm) from 50 mm OAX ([C]; black arrows) was 0.4 mm. The positive
bevel provides a more forgiving margin of error in the presence of rotational setup error. If a
“shadow” is cast by the eSC, penumbral sharpness is diminished, the homogeneity of dose is
reduced, and the treatment field area is reduced causing an unexpected (and potentially
undetected) deviation from the prescribed treatment.
(a)

12
Figure 2.5 (continued): eSC “shadow”—Displayed (approximately to scale) are isodose plots for
a 6 MeV electron beam with the gantry angle (ϴG°) offset to -5° using Cerrobend eSC with (a) a
+10° bevel angle, (b) a 0° bevel angle, and (c) a -10° bevel angle. The distal surface of the eSC
was positioned 50 mm OAX, and the beam edge defined by the eSC is illustrated with a dashed
red line.
For (b) a 0° bevel angle, the geometric distance of the beam edge from 50 mm OAX at the
surface ([A]; green line, arrows) was 0.7 mm. The penumbral width (P90-10) at a depth of 10 mm
([B]; orange arrows) was 10. 8 mm. The distance of the projected beam edge at the depth of
maximum dose (dmax = 14 mm) from 50 mm OAX ([C]; black arrows) was 1.3 mm. The
proximal surface of the eSC slightly reduced the field size at the surface, which resulted in a
small shift of the treatment field ([A] and [C]) and an increase in penumbral width ([B]) as
compared to the +10° beveled eSC.
(b)

13
Figure 2.5 (continued): eSC “shadow”—Displayed (approximately to scale) are isodose plots for
a 6 MeV electron beam with the gantry angle (ϴG°) offset to -5° using Cerrobend eSC with (a) a
+10° bevel angle, (b) a 0° bevel angle, and (c) a -10° bevel angle. The distal surface of the eSC
was positioned 50 mm OAX, and the beam edge defined by the eSC is illustrated with a dashed
red line.
For (c) a -10° bevel angle, the geometric distance of the beam edge from 50 mm OAX at the
surface ([A]; green line, arrows) was 3.3 mm. The penumbral width (P90-10) at a depth of 10 mm
([B]; orange arrows) was 10.1 mm. The distance of the projected beam edge at the depth of
maximum dose (dmax = 14 mm) from 50 mm OAX ([C]; black arrows) was 3.8 mm. The
proximal surface of the eSC substantially reduced the field size at the surface, which resulted in a
significant shift of the treatment field ([A] and [C]) and an increase in penumbral width ([B]) as
compared to the +10° beveled eSC.
(c)

14
2.1.3 Machined (Brass) Skin Collimators
To circumvent the previously established difficulties associated with skin collimation
fabrication, a commercial device manufacturer (.decimal, Inc.) is developing the capability to
provide custom brass skin collimators to clinics unable or averse to create eSC in-house. Brass
is an alloy of Copper and Zinc, and the proportions of each can be varied to exploit various
properties (such as hardness and density) of the component elements. The density of the brass
used by the manufacturer was reported to be 8.498 g/cm3. Thickness calculations for skin
collimation constructed from this material were calculated according to
( ), (2.3)
as (ρPb / ρbrass) = (11.3 / 8.5) ≈ 1.3. Several properties contributed to the selection of brass as the
material to be used for the manufacturer’s eSC. Required thickness of the eSC and production of
bremsstrahlung dose are minimized by the high density and intermediate atomic number,
respectively, of brass. Additionally, brass is durable and is an excellent machining material
(Hogstrom et al. 1985). The absorbed dose due to electrons scattered through a collimator edge
is inversely proportional to the density of the collimating material and only has a weak
dependence on energy and atomic number (Lax and Brahme 1980). Thus, due to the lower
density of Cerrobend and brass, relative to that of lead, a small increase in dose near the eSC
aperture edges was expected due to scattered electrons.
2.1.3.1 Computer-Aided Design of Machined Skin Collimation
The brass eSC machined by the manufacturer was designed within a commercial
Treatment Planning System (TPS) (Philips Pinnacle3, Philips Electronics North America
Corporation, Andover, MA) by first scanning the patient—or phantom in our case—on a kVCT
scanner. A large bore, multi-slice CT scanner (GE LightSpeed, General Electric Medical

15
Systems, Fairfield, CT) was used in this study. The phantom image sets were acquired using
common clinical settings for kVCT scans: the tube current and tube potential were 400 mA and
120 kVp, respectively. The phantoms were imaged using the helical scanning technique with a
pitch of 0.938 and a slice thickness of 2.5 mm. The central sagittal plane of the phantoms was
aligned with the sagittal laser plane of the kVCT scanner. After importing the image set into the
TPS, the brass eSC was designed using the following procedure described in the captions of
Figures 2.6-2.11.
2.1.3.2 Manufacturing of Machined Skin Collimation and Wax Replica
Once designed within the TPS, DICOM files were exported from the TPS and imported
into the manufacturer’s (.decimal, Inc.) software via file-transfer protocol. The manufacturer’s
software converted the planned eSC from its DICOM structure (i.e., a set of slice contours) into a
pair of surface meshes. This pair of surface meshes represented the proximal and distal surfaces
of the eSC with respect to the electron beam orientation. The conversion process involves ray-
tracing along the beam’s central-axis to determine the proximal and distal intersections with the
DICOM eSC structure. These surfaces are used to generate the pathways to be taken by the
milling tool during the machining process.
The skin collimator was milled from a larger block of brass. Each of the eSC surfaces
(proximal and distal) was milled separately such that the brass must be flipped between the
milling routines. The manufacturer also milled a wax replica of the eSC to be used for kVCT
quality assurance tests. The manufacturer’s quality assurance procedure involved automated
inspections of thickness at specific locations (called “control points”).

16
Figure 2.6: Design procedure within the TPS, step one—Once imported into the TPS, regions of
interests were contoured on the data sets, including critical organs (e.g., lungs, spine, eyes), the
Planning Target Volume (PTV), and the external patient surface. The PTV for this nose
simulation is depicted by the blue shaded region. The three views shown here (as well as in
Figures 2.7-2.11) are the mid-transverse CT plane (upper); mid-sagittal CT plane (lower-left);
and a 3-D rendering of the phantom as viewed from above and to the right of the phantom
(lower-right).

17
Figure 2.7 Design procedure within the TPS, step two—An electron beam was then added at an
appropriate beam energy, gantry angle, electron cone size, and collimator angle. The beam
energy was selected such that the distal surface of the PTV is encompassed by R90, the depth
reached by 90% of the given dose. While R90 should exceed the maximum depth of the PTV, the
nominal beam energy was selected with consideration for possible critical structures distal to the
PTV. The beam to be used in conjunction with the eSC was set to 105 cm source-to-surface
distance (SSD), as is common practice, to prevent any possible collision between the patient and
an electron cone. After a beam was created, an auto-surround electron block was added to
collimate the beam to follow the PTV edge. In the present case, the green lines show the edges
of a 15×15 cm2 field, and the red lines show the intended treatment field to be defined by the
eSC.

18
Figure 2.8: Design procedure within the TPS, step three—The Pinnacle
3 TPS allows for the
creation of an “auto-bolus,” which is a constant-thickness layer of (typically water-equivalent)
material that can be placed atop the patient surface. The thickness of the auto-bolus was dictated
according to the required thickness of brass calculated from Equation 2.3. The lateral extent of
the auto-bolus was extended ≥ 3cm around the PTV. When deciding the lateral extent of the
auto-bolus, which eventually became the eSC contour, consideration for the 15×15 cm2 electron
cone size was taken into account. The auto-bolus was conservatively extended laterally outside
the chosen electron cone size by 1-2 cm. The auto-bolus was then converted into an ROI. To
accomplish this, the plan was saved and exited, and the “bolus.roi” and “plan.roi” files for this
particular patient and plan were located and opened as text files. Within the “bolus.roi” file, the
text was copied from the beginning of the header reading “Beginning of Bolus ROI…” to the end
of the file. This copied text was then pasted to the end of the “plan.roi” file and saved. After re-
opening the plan, the fully editable auto-bolus ROI appeared at the end of the ROI list as an
unnamed ROI.

19
Figure 2.9: Design procedure within the TPS, step four—After enabling the beam visualization
option, a contour was made to conform to the edge of the beam. This resulted in a trapezoidal
contour on each slice containing the visualized beam edge that had been collimated down by the
auto-surround electron block. We defined the aperture bevel angle to follow the beam
divergence because assuming the absence of setup error, the ideal angle for the aperture bevel
will match the angle of the beam fan-line at each specific lateral extent from central axis (CAX)
(Lax and Brahme 1980).

20
Figure 2.10: Design procedure within the TPS, step five—The final step in forming the contour
of the eSC was to subtract the contour of the field edge (upstream from the phantom surface)
from the auto-bolus contour to create the field-defining aperture. The resulting ROI’s density
was assigned at 8.498 g/cm3, i.e., the density of the machined brass eSC. The eSC ROI was
inspected for appropriate thickness and coverage then designated as the contour of the desired
eSC.

21
Figure 2.11: Design procedure within the TPS, step six—The ROIs and plan were exported from
the TPS and uploaded into the manufacturer’s commercial software (p.d v4.2, .decimal, Inc.,
Sanford, FL). p.d v4.2 is .decimal, Inc.’s proprietary software used to convert an ROI’s spatial
information into a format compatible with CNC machinery. Once in the manufacturer’s
software, the appropriate ROI was selected, optimized, and submitted to the manufacturer for
production. The optimization process performs coordinate system transformations necessary to
facilitate electronic submission to the manufacturer and compatibility with their CNC milling
machinery.

22
Chapter 3: Specific Aim 1—Dosimetric Influence of eSC Bevel Angle
3.1 Methods and Materials
3.1.1 Variation of the Angle of the Aperture Edge
The introduction of collimation to an electron beam is known to degrade and perturb the
homogeneity of a dose distribution near the field edge due to electrons scattered from the
collimator edge (Lax and Brahme 1980). The present study investigated the significance of the
collimator edge angle (ϴB).
A collection of fifteen Cerrobend skin collimators was used to establish a range of
aperture edge angles (with respect to the beam CAX) that would be considered typical of clinical
applications (Figure 3.1). These collimators had been previously used in our clinic for the
treatment of various head and neck lesions. On each collimator, the aperture edge angle, or
bevel angle, was measured at four locations—the superior, inferior, left, and right edges. A
stainless steel protractor equipped with a 15.24 cm locking arm was used to measure these angles
(Figure 3.2). For these measurements, the arm of the protractor was positioned along the bevel
surface, and the face of the protractor was positioned proximal to the eSC aperture and
approximately perpendicular to the beam direction, such that the bevel angles were measured
with respect to the CAX of the electron beam. Another set of measurements was taken from this
collection of skin collimators to characterize the thickness of Cerrobend collimators.
3.1.2 Variation of Gantry Angle from Nominal Delivery Angle
As previously stated, the aperture angle is often beveled “out” (positive bevel angle) in
order to account for rotational setup error, or to avoid casting a “shadow” across a portion of the
field (Figure 2.5). In some situations, precise patient positioning or accurate skin collimator
placement, can be difficult to achieve with consistency. Typically, markings are made on the

23
patient surface to facilitate proper positioning, as patient positioning errors can cause significant
changes to the dose distribution. To simulate an angular setup error in which the patient is
positioned with a minor rotational error, the gantry angle was systematically varied. For the
investigation of the dosimetric effects of the bevel angles, film measurements were collected for
beveled collimators at relative gantry angles (ϴB) of 0°, ±3°, and ±5°, where a 0° angle is
considered to be the nominal gantry position in which the beam is aimed toward the ground. In
this study, a positive gantry angle denotes a clockwise gantry rotation as shown in Figure 3.3. In
the analysis of this data, each field was halved along CAX , and the right half was mirrored (left-
to-right), i.e., for the analysis, the beveled eSC was always located on the left, and the CAX was
to the right. Thus, when the left half had a +ϴG°, the right half had a -ϴG°.
Figure 3.1: Collection of patient Cerrobend skin collimators used to determine common clinical
attributes. The general treatment sites are as follows: whole nose (1-4), inner canthus (5), partial
nose (6-9), scalp/cheek/forehead (10-12), and ear (13-15).

24
Figure 3.2: In the image at left, approximate locations of protractor measurements are marked
with yellow lines around the aperture edge: superior, inferior, right and left. The protractor used
is pictured on the right.
Figure 3.3: The gantry angle is referenced in this study with respect to the nominal gantry
position (i.e., with the treatment head directly above the couch and the beam directed straight
downward). We refer to this nominal position as a relative gantry angle (Grel) of 0°. The yellow
arrow represents the nominal beam direction, while the green and red arrows indicate the
direction of positive and negative rotations, respectively. The curved arrows represent the
direction of rotational movement of the treatment head, and the straight arrows represent the
beam direction.
25
3.1.3 Effects of Beveled Collimator Edges—Experimental Setup
To assess the dosimetric impact of the bevel angle, blocks were fabricated of Cerrobend
with one edge tapered to 0° and 10° (see Figure 3.4). These angles were chosen based on the
previously established range of aperture edge angles taken from manual measurements of the
fifteen Cerrobend skin collimators and considered typical of clinical applications. To simulate
the anticipated margin of error in patient set-up and physician adjustment of gantry angle, the
gantry angle was varied at 0°, 3°, and 5°. To satisfy requirements of Specific Aim 1, we
surveyed certain aspects of the current standard of care at our institution for the use of eSC with
electron beam therapy. We were primarily interested in angle of the aperture edge, or bevel
angle. Dimensional measurements were taken of fifteen Cerrobend eSCs that were previously
used for treatments in our clinic. A summary of that survey, presented below in Table 3.1,
showed the mean angle (±σ) was +30.4° (±9.0°). While eSC thickness is determined by the
nominal beam energy and the collimating material used, the thickness measurements in Table 3.1
were a reasonable indicator of the typical eSC thickness, as well as the wide interval of possible
thicknesses.
A preliminary investigation was performed using eSCs with bevel angles of +30°, +20°,
+10°, 0°, -10°, -20°, and -30° and a 12 MeV electron beam. We observed that the eSC with
bevel angles of +20° and +30° both resulted in a noticeable increase in dose at shallow depths
near and behind the beveled eSC edge (Figure 3.5). Presumably, this increase in surface dose
was due to an increase in the number of electrons scattered from the eSC edge, as well as
electrons penetrating the thinner portion of the bevel and depositing their remaining energy near
the surface of the phantom. Despite an average bevel angle of +30.4° in our clinical sample and
based on these preliminary data on the effects of bevel angle variations at 12 MeV, the bevel

26
angle interval from -10° to +10° using a 6 MeV beam was selected for the focus of this
investigation. With future machined eSC and with the optimal angle presumably being parallel
to the beam divergence, a bevel angle greater than ±10° seems suboptimal.
Dosimetric measurements were made using radiochromic film (RCF) in slabs of water-
substitute plastic. To account for any non-uniformity in the slabs that might yield discrepancies
in dose distribution, the slabs were positioned identically for each measurement. The slabs were
compressed by bar clamps to minimize the effect of any air gaps between the film and the slab
(Figure 3.6b). Three film measurements (n = 3) were taken for each setup. Measurements were
taken at 100 cm SSD on a linear accelerator (Clinac 21EX 4-10, Varian Medical Systems, Inc.,
Palo Alto, CA) using an electron beam energy of 6 MeV. A 15×15 cm2 applicator collimated the
beam. The beveled skin collimator was placed on the surface of the phantom, further collimating
the field width to 10 cm. The RCF was exposed en face (edge-on) to approximately 400 cGy at
dmax. The ranges of bevel and gantry angle variations selected for this study are listed in Table
3.2. The specific setups used to measure the effects of bevel and gantry angle variations are
listed in Table 3.3.
Table 3.1: Results from a survey of aperture bevel angles and thicknesses measured from fifteen
eSCs made of Cerrobend that were previously used in our clinic.
eSC Bevel Angle
[°]
eSC Thickness
[mm]
Mean 30.4 9.0
Standard Deviation 9.0 3.5
Maximum 50.0 22.1
Minimum 5.0 3.8

27
Table 3.2: The field setups used to measure the selected ranges of bevel and gantry angle
variations. The cells of the measured fields are marked with a ‘’ on a yellow background.
Details of how this was accomplished using 6 setups is shown in Table 3.3.
Table 3.3: The specific field setups used to measure the effects of bevel and gantry angle
variations for Ep,0 = 6 MeV.
Figure 3.4: Example setup of the phantom apparatus used for bevel angle measurements. The
two beveled collimators pictured are the +30°collimator (on left) and the +20°collimator (on
right). Each are placed 5 cm from central axis atop four-5 cm slabs of solid water. This image
was taken during our preliminary investigation using a 12 MeV beam and including bevel angles
up to 30°.
-5 -3 0 +3 +5
+10
0
-10
Gantry Angle [°]Bevel Angle
[°]
Ep,0
[MeV]
Field
Index
eSC Bevel
(Patient Right)
[°]
eSC Bevel
(Patient Left)
[°]
Gantry relative to
Right eSC
[°]
Gantry relative to
Left eSC
[°]
6.1 0 0 0 0
6.2 0 0 -3 +3
6.3 0 0 -5 +5
6.4 +10 +10 -5 +5
6.5 -10 -10 -5 +5
6.6 +10 -10 0 0
6

28
Figure 3.5: Example isodose distributions of 12 MeV preliminary bevel data—0° (upper-left)
and +10° (upper-right), +20° (lower-left), and +30° (lower-right) bevels with a 0° gantry angle.
The 10% (violet) and 20% (blue) isodose curves show the penetration of the incident electrons
through the thinner portion of the eSC bevel, and an increase in dose from electrons scattered
from the eSC aperture edge can be seen in the 90% isodose curve as it is drawn more toward the
surface for the +30° bevel.

29
3.1.4 Effects of Beveled Collimator Edges—Film Dosimetry
RCF (Gafchromic EBT2, International Specialty Products, Wayne, NJ) (Lot #
F06110901, A09171003, and A12041005A) was used to quantify the effects of beveled
collimator edges. Each 20.3×25.4 cm2 sheet of film was halved into two 20.3×12.7 cm
2 sheets,
one of which was then placed between the two inner slabs of water-substitute plastic, with the
edge aligned to the proximal surface. Dutreix and Dutreix (1969) reported for radiographic film
[1] that if the film edge is not precisely aligned to a phantom surface, en face film measurements
with the film protruding outside (inside) the phantom surface can underestimate (overestimate)
dose near the surface (depth < 2 cm) by as much as 10% for a 0.1 cm error (Figure 3.6a) and [2]
that if any air gap (0.25-0.75 mm) exists between the film and phantom, the film measurements
underestimate the dose at the surface before sharply increasing to overestimate the dose by 10%-
30% (Figure 3.6b). The former was addressed by placing the factory-cut edge at the phantom
surface per the procedure described in the next paragraph. The latter was addressed by using two
bar clamps to compress the phantom enveloping the RCF. However, even making these
changes, Robertson (2010) noted an unexplained surface effect, wherein the RCF measurements
consistently underestimated the dose by as much as 3-4% at shallow depths (< 2 cm) at higher
electron energies (16-20 MeV).
Efforts were made to ensure appropriate and consistent alignment of the film. Alignment
marks were made on the inner surface of the phantom to center the film laterally and position the
film edge at the surface. As the phantom edges were slightly beveled (45° bevel, 1 mm deep),
the film was placed at the bevel corner to ensure that the film did not extend into the air, and the
distal film edge was taped to the inner surface of the phantom to prevent the film from shifting
during phantom construction. This resulted in the film edge being 1 mm below the bulk of the
30
phantom surface with a 45° bevel dropping to the film. Such geometry should produce a slight
increase in the film reading near the surface and underestimate R50 by 1 mm.
Excluding calibration exposures, each film was exposed to approximately 400 cGy
maximum dose (400 MU/field). The delivered dose was determined by the machine output,
which was checked immediately before each measurement session. We followed the protocol set
forth by AAPM Task Group 51 (Almond et al. 1999) for the beam dose output checks. Per
AAPM Task Group 142 (Klein et al. 2009), water-substitute plastic (Plastic Water, Elimpex-
Medizintechnik, Moedling, Austria) was used in lieu of a liquid water phantom. A 0.6 cm3
thimble ionization chamber (PTW Farmer, Type 30006, PTW, Hicksville, NY) was positioned at
100 cm SSD inside a slab of water-substitute plastic at energy-dependent reference depths (dref)
(dref = 1.4 cm for 6 MeV; dref = 4.1 cm for 16 MeV) with 10 cm of water-substitute plastic placed
downstream for backscatter. The chamber was positioned along the CAX of a 10×10 cm2 field.
The reference depths were determined by the water-equivalent depth based on the relative
stopping power of the water-substitute plastic, as recommended by AAPM Task Group 25 (Khan
et al. 1991). An aneroid barometer was used to measure the local atmospheric pressure, and the
temperature was measured inside the Plastic Water prior to the beam output measurements; these
measurements were used to make necessary temperature and pressure corrections to the
ionization chamber readings. The results of these output measurements were used primarily to
accurately normalize the film data to the given dose.
For conversion from optical density to absorbed dose, a calibration curve was measured
for each beam energy used for each batch of film. Each calibration curve was established with
12 measurements following the methodology set forth by Robertson (2010). A single sheet of
RCF was divided into 6.35×6.35 cm2 squares (12). Each square was exposed to a different,
31
known dose. To maintain orientation, the bottom left corner of each square was numbered prior
to dividing the film sheet into the squares. The film was placed at an equivalent depth of
maximum dose (dmax) with respect to the beam energy (Ep,0) in Plastic Water slabs with 10 cm of
backscatter. For the beam energies used in this study, 6 and 16 MeV, the dmax values used were
1.4 and 3.3 cm, respectively. The surface of the Plastic Water was positioned at 100 cm SSD,
and the beam was collimated with a 10×10 cm2 cone. The 12 squares were irradiated,
perpendicular to the beam direction and centered within the 10×10 cm2 field, to the following
doses: 0, 60, 110, 170, 220, 280, 330, 390, 440, 490, 560, and 610 cGy. The unexposed RCF
square allowed determination of dose readings below 60 cGy.
All film measurements, including calibration squares, were digitized using a transmission
type (white light-source) scanner (VIDAR DosimetryPRO Advantage, SN: 320419, Vidar
Systems Corporation, Hendon, VA). The RCF squares were scanned with the aid of a template,
as shown in Figure 2.20 in Sutton (2011), to carry them through the scanner on a reproducible
path. Each scan of the loaded template digitized 4 RCF calibration squares. We followed the
recommended digitizing process from the manufacturer. Once digitized, dose was correlated to
the average pixel value of a 2×2 cm2 region in the center of each film image. A piecewise
polynomial fitting function was used within commercial software (RIT113 v5.2, Radiological
Imaging Technology, Inc., Colorado Springs, CO) to produce a calibration curve from the 12
data points. The resulting curve was used to convert the scanner values of the digitized RCF to
dose (see Figure 3.7).
Film calibration, registration, and cropping were performed using commercial software
(RIT113 v5.2, Radiological Imaging Technology, Inc., Colorado Springs, CO). The films were
digitally registered using a 5-point registration template created within the software

32
corresponding with a physical template. Prior to scanning, the physical registration template was
used to precisely mark each film. The digitized film images were exported for analysis,
including normalization, using in-house MATLAB software (The Mathworks, Nattick, MA).
Each film data array was normalized to the given dose, adjusted for the beam output measured
just prior to irradiation of the films.
(a) (b)
Figure 3.6: Common errors seen in film dosimetry of high energy electrons related to imprecise
experimental setup as demonstrated by Dutreix and Dutreix (1969). Shown are (a) the effects of
film edge misalignment and (b) effect of air gap between the film and the phantom for en face
film measurements.
Figure 3.7: Measured RCF calibration dose points with a piecewise polynomial fit.

33
3.1.5 Comparison of Measured Dose Distributions
3.1.5a Therapeutic Dose Region
Measured dose distributions were compared using several quantitative metrics. Of
particular interest was the 90% relative dose region, as prescriptions for electron therapy are
defined such that the PTV should be encompassed by this isodose line. To investigate this
agreement, pixel values greater-than or equal-to 90% were gleaned from the normalized dose
array and placed into a separate array. This new array was then inspected and compared through
several different methods. With the pixel size of 0.5 mm, (1) the depth (R90) of the 90% dose
region was determined, and (2) the pixel size was used to calculate the area encompassed by the
90% isodose line within the film plane. We hypothesized that the reduction of the area within
the 90% relative dose region would be ≤ 5% and that any change in the depth of R90 on CAX
would be ≤ 1 mm.
Dose due to electrons scattered from the eSC edges will degrade the uniformity of the
dose distribution (Lax and Brahme 1980). The uniformity within the 90% dose region was
examined to observe the changes in collimator-scatter seen with the different collimating
materials and deviations in the collimator-edge construction.
3.1.5b Penumbral Width
A deviation from a 0° bevel angle will affect the amount of scatter from the collimator
edge. Additionally, the beveled collimator edge will partially attenuate some electrons and
create an increase in dose near the surface leading to a decrease in dose downstream. As such,
the sharpness of the penumbra will be diminished by the contributions of these actions (Lax and
Brahme 1980). To measure the penumbra widths, four rows of data, each at a different depth,
were taken from the normalized dose array. The chosen depths were dependent on the nominal
beam energy. The values in these rows were converted to off-axis ratios (OARs) by normalizing

34
each value to the value found at CAX. The penumbral width (P80-20) at each depth was defined
as the distance between the 80% and 20% OARs. We hypothesized that any increase in
penumbral width would be ≤ 2 mm.
3.2 Results for Specific Aim 1
For comparison of the beveled eSCs, we were interested in [1] overall dosimetric
agreement (Figures 3.8-3.10), [2] the impact of collimator scattered dose (Figures 3.8-3.11 and
3.13), [3] penumbral width (Figure 3.12), and [4] the 90% relative dose region (Figures 3.11 and
3.14-3.18). Results of isodose curves for the conditions listed in Table 3.3 are plotted in Figures
3.8-3.10. The field setup with a bevel angle of 0° and a relative gantry angle of 0° was
considered the prevailing standard of care and used as a standard of comparison. A relative
gantry angle, Grel, of 0° corresponds to a nominally positioned gantry (directly above the couch
pointing downward); as such, a positive gantry rotation would be clockwise as viewed from the
foot of the couch (Figure 3.3), while a negative gantry rotation denotes a counter-clockwise
movement of the gantry. For quantitative comparisons, Table 3.2 lists the area covered in the
film plane by the 90% region for each field, while Table 3.3 lists the distal depth of the 90%
relative dose for all measured combinations of bevel angle and relative gantry angle. The
penumbral widths, gleaned from the profiles plotted in Figure 3.12, are shown in Table 3.3.
3.2.1 Collimator Scattered Dose
Measured isodose plots for all gantry angles (0°, ±3°, and ±5°) at bevel angles of 0°,
+10°, and -10° are plotted in Figures 3.8-3.10, respectively. The eSC bevel angle had a
relatively minor influence on the dose homogeneity of the measured distributions. Electrons
scattered from the eSC edge into the field created “hot spots” and “cold spots” within the
treatment field. A qualitative comparison of the dose uniformity within the 90% relative dose

35
region is shown in Figure 3.11, which contains nine subplots that have been arranged in rows
according to bevel angle and columns by relative gantry angle. Each of these subplots is a color-
mapped relative dose distribution in which the relative dose value of each pixel has been mapped
to a particular color with respect to the color bar shown at the bottom of the Figure.
Figure 3.12 contains nine subplots that have been arranged similarly to Figure 3.11. Each
of the subplots contains lateral profiles from each measured field taken at depths of 5, 10, 14, and
18 mm. The maximum value of each of these profiles is plotted in Figure 3.13, providing a more
quantitative comparison of these fields. As a quantitative comparison, the penumbral widths
were measured at the four profile depths for each measured field (Table 3.4).
Figure 3.13 is arranged into six subplots, and the data shown within these subplots is
grouped by bevel angle (left column) with variation of gantry angle in each subplot and by
gantry angle (right column) with variations of the bevel angle in each subplot.
Figures 3.14-3.18 show the 90% relative dose area comparison plots. By grouping the
various data and plots, our intention is to identify characteristics or trends with respect to the
variation in the eSC bevel angle and in the presence of simulated setup error (variations in the
relative gantry angle).
3.2.2 Penumbral Width
The penumbral widths (P80-20) are listed Table 3.4 from the profiles plotted in Figure
3.12. We defined the penumbral width as the lateral distance between the 80% and 20% relative
dose points along each profile. The penumbral width definitely increases with decreasing bevel
angle (+10° → -10°) and depth, but less variation was seen with change of the gantry angle. The
difference in penumbral width was very small between the measured fields. Upon comparing the
penumbral widths of all the measured fields and all lateral profile depths, the largest difference

36
was 2 mm, for only one instance; all other differences were ≤ 1.5 mm. This difference is not
considered to be clinically significant.
3.2.3 90% Dose Area
Figures 3.14-3.18 specifically address the coverage of the 90% dose area. The +10°
bevel increases the contribution of scattered electrons to the dose, but the distributions measured
with the +10° beveled eSC were observed to be the least affected by variations in the gantry
angle (±5°). This is, perhaps, most clearly shown in the comparisons of the 90% relative dose
areas (Figures 3.14-3.18) and in the calculated areas listed in Table 3.2. For a nominal gantry
angle, increasing the bevel angle from 0° to +10° resulted in a 16% increase in the 90% relative
dose area. Additionally, the lateral extent of the 90% isodose line was shown to be the most
stable in the presence of gantry angle variations (±5°) for the +10° beveled eSC. The -10° bevel
showed decreases from the (ϴB = 0°, ϴG = 0°) area, ranging from 5%-11%.

37
(a)
(b)
Figure 3.8: Isodose plots of the measured dosimetric data for the investigation into the
dosimetric effects of eSC bevel angles. Dosimetric measurements were obtained using
radiochromic film with a 6 MeV electron beam. Shown are measurements for a 0° bevel angle
and (a) a 0° gantry angle, (b) a +3° gantry angle, (c) a +5° gantry angle, (d) a -3° gantry angle,
and (e) a -5° gantry angle.
38
Figure 3.8 (continued): Isodose plots of the measured dosimetric data for the investigation into
the dosimetric effects of eSC bevel angles. Dosimetric measurements were obtained using
radiochromic film with a 6 MeV electron beam. Shown are measurements for a 0° bevel angle
and (a) a 0° gantry angle, (b) a +3° gantry angle, (c) a +5° gantry angle, (d) a -3° gantry angle,
and (e) a -5° gantry angle.
(c)
(d)

39
Figure 3.8 (continued): Isodose plots of the measured dosimetric data for the investigation into
the dosimetric effects of eSC bevel angles. Dosimetric measurements were obtained using
radiochromic film with a 6 MeV electron beam. Shown are measurements for a 0° bevel angle
and (a) a 0° gantry angle, (b) a +3° gantry angle, (c) a +5° gantry angle, (d) a -3° gantry angle,
and (e) a -5° gantry angle.
(e)
(a)
Figure 3.9: Isodose plots of the measured dosimetric data for the investigation into the
dosimetric effects of eSC bevel angles. Dosimetric measurements were obtained using
radiochromic film with a 6 MeV electron beam. Shown are measurements for a +10° bevel
angle and (a) a 0° gantry angle, (b) a +5° gantry angle, and (c) a -5° gantry angle.

40
Figure 3.9 (continued): Isodose plots of the measured dosimetric data for the investigation into
the dosimetric effects of eSC bevel angles. Dosimetric measurements were obtained using
radiochromic film with a 6 MeV electron beam. Shown are measurements for a +10° bevel
angle and (a) a 0° gantry angle, (b) a +5° gantry angle, and (c) a -5° gantry angle.
(b)
(c)

41
(a)
(b)
Figure 3.10: Isodose plots of the measured dosimetric data for the investigation into the
dosimetric effects of eSC bevel angles. Dosimetric measurements were obtained using
radiochromic film with a 6 MeV electron beam. Shown are measurements for a -10° bevel angle
and (a) a 0° gantry angle, (b) a +5° gantry angle, and (c) a -5° gantry angle.

42
Figure 3.10 (continued): Isodose plots of the measured dosimetric data for the investigation into
the dosimetric effects of eSC bevel angles. Dosimetric measurements were obtained using
radiochromic film with a 6 MeV electron beam. Shown are measurements for a -10° bevel angle
and (a) a 0° gantry angle, (b) a +5° gantry angle, and (c) a -5° gantry angle.
(c)
Table 3.4: 90% relative dose area [mm2] for all measured combinations of bevel angle and
relative gantry angle for 6 MeV beams. A reduction of the area within the 90% relative dose
region was expected to be ≤ 5%.
-5 -3 0 +3 +5
+10 514.0 539.3 528.8
0 449.0 494.3 465.3 476.3 467.8
-10 441.5 415.8 421.0
+10 1.10 1.16 1.14
0 0.96 1.06 1.00 1.02 1.01
-10 0.95 0.89 0.90
90% Relative Dose Area [mm2]
Gantry Angle [°]Bevel Angle
[°]
Normalized to Bevel = 0°, Grel = 0°

43
Figure 3.11: Uniformity within 90% plotted from bevel angle dosimetric measurements. Each
of the three plot areas in the top row are dose distributions measured using an eSC with a bevel
angle of +10°. Similarly, the middle and bottom rows correspond to bevel angles of 0° and -10°,
respectively. The columnar grouping of the plot areas corresponds to the relative gantry angle in
each; from the left column to the right column, the relative gantry angles were -5°, 0°, and +5°.
The relative dose value for each pixel in each plot was mapped to a color with respect to the
color bar at the bottom of the figure.
Table 3.5: R90 depth on central axis for all measured combinations of bevel angle and relative
gantry angle for a 6 MeV beam. Change in the depth of R90 on CAX was expected to be ≤1 mm.
-5 0 +5
+10
0
-10
Gantry Angle [°]Bevel
Angle
[°]
-5 -3 0 +3 +5
+10 18.0 18.0 18.0
0 18.0 18.0 18.0 18.0 18.0
-10 18.0 17.5 18.0
Depth of R90 on CAX [mm]
Bevel Angle
[°]
Gantry Angle [°]
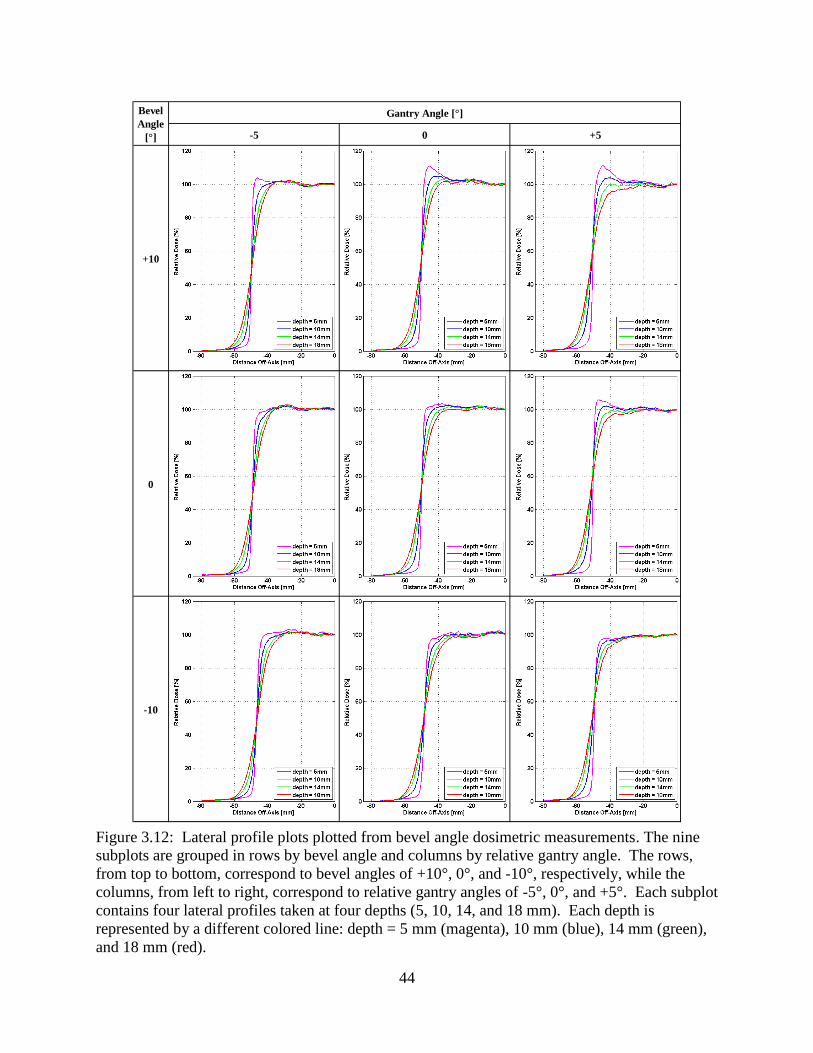
44
Figure 3.12: Lateral profile plots plotted from bevel angle dosimetric measurements. The nine
subplots are grouped in rows by bevel angle and columns by relative gantry angle. The rows,
from top to bottom, correspond to bevel angles of +10°, 0°, and -10°, respectively, while the
columns, from left to right, correspond to relative gantry angles of -5°, 0°, and +5°. Each subplot
contains four lateral profiles taken at four depths (5, 10, 14, and 18 mm). Each depth is
represented by a different colored line: depth = 5 mm (magenta), 10 mm (blue), 14 mm (green),
and 18 mm (red).
-5 0 +5
+10
0
-10
Bevel
Angle
[°]
Gantry Angle [°]

45
Figure 3.13: Profile relative dose maxima plotted from bevel angle dosimetric measurements.
At each profile depth, the maximum value was plotted for comparison to other measured fields.
The subplots are arranged such that the bevel angle is held constant in the left column, and the
relative gantry angle is held constant for those in the right column. Shown by a red line and data
points on each of the subplots is the field setup with a bevel angle of 0° and a relative gantry
angle of 0°; this field was used as a standard of comparison.

46
Table 3.6: Penumbral widths measured from data collected with variations in eSC bevel angle.
Provided is a quantitative comparison of penumbral widths of the selected electron fields in our
assessment of the dosimetric effects of variations in eSC bevel angle. These penumbral widths
were taken from the lateral profile data shown previously in Figure 3.12. We defined the
penumbral width as the lateral distance between the 80% and 20% relative dose points along
each profile. The difference in penumbral width was very small between the measured fields.
Upon comparing the penumbral widths of all the measured fields and all lateral profile depths,
the largest difference was 2 mm, and there was only one instance of this; all other differences
were ≤ 1.5 mm.
Figure 3.14: Measured 90% relative dose area comparison. The bevel angle was held constant
at 0° and the gantry was varied at 0°, ±3°, and ±5° to demonstrate the possible effects of
rotational setup error. The region shaded in red is the 90% relative dose area for the field setup
with a bevel angle of 0° and a relative gantry angle of 0° and was used as a standard of
comparison.
Bevel
Angle
[°]
Relative
Gantry Angle
[°]
dref = 5 mm dref = 10 mm dref = 14 mm dref = 18 mm
+10 +5 1.5 5.0 7.5 10.0
+10 0 1.5 4.0 7.0 9.0
+10 -5 1.5 3.5 6.5 9.5
0 +5 1.5 4.0 7.0 10.0
0 +3 1.0 4.0 7.0 9.5
0 0 1.5 4.0 7.5 10.0
0 -3 1.5 4.0 7.0 9.5
0 -5 2.0 4.0 7.0 10.0
-10 +5 2.0 4.5 8.0 10.5
-10 0 2.5 5.0 8.0 11.0
-10 -5 2.0 4.5 7.0 10.0

47
Figure 3.15: Measured 90% relative dose area comparison of bevel angles. Relative gantry
angle was held constant at 0° for Cerrobend eSCs with bevel angles of 0°, +10°, and -10° to
demonstrate the effects of bevel angle on the dosimetric distribution. The region shaded in red is
the 90% relative dose area for the field setup with a bevel angle of 0° and a relative gantry angle
of 0° and was used as a standard of comparison.
Figure 3.16: Measured 90% relative dose area comparison of bevel angles. Relative gantry
angle was held constant at -5° for Cerrobend eSCs with bevel angles of 0°, +10°, and -10° to
demonstrate the occlusive effects of the proximal surface of eSCs that have a bevel angle ≤ 0° in
the presence of rotational setup error. The region shaded in red is the 90% relative dose area for
the field setup with a bevel angle of 0° and a relative gantry angle of 0° and was used as a
standard of comparison.

48
Figure 3.17: Measured 90% relative dose area comparison of bevel angles. The bevel angle was
held constant at +10° with the gantry varied at 0°, +5°, and -5° to demonstrate the stability of the
90% relative dose region in the presence of rotational setup error and an eSC bevel angle of
+10°. The region shaded in red is the 90% relative dose area for the field setup with a bevel
angle of 0° and a relative gantry angle of 0° and was used as a standard of comparison.
Figure 3.18: Measured 90% relative dose area comparison of bevel angles. The bevel angle was
held constant at -10° with the gantry varied at 0°, +5°, and -5° to demonstrate the negative
impact on the 90% relative dose region in the presence of rotational setup error and an eSC bevel
angle of -10°. The region shaded in red is the 90% relative dose area for the field setup with a
bevel angle of 0° and a relative gantry angle of 0° and was used as a standard of comparison.

49
Chapter 4: Specific Aim 2—Dimensional Accuracy of the Machined eSC
4.1 Methods and Materials
4.1.1 Skin Collimation Evaluation Cycle
Each of the eSCs used in this project underwent a series of dimensional and dosimetric
tests to ensure agreement with the planned eSC. For this study, three separate phantom cases
were examined. This chapter examines the dimensional accuracy.
Using CT images of a phantom, eSC was designed using a commercial TPS (Philips
Pinnacle3, Philips Electronics North America Corporation, Andover, MA) as described in
Section 2.1.3.1. Once designed as a Region of Interest (ROI), the file containing the surface
coordinates of the eSC ROI with respect to the CT coordinate system was imported into p.d v4.2.
Upon submission of this output file to the manufacturer, the eSC was machined and delivered to
MBPCC. For each submission, the manufacturer machined a brass eSC, as well as a wax replica
of the eSC (Figure 4.5[b]) to be used for quality assurance testing.
A kVCT image set of the wax replica was acquired using a kVCT (GE LightSpeed,
General Electric Medical Systems, Fairfield, CT) scanner and fused with the planned ROI using
the TPS to assess equivalence of the machined eSC to the planned eSC. The fusions were
performed primarily by manually matching the distal surface and aperture edge of the eSC image
to that of the planned eSC contour. The brass eSC was scanned using a TomoTherapy unit (Hi-
Art, TomoTherapy, Inc., Madison, WI) MVCT imaging system and fused to the kVCT TPS data
set, similar to the procedure for the wax replica (Figure 4.1). Any observable dimensional
deviation from the eSC design was expected to be ≤ 2 mm.

50
4.1.2 Cylindrical Phantom Case
The first case was planned on a high-impact white opaque (HIWO) polystyrene (ρ =
1.045 ± 0.01 g/cm3)
1 cylindrical phantom. With a diameter of 27 cm and a length of 37.4 cm, the
cylindrical phantom was selected for use in this study for its simplistic shape and capacity to
collect film dosimetry measurements (Figure 4.3)(Chi et al. 2005). As described by Kavanaugh
(2011), the phantom contains two cassettes, each with a central slot to fit a single bare film.
With respect to the longitudinal axis of the phantom, one cassette was positioned in a transverse
plane and one in the central sagittal plane. Dose measurements are assessed in Chapter 5
(Specific Aim 3).
Dose was prescribed such that 90% of the given dose encompassed the distal surface of
an arbitrary PTV. For the cylindrical phantom irradiation, a hypothetical PTV was constructed
that was roughly 5×7 cm2 and of irregular shape. The PTV (not shown; exact shape not relevant)
reached a depth of just over 4 cm requiring a 16 MeV beam. Using a 1 cm margin, the irregular
field size was approximately 7×9 cm2 (Figure 4.2). The aperture size was relatively large (about
9 cm along the sagittal axis) as compared to most skin collimation applications (cf. Figure 3.1),
but this was an intentional deviation in an attempt to minimize the influence of collimator edge
scatter at the central axis. The three collimating materials (brass, Cerrobend, and lead) were each
used to construct eSC for the cylindrical phantom case (see Figure 4.5—top row) using methods
described in Chapter 2.
1 The discrepancy in the density of the cylindrical phantom was due to differing values reported in previous studies
that utilized this particular phantom. Chi et al. (2005) reported the density to be 1.035 g/cm3, while Kavanaugh
(2011) designated the density to be 1.054 g/cm3. Possibly contributing to the discrepancy, Khan et al. (1991)
include a table of information on the physical properties of non-water phantoms in which they list a density of 1.054
g/cm3 for high-impact polystyrene (white). Regardless, we do not expect this difference (< 2%) in the density of the
phantom to have a significant influence on our data.

51
Figure 4.1: MVCT fusion of the anthropomorphic head phantom (case #2) eSC. The yellow
contour lines represent the contour of the wax eSC. The upper images are coronal planes of the
eSC anterior (left) and posterior (right) aperture edges from the MVCT image set. The lower-left
image is a sagittal plane along CAX, and the lower-right image is a transverse plane, also along
CAX.
Figure 4.2: 3D rendering of the BEV for the cylindrical phantom taken from the TPS. The PTV
is shown (in blue) in the center of this image. The axes in the image represent the cardinal axes
of the electron beam, and each of the tick-marks represents 1 cm at an SSD = 100 cm. The PTV
is surrounded by the digitally designed eSC (shown in orange).
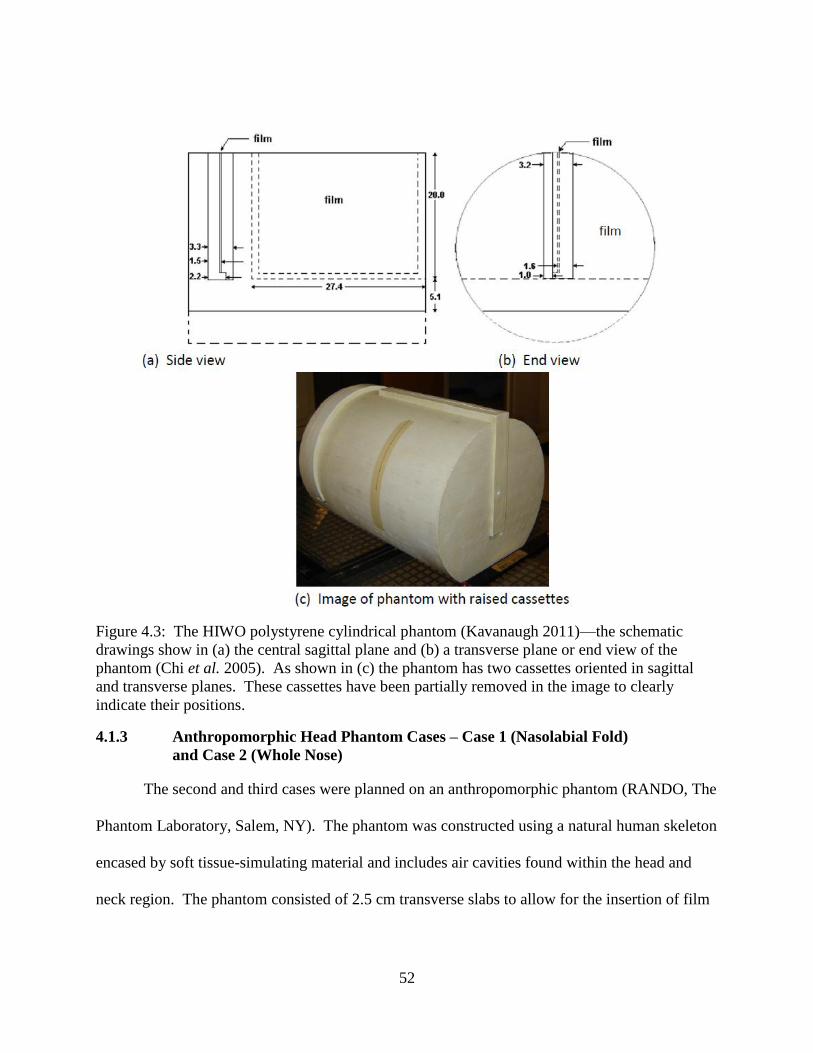
52
Figure 4.3: The HIWO polystyrene cylindrical phantom (Kavanaugh 2011)—the schematic
drawings show in (a) the central sagittal plane and (b) a transverse plane or end view of the
phantom (Chi et al. 2005). As shown in (c) the phantom has two cassettes oriented in sagittal
and transverse planes. These cassettes have been partially removed in the image to clearly
indicate their positions.
4.1.3 Anthropomorphic Head Phantom Cases – Case 1 (Nasolabial Fold)
and Case 2 (Whole Nose)
The second and third cases were planned on an anthropomorphic phantom (RANDO, The
Phantom Laboratory, Salem, NY). The phantom was constructed using a natural human skeleton
encased by soft tissue-simulating material and includes air cavities found within the head and
neck region. The phantom consisted of 2.5 cm transverse slabs to allow for the insertion of film

53
sheets, but this phantom was not used for film dosimetry in the present study. For this study, we
used the head and neck portion of the phantom (approximately down to the clavicle).
The head phantom cases and PTVs, shown in Figure 4.4, were meant to mimic realistic
clinical setups that require the use of eSC. The first head phantom case was based on the
treatment of a tumor located in the nasolabial fold area, and the second case was modeled after a
whole nose treatment field. The three collimating materials (brass, Cerrobend, and lead) were
each used to construct eSC for each of the two head phantom cases (Figure 4.5—middle and
bottom rows). The brass eSCs for these two cases underwent an identical dimensional
evaluation cycle as performed for the cylindrical phantom case (i.e., no comparison of film
dosimetry for the brass eSC versus the lead and Cerrobend eSCs). Film measurements with the
head phantom were not included in this study as en face film irradiation within an
inhomogeneous phantom has proven to be inaccurate due to perturbations caused by bone and air
in the phantom abutting the film (Shiu and Hogstrom 1991). Hence, the purpose of Figure 4.5 is
to allow a visual comparison of brass, lead, and Cerrobend eSCs for the three phantom cases.
4.1.4 Comparison of Brass Machined Skin Collimation to Planned Skin
Collimation— Dimensional Characteristics
As previously discussed in Section 4.1.1, each milled skin collimator underwent three
tests to assess agreement with the planned eSC. First, the calculated volume of the planned eSC
was compared to the volume of the milled eSC. In both the kVCT and MVCT image sets, the
machined eSC was contoured on each of the CT images. To accomplish this, an auto-contour
function was used within the TPS, where the maximum and minimum thresholds were set to
4095 and 2000, respectively. After establishing the dimensional limits of the machined eSC with
the contours, the volume of the physical eSC was calculated for comparison to the volume of the
planned eSC. Volumetric comparisons were used in conjunction with CT fusions to verify

54
conformity to the plan. Additionally, these quantitative comparisons were only performed after
the CT fusions qualitatively verified the absence of any deviations from the plan that could
potentially have a clinically significant impact on the dose distribution.
In addition to the CT fusions, physical dimensions of the brass collimators were also
collected and compared to measurements of the planned collimator within the TPS, which were
collected using the distance measuring tool. The distance measuring tool in the TPS calculated
distances based on the CT coordinate system. Per our criteria, the physical dimensions were not
expected to deviate from the design by more than 2 mm. The comparison of these dimensions,
along with the volumetric comparisons, provided a quantitative comparison of the machined vs.
planned dimensions.
Three geometric quantities were assessed: [1] eSC thickness, [2] distance between the
distal eSC surface and the skin (phantom surface), and [3] distance between planned and actual
aperture edge. Measured eSC thickness was compared to the planned eSC thickness. The fit of
the manufactured collimator to the irregular surface of the head phantom was qualitatively
evaluated through (a) visual inspection when placed on the phantom, and (b) the assessment of
the surface conformity within the CT fusions. The location of the aperture edge was compared
with the planned edge.
4.2 Results for Specific Aim 2
4.2.1 Dimensional Accuracy of Machined eSC Devices
The primary purpose of Specific Aim 2 was to ensure that, upon delivery, the physical
shape of the brass eSC matched the digital design specifications. We performed several
dimensional checks to confirm this, which included kVCT fusions of the wax surrogate eSC and
MVCT fusions of the brass eSC to the planned region of interest, as well as physical

55
measurements of the dimensions of the eSC to be compared with dimensional distances
determined using measuring tools in the treatment planning system. Of particular interest in this
study was [1] the accuracy of the thickness of the machined eSC, [2] the accuracy with which the
distal surface of the machined eSC conformed to the contour of the patient surface, and [3] the
accuracy of the eSC aperture edge.
Results comparing the planned eSC contour with the wax eSC shape in the kVCT images
are shown in the upper portions of Figures 4.6-4.8 for the cylindrical phantom, head phantom
(case #1), and head phantom (case #2), respectively. Results of the MVCT images with the brass
eSC fused with the planning kVCT images are shown in the lower portions of Figures 4.6-4.8.
Figure 4.4: Anthropomorphic head phantom PTVs—case #1 can be seen in the upper images
and case #2 in the lower images. Seen in orange are the planned eSC contours, and the treatment
volumes are pictured in blue. The images on the left of each row are 3-D renderings of the
beam’s-eye-view, while the images on the right are transverse slices along the central axis of the
beam.

56
Figure 4.5: Cylindrical phantom eSC (top row) and the anthropomorphic head phantom case #1
(middle row) and case #2 (bottom row) eSC—[a] brass, Cerrobend, and lead (left to right) and
[b] brass (left) and the wax replicas (right).
[a]

57
Figure 4.5 (continued): Cylindrical phantom eSC (top row) and the anthropomorphic head
phantom case #1 (middle row) and case #2 (bottom row) eSC—[a] brass, Cerrobend, and lead
(left to right) and [b] brass (left) and the wax replicas (right).
[b]

58
4.2.2 Thickness Comparisons of Machined eSC Devices
The thickness of eSC dictates the amount of dose transmitted through the collimator and
contributes to other aspects of treatment such as scatter. The thickness of the machined eSCs
was verified with the kVCT and MVCT fusions and, more precisely, with physical
measurements. The volumes of the machined eSCs were calculated using the CT image sets and
used as a secondary comparison of the accuracy of the thicknesses. Table 4.1 compares the
minimum and maximum brass eSC thickness with the planned thickness of 1 cm (which was
mistakenly less than the recommended 1.2 cm for 16 MeV electrons) and provides a volumetric
comparison of the planned eSC to the physical eSC, as determined by the kVCT and MVCT
image sets, for each phantom case.
4.2.3 Agreement of Machined eSC Distal Surfaces
For the brass to fit the patient surface well, its milled distal surface should match the
designed surface within 2 mm. In the mid-transverse planes, excellent agreement (≤1 mm) is
illustrated using the kVCT scans of the wax eSC surrogate. In all cases there appears to be a
small air gap (≤1 mm) that is caused by the eSC not perfectly fitting the phantom surface, but
qualitatively, the eSC seemed to fit exceptionally well when inspected by hand. Despite the
coarse steps due to the 2.5 mm CT scan thicknesses, the distal surfaces of the eSCs were
sufficiently smooth for patient comfort.
The MVCT images, as expected, were not as clear as the kVCT of the wax eSC replica.
Some smearing and streaking was observed in all cases, but with appropriate window and level
settings (as specified for each case in the captions of Figures 4.6-4.8), the brass eSC could
become resolved enough for fusion with the planned eSC contour. For each case, the brass was

59
nearly identical to the wax eSC replica, i.e., the minor differences between the distal surfaces of
the planned eSC and the MVCT image of the milled eSC were within 1 mm.
4.2.4 Agreement of Machined eSC Aperture Edges
The machined eSC aperture edges were designed to be parallel to the beam divergence in
the transverse planes. Due to limitations in the design process (e.g., contours can only be created
or edited in the transverse plane), this could not be done in the superior-inferior direction. The
cylindrical phantom eSC and the head phantom case #2 have a negative bevel angle such that,
contrary to the design, the edges appear to emanate from a virtual source only 20 cm (or less)
above the patient as opposed to 105 cm, which is the location of the virtual source in the TPS
(Figures 4.6 and 4.8). This deviation from the planned eSC edge shows up to a 3 mm difference
where the eSC abuts the phantom surface. Contrastingly, the head phantom case #1 results show
agreement with the planned aperture edge within 1.5 mm and do not show an incorrect slope on
the edge. While the reason for this inconsistency remains under investigation, the cause is likely
an error in either the p.d software or the data input.
4.2.5 Other Observations
One remaining observation was that the outer edges of all three eSCs were milled at least
5-10 mm short in the superior-inferior direction. Although not likely clinically significant, this
deviation from the design is currently under investigation.
4.2.6 Summary of Specific Aim 2 Results
Overall, good agreement was seen between the dimensions of the machined eSC and
those of the planned eSC. The following summarizes the observations of Specific Aim 2: [1] a
≤ 1.5 mm difference was seen in the thickness of the cylindrical phantom case (i.e., the eSC was
planned to be slightly more thick than the machined eSC was fabricated); [2] the distal surface of

60
the eSC matched the shape of the phantom surface within 1 mm; and [3] in all three cases, the
eSC was missing approximately 2.5-5.0 mm from the extreme superior and inferior edges (i.e.,
each eSC was approximately 5-10 mm shorter in the superior-inferior direction). These were all
considered to be minor deviations from the planned eSC design. These differences were not
expected to have any sort of significant dosimetric impact and, thus, were not considered to be
clinically relevant.
However, in all cases, the aperture was designed to be parallel to the beam divergence,
but in the cylindrical phantom case and the second head phantom case (whole nose) the
divergence was significantly overestimated in some areas (≤ 2.5 mm). These differences are
considered clinically relevant and should be corrected prior to clinical utilization.
Table 4.1: Volumetric comparison of the planned eSC to the machined brass eSC. These
volumes are based on calculated volumes within the TPS. The machined brass eSC volumes are
based on MVCT image sets of the physical eSCs.
Dimensional AgreementCylindrical
Phantom
Head Phantom
Case #1
Head Phantom
Case #2
Planned eSC Thickness 1 cm 1 cm 1.2 cm
Thickness Range of
Machined Brass eSC0.85 - 1.05 cm 0.90 - 1.10 cm 1.05 - 1.20 cm
Planned eSC Volume 399.0 cm3
191.1 cm3
221.8 cm3
Machined Brass eSC Volume 369.9 cm3
183.7 cm3
232.2 cm3
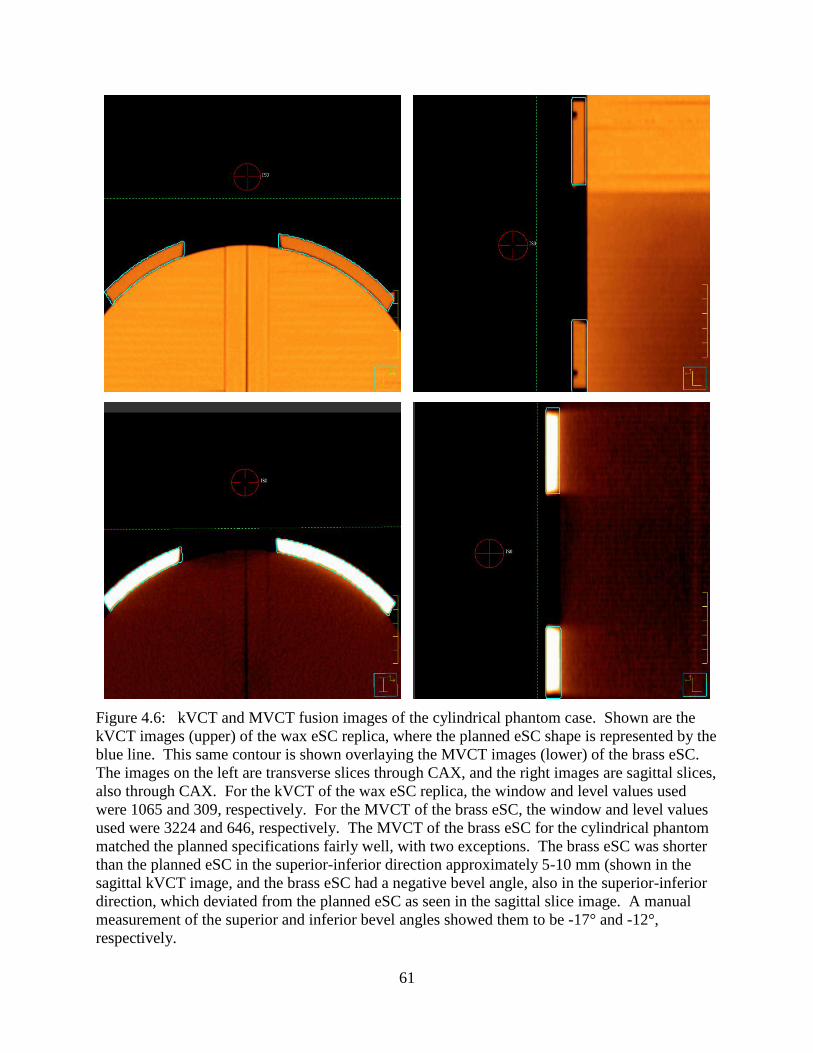
61
Figure 4.6: kVCT and MVCT fusion images of the cylindrical phantom case. Shown are the
kVCT images (upper) of the wax eSC replica, where the planned eSC shape is represented by the
blue line. This same contour is shown overlaying the MVCT images (lower) of the brass eSC.
The images on the left are transverse slices through CAX, and the right images are sagittal slices,
also through CAX. For the kVCT of the wax eSC replica, the window and level values used
were 1065 and 309, respectively. For the MVCT of the brass eSC, the window and level values
used were 3224 and 646, respectively. The MVCT of the brass eSC for the cylindrical phantom
matched the planned specifications fairly well, with two exceptions. The brass eSC was shorter
than the planned eSC in the superior-inferior direction approximately 5-10 mm (shown in the
sagittal kVCT image, and the brass eSC had a negative bevel angle, also in the superior-inferior
direction, which deviated from the planned eSC as seen in the sagittal slice image. A manual
measurement of the superior and inferior bevel angles showed them to be -17° and -12°,
respectively.

62
Figure 4.7: kVCT and MVCT fusion images of the head phantom (case #1). Shown are the
kVCT images (upper) of the wax eSC replica, where the planned eSC shape is represented by the
blue line. A contour of the planned eSC shape is also shown overlaying the MVCT images
(lower) of the brass eSC. The images on the left are transverse slices through CAX, and the right
images are sagittal slices through the central-sagittal axis of the phantom, which was not parallel
to the beam CAX as the beam had a gantry rotation of +40° (see Figure 4.4). For the kVCT of
the wax eSC replica, the window and level values used were 1012 and 462, respectively. For the
MVCT of the brass eSC, the window and level values used were 1401 and 2599, respectively.
For this phantom case, CT images were collected without the use of the head phantom. The blue
contour in the images is the external contour of the head phantom. The brass eSC for the first
head phantom case corresponded well to the planned eSC. The lone deviation was a shortened
brass eSC in the superior-inferior direction. Similar to the cylindrical phantom, this eSC was
approximately 5-10 mm short of the full planned superior-inferior length (about 2.5-5.0 mm
from each end).
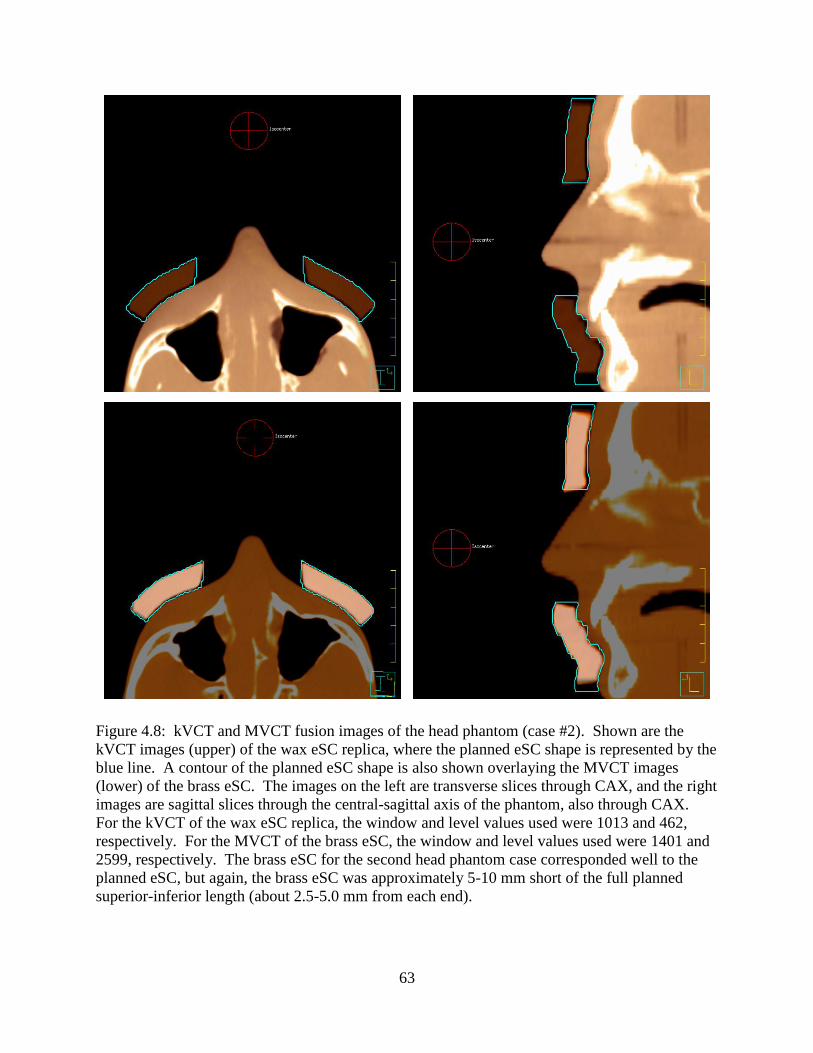
63
Figure 4.8: kVCT and MVCT fusion images of the head phantom (case #2). Shown are the
kVCT images (upper) of the wax eSC replica, where the planned eSC shape is represented by the
blue line. A contour of the planned eSC shape is also shown overlaying the MVCT images
(lower) of the brass eSC. The images on the left are transverse slices through CAX, and the right
images are sagittal slices through the central-sagittal axis of the phantom, also through CAX.
For the kVCT of the wax eSC replica, the window and level values used were 1013 and 462,
respectively. For the MVCT of the brass eSC, the window and level values used were 1401 and
2599, respectively. The brass eSC for the second head phantom case corresponded well to the
planned eSC, but again, the brass eSC was approximately 5-10 mm short of the full planned
superior-inferior length (about 2.5-5.0 mm from each end).
64
Chapter 5: Specific Aim 3—Dosimetric Equivalence of the Machined eSC
5.1 Methods and Materials
This chapter compares 2-D dose distributions measured in the mid-sagittal plane of the
HIWO cylindrical phantom. A 16 MeV electron beam irradiated an irregular field (≈ 7×9 cm2)
formed by brass, Cerrobend, or lead eSC. Measurements were taken with a 0° and +3° gantry tilt
relative to central axis.
5.1.1 Experimental Setup
All film measurements performed using HIWO cylindrical phantom were acquired using
RCF (Gafchromic EBT2, International Specialty Products, Wayne, NJ) (Lot # F06110901,
A09171003, and A12041005A), exposed en face (“edge-on”) in the sagittal film cassette of the
phantom [19 cm×25.4 cm (depth×width)]. Since the RCF dimensions were 20.3 cm×25.4 cm,
the film was trimmed, using a single-sided razor, to align the film edge with the phantom surface
prior to exposure. For each measurement condition, results of three films were averaged.
For irradiation, the longitudinal axis of the cylindrical phantom was aligned with the axis
of gantry rotation of the linear accelerator as shown in Figure 5.1. The couch, gantry, and
collimator rotation were all set to 0°. For each eSC material (brass, Cerrobend, lead) (Figure
4.5), three films were exposed. Additionally, to simulate setup error, the beam angle was rotated
+3° in the plane of the film, and the measurements were repeated for all three eSCs. This was
facilitated by rotating the couch and collimator to 90° and the gantry to +3°. The portion of the
cylindrical phantom containing the sagittal cassette was considered superior with respect to head-
first-supine orientation, and each eSC was oriented as such. The nominal beam energy used for
the cylindrical phantom case was 16 MeV, the SSD was 105 cm, and the beam was collimated by
a 15×15 cm2 electron cone. Each film was exposed to 400 MU, and the corresponding dose was

65
determined by acquiring output measurements, as described in Section 3.1.4, prior to film
irradiation. This value of given dose was used to normalize the measured film dose distributions.
Digitization of the film measurements was performed following previously discussed
methods (Section 3.1.4). The registration methodology was identical to that used previously by
investigators using the sagittal cassette of this phantom (Kavanaugh 2011). A physical 5-point
template was made to mark the films prior to scanning with the registration points placed at
known distances from the origin in areas of little or no interest on the film. The films were
digitally registered using a 5-point registration template created within commercial software
(RIT113 v5.2, Radiological Imaging Technology, Inc., Colorado Springs, CO) corresponding
with the physical template. Using this template within the commercial software, the digitized
film images were spatially registered to an ASCII planar dose calculation with a pixel size of
0.05 cm×0.05 cm. Once the film was calibrated and registered within the commercial software,
the digitized film images were exported for analysis, including normalization, using in-house
MATLAB software.
5.1.2 Data Analysis
The measured distributions were from digitized RCF measurements (see Section 3.14).
The dose arrays exported by the RIT software as .mat files were analyzed using in-house Matlab
v7.5 software written specifically for this study. The exported arrays had a 0.5 mm pixel
spacing. Each array was normalized to the given dose (independent of eSC), adjusted for the
beam output measured just prior to irradiation of the films. Surface artifacts, similar to those
reported by Robertson (2010), were observed both on CAX and near the eSC edge. Therefore,
for all data points within 2 cm of the surface (z ≤ 2 cm), the following correction was applied to
the en face film dose measurements collected using the cylindrical phantom:

66
( ) ( ) ( ( )
( )) , (5.1)
where %Dclin(0,z) is the clinical CAX depth dose measured in a water phantom, and %Dmeas(0,z)
is the CAX depth dose measured in the cylindrical phantom. For shallow depths (z ≤ 2 cm), this
correction restored agreement of our measurements with the measured dose in a water phantom.
Typical results for this process are illustrated in Figures 5.2 and 5.3. Since this effect was
significantly diminished at lower energies (also observed by Robertson (2010)), the correction
was not necessary for previously discussed (see Section 3.1.4) film dose measurements in this
study at 6 MeV.
Figure 5.1: Cylindrical phantom experimental setup with Cerrobend eSC, pictured from the foot
of the couch. The phantom was extended further from the measurement SSD of 105 cm to allow
the view (photo) of the eSC placement. This particular image shows the Cerrobend eSC on the
phantom. The couch, gantry, and collimator rotation were all set to 0°. For variation of the
gantry from the nominal delivery angle, the couch and collimator were rotated to 90°, and the
gantry was set to +3°; these adjustments allowed for a +3° gantry rotation within the film plane
(central sagittal plane). The proximal edge of the film plane is approximated in the right image
by a line drawn along the longitudinal surface of the phantom.

67
5.1.3 Comparison of Measured Dose Distributions
We compared 2-dimensional distributions of measured relative dose to evaluate
dosimetric equivalence of the machined brass eSC with the current standard of care (lead eSC
and Cerrobend eSC). Measured dose distributions were compared using several quantitative
metrics as previously described in Section 3.1.5. Dose distribution agreement was investigated
in order to validate the dosimetric equivalence of each collimating material.
5.1.4 Leakage
Collimator leakage was assessed to ensure that each collimating material demonstrated
sufficient shielding properties to be used clinically. This was only investigated for the
cylindrical phantom case. For this assessment, off-axis dose profiles were plotted at depths of
0.5, 1.0, 2.0, and 3.0 cm with data 3 cm outside the field edge. Also, in the normalized dose
array, the depth-dose profiles, averaged over the data in the columns between 6.5 and 7.0 cm
distance off-axis, were determined and plotted. These depth-dose plots fell approximately 2 cm
lateral to the eSC aperture edge.
5.2 Results for Specific Aim 3
For comparison of the three eSCs of different collimating materials (brass, Cerrobend,
and lead), we were interested in [1] overall dosimetric agreement (Figures 5.4-5.5), [2] the
impact of collimator scattered dose (Figures 5.4-5.6), [3] field width and the 90% relative dose
region (Figures 5.6, 5.7, 5.9, and 5.10), [4] penumbral width (Figure 5.8), and [5] radiation
leakage (Figures 5.8 and 5.11). The lead eSC was considered to be the prevailing standard of
care. The penumbral widths are listed Table 5.2, and the profiles from which they were gleaned
are plotted in Figure 5.8. The leakage seen with the brass eSC measurements was due to errors
made in the planning process and is addressed in section 5.2.4. Otherwise, all three of the eSCs

68
for the cylindrical phantom case showed very good dosimetric agreement. Slight variations were
seen in the width of the eSC aperture between the three (approximately 2-3 mm), but since the
Cerrobend eSC and lead eSC were fabricated by hand according to the current standard of care at
our institution, a variation of a few millimeters was likely within the expected uncertainty.
5.2.1 Collimator Scattered Dose
Measured isodose plots for the brass, Cerrobend, and lead eSCs for 0° and +3° gantry
angles are plotted in Figures 5.4 and 5.5, respectively. In all cases a lobe of increased dose
(>100%) due to collimator scatter is observed. At 0° the increased dose is slightly greater in the
negative direction, which is due to the collimating edge parallel to gantry axis being closer to the
film measurement plane at the inferior (negative) field edge, cf. Figures 4.2 and 5.1. For brass
eSC the maximum doses at dref = 10 mm are approximately 107%(-) and 105%(+); for Cerrobend
eSC approximately 104%(-) and 100%(+); and for lead eSC approximately 105%(-) and
103%(+). Figure 5.6, a color-wash dose plot of dose values 90-110%, better illustrates a
qualitative comparison of the increased dose due to collimator scatter. Small differences can be
seen in the collimator-edge scatter, attributed to the different properties of the collimating
materials as well as the different bevel angles of the eSCs (negative bevel angle, slightly greater
than the angle of the beam divergence; approximately +20°; and approximately parallel to CAX
for the brass, Cerrobend, and lead, respectively). The brass eSC shows increased scatter dose
compared to lead, which is slightly greater than that for Cerrobend. Results for a +3° gantry
angle were similar, perhaps, showing slightly less dose (1-2%) on both sides. The features of
these comparisons can be more quantitatively appreciated using the off-axis dose profile plots in
Figure 5.8 and the differential dose area histograms within the 90% dose contour in Figure 5.7.

69
Figure 5.2: Percent depth dose plots before (left) and after (right) the correction of the surface
effect. The upper images are of the dose along CAX, and the lower plots are of the dose at 4 cm
off-axis.

70
Figure 5.3: Plots of the uniformity within 90% relative dose region before (upper) and after
(lower) the correction of the surface effect.

71
5.2.2 Field Width and 90% Dose Area
Figure 5.9 overlays isodose curves of 20%, 50%, 80%, and 90% for the brass, Cerrobend,
and lead eSCs. These curves have essentially identical shapes (≤ 1 mm) with the exception of
the lead isodose curves being shifted -1 mm in the negative half plane and the Cerrobend isodose
curves being shifted +1.5 mm in the positive half plane. These shifts are indicative of an
approximately 2 mm error in manually fabricating the lead eSC and Cerrobend eSC apertures.
Figure 5.10 specifically addresses the coverage of the 90% dose area. The areas are
comparably shaped with the exception of slight differences primarily due to accuracy of the
beam edges and secondarily due to differences in collimator scatter. This is reflected in the
calculated areas listed in Table 5.1. For 0° the brass area is 4.5% less than that for lead and 2.4%
less than that for Cerrobend, again attributed to manual fabrication of the lead eSC and
Cerrobend eSC. Had the edges been identical, the 90% dose areas would reflect differences due
only to scatter.
5.2.3 Penumbral Width
The penumbral widths (P80-20) are listed Table 5.2, and the profiles from which they were
gleaned are plotted in Figure 5.8. We defined the penumbral width as the lateral distance
between the 80% and 20% relative dose points along each profile. The difference in penumbral
width was very small between the measured fields, 0.5 mm or less (precision was limited to 0.5
mm due to matrix resolution) for 0° gantry angle. Upon comparing the penumbral widths of all
the measured fields and all lateral profile depths, the largest difference was 1.5 mm. These
larger differences were for a +3° gantry angle and due to different bevel angles. This difference
is not considered to be clinically significant, thus demonstrating the comparable abilities of the
brass, Cerrobend, and lead as collimating materials.

72
5.2.4 Radiation Leakage
Radiation leakage through the eSC, which should be primary bremsstrahlung x-rays with
some secondary electrons, can be appreciated by depth dose curves under the eSCs shown in
Figure 5.11 and in the off-axis profiles of Figure 5.8. In Figure 5.8, the surface dose of
approximately 23% under the brass eSC is a direct result of its being fabricated too thin, i.e.,
primary electrons penetrated the brass. From 0 to 3 cm, Cerrobend and lead agree well (±0.5%),
and all three agree at 3 cm and deeper, beyond the range of the primary electrons. The peak of
increased dose deeper than 3 cm in Figure 5.8 is due to lateral scatter of the primary electron
beam, and differences are likely due to the ≤ 1 mm differences in the location of the beam edge,
e.g., the wider edges for lead give < 2% greater dose, as discussed in section 5.2.2. There is no
evidence of any clinical significant difference in leakage dose between brass, Cerrobend, and
lead.

73
(a)
(b)
Figure 5.4: Isodose plot of the measured dosimetric data collected using the cylindrical
phantom. Dosimetric measurements were obtained using radiochromic film with a 16 MeV
electron beam, at 105 cm SSD, and with a nominally oriented gantry angle (Grel = 0°). Shown
are (a) brass eSC, (b) Cerrobend eSC, and (c) lead eSC.
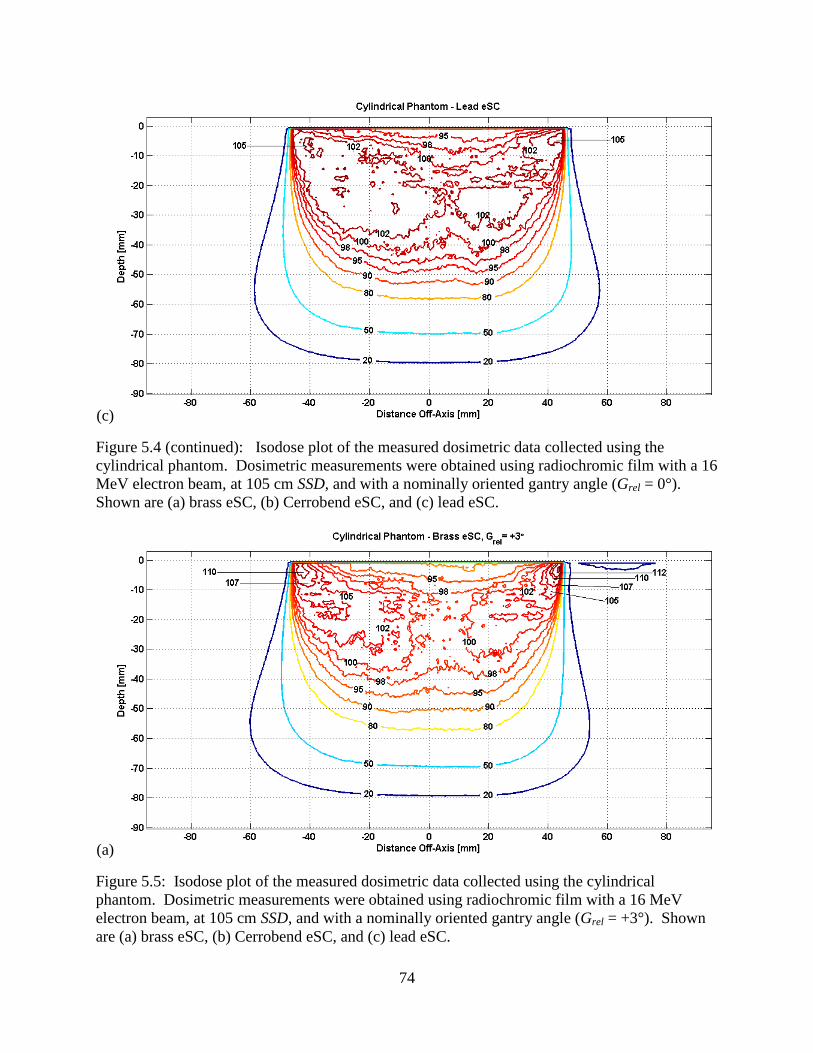
74
(c)
Figure 5.4 (continued): Isodose plot of the measured dosimetric data collected using the
cylindrical phantom. Dosimetric measurements were obtained using radiochromic film with a 16
MeV electron beam, at 105 cm SSD, and with a nominally oriented gantry angle (Grel = 0°).
Shown are (a) brass eSC, (b) Cerrobend eSC, and (c) lead eSC.
(a)
Figure 5.5: Isodose plot of the measured dosimetric data collected using the cylindrical
phantom. Dosimetric measurements were obtained using radiochromic film with a 16 MeV
electron beam, at 105 cm SSD, and with a nominally oriented gantry angle (Grel = +3°). Shown
are (a) brass eSC, (b) Cerrobend eSC, and (c) lead eSC.

75
(b)
(c)
Figure 5.5 (continued): Isodose plot of the measured dosimetric data collected using the
cylindrical phantom. Dosimetric measurements were obtained using radiochromic film with a 16
MeV electron beam, at 105 cm SSD, and with a nominally oriented gantry angle (Grel = +3°).
Shown are (a) brass eSC, (b) Cerrobend eSC, and (c) lead eSC.

76
Figure 5.6: Uniformity within 90% relative dose region taken from the measured dosimetric data
collected using the cylindrical phantom. The three subplots on the left correspond to a relative
gantry angle of 0°, while those on the right correspond to a relative gantry angle of +3°. The top
row is the measured distributions of the brass eSC, the second row is the Cerrobend eSC, and the
bottom row is the Lead eSC. The relative dose value for each pixel in each plot was mapped to a
color with respect to the color bar at the bottom of the figure. As expected, an increase in
collimator-edge scatter with the brass eSC decreases the dose uniformity relative to the other two
eSCs.
0° +3°
Bra
ss e
SC
Cer
rob
end
eS
CL
ead
eS
C
Gantry Angle

77
Figure 5.7: Differential dose area histogram within 90% dose region taken from the measured
dosimetric data collected using the cylindrical phantom. The red, blue, and green lines
correspond to the relative dose within the 90% region for the brass eSC, Cerrobend eSC, and
lead eSC measurements, respectively. For this plot, each pixel with a value ≥90% relative dose
was placed into the appropriate bin between 90% and 115% relative dose (bin size = 1% relative
dose). The number of points (or pixels) in each bin was then normalized based on the total
number of points ≥90% relative dose in the distribution measured with the lead eSC, which was
considered the prevailing standard of care and used as a standard of comparison for the
measurements collected with the three eSCs on the cylindrical phantom. This plot demonstrates
that, while the Cerrobend and lead eSCs produced more points within the 100% to 105% relative
dose interval than the brass eSC, the brass eSC resulted in more points beyond approximately
105%. Furthermore, as the relative number of points for the Cerrobend and lead eSC
distributions falls to near zero around 106%, the line representing the brass eSC distribution
reaches approximately 113% before reaching the same level.
Table 5.1: Quantitative comparisons of cylindrical phantom data—depth of R90, 90% relative
dose area, and maximum relative dose (near the left eSC edge, right eSC edge, and an average of
both sides). The three eSCs yielded similar values for the listed quantities.
Field Descriptiondepth of R90
[mm]
90% area
[mm2]
Δarea
max relative
dose [%]
(left of CAX)
max relative
dose [%]
(right of CAX)
max relative
dose [%]
(average)
mean relative dose
within 90% [%] ± σ
Brass eSC, Grel = 0° 51.5 4022.0 4.5% 114.4% 113.5% 113.9% 99.1 ± 4.0
Cerrobend eSC, Grel = 0° 52.0 4123.3 2.1% 117.8% 103.3% 110.6% 98.8 ± 3.5
Lead eSC, Grel = 0° 53.0 4212.5 0.0% 106.1% 107.0% 106.6% 100.1 ± 3.6
Brass eSC, Grel = +3° 50.5 3927.8 6.8% 114.6% 116.0% 114.3% 99 ± 4.1
Cerrobend eSC, Grel = +3° 52.0 4139.8 1.7% 106.2% 102.4% 104.3% 98.3 ± 3.1
Lead eSC, Grel = +3° 52.5 4195.3 0.4% 106.4% 107.4% 106.9% 99.9 ± 3.6

78
Figure 5.8: Profiles taken from the measured dosimetric data collected using the cylindrical
phantom. Profile depths = 5 mm (magenta line), 10 mm (blue line), 20 mm (green line), and 30
mm (red line). Shown are the profiles for the brass eSC (top row), the Cerrobend eSC (middle
row), and the lead eSC (bottom row). For each of the three eSCs, profiles are shown for
exposures at relative gantry angles of 0° (left column) and +3° (right column).
0 +3
Bra
ss e
SC
Cerro
ben
d e
SC
Lea
d e
SC
Gantry Angle [°]

79
Table 5.2: Penumbral widths measured from data collected with the cylindrical phantom.
Provided is a quantitative comparison of penumbral widths of the dose distributions measured
with the three eSC materials. These penumbral widths were taken from the lateral profile data
shown previously in Figure 5.8. We defined the penumbral width as the lateral distance between
the 80% and 20% relative dose points along each profile. The difference in penumbral width
was very small between the measured fields. Upon comparing the penumbral widths of all the
measured fields and all lateral profile depths, the largest difference was 1.5 mm.
Figure 5.9: Isodose overlay of the measured dosimetric data collected using the cylindrical
phantom—brass eSC v. Cerrobend eSC v. lead eSC. Dosimetric measurements were obtained
using radiochromic film with a 16 MeV electron beam, at 105 cm SSD, and with a nominally
oriented gantry angle (Grel = 0°). Displayed in the figure are measured data for the brass eSC
(red line), Cerrobend eSC (blue line), and lead eSC (green line).
Relative
Gantry Angle
[°]
eSC Material dref = 5 mm dref = 10 mm dref = 20 mm dref = 30 mm
Brass 2.0 2.0 4.5 8.5
Cerrobend 2.0 2.5 4.5 8.5
Lead 1.5 2.0 5.0 8.5
Brass 2.0 3.0 5.0 9.5
Cerrobend 1.5 1.5 4.5 8.5
Lead 1.5 2.0 5.0 9.0
+3
Cylindrical Phantom Penumbral Width [mm] at depth (dref)
0

80
Figure 5.10: 90% relative dose area comparison taken from the measured dosimetric data
collected using the cylindrical phantom—brass eSC v. Cerrobend eSC v. lead eSC. This plot
represents the area cover by 90% or greater of the relative dose. The area shaded in red
represents the 90% relative dose area of the brass eSC. The blue line and green line represent the
90% relative dose areas of the Cerrobend eSC and Lead eSC, respectively.
Figure 5.11: Leakage profiles taken from measured dosimetric data collected using cylindrical
phantom. Shown in the figure are the leakage profiles from the cylindrical phantom measured
data for the brass eSC (red line), Cerrobend eSC (blue line), and lead eSC (green line). An
unexpected amount of leakage was observed with the brass eSC and was determined to have
been caused by a planning error within the TPS during the design process, which resulted in the
insufficient eSC thickness.

81
Chapter 6: Discussion of Results and Clinical Recommendations
6.1 Collimating Material
Summary of Results:
The quality of the milled product, its weight, and its overall dosimetry (see section 6.5) is
clinically comparable to Cerrobend and lead.
Brass was shown to be compatible with MVCT imaging for validating the shape of the
machined eSC. It gave comparable results to that of the kVCT images of the wax replica
and manual measurements.
Discussion of Results: Brass was selected as the eSC material for the present study because of a
need for a dense metal that is easily machined. Ma et al. (2000) studied the suitability of
multiple metals using Monte Carlo calculations to study photon and electron fluence under 1.5
cm of zinc, copper, lead, and tungsten, and these results showed comparable leakage if scaled by
density. Potential advantages of the denser materials could be less bremsstrahlung leakage if the
higher density material were used for constant thicknesses; however, this would result in
additional weight (potential discomfort). Also, neither lead nor tungsten is easily milled, and
toxicity is a concern with milling Cerrobend (lead alloy).
Clinical Recommendation: The durability of brass and similar dosimetry of brass relative to
lead and Cerrobend make it an excellent potential candidate for machined eSC.
6.2 Bevel Angle and Collimator Scatter (Aim 1)
Summary of Results:
Regardless of the eSC bevel angle (ϴB = 0°, ±10°), the edge of the beam (50% Off-Axis
Ratio at R100) was defined by the divergence of the beam (accounting for gantry angle)
and the inner-most, beam-defining edge of the eSC (cf. Figure 2.5).

82
The penumbral width (P80-20) was the least for bevel angles of 0° and +10° and varies
insignificantly (±0.5mm) with gantry angle (ϴG = 0°, ±3°, ±5°) (cf. Table 3.4).
Increased scatter from the eSC (relative to ϴB = 0°, ϴG = 0°; reference condition of
OARmax = 103.5% at 5 mm depth) was greatest for a bevel angle of +10° with gantry
angles of 0° and +5°, where the OAR was as great as 111% (cf. Figure 3.13). Because of
the low percentage depth-dose of the 6 MeV beam, the dose never exceeded 100% (cf.
Figures 3.8-3.10; Figure 3.11).
Although scatter impacted the 90% relative dose area (cf. Table 3.2), this primarily
impacted the proximal portion of the 90% region. The depth to the distal 90% contour
remained essentially unchanged (cf. Table 3.3 for central-axis R90 comparisons).
Discussion of Results: Electron scatter from the edge of an eSC is complex, depending on
energy, depth , angle of bevel, and direction of electrons striking the eSC edge. Results here are
comparable with others. Lax and Brahme (1980) observed a 109% OAR near the field edge for
10.5 MeV electrons (depth = 1 mm) due to scatter from the eSC edge (ϴB = 0°, ϴG = 0°, eSC
edge on central axis).The most comparable geometry in the present study (ϴB = 0°, ϴG = -3°)
showed a 106% OAR for 6 MeV electrons. Verhaegen et al. (2001) observed a peak dose of
approximately 103% at 6 MeV, and they saw the lobe of scatter dose emitted about 60° from the
central axis direction, both consistent with the present data. Chi et al. (2005) observed a similar
increase in dose near the eSC edge at a depth of 0.5 cm for a 15 MeV electron beam, which
diminished with depth.
Due to the low surface dose (i.e., slow percent depth-dose buildup), there was no clinically
relevant increase in dose, and in some cases, the increase in the 90% relative dose area could be
beneficial. Also, the -10° bevel angle needlessly increased P80-20 by approximately 1 mm. In

83
addition, the proximal edge of eSC with a negative bevel angle can shield 1-2 mm of the
intended treatment field, whereas for 0° and positive bevel angles, the field edge is defined by
the distal eSC edge.
Clinical Recommendations: For low energy beams (low surface dose), the eSC bevel angle is
recommended to be between 0° and +10°, with +10° being more preferable if gantry angle is
expected to be adjusted.
6.3 Collimator Thickness (Aim 2 and 3)
Summary of Results:
Aim 2: MVCT and physical measurement of the brass eSC showed thickness variations
within -1.5 and +1.0 mm (i.e., ±1.5 mm) of the thickness designed within the TPS (cf.
Table 4.1). Variations could be due to the TPS and/or the milling process.
Aim 3: 9 mm of brass (typical thickness of brass eSC) was insufficient for stopping 16
MeV (Ep,0 = 15.9 MeV) electrons, resulting in electrons penetrating approximately 2.25
cm in the HIWO polystyrene cylindrical phantom (cf. Figure 5.11). 2.25 cm of
polystyrene corresponds to an electron energy of approximately 4.5 MeV, which requires
an additional 2.9 mm of brass to stop, i.e., 11.9 mm of brass.
Discussion of Results: For brass at 16 MeV, a minimum thickness (tbrass) of 10.7 mm is
required, according to equation 2.3, without safety margin. This is not consistent with dose
measurements under brass by Hogstrom et al. (1985) (at 17.8 MeV, tbrass = 12.7 mm, which
scales to 11.4 mm for 16 MeV). The values of 11.4 and 11.9 mm of brass at 16 MeV indicate
that the calculated lead thickness is more reasonably scaled by a factor of 1.43 (i.e., tbrass = 1.43 ×
tPb). This increase of 1.3 to 1.43 is believed to be due to less multiple scattering per unit energy
occurring within the brass.

84
Clinical Recommendations: To account for a 1.5 mm uncertainty in the eSC design and
milling process and the decreased multiple scattering, the brass eSC thickness should be
determined by the following equation:
[ ] (
[ ] ) (6.1),
6.4 Validation of Fabrication of Brass eSC (Aim 2)
Summary of Results:
MVCT images of the brass eSC and kVCT images of its wax replica provided similar
results for verification of dimensional agreement of the eSC fabrication with the eSC
design.
MVCT and kVCT results agreed well with physical observations and measurements
A variation in thickness of approximately ±1.5 mm was seen in the brass eSC (cf. Table
4.1).
The distal surface of the eSC fit the skin surface well, within 2 mm of design.
The eSC aperture edge had up to a 3 mm deviation from the eSC design, which is
clinically relevant in 2 of the 3 tested eSCs. The edge of the other was within 0.5 mm.
Discussion of Results: The machined brass eSC matched the design relatively well. The distal
surface fit well, and the thickness was within ±1.5 mm. The aperture edge had the correct shape,
but incorrect divergence, in some cases back-projecting to a virtual source located 20 cm or less
from the eSC. The origin of this error was unknown.
Clinical Recommendations: It is recommended that there be a QA procedure to validate the
eSC dimensions—thickness, bevel angle, aperture, and distal surface. This could be performed
manually by: [a] fitting eSC on the patient; [b] validating correct aperture shape by comparison
with skin markings; [c] having sufficient outer margin (≥ 2 cm outside of light field); and [d]

85
measuring thickness and bevel angle. Alternatively, MVCT could be used and compared with
the TPS design contour. The MVCT could be either on the patient (cf. Figures 4.6 & 4.8) or in
air (cf. Figure 4.7).
6.5 Dosimetric Equivalence of Brass eSC (Aim 3)
Summary of Results: Overall, there was good dosimetric agreement between identical brass,
lead, and Cerrobend eSCs:
Impact of collimator scattered dose—increased dose (3-10%) was observed with brass,
but that difference decreased to almost 0% at 3 cm depth for the 16 MeV beam (cf. Table
5.1).
Field width and the 90% relative dose region—good agreement was seen in 90% regions;
there was a slight difference in field width (50% isodose) due to manual fabrication
methods for lead and Cerrobend eSCs (cf. Figure 5.9).
Penumbral width—no significant difference (≤ 0.5 mm) was observed between the three
eSC materials with a nominal gantry angle (cf. Table 5.2).
Radiation leakage—no evidence of any clinical significant difference in leakage dose
between brass, Cerrobend, and lead (cf. Figure 5.11).
Discussion of Results: For the phantom case used in this investigation (16 MeV), the results
demonstrated that machined brass eSC was dosimetrically comparable to the current standard of
care, with the exception of increased dose near the aperture edge due to scatter. Relative to the
standard of comparison in this study (lead eSC), an increase in scattered electrons was observed
with the brass eSC, specifically near the eSC edge. However, the increase in scatter was near the
surface (0-3 cm) which is partially offset by the buildup of surface dose. Small volumes of dose
greater than 105% dose were seen (cf. Figure 5.4 and 5.5). If important, they could be reduced

86
by better optimizing the collimator bevel. Only a minor effect on the 90% relative dose region
was seen. The eSC material did not have any significant effect on penumbral width.
Clinical Recommendations: Results demonstrated brass to be comparable eSC material to
current standard of care (lead) with the exception of increased scattered dose. Further
investigations should determine the optimal bevel angle to reduce scatter dose from brass eSC.

87
Chapter 7: Conclusions
7.1 Conclusions
Results of this work indicated that brass eSC holds good potential for replacing lead and
Cerrobend skin collimation.
With respect to part 1 of the hypothesis: “that a third party milled brass eSC with its
collimating edge parallel to the mean direction of the divergent electron beam is milled
accurately, i.e., within design parameters” was false. Results for the three milled brass eSCs
showed their thickness to be slightly outside ±1 mm (within ±1.5 mm). Their distal surface
matched the phantom (“skin”) surface to within 2 mm. The aperture shapes were within ±0.5
mm for one eSC. The other two eSCs were fabricated with a bevel whose divergence appeared
to be emitted approximately 20 cm above the eSC, as opposed to 105 cm, resulting in variations
in aperture edge location of up to ±3 mm.
With respect to part 2 of the hypothesis: “that it (brass eSC) is dosimetrically equivalent
to current lead and Cerrobend eSCs with edges parallel to beam central axis and an open bevel
angle of 10°, respectively.” The R90 values agreed within 1 mm, and the penumbral width agreed
within 2 mm. However, scatter dose from the brass was greater, as much as 10% greater than
that from lead.
7.2 Proposed Future Work
The present study was limited for several reasons:
1) The results for aim 1 were limited because [1] only 6 MeV was studied, [2] there was
no comparison with brass, and [3] data analysis was complicated by the edges being
positioned 5 cm (3°) off-axis, making data on the left and right sides asymmetric

88
because one side the beam divergence increased the angle of the mean direction of the
electrons with respect to the eSC aperture edge, but decreased it on the opposite side.
2) The results for aim 2 were limited because two of the three brass eSCs had apertures
with exaggerated divergence (cause unresolved).
3) The results for aim 3 were limited because [1] the brass eSC was designed too thin for
16 MeV electrons, [2] the aperture edge was in error (see 2 above), and [3] only 16
MeV was studied, an energy not used often with eSC.
Prior to clinical use of brass eSCs, the following 3 studies are recommended:
1) Collimator Fabrication: Determine and correct the problem as to why the edges of
the two brass eSCs were fabricated with too great of a divergence. Once corrected,
design new brass eSCs with the new recommended thickness relationship,
[ ] (
[ ] ),
and validate with MVCT.
2) Optimal Bevel Angle: Determine the most appropriate brass eSC bevel angle.
Repeat 2-D dose measurements/calculations from aim 1 using [1] 6, 9, 12, and 16
MeV; [2] brass eSC with bevel angles of 0°, 5°, 10°, and 20°; [3] lead eSC with bevel
angles of 0°, 5°, 10°, and 20°; [4] Cerrobend eSC with bevel angles of 0°, 5°, 10°, and
20°; [5] with the beveled edge placed on central axis of a 20×20 cm2 field; and [6] a
nominal gantry angle (ϴG = 0°). 2-D diode dose measurements in a water phantom (d
≥ 5 mm) and Monte Carlo (MC) dose calculations should be performed, and the
resulting data should be evaluated using similar metrics as the present study. MC
calculations should allow the scattered dose component from the eSC to be isolated.

89
3) eSC with Bolus: The next logical step toward widely available improvements in
electron conformal therapy (ECT) would be to use machined eSC to sharpen the
blurred penumbra beneath a variable-thickness bolus. The use of bolus ECT is a
relatively new development in electron therapy and allows for the modulation of the
electron range to match the distal tumor surface. Much success has been seen with
bolus ECT, but one drawback is the blurring of the penumbra as the electrons traverse
the bolus. Machined eSCs could be used to restore the penumbral sharpness. In this
situation, however, we are, again, faced with the likely prospect that some current
clinical electron dose algorithms will be unable to provide sufficiently accurate dose
calculations for an eSC located below the surface of the bolus. The integration of
machined eSC with bolus ECT would likely provide significant improvement to
currently available treatment options and, perhaps, broaden the application of this
therapy to sites that are more commonly treated using other modalities.

90
References
Almond, P. R., P. J. Biggs, B. M. Coursey, W. F. Hanson, M. S. Huq, R. Nath and D. W. Rogers
(1999). AAPM's TG-51 protocol for clinical reference dosimetry of high-energy photon
and electron beams. Med Phys 26(9): 1847-1870.
Beardmore, A. B. (2007). Evaluation of MVCT Images with Skin Collimation for Electron
Treatment Planning M.S. Thesis, Louisiana State University and Agricultural and
Mechanical College.
Brahme, A. (1987). Design principles and clinical possibilities with a new generation of radiation
therapy equipment. A review. Acta Oncol 26(6): 403-412.
Chi, P. C., K. R. Hogstrom, G. Starkschall, J. A. Antolak and R. A. Boyd (2005). Modeling skin
collimation using the electron pencil beam redefinition algorithm. Med Phys 32(11):
3409-3418.
Dutreix, J. and A. Dutreix (1969). Film dosimetry of high-energy electrons. Ann N Y Acad Sci
161(1): 33-43.
Hogstrom, K. R. (1991). Treatment planning in electron beam therapy. Front Radiat Ther Oncol
25: 30-52; discussion 61-33.
Hogstrom, K. R. (2003). Electron beam therapy: dosimetry, planning, and techniques. Principles
and Practice of Radiation Oncology. I. B. C. Perez, E. Halperin & R. Schmidt-Ullrich.
Baltimore, Lippinkott, Williams, and Wilkins: 252-282.
Hogstrom, K. R., J. A. Meyer and R. Melson (1985). Variable electron collimator for the
Mevatron 77 design and dosimetry. Proc. Conf. of 1985 Mevatron Users (Hilton Head,
SC): 251-276.
Jemal, A., R. Siegel, J. Xu and E. Ward (2010). Cancer statistics, 2010. CA Cancer J Clin 60(5):
277-300.
Karzmark, C., J. Anderson, P. Fessenden, G. Svensson, A. Buffa, F. Khan and K. Wright (1987).
Total skin electron therapy: technique and dosimetry. Report of Task Group 30.

91
Kavanaugh, J. A. (2011). Evaluation of the Pencil Beam Algorithm and Pencil Beam
Redefinition Algorithm for Bolus Electron Conformal Therapy Dose Computation M.S.
Thesis, Louisiana State University and Agricultural and Mechanical College.
Khan, F. M., K. P. Doppke, K. R. Hogstrom, G. J. Kutcher, R. Nath, S. C. Prasad, J. A. Purdy,
M. Rozenfeld and B. L. Werner (1991). Clinical electron-beam dosimetry: report of
AAPM Radiation Therapy Committee Task Group No. 25. Med Phys 18(1): 73-109.
Klein, E. E., J. Hanley, J. Bayouth, F.-F. Yin, W. Simon, S. Dresser, C. Serago, F. Aguirre, L.
Ma, B. Arjomandy, C. Liu, C. Sandin and T. Holmes (2009). Task Group 142 report:
Quality assurance of medical accelerators. Medical Physics 36(9): 4197.
Lax, I. and A. Brahme (1980). Collimation of high energy electron beams. Acta Radiol Oncol
19(3): 199-207.
Ma, C. M., T. Pawlicki, M. C. Lee, S. B. Jiang, J. S. Li, J. Deng, B. Yi, E. Mok and A. L. Boyer
(2000). Energy- and intensity-modulated electron beams for radiotherapy. Phys Med Biol
45(8): 2293-2311.
Million, R. R., J. T. Parsons, F. J. Bova and K. J. Kalbaugh (1991). Electron beam: the
management of head and neck cancer. Front Radiat Ther Oncol 25: 107-127; discussion
132-103.
Robertson, C. J. (2010). Prototype Electron Phantom for Radiographic and Radiochromic Film
Dosimetry M.S. Thesis, Louisiana State University and Agricultural and Mechanical
College.
Shiu, A. S. and K. R. Hogstrom (1991). Dose in bone and tissue near bone-tissue interface from
electron beam. Int J Radiat Oncol Biol Phys 21(3): 695-702.
Siegel, R., E. Ward, O. Brawley and A. Jemal (2011). Cancer statistics, 2011: the impact of
eliminating socioeconomic and racial disparities on premature cancer deaths. CA Cancer
J Clin 61(4): 212-236.
Sutton, M. W. (2011). Delivery Accuracy of Image Guided Radiation Therapy Using Elekta
Infinity's On-Board Imaging M.S. Thesis, Louisiana State University and Agricultural
and Mechanical College.
Tapley, N. (1976). Clinical Application of the Electron Beam. New York, Wiley Biomedical.

92
Verhaegen, F., F. M. Buffa and C. Deehan (2001). Quantifying effects of lead shielding in
electron beams: a Monte Carlo study. Phys Med Biol 46(3): 757-769.
Watkins, D. M. B. (1981). Radiation Therapy Mold Technology: Principles and Design. New
York, Pergamon Press.
Wooden, K. K., K. R. Hogstrom, P. Blum, R. J. Gastorf and J. D. Cox (1996). Whole-limb
irradiation of the lower calf using a six-field electron technique. Med Dosim 21(4): 211-
218.

93
Vita
Ryan Posey hails from West Point, Mississippi, a small town in Northeast Mississippi. In
May of 2001, Ryan graduated high school from Oak Hill Academy and enrolled in classes at the
University of Mississippi for the fall semester of that year. His major field of study was in
physics with minors in mathematics as well as psychology. After graduating from Ole Miss in
December 2005, he relocated from Oxford, MS to Jackson, MS. Ryan was acutely aware of his
interest in the field of medical physics, but instead of immediately venturing into his graduate
studies, he accepted a position with a local mortgage company, where he was employed for the
duration of his time in Jackson. In October 2006, Ryan became engaged to be married to
Rebecca Perry, and as the sun set on June 22nd
of 2007, they exchanged vows on the shore of
Grayton Beach, FL. They moved to Baton Rouge in the summer of 2007. Ryan was not initially
accepted into the Louisiana State University’s Master of Science program in medical physics, so
under the advisement of Dr. Kenneth Hogstrom, he accepted a part-time position working in the
Mary Bird Perkins Cancer Center mould room and, later, as a QA dosimetrist performing IMRT
QA. While working Ryan was able to enroll as a part-time student and take several of the
graduate medical physics courses, which eventually led to his being admitted into the medical
physics program. In February 2012, Rebecca and Ryan welcomed a daughter, Anadine, into
their lives. After his M.S. degree requirements have been satisfied, Ryan is slated to begin a 2
year radiation oncology physics residency program at OncoLogics, Inc. in Lafayette, Louisiana.