Embed Size (px)
Citation preview
Graduate Theses and Dissertations Iowa State University Capstones, Theses andDissertations
2014
Utilization of durian biomass for biorenewableapplicationsAhmad Safuan Bin BujangIowa State University
Follow this and additional works at: https://lib.dr.iastate.edu/etd
Part of the Agriculture Commons, Bioresource and Agricultural Engineering Commons, and theOil, Gas, and Energy Commons
This Dissertation is brought to you for free and open access by the Iowa State University Capstones, Theses and Dissertations at Iowa State UniversityDigital Repository. It has been accepted for inclusion in Graduate Theses and Dissertations by an authorized administrator of Iowa State UniversityDigital Repository. For more information, please contact [email protected].
Recommended CitationBin Bujang, Ahmad Safuan, "Utilization of durian biomass for biorenewable applications" (2014). Graduate Theses and Dissertations.13915.https://lib.dr.iastate.edu/etd/13915
Utilization of durian biomass for biorenewable applications
by
Ahmad Safuan Bujang
A dissertation submitted to the graduate faculty
in partial fulfillment of the requirements for the degree of
DOCTOR OF PHILOSOPHY
Co-Majors: Agricultural Engineering;
Biorenewable Resources Technology
Program of Study Committee:
Carl J Bern, Co-Major Professor
Thomas J Brumm, Co-Major Professor
Kurt A Rosentrater
Mark Mba-Wright
Richard J Gladon
Iowa State University
Ames, Iowa
2014
Copyright © Ahmad Safuan Bujang, 2014. All rights reserved.
ii
DEDICATION
رب العالمين ان صلاتي ونسكي ومحياي ومماتي لل
To
Papa, Mama, Izzah,
Harizz, Ayla, Faizz and my unborn son.
iii
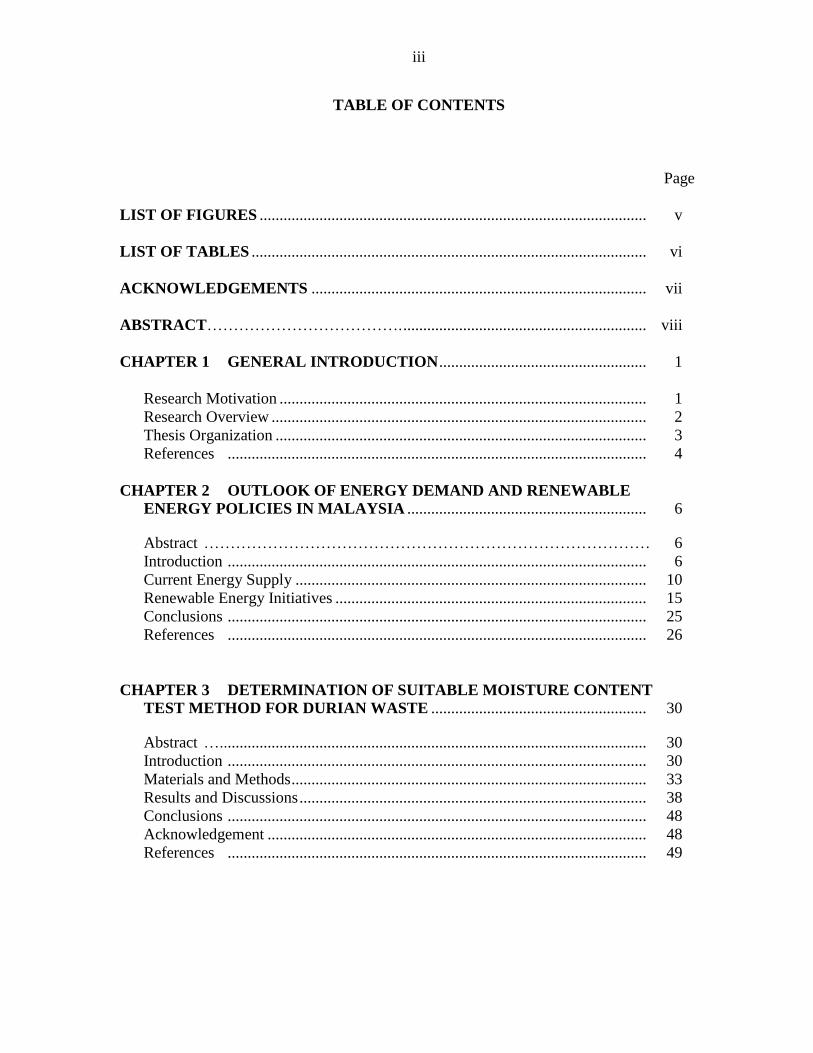
TABLE OF CONTENTS
Page
LIST OF FIGURES ................................................................................................. v
LIST OF TABLES ................................................................................................... vi
ACKNOWLEDGEMENTS .................................................................................... vii
ABSTRACT………………………………. ............................................................. viii
CHAPTER 1 GENERAL INTRODUCTION .................................................... 1
Research Motivation ............................................................................................ 1
Research Overview .............................................................................................. 2
Thesis Organization ............................................................................................. 3
References ......................................................................................................... 4
CHAPTER 2 OUTLOOK OF ENERGY DEMAND AND RENEWABLE
ENERGY POLICIES IN MALAYSIA ............................................................ 6
Abstract ………………………………………………………………………… 6
Introduction ......................................................................................................... 6
Current Energy Supply ........................................................................................ 10
Renewable Energy Initiatives .............................................................................. 15
Conclusions ......................................................................................................... 25
References ......................................................................................................... 26
CHAPTER 3 DETERMINATION OF SUITABLE MOISTURE CONTENT
TEST METHOD FOR DURIAN WASTE ...................................................... 30
Abstract …........................................................................................................... 30
Introduction ......................................................................................................... 30
Materials and Methods ......................................................................................... 33
Results and Discussions ....................................................................................... 38
Conclusions ......................................................................................................... 48
Acknowledgement ............................................................................................... 48
References ......................................................................................................... 49
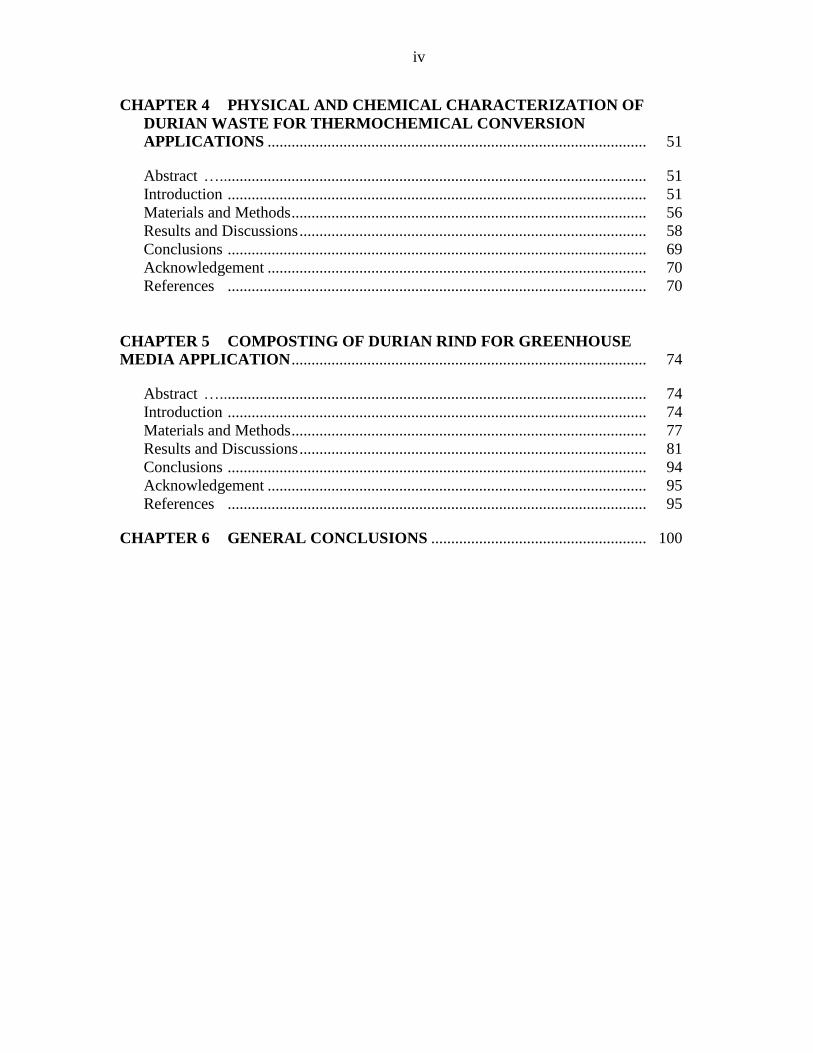
iv
CHAPTER 4 PHYSICAL AND CHEMICAL CHARACTERIZATION OF
DURIAN WASTE FOR THERMOCHEMICAL CONVERSION
APPLICATIONS ............................................................................................... 51
Abstract …........................................................................................................... 51
Introduction ......................................................................................................... 51
Materials and Methods ......................................................................................... 56
Results and Discussions ....................................................................................... 58
Conclusions ......................................................................................................... 69
Acknowledgement ............................................................................................... 70
References ......................................................................................................... 70
CHAPTER 5 COMPOSTING OF DURIAN RIND FOR GREENHOUSE
MEDIA APPLICATION ......................................................................................... 74
Abstract …........................................................................................................... 74
Introduction ......................................................................................................... 74
Materials and Methods ......................................................................................... 77
Results and Discussions ....................................................................................... 81
Conclusions ......................................................................................................... 94
Acknowledgement ............................................................................................... 95
References ......................................................................................................... 95
CHAPTER 6 GENERAL CONCLUSIONS ...................................................... 100
v
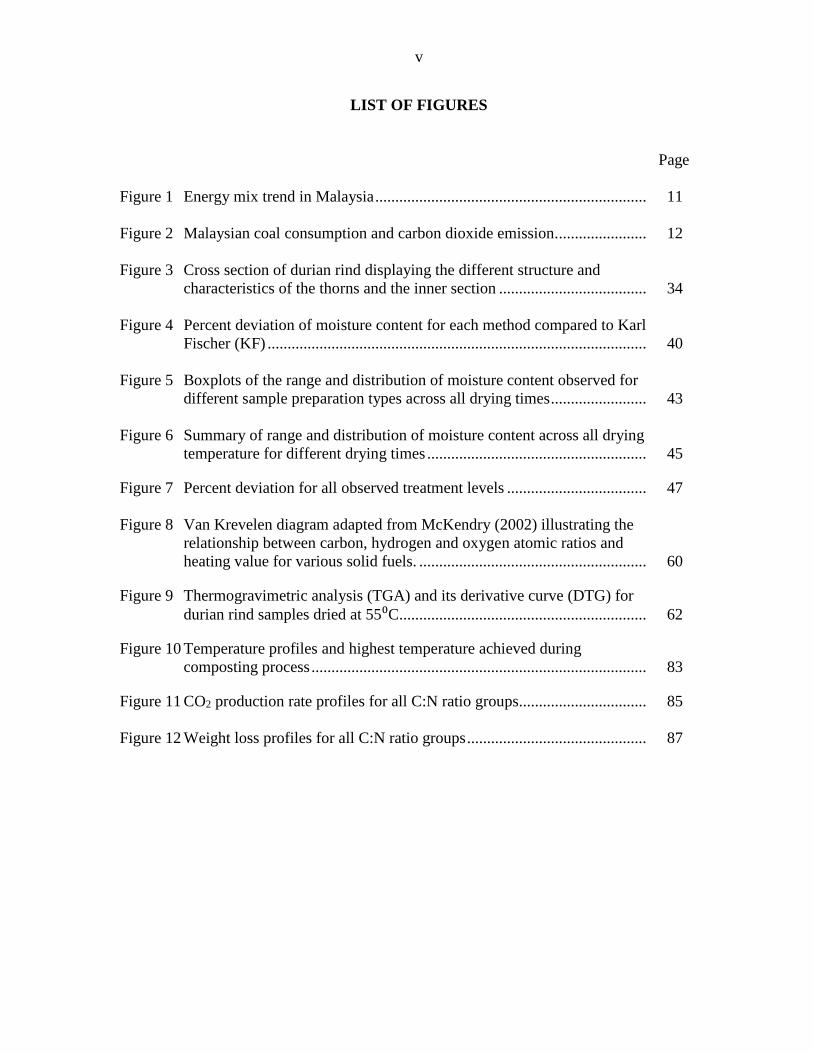
LIST OF FIGURES
Page
Figure 1 Energy mix trend in Malaysia .................................................................... 11
Figure 2 Malaysian coal consumption and carbon dioxide emission. ...................... 12
Figure 3 Cross section of durian rind displaying the different structure and
characteristics of the thorns and the inner section ..................................... 34
Figure 4 Percent deviation of moisture content for each method compared to Karl
Fischer (KF) ............................................................................................... 40
Figure 5 Boxplots of the range and distribution of moisture content observed for
different sample preparation types across all drying times ........................ 43
Figure 6 Summary of range and distribution of moisture content across all drying
temperature for different drying times ....................................................... 45
Figure 7 Percent deviation for all observed treatment levels ................................... 47
Figure 8 Van Krevelen diagram adapted from McKendry (2002) illustrating the
relationship between carbon, hydrogen and oxygen atomic ratios and
heating value for various solid fuels. ......................................................... 60
Figure 9 Thermogravimetric analysis (TGA) and its derivative curve (DTG) for
durian rind samples dried at 55⁰C .............................................................. 62
Figure 10 Temperature profiles and highest temperature achieved during
composting process .................................................................................... 83
Figure 11 CO2 production rate profiles for all C:N ratio groups................................ 85
Figure 12 Weight loss profiles for all C:N ratio groups ............................................. 87
vi
LIST OF TABLES
Page
Table 1 Renewable energy potential in Malaysia ................................................... 18
Table 2 Summary of top ten major fruit crops ........................................................ 23
Table 3 Oven drying methods in use for biological and biofuel materials ............. 36
Table 4 Summary of results for the comparison of different moisture content
measurement methods ................................................................................ 39
Table 5 ANOVA table output for the analysis of the three main effects ................ 41
Table 6 Test of two factors over every levels of the other factor ........................... 41
Table 7 Proximate and ultimate analyses of durian rind and other biomass
samples, in comparison with coal .............................................................. 59
Table 8 Comparison of burning characteristics of durian sample with other
biomass ...................................................................................................... 63
Table 9 Summary of lignocellulosic components and heating value of durian
rind and other biomass ............................................................................... 64
Table 10 ICP-OES analysis of common inorganic elements in durian biomass ...... 66
Table 11 Compounds identified from the volatiles generated by durian biomass
pyrolysis ..................................................................................................... 67
Table 12 Summary of compound group fraction derived from durian biomass
pyrolysis ..................................................................................................... 69
Table 13 Mean water soluble macronutrients for all treatment levels compared to
the recommended CEC (1986) values ....................................................... 90
Table 14 Summary of means of essential compost quality parameters compared to
the range recommended by US Composting Council ................................ 92
Table 15 Assessment of compost quality parameters based on the recommended
range ........................................................................................................... 93
vii
ACKNOWLEDGEMENTS
Alhamdulillahi rabbil 'alamin. The years I’ve spent here at Iowa State University have
been best years of my life. I would like to extend my utmost gratitude to Dr Carl Bern, Dr
Thomas Brumm for your unending support, encouragement and guidance. Thank you to my
committee members, Dr Kurt Rosentrater, Dr Mark Mba-Wright, and Dr Richard Gladon for
your advice, insight and council throughout my program of study.
I would like to thank the Malaysian Agricultural Research and Development Institute
(MARDI) for providing the necessary funding for my research. Thank you to Mr Mohd
Zainal Ismail for the trust and support given to me all these years. I would also like to offer
my sincere thanks to my friends, my colleagues, department faculty and staff, Ryan Smith
and his staff at the Biorenewables Research laboratory and everyone else that have
contributed both directly and indirectly towards the completion of my research and for
enriching my experience here at Iowa State University.
Thank you to my father, Bujang for instilling the values of discipline, leadership and
importance of education throughout my life. To my mother, Sofia for her encouragement and
her sacrifice of being away from her only son, starting from my time at the Malay College all
those years back. As your son, my only wish was to make both of you proud.
Last but certainly not least, to Izzah, Harizz, Ayla, Faizz and my family for your love,
encouragement, and patience without which my endeavor would have been impossible.
viii
ABSTRACT
The utilization of tropical fruit biomass as feedstock for biorenewable resources is an
attractive proposition due to its abundance and potential to reduce reliance on conventional
sources as well as the overall economic gain to all stakeholders. This study aims to pave the
way towards successful and viable utilization of this feedstock by exploring and examining
key physical and chemical traits of durian biomass, a major tropical fruit crop in Malaysia.
The study was divided into three main parts: identification of durian biomass
moisture test method, characterization of physical and chemical properties of durian biomass
for thermochemical conversion, and composting of durian biomass. In the first section,
HORT 2 method was found to be the best available moisture content test and depending on
the process optimization need, ground samples can provide the fastest accurate result, while
cubed or whole samples provide easier handling but require adequate drying time and
temperature. Durian biomass was found to be comparable to most biomass studied in the
literature. Its low ash value and high calorific value, especially when compared to palm oil
biomass which is currently used in co-firing plants, makes it an attractive option. For other
thermochemical applications, high moisture and oxygen content in durian biomass requires
drying and pretreatment for optimal processing. In the composting section, nutrient content
observed from the analysis of the compost indicates that durian rind is suitable for
greenhouse media application. However, pH conditioning, nutrient supplement, and particle
size reduction are needed to amend and improve its quality.
1
CHAPTER I. GENERAL INTRODUCTION
Research Motivation
Rising energy costs, reliance on depletable conventional energy sources and
environmental conservation are main instigators driving most economies towards more
sustainable alternatives. Under various policy impetuses (EPU, 2010), Malaysia is gearing
towards incorporating more renewable alternatives to diversify its energy mix. The abundance of
various biomass resources from agricultural activities is seen as a potential feedstock source that
can be converted into various biorenewable resources.
Tropical fruit crops are one of the major agricultural production crops in Malaysia with
an annual production of 1.6 million Mg (DOA, 2012). Current practices of discarding post-
harvest agricultural waste in landfills or through open burning create obvious and grave
ramifications to the environment and general health standards. Furthermore, supply glut and its
adverse impact on the farmers’ economic gain further magnifies the need to devise and introduce
not only a better post-harvest management system but also an avenue to add value to these
discarded waste streams.
Fruit crops research, production and marketing are under the purview of various
governmental agencies that also oversee the implementation of governmental policies,
dissemination of information to the stakeholders as well as logistical management of all key
assets. This existing structure can be seen as a great advantage for the implementation of
biorenewable conversion processes that are often plagued by logistical and public acceptance
issues (Gold and Seuring, 2011; Savvanidou et al., 2010).
2
Research Overview
Biorenewable technology encompasses various conversion routes that involve conversion
of various feedstocks into energy, chemicals and materials through thermochemical or
biochemical processes, or a combination of both. The body of research into this area is vast and
covers a myriad of different feedstocks. Before any biorenewable utilization of tropical biomass
can begin, it is imperative that its fundamental chemical and physical characteristics be
investigated and explored. This can be done by applying existing techniques established for
widely researched feedstocks such as corn residues, soft and hardwoods, and perennial grasses.
Being a major contributor to the tropical fruit industry, choosing durian biomass for biomass
exploratory studies was an obvious choice and the knowledge garnered will then be extended to
other tropical fruit types as well.
The key aspect of this study was to quantify the potential of utilizing durian biomass in
thermochemical conversion processes. Moisture content is a vital aspect for this processing route
that affects not only the processing parameters but also storage and logistical decisions. In order
to avoid confusion or uncertainties as seen in moisture testing practices for dried distiller’s grains
(Thiex, 2000), establishing an accurate moisture method test must be carried out. This is done
through two phases, where phase one is the comparison of existing methods of oven drying with
reference to a Karl Fischer method. Phase two consists of the evaluation of moisture content
measurement through drying at different temperatures, drying times and sample preparation
methods.
In thermochemical conversion processes, physical and chemical characterization is
integral in understanding the thermal degradation properties of biomass. Chemical composition
3
also affects the pyrolysis process where high nitrogen and ash concentration negatively affect
hydrocarbon yields (Sanderson et al., 1996). Here, proximate and ultimate analyses need to be
done to determine key attributes and traits such as ash and volatiles, as well as elemental and
metal fractions. These traits will lead to further analysis of the material such as yield prediction,
mathematical models, process optimization and economic analysis.
Other than thermochemical conversion routes, composting is seen as a comparatively
simple and low-cost waste treatment alternative that can be easily and quickly implemented in
the industry. Compost can be utilized in various applications including greenhouse potting
media, forest soil amendment (silvicultural), and land reclamation applications (Shiralipour et
al., 1992), as well as highway embankment erosion control (Glanville et. al, 2004; Bakr et al.,
2012) and as a treatment measure for bio-security purposes in response to large scale emergency
livestock mortality (Glanville and Trampel, 1997; Glanville et. al., 2006). Application of
compost as greenhouse media is an attractive option particularly due to increasing cost and
environmental impact of peat extraction (Herrera et al., 2008; Benito et al., 2005). Therefore,
evaluation of key composting characteristics such as temperature profiles and carbon dioxide
production rates need to be observed during the composting of durian rind at different levels of
carbon and nitrogen (C:N) ratios and sample preparation methods. The compost products will
then be evaluated through relevant chemical and physical tests to gauge their viability for
greenhouse media applications.
Thesis Organization
Understanding the need for renewable and sustainable energy alternatives in Malaysia
can be fortified by viewing the energy scenario from a historical, present, and projected outlook
4
in Chapter 2. It also includes a summary of both conventional and renewable energy alternatives
including biomass utilization potential.
This thesis follows the thesis with journal papers format, where the following chapters
will incorporate individual scientific reports related to the three focus areas of this research.
Chapter 3 is the report on the determination of suitable air oven moisture content test for durian
biomass. The physical and chemical characterization for thermochemical conversion and
pyrolysis product identification will be discussed in Chapter 4. The third research focus,
involving the study of durian rind composting, will be presented in Chapter 5. Lastly, a
generalized conclusion based on the conclusions of all four chapters is presented in Chapter 6.
References
Benito, M., Masaguer, A., De Antonio, R., and Moliner, A., 2005. Use of pruning waste compost
as a component in soilless growing media. Bioresource technology, 96(5): 597-603.
Economic Planning Unit (EPU), Prime Minister’s Department Malaysia. 2010. 10th Malaysian
Plan (2011-2015) Chapter 3.
http://www.epu.gov.my/eputheme/RMKE10/img/pdf/en/chapt3.pdf. Accessed on 5-28-
2013
Glanville, T. D., and Trampel, D. W., 1997. Composting alternative for animal carcass disposal.
Journal of the American Veterinary Medical Association, 210.
Glanville, T. D., Richard, T. L., Harmon, J. D., Reynolds, D. L., Ahn, H., and Akinc, S., 2006.
Environmental impacts and biosecurity of composting for emergency disposal of
livestock mortalities. Agricultural and Biosystems Engineering Project Reports. Paper 1.
Gold, S. and Seuring, S. 2011. Supply chain and logistics issues of bio-energy
production. Journal of Cleaner Production, 19(1): 32-42.
Herrera, F., Castillo, J. E., Chica, A. F., and López Bellido, L. 2008. Use of municipal solid
waste compost (MSWC) as a growing medium in the nursery production of tomato
plants. Bioresource technology, 99(2): 287-296.
5
Sanderson, M.A., Agblevor, F., Collins, M. and Johnson, D.K. 1996. Compositional analysis of
biomass feed stocks by near infrared reflectance spectroscopy. Biomass Bioeng, 11: 365–
370.
Savvanidou, E., Zervas, E., and Tsagarakis, K. P. 2010. Public acceptance of biofuels. Energy
Policy, 38(7): 3482-3488.
Shiralipour, A., McConnell, D.B. and Smith, W.H., 1992. Uses and benefits of MSW compost:
A review and an assessment. Biomass and Bioenergy Vol. 3, (34): 267-279.
Thiex, N. 2009. Evaluation of Analytical Methods for the Determination of Moisture, Crude
Protein, Crude Fat, and Crude Fiber in Distillers Dried Grains with Solubles. J. AOAC
Int. 92: 61–73.
6
CHAPTER 2. OUTLOOK OF ENERGY DEMAND AND RENEWABLE ENERGY
POLICIES IN MALAYSIA
A paper to be submitted to The Biomass and Bioenergy Journal
Ahmad Bujang1,2, Carl Bern2, Thomas Brumm2
Abstract
Malaysia is a ‘newly-industrialized’ country that relies heavily on its exports of oil and is
a major producer of palm oil and rubber. Due to favorable geographical attributes, renewable
resources such as hydroelectric, solar and biomass provide attractive alternatives to dependence
on fossil fuels. Fuel diversification policies were introduced in 1999 to promote the use of
renewable energy, particularly in electricity generation. Diversification of energy resources are
one of the main pillars in the new Malaysia plan. Other than hydroelectric and solar energy,
biomass from palm oil and other agricultural practices including fruit crops can be utilized to
produce energy and renewable resources. Although existing policies point towards integration of
sustainable energy resources, a more aggressive approach is needed to substantially offset fossil-
fuel consumption.
Introduction
Diversification of energy sources and achieving energy independence are seen as key
steps in ensuring stable economic growth and societal development. Although blessed with
1 Author, Malaysian Agricultural Research and Development Institute (MARDI). 2 Agricultural and Biosystems Engineering, Iowa State University.
7
relatively abundant natural resources, Malaysia is not immune to the challenges of dwindling
energy resource supplies, environmental stewardship and sustainable development. Due to
favorable climate for cultivation of various kinds of crops for food and energy, the potential of
diversifying the energy mix through utilization of these renewable resources is very promising.
Beyond the promise of palm oil and its derivative, Malaysia is also home to a myriad of
other crops that can be utilized as well. Within the existing framework of governmental agencies
that governs the cultivation, collection, distribution and marketing, as well as research and
development, a concerted effort between these entities will facilitate a smoother transition and
implementation of sustainable initiatives. To envision an energy mix that incorporates all
available natural resources as well as renewable options, it is essential to look at current and
future energy demands as well as the important figures pertaining to existing and renewable
energy resources. This paper will summarize these key facts as well as highlight important
policies that may facilitate the implementation of sustainable initiatives and finally look into how
biomass can contribute to the mix.
Historical overview
Historically, the Malaysian economy and its multicultural makeup were heavily
influenced by its British colonial masters. During the latter part of the 19th century, tin mining
and rubber plantations were introduced by the British and with them, the influx of foreign
laborers from India and China. After gaining independence in 1957, mining and agriculture
became the backbone of the economy. The 1970s saw the shift towards a more multi-sector
economy with more emphasis in developing its industrial sector and its wealth in oil reserves.
The energy crisis during the 1970s has not only greatly shaped the energy landscape of the world
8
but in Malaysia as well. Oil was the main contributor to the energy mix with about 87.9 % in
1980 (MoE, 2010).
To reduce the dependency on foreign oil, several policy measures were taken by the
government. The national oil corporation, PETRONAS, was formed under the terms of the
Petroleum Development Act passed in 1974. The company was given exclusive rights to explore,
develop and produce petroleum resources in Malaysia. In 1979, the National Energy Policy was
introduced to ensure the provision and full utilization of cost effective and diversified energy.
With regards to prolonging the lifespan of the oil reserves as well, two further acts were passed.
They are the 1980 National Depletion Policy and the Four-Fuel Diversification Strategy 1981.
These measures were taken to ensure future energy security and stability, and balancing the
utilization of oil, gas, hydroelectric and coal.
Energy demand
Foreign and local investments, open market practices and state-influenced macro-
economic planning in the preceding years saw the country bounce back from serious regional
and global economic downturns, and emerge as a major economic presence in Asia. Malaysia is
currently classified as a newly industrialized country and the major economic activities involve
exports of oil and palm oil, as well as being a major exporter of semiconductor and electronic
goods. Gross domestic production (GDP) averaged above 6% growth from 1990 to 2005 and it
was as high as 9% yearly growth before the Asian Financial Crisis in 1997 (MoF, 2000). The
corresponding total primary energy consumption climbed to 60.4 Mtoe1 (2.5 x 10⁹ GJ) in 2005
1 Mtoe = million tonne of oil equivalent (1 toe = 42 GJ)
9
from 19.6 Mtoe (0.8 x 10⁹ GJ) in 1990 (EPU, 2006).Although the country is seeking to move
away from the manufacturing industry as a measure to counter uncertainties in global trade
market and volatile oil prices, manufacturing will still play a big role in the economy and it
figures heavily in various economic projection studies.
Based on simulations done by Gan and Li (2008), Malaysia’s GDP is expected to average
4.6% growth rate from 2004 to 2030, with the total primary energy consumption expected to
grow at an average of 4.3% annually in the same period tripling the projected energy demand to
160.9 Mtoe (6.7 x 10⁹ GJ). In the same period, GDP share of agriculture sector is projected to
drop further from 10.2% to 7.2%. Marginal increase of 1% is projected for industrial and service
sectors from 50% and 41% GDP share respectively, within the same time period as well (Gan
and Li, 2008). A similar study done by the Asia-Pacific Economic Cooperation (APEC) in 2006
projected the primary energy demand increase of 146.7 Mtoe (6.1 x 10⁹ GJ) by 2030 with an
annual rate of 3.5%. The increase in GDP also translates into better spending power and an
increased standard of living. This results into increased car ownership, up to 12.8 million cars in
2030 from 6 million in 2004 (Gan and Li, 2008) and an increase in electricity demand as well.
The future outlook of the energy mix will depend heavily on the compelling need to cater
to the demands from the industrial sectors and the public in the form of transportation fuel and
electricity. Lau et al., 2009 summarizes the breakdown of energy users, where a sizeable chunk
goes to the transportation and industrial sectors, which account for 40.3% and 38.6%
respectively. Residential and commercial sectors account for 13%, as well as 0.3% for the
agricultural sector. It will be interesting to view the energy scenario in Malaysia from both a
chronological aspect as well as having an overview look at the policies taken in promoting and
10
developing the alternatives to the current mix. Through these policies, it will be possible to gage
the preparedness of the country to meet future energy challenges and adherence to international
climate change regulations.
Current Energy Supply
Oil and natural gas
Malaysia’s revenue and energy structure has been built around petroleum, where 40% of
the revenues are estimated to come from oil and gas related activities. Looking at the energy mix,
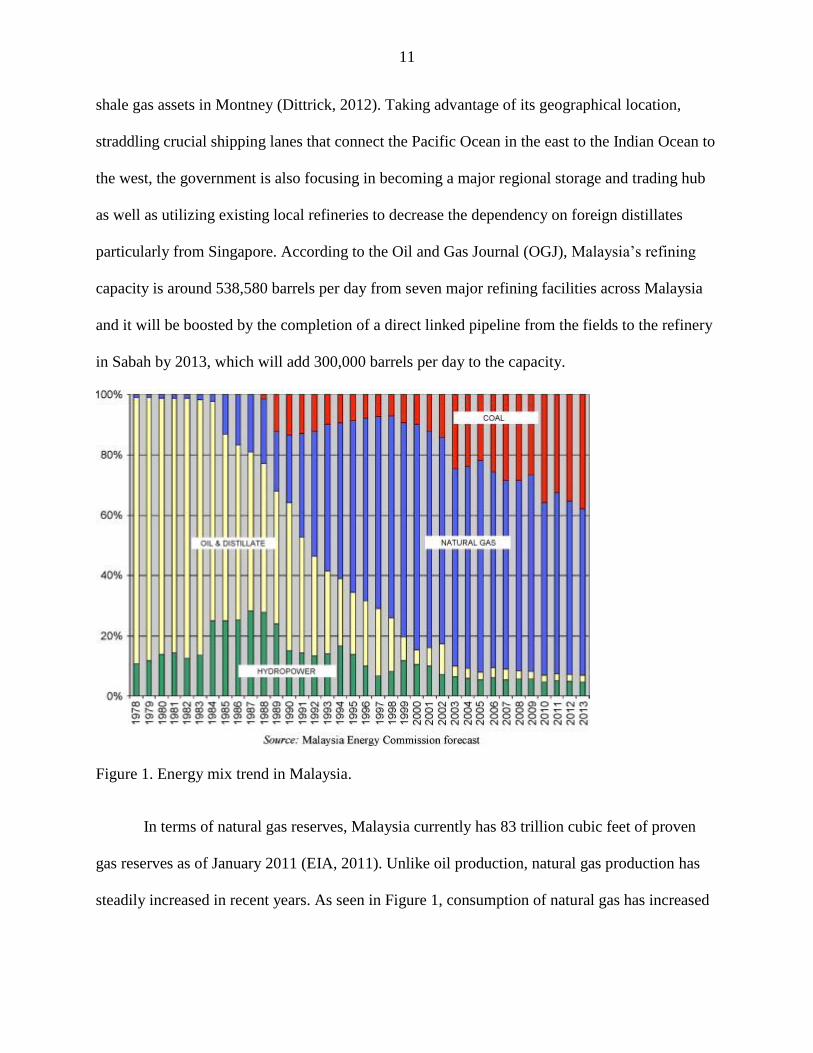
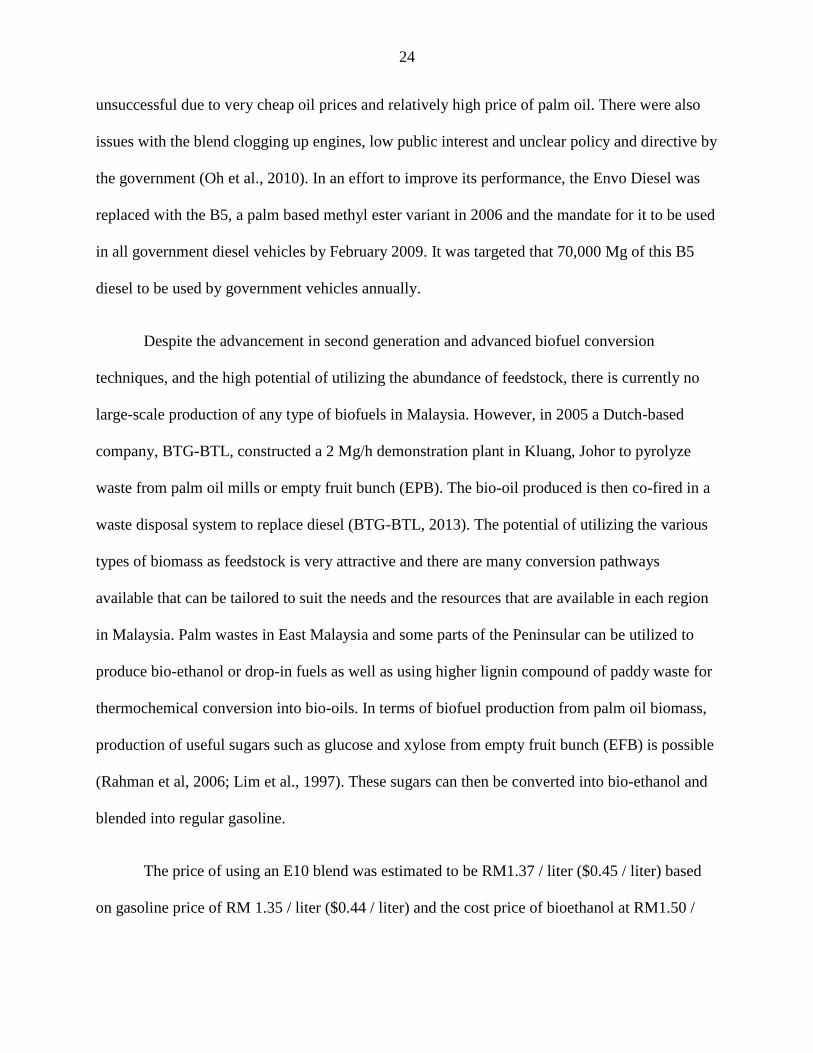
oil and natural gas accounted for more than 80% of the total mix from 1978 to 2000 (Figure 1).
As of 2011, Malaysia has proven oil reserves of about 4 billion barrels, which comes mostly
from offshore oilfields. Total oil production in 2011 was an estimated 630,000 barrels per day, of
which 83% was crude oil (EIA, 2011). Malaysia is still a net exporter of oil, however with peak
of production occurring in around 2003, increased consumption has reduced net exports. With
the declining production and increasing demands, the government has turned to promoting
enhanced output and advancing exploration in deepwater areas. Through new tax and investment
incentives, the objective is to increase aggregated production capacity by 5 percent per year up to
2020. Blocks of potential oilfields were opened to foreign companies under joint ownership with
PETRONAS as well as agreement with neighboring countries such as Brunei and Vietnam to
jointly develop once disputed areas.
A more recent development saw PETRONAS acquiring Canada’s Progress Energy
Resources Corp in a US$5.5 Billion deal. This deal enables PETRONAS to tap into the
unconventional gas reserves in northeast British Columbia and northwest Alberta, as well as
11
shale gas assets in Montney (Dittrick, 2012). Taking advantage of its geographical location,
straddling crucial shipping lanes that connect the Pacific Ocean in the east to the Indian Ocean to
the west, the government is also focusing in becoming a major regional storage and trading hub
as well as utilizing existing local refineries to decrease the dependency on foreign distillates
particularly from Singapore. According to the Oil and Gas Journal (OGJ), Malaysia’s refining
capacity is around 538,580 barrels per day from seven major refining facilities across Malaysia
and it will be boosted by the completion of a direct linked pipeline from the fields to the refinery
in Sabah by 2013, which will add 300,000 barrels per day to the capacity.
Figure 1. Energy mix trend in Malaysia.
In terms of natural gas reserves, Malaysia currently has 83 trillion cubic feet of proven
gas reserves as of January 2011 (EIA, 2011). Unlike oil production, natural gas production has
steadily increased in recent years. As seen in Figure 1, consumption of natural gas has increased
12
from the year 1998 onwards in order to reduce the demand load on oil. Total production is
currently around 2800 billion cubic feet with total consumption of around 1000 billion cubic feet
(EIA, 2011). The most active areas of exploration and production are in the lower part of the
Gulf of Thailand, where Malaysia and Thailand own equal percentages of the joint venture in
operations. New oilfields off Sarawak in east Malaysia are also being developed with big
investments from foreign companies such as Murphy Oil and Shell that would also add to the
production capacity for at least the next 10 years. The Bintulu liquid natural gas (LNG)
processing complex in East Malaysia is the largest in the world with a total liquefaction capacity
of 22.7 million metric tons (1.1 trillion cubic feet) per year. Having this facility close to major
wells in the region will be beneficial both in trade and also giving Malaysia an infrastructural
edge when securing joint operations of oilfields with Thailand, Brunei and the Philippines.
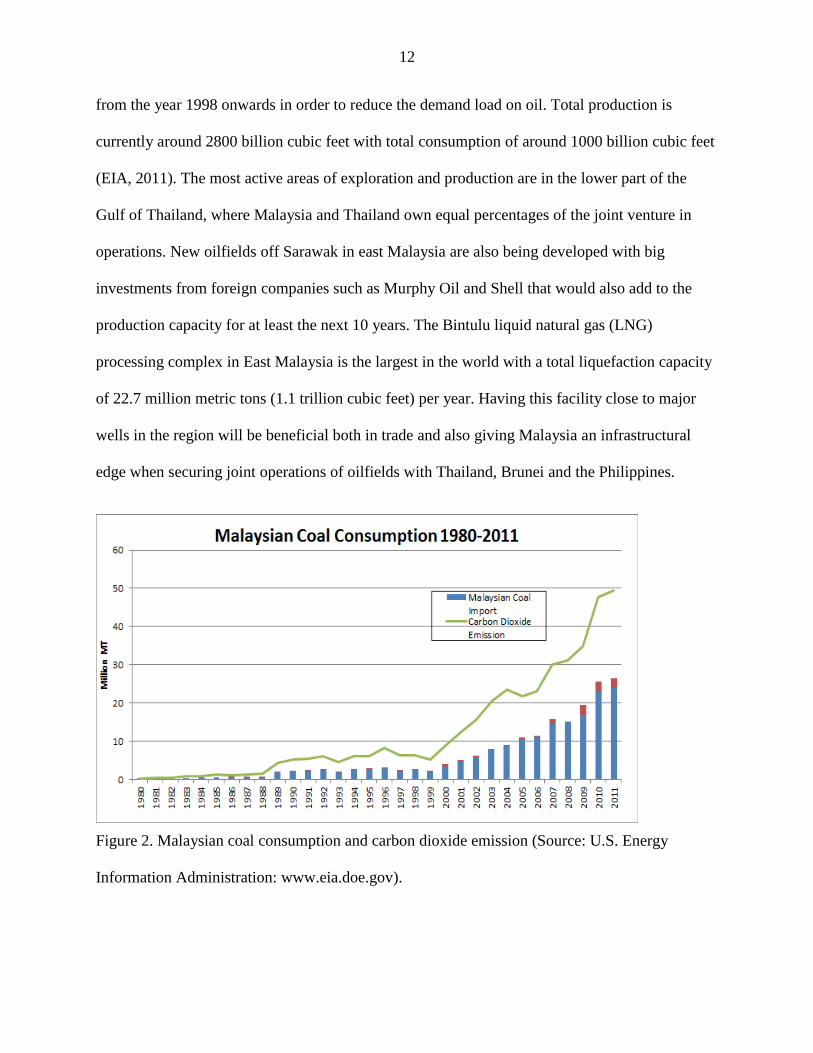
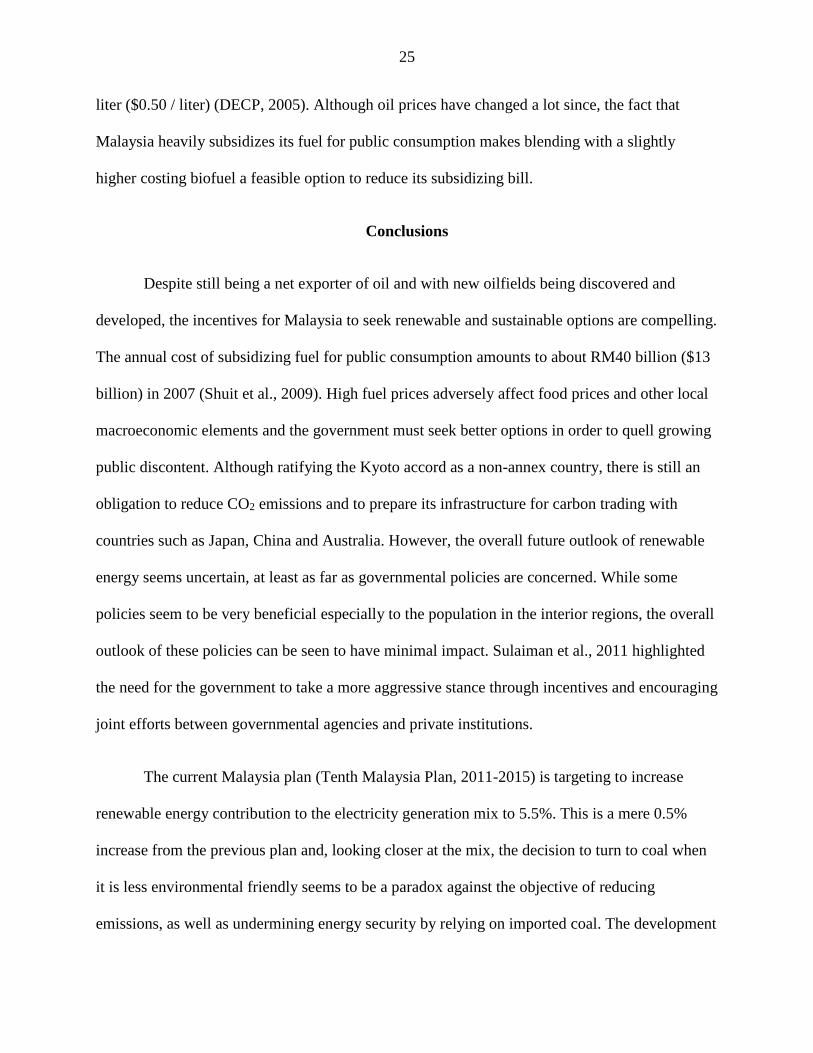
Figure 2. Malaysian coal consumption and carbon dioxide emission (Source: U.S. Energy
Information Administration: www.eia.doe.gov).

13
Coal
Figures 1 and 2 also clearly reflect the policy change in terms of which resource is mainly
utilized in the energy mix. Although still largely dominated by the utilization of oil and natural
gas, since 1999, the policy has shifted into consuming less oil and increasing the usage of coal
due to its relatively reliable worldwide reserve and stable price. Coal resource in Malaysia is
relatively small and is estimated to be around 1724 million metric tons, of which 274 million
metric tons are measured, 347 million tons indicated and 1102 million metric tons inferred
(Thaddeus, 2002). 80% of these reserves are located in the interior regions of Sarawak in East
Malaysia and are not easily accessible for current consumption. The demand is met by imports
from Indonesia, Australia and China (Oh et al., 2010). Analyzing Figure 2, total coal
consumption in 1980 to 2000 was about 32 million metric tons and this figure rose significantly
in the following decade to about 142 million metric tons. In relation to the change in economic
policies, this four-fold increase is due to the need to supply power generation plants as well as
industrial sectors such as cement, iron and steel plants.
There are currently four coal-fired power plants in operation supplying about 7200 MW
of power to the national electricity grid. As far as energy security is concerned, although there is
considerable risk of relying on foreign supply of coal for around 40% of the total energy mix,
these plants are supplied by long-term contracts with solid trade ties such as Indonesia and
Australia. The Sarawak Corridor of Renewable Energy (SCORE) is a major development
initiative to promote the development of the central region in the state where most of the coal
reserve is located. Although the renewable energy targeted in this scheme is hydropower, this
initiative seeks to capitalize on the abundance of natural resources especially coal and natural gas
14
in the central region. These energy resources would then attract the influx of manufacturing
industry to give the state the highest economic impact focusing on physical development,
investment promotion and marketing planning (SCORE, 2011). However, this operation involves
huge investments and interests from international entities.
Under the 10th Malaysian Plan (2011-2015), two 1000-MW coal plants in Tanjung Bin
and Manjung are scheduled to be built and commissioned by 2016 (EPU, 2010). These plants
will operate at supercritical levels which would increase steam cycle efficiency, reducing the
amount of coal required thus lowering carbon dioxide and NOx emission per megawatt (Alstom,
2012).
Hydropower
Hydropower facilities in Malaysia are more than energy producing centers. Hydropower
dams are also pivotal in socio-economic development such as irrigation to farmland, providing
ample water supply especially during drought seasons, flood control during the monsoon season
and improvement of crucial river navigation routes. Currently, hydropower is the only renewable
energy that is commercially available on a large scale in Malaysia. The estimated hydropower
resource and potential is around 29,000 MW (Leo-Moggie, 2002), with only 2,091 MW being
utilized as of 2008 (NEB, 2009).
This low number is due to the very high capital investment and the issue of controversial
encroachment into native land. However, through governmental policy such as SCORE,
development of hydropower stations in Sarawak is projected to increase to 3500 MW by 2015
with the completion of the Bakun Dam and to 20 GW by 2030 (Aqua Media, 2010). The Bakun
15
Dam is one of the largest in South East Asia with a 207-m-high rock filled concrete dam creating
a 70,000-hectare reservoir (roughly the size of Singapore). This project was downsized a few
times and completion was delayed due to the Asian financial crisis and disputes with the native
tribes on the building site. Despite these setbacks, the Bakun Dam will supply 2400 MW to the
national grid and further projects are planned to begin upstream.
Renewable Energy Initiatives
Five-Fuel Diversification Policy and other energy policies
The Malaysian fuel diversification policy is reviewed on a regular basis to avoid
dependency on a single source of energy. The latest version of this policy was in 1999 in which
the Five-Fuel Diversification Policy was introduced to include renewable energy as the fifth fuel
in the supply mix with the target to contribute 5% of the demand by 2005. Under the Third
Outline Perspective Plan (OPP) for 2001-2010 and the 8th Malaysia Plan (2001-2005), the focus
was to encourage the utilization of renewable resources such as biomass, solar and mini-
hydroelectric stations to generate electricity. Under this plan, the Small Renewable Energy
Power (SREP) program was launched to encourage private sectors to invest in small power
generation projects utilizing biomass, biogas, mini-hydroelectric, solar and wind energy (Second
National Communication to the UNFCC, 2010).
As of February 2010, a total of 43 projects were approved under SREP generating a
capacity of roughly 290 MW of grid-connected power (Energy Commission, 2010). By 2005, the
target of 5% was not met, where renewable energy only accounted for 0.3% of the total
electricity supplied to the country. Relatively cheap fuel prices and low private investment into
16
renewable energy initiatives were seen to be the main factors in this low number. Under the 9th
Malaysia Plan, the establishment of the Ministry of Energy, Green Technology and Water to
replace the Ministry of Energy, Communications and Multimedia was seen to reflect the
government’s drive to promote greater implementation of green technology and
sustainability. This ministry is responsible in the planning and implementation of green policies
and sustainable initiatives in Malaysia. In 2009, the National Green Policy was introduced with
the objective of steering Malaysia towards energy independence and efficient utilization of
natural resources with minimal impact to the environment.
The National Renewable Energy Policy was also introduced in 2010 as a step to rectify
the failure of achieving the target of 5% renewable energy in the energy mix. This policy was
introduced to enhance the utilization of indigenous renewable energy resources through
increased contributions of renewable energy in the national power generation mix, to facilitate
the growth of the renewable industry, ensuring reasonable renewable energy generation cost and
to create public awareness of the importance of sustainability and clean technology (KETTHA,
2010). The impacts of this policy by 2020 are expected to be seen in a minimum of RM2.1
billion ($0.6 Billion) of external cost to mitigate CO2 emissions (Total avoided 2011-2020 = 42
Mg x RM50/Mg), a minimum of RM19 billion ($6.3 billion) of loan values for renewable energy
projects as new revenue sources for local banks, a minimum RM70 billion ($23 billion) of
renewable energy business revenues generated that will subsequently generate RM1.75 billion
($0.5 billion) in tax to the government and a minimum of 50,000 jobs created to construct,
operate and maintain these renewable energy power plants (Haris, 2010).
17
Under the 10th Malaysian Plan (2011-2015), providing reliable, high quality and cost
effective energy is seen as a way to appeal to new investors thus enhancing the potential of the
key development corridors. Here, the New Energy Policy (2011-2015) will focus on five
strategic pillars to ensure energy security, economic efficiency as well as emphasis on improving
environmental and social standards (EPU, 2010). Sustainability, diversification, flexibility and
emission reduction are goals for the supply of energy that have been mapped out under the
current plan. These goals can be achieved through development of renewable sources such as
biomass, hydroelectric and biofuel (Ahmad, 2010).
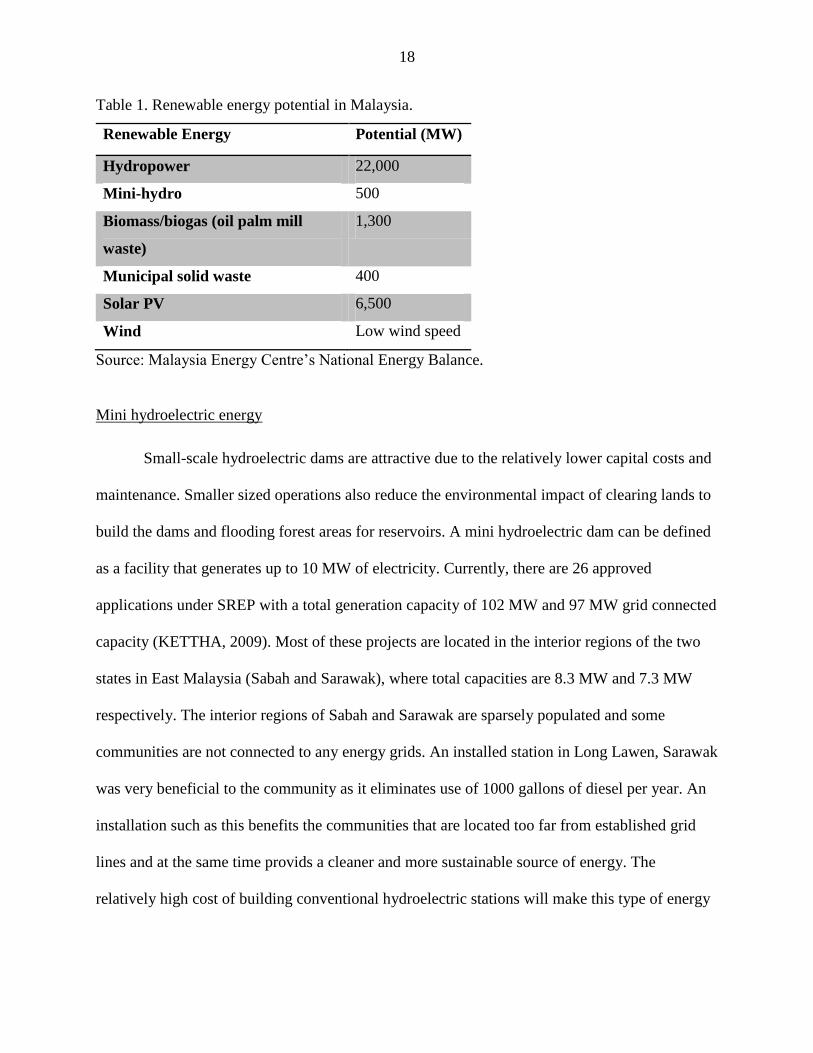
Potential renewable energy sources in Malaysia are summarized in Table 1. Due to the
geographical attributes of Malaysia, large rivers with suitable elevation encourage the
development hydropower facilities. Being close to the equator also provides ample sunlight all
year round that also makes solar power a viable option as a renewable energy source.
Furthermore, being one of the world’s largest exporters of palm oil also provides bountiful
supply of biomass that can be utilized to produce both electricity and fuel. Although Malaysia
ratified the Kyoto protocol in 1999, the country’s status as a non-annex country does not bind the
country to any CO2 emission target. However, with the Five-Fuel Policy, the government is
looking into the development of sustainable clean fuel to not only secure energy independence
but also to maximize available natural resources.
18
Table 1. Renewable energy potential in Malaysia.
Renewable Energy Potential (MW)
Hydropower 22,000
Mini-hydro 500
Biomass/biogas (oil palm mill
waste)
1,300
Municipal solid waste 400
Solar PV 6,500
Wind Low wind speed
Source: Malaysia Energy Centre’s National Energy Balance.
Mini hydroelectric energy
Small-scale hydroelectric dams are attractive due to the relatively lower capital costs and
maintenance. Smaller sized operations also reduce the environmental impact of clearing lands to
build the dams and flooding forest areas for reservoirs. A mini hydroelectric dam can be defined
as a facility that generates up to 10 MW of electricity. Currently, there are 26 approved
applications under SREP with a total generation capacity of 102 MW and 97 MW grid connected
capacity (KETTHA, 2009). Most of these projects are located in the interior regions of the two
states in East Malaysia (Sabah and Sarawak), where total capacities are 8.3 MW and 7.3 MW
respectively. The interior regions of Sabah and Sarawak are sparsely populated and some
communities are not connected to any energy grids. An installed station in Long Lawen, Sarawak
was very beneficial to the community as it eliminates use of 1000 gallons of diesel per year. An
installation such as this benefits the communities that are located too far from established grid
lines and at the same time provids a cleaner and more sustainable source of energy. The
relatively high cost of building conventional hydroelectric stations will make this type of energy
19
source more viable for these states and the targeted installed capacity from mini hydroelectric
stations is 490 MW by 2020 (Khalib, 2010).
Solar
The daily average solar insulation in Malaysia is about 5.5 kWh/m2 or 15 MJ/m2 (Oh et
al. 2010). Solar power in Malaysia through photovoltaic (PV) system is estimated to be four
times the world fossil fuel resources (Kadir and Rafeeu, 2010). August and November are
months with the highest solar radiation of 6.8 kWh/m2, and the lowest is in December with 0.6
kWh/m2. The states in the northern region of peninsular Malaysia and several places in East
Malaysia have high solar radiation throughout the year. Similar to mini-hydroelectric stations,
PV-powered systems can supply electricity to off the grid communities as well. Current
application of PV systems is concentrated for domestic household uses to heat water only. Due to
the very high cost to produce mass generation of electricity from PV systems and the fact that all
the materials are imported from Japan, the commercial supply is not feasible yet. Currently, the
majority of the PV heater system users are those from the higher income group, which is a very
small percentage to the general population.
To generate more involvement from the private sector to invest in PV systems, in 2005,
the government introduced the Malaysia Building Integrated Photovoltaic (MBIPV) project
through funds from the United Nations Development Program (UNDP/GEF). The objective of
the project is to lower the cost of systems through wider application of MBIV systems and the
adoption of supportive regulatory frameworks to establish a sustainable BIPV market (Chen,
2009). After a five-year period, the cost of BIPV systems was reduced from RM28/kWp
(kilowatt-peak) ($8.4/kWp) in 2005 to RM19/kWp ($6.1/kWp) in 2010 (Oh et al., 2010). The
20
government also introduced SURIA 1000 in 2007 as a step to further develop the BIPV market,
with special emphasis to provide the opportunity to the public and industrial sector to be directly
involved in environmental and renewable energy initiatives. In this project, limited numbers of
grid-connected PV systems are put up for auction, where the winning bidders will be allowed to
install the PV system on their premises at a subsidized price. Under this program, a 5 kWp BIPV
system costs about RM135,000 ($37,500) and to date the installations only totaled up to a
marginal 0.4 MW of the total energy mix.
Biomass
The main focus of the National Energy Policy was to highlight the importance of shifting
towards renewable resources that have the least amount of impact to the environment. Under
these terms, biomass became a very attractive and viable option. Due to favorable climatic
conditions and an economy that is still reliant on some form of mass agriculture, there is an
abundant supply of feedstock ready for utilization. Malaysia’s major agricultural crops are
rubber (39.7%), oil palm (34.6%), rice (12.7%), cocoa (6.8%) and coconut (6.3%) from an
estimated 4.9 million hectares (14.9% of Malaysian land mass) of agricultural land (Basiron,
2007). The main source of biomass will come from the palm oil and paddy plantations, which is
mainly from post-harvest processing waste. Poh and Kong, 2002 estimated the amount of energy
potential from biomass in Malaysia to be about 440 PJ/year (4.4 x 10⁸ GJ) in 1996. From this
number, the total biomass energy potential is about 90 PJ (9 x 10⁷ GJ), of which 80% is from
palm oil waste. Biomass from palm oil solid waste totaled to about 80 million tons (Mg) in 2010
and will rise to 100 million Mg by 2020 (MIGHT, 2011). Currently, the main use of palm oil
biomass is in the form of cogeneration charcoal production, timber drying and electricity
21
generation. Because of the large and constant supply of palm oil biomass as well as the mature
logistical mechanism of the industry, palm oil biomass is seen as a very viable option to be
utilized as feedstock in large-scale power generation (Sulaiman et al., 2011).
For the purpose of power generation, the oil palm industry generates the highest waste
(59.8 million Mg), followed by paddy (2.14 million Mg) and sugar (1.11 million Mg) (UNDP,
2010). Palm oil wastes from post-harvest processing such as empty fruit bunches, fronds and
trunks, fiber and palm kernels are currently being used directly as fuel for the boilers in the mills.
Of the 63 projects approved under the SREP program, 25 projects are generators using palm oil
based waste (Ludin et al., 2004). The government also introduced the BioGen project in 2002
with funds provided by the UNDP totaling to $14.7 million to promote and demonstrate the
potential of utilizing these wastes in grid-connected power generation. Among the incentives
given were favorable bank loans and tax exemptions. Currently, this initiative has generated a
total of 700 MW of electricity for several oil mills around Malaysia (Mustafa et al., 2010). In
2006, Chubu Electric Power in Japan agreed to build two biomass plants in Sabah to generate 10
MW of electricity from palm oil waste. This project is also registered as a CDM (Clean
Development Mechanism) project under the UN to generate CO2 emission credits. The estimated
reduction of CO2 emissions from these two plants is expected to be about 2 million tons in 2012
(Chubu Electric Power, 2006). Recently, an agreement was signed with Envergent Technologies
to convert palm oil biomass into renewable heat and electricity. This facility will be operational
in 2013. Energy generation is not limited to palm oil biomass utilization exclusively and this
trend is also seen in countries throughout South East Asia. Producers of wood and agricultural
products such as sugar, rice and lumber in most of these countries have been relying on biomass
22
to supplement their energy requirement. This is due to the large amount of residues generated,
which is in the range of 20 to 70% of raw material input (Lacrosse and Shakya, 2004).
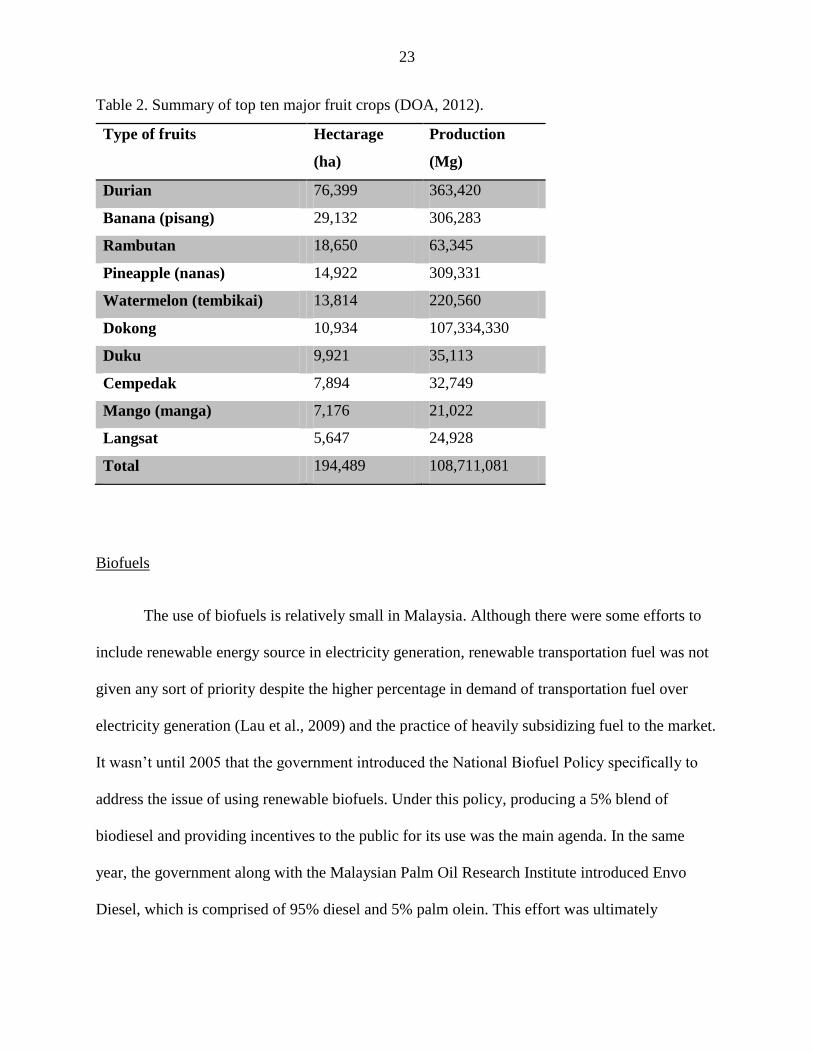
In this regard, fruit crops can also be viewed as a potential biomass resource stream.
According to the latest Malaysian fruit crop statistic report (DOA, 2012), the total production for
the year 2011 was 1.6 million Mg acquired from a total crop hectarage of about 230,000 ha. The
Department of Agriculture (DOA) and the Federal Agricultural Marketing Authority (FAMA)
are two state agencies that provide technical resource, marketing and logistical support to local
fruit producers. Table 2 summarizes the top ten major fruit crops planted in Malaysia. In the top
three of the ranking, durian and rambutan are seasonal fruits and are susceptible to market price
fluctuations especially during supply glut. Value added product diversification is seen as a
method to increase farmers’ income and overcome oversupply of fresh fruits. Conversion of
waste stream from these post-harvest processing outlets into renewable energy or products is an
attractive proposition, especially when this can also bring monetary benefits to the stakeholders.
Although this amount is considerably smaller than the other major agricultural crops, the existing
structure and mechanism is able to support bioconversion processing activities. DOA and FAMA
serve as collection depots with stations across Malaysia and in some stations, processing of value
added products is also carried out. Waste streams from both the processing facilities as well as
culls from the marketing activities can easily be channeled to potential bioconversion facilities.
Inline with the construction of newer and cleaner coal plants that are capable of co-firing with
non-coal sources, biomass waste streams from these agricultural activities can be used to
generate cleaner electricity and reduce coal imports as well.
23
Table 2. Summary of top ten major fruit crops (DOA, 2012).
Type of fruits Hectarage
(ha)
Production
(Mg)
Durian 76,399 363,420
Banana (pisang) 29,132 306,283
Rambutan 18,650 63,345
Pineapple (nanas) 14,922 309,331
Watermelon (tembikai) 13,814 220,560
Dokong 10,934 107,334,330
Duku 9,921 35,113
Cempedak 7,894 32,749
Mango (manga) 7,176 21,022
Langsat 5,647 24,928
Total 194,489 108,711,081
Biofuels
The use of biofuels is relatively small in Malaysia. Although there were some efforts to
include renewable energy source in electricity generation, renewable transportation fuel was not
given any sort of priority despite the higher percentage in demand of transportation fuel over
electricity generation (Lau et al., 2009) and the practice of heavily subsidizing fuel to the market.
It wasn’t until 2005 that the government introduced the National Biofuel Policy specifically to
address the issue of using renewable biofuels. Under this policy, producing a 5% blend of
biodiesel and providing incentives to the public for its use was the main agenda. In the same
year, the government along with the Malaysian Palm Oil Research Institute introduced Envo
Diesel, which is comprised of 95% diesel and 5% palm olein. This effort was ultimately
24
unsuccessful due to very cheap oil prices and relatively high price of palm oil. There were also
issues with the blend clogging up engines, low public interest and unclear policy and directive by
the government (Oh et al., 2010). In an effort to improve its performance, the Envo Diesel was
replaced with the B5, a palm based methyl ester variant in 2006 and the mandate for it to be used
in all government diesel vehicles by February 2009. It was targeted that 70,000 Mg of this B5
diesel to be used by government vehicles annually.
Despite the advancement in second generation and advanced biofuel conversion
techniques, and the high potential of utilizing the abundance of feedstock, there is currently no
large-scale production of any type of biofuels in Malaysia. However, in 2005 a Dutch-based
company, BTG-BTL, constructed a 2 Mg/h demonstration plant in Kluang, Johor to pyrolyze
waste from palm oil mills or empty fruit bunch (EPB). The bio-oil produced is then co-fired in a
waste disposal system to replace diesel (BTG-BTL, 2013). The potential of utilizing the various
types of biomass as feedstock is very attractive and there are many conversion pathways
available that can be tailored to suit the needs and the resources that are available in each region
in Malaysia. Palm wastes in East Malaysia and some parts of the Peninsular can be utilized to
produce bio-ethanol or drop-in fuels as well as using higher lignin compound of paddy waste for
thermochemical conversion into bio-oils. In terms of biofuel production from palm oil biomass,
production of useful sugars such as glucose and xylose from empty fruit bunch (EFB) is possible
(Rahman et al, 2006; Lim et al., 1997). These sugars can then be converted into bio-ethanol and
blended into regular gasoline.
The price of using an E10 blend was estimated to be RM1.37 / liter ($0.45 / liter) based
on gasoline price of RM 1.35 / liter ($0.44 / liter) and the cost price of bioethanol at RM1.50 /
25
liter ($0.50 / liter) (DECP, 2005). Although oil prices have changed a lot since, the fact that
Malaysia heavily subsidizes its fuel for public consumption makes blending with a slightly
higher costing biofuel a feasible option to reduce its subsidizing bill.
Conclusions
Despite still being a net exporter of oil and with new oilfields being discovered and
developed, the incentives for Malaysia to seek renewable and sustainable options are compelling.
The annual cost of subsidizing fuel for public consumption amounts to about RM40 billion ($13
billion) in 2007 (Shuit et al., 2009). High fuel prices adversely affect food prices and other local
macroeconomic elements and the government must seek better options in order to quell growing
public discontent. Although ratifying the Kyoto accord as a non-annex country, there is still an
obligation to reduce CO2 emissions and to prepare its infrastructure for carbon trading with
countries such as Japan, China and Australia. However, the overall future outlook of renewable
energy seems uncertain, at least as far as governmental policies are concerned. While some
policies seem to be very beneficial especially to the population in the interior regions, the overall
outlook of these policies can be seen to have minimal impact. Sulaiman et al., 2011 highlighted
the need for the government to take a more aggressive stance through incentives and encouraging
joint efforts between governmental agencies and private institutions.
The current Malaysia plan (Tenth Malaysia Plan, 2011-2015) is targeting to increase
renewable energy contribution to the electricity generation mix to 5.5%. This is a mere 0.5%
increase from the previous plan and, looking closer at the mix, the decision to turn to coal when
it is less environmental friendly seems to be a paradox against the objective of reducing
emissions, as well as undermining energy security by relying on imported coal. The development
26
of renewable resources in line with the guidelines of the current Malaysia plan can be seen as a
step in the right direction, albeit a more aggressive stance in terms of developing potential
renewable resources such as biomass. Implementation of biomass utilization methods can be
facilitated by the existing framework within relevant governmental agencies such as FAMA,
DOA, MARDI (Malaysian Agricultural Research and Development Institute) and PORIM (Palm
Oil Research Institute Malaysia).
References
Ahmad, N, 2010. New Energy Policy and direction in the 10th Malaysian Plan. Energy Forum,
9th August 2010.
Alstom Power, 2012. Case study, Steam power solutions. Tanjung Bin, Malaysia.
http://www.alstom.com/Global/Power/Resources/Documents/Brochures/tanjung-bin-
malaysia-ultra-supercritical-coal-fired-power-plant.pdf. Accessed on 5-28-2013.
APEC energy demand and supply outlook. 4th edition, 2009. Asia-Pasific Energy Research
Center (APERC). http://www.ieej.or.jp/aperc/2006pdf/Outlook2006//ER_Malaysia.pdf.
Aqua Media, International, 2010. Asia’s achievements and challenges. In: Third International
Conference on Water Resources and Renewable Energy Development.
Basiron Y., 2007. The palm oil advantage in biofuel. Available from: www.mpoc.org.my.
BTG-BTL, 2013. Demonstration plant in Malaysia (2 t/hr plant). http://www.btg-
btl.com/index.php?id=28&rid=18&r=technology&PHPSESSID=vncde63ncpnbc5100shi
amjau6. Accessed 5-28-2013.
Chen W.N., 2009. Malaysia building integrated photovoltaic project report. Selangor, Malaysia:
MBIPV.
Chubu Electric Power, 2006. Chubu Electric Power to engage in Malaysian project to generate
power from oil palm empty fruit bunch biomass – first Chubu Electric Power project in
Malaysia. See also: http://www.chuden.co.jp/english/corporate/press2006/0728_1.html.
DECP (Malaysia-Danish Environment Cooperation Program), 2005. Technical and economic
potential of bio-diesel and bio-ethanol. Available from:
http://eib.org.my/upload/files/Report%25206%2520%2520and%2520bioethanol.doc
27
Department of Agriculture (DOA) Peninsular Malaysia, 2012. Fruit crop statistic, Malaysia. BK
99/09.10/250.
Dittrick P., 2012. Canada approves CNOOC, Petronas acquisitions. Oil and Gas Journal.
http://www.ogj.com/articles/print/vol-110/issue-12b/general-interest/canada-approves-
cnooc-petronas-acquisitions.html. Accessed on 5-23-2013.
Economic Planning Unit (EPU), Prime Minister’s Department Malaysia, 2010. 10th Malaysian
Plan (2011-2015) Chapter 3. http://www.epu.gov.my/epu-
theme/RMKE10/img/pdf/en/chapt3.pdf. Accessed on 5-28-2013.
EIA (U.S. Energy Information Administration), 2011.
http://www.eia.gov/countries/cab.cfm?fips=MY
Energy Commision, 2010. Renewable energy option and smart grid. Malaysia: Green Building
Congress.
EPU (Economic Planning Unit Malaysia), 2006. Ninth Malaysia Plan 2006–2010, PNMB, Kuala
Lumpur.
Gan P. Y. and Li Z., 2008. An econometric study on long-term energy outlook and the
implications of renewable energy utilization in Malaysia. Energy Policy 36: 890-899.
Haris A.H., 2010. Industrial briefing on feed-in tariff procedures. Industrial Briefing on Feed-in
Tariff Procedures.
Kadir M.Z.A.A. and Rafeeu Y.A., 2010. Review on factors for maximizing solar fraction under
wet climate environment in Malaysia. Renewable & Sustainable Energy Reviews:
10.1016/j.rser.2010.04.009.
Khalib M.N., 2010. Tenaga Nasional to restore 26 mini hydro plants by mid-2011. Available
from: http://www.rechargenews.com/energy/wave_tidal_hydro/article216731.ece.
Lacrosse L. and Shakya S.K., 2004. Clean and efficient biomass cogeneration technology
ASEAN. Power-Gen Asia conference and exhibition. 5-7 October, Bangkok, Thailand.
Lau L. C., Tan K. T., Lee K. T. and Mohamed A. R. A., 2009. Comparative study on the energy
policies in Japan and Malaysia in fulfilling their nations’ obligations towards the Kyoto
Protocol. Energy Policy 37:4771–8.
Leo-Moggie A., 2002. Keynote address. Eighth APEC coal flow seminar/nineth APEC clean
fossil energy technical seminar/fourth APEC coal trade investment liberalization and
facilitation workshop, 2002. Kuala Lumpur, Malaysia.
Lim K.O., Faridah Hanum A. and Malar Vizhi S., 1997. A note on the conversion of oil-palm
trunk to glucose via acid hydrolysis. Bioresource Technol, 59: 33-35.
28
Ludin N.A., Bakri M.A., Hashim M., Sawilla B., Menon N.R. and Mokhtar H., 2004. Palm oil
biomass for electricity generation in Malaysia. Pusat Tenaga Malaysia, Malaysia Palm
Oil Board, SIRIM Berhad. See also:
http://www.biogen.org.my/bris/BioGen/Tech/(d)Documents/technology(d)7.pdf.
Malaysian Industry-Government Group for High Technology (MIGHT), 2011. National biomass
strategy 2020: New wealth creation for Malaysia’s palm oil industry.
Ministry of Energy Green Technology and Water (KETTHA), 2009. National Green Technology
Policy, Malaysia: Ministry of Energy, Green Technology and Water.
Ministry of Energy, Water and Communication (KETHHA), 2010. National renewable energy
policy 2010 and action plan. Kuala Lumpur: Ministry of Energy, Water and
Communication.
MoE (Ministry of Natural Resources and Environment Malaysia), 2010. Second National
Communication to the UNFCCC.
MoF (Ministry of Finance Malaysia), 2000. Budget 2001. Appendix 21,
http://www.treassury.gov.my
Mustapa S.I., Leong Y.P. and Hashim A.H., 2010. Issues and challenges of renewable energy
development: a Malaysian experience. In: PEA-AIT international conference on energy
and sustainable development: issues and strategies.
NEB, 2009. National Energy Balance 2008. Selangor, Malaysia: Malaysia Energy Centre.
Oh T.H., Pang S.Y. and Chua S.C., 2010. Energy policy and alternative energy in Malaysia:
issues and challenges for sustainable growth. Renewable & Sustainable Energy Reviews;
14(4): 1241–52.
Poh K.M. and Kong H.W., 2002. Renewable energy in Malaysia: a policy analysis. Energy for
Sustainable Development; VI(3).
Rahman S.H.A., Choudhury J.P. and Ahmad A.L., 2006. Production of xylose from oil palm
empty fruit bunch fiber using sulfuric acid. Biochem Eng J, 30: 97-103.
Sarawak Corridor of Renewable Energy (SCORE), 2011.
http://www.spu.sarawak.gov.my/score_industries.html
Second National Communication to the UNFCCC, 2010. Ministry of Natural Resources and
Environment Malaysia.
Shuit S.H., Tan K.T., Lee K.T. and Kamaruddin A.H., 2009. Oil Palm biomass as a sustainable
energy source: a Malaysian case study. Energy; 34:1225–35.
29
Sulaiman F., Abdullah N., Gerhauser H. and Shariff A., 2011. An outlook of Malaysian energy,
oil palm industry and its utilization of wastes as useful resources. Biomass and
Bioenergy, 35: 3775-3786
Thaddeus J, 2002. Complementary roles of natural gas and coal in Malaysia, in Eighth APEC
coal flow seminar/ninth APEC Clean fossil energy technical seminar/fourth APEC coal
trade, investment, liberalization and facilitation workshop. Kuala Lumpur, Malaysia.
UNDP (United Nations Development Programme), 2010. Malaysia generating renewable energy
from palm oil wastes; 2007. Available from:
http://www.undp.org.my/uploads/Renewable Energy Palm Oil Wastes.pdf
30
CHAPTER 3. DETERMINATION OF A SUITABLE AIR OVEN MOISTURE CONTENT
TEST METHOD FOR DURIAN WASTE
A paper to be submitted to The Journal of Biomass and Bioenergy
Ahmad Bujang1,2, Carl Bern2, Thomas Brumm2
Abstract
An accurate and reliable method of determining moisture content is integral to ensure
viable and efficient thermochemical conversion of biomass. Utilization of new biomass waste
streams such as durian biomass can be aided by a standardized method will also eliminate
confusion and discrepancies. Existing oven-drying methods established for corn residues and
other feedstock were compared with Karl Fisher moisture test. Clarification of the results was
further explored by testing different drying temperatures, drying time and sample preparation
methods. From the experiment, the HORT 2 method was found to be the easiest and simplest
method with the highest accuracy. Depending on the process optimization requirements, the
levels of the treatment factors can be adjusted to produce accurate results. Ground samples dried
for 2 h (at 60C, 80C, 103C, 135C), whole rinds dried at 103ºC (48 h) or 135ºC (24 h) were
found to most accurately measure moisture content.
Introduction
As prescribed in the New Energy Policy (2011-2015) under the 10th Malaysian Plan
(2011-2015), identifying new energy feedstock is vital to the efforts of diversifying energy
1 Author, Malaysian Agricultural Research and Development Institute (MARDI). 2 Agricultural and Biosystems Engineering, Iowa State University.
31
resources. Other than oil palm residues, fruit crop biomass has the potential to be utilized using
the pathways established in the utilization of other biomass such as corn residues, hardwoods as
well as palm oil residues. With total production of 1.6 million Mg from total crop hectarage of
about 230,000 ha in 2011 (DOA, 2012), the role of fruit crop utilization is more in the view of
socio-economic impact that goes beyond the fulfilment of national policy by potentially
increasing the income of farmers and mitigating the effects of oversupply during peak/glut
periods. Durian is one of the major fruit crops cultivated in Malaysia, and according to the latest
consensus by the DOA (2012), total durian production amounts to about 360,000 Mg from a total
plantation area of about 76,000 ha. With growing development of value added products,
postharvest waste and residues are projected to increase and thereby benefit efforts of renewable
energy utilization. Since the edible portion of the fruit only accounts for about 15-30% of the
entire weight of the fruit (Brown, 1997), conversion of waste streams from these post-harvest
processing outlets into renewable energy or products is an attractive proposition that can
potentially bring monetary benefits to the stakeholders. In order to achieve this goal,
understanding the physical and chemical characteristic of fruit crop waste is essential.
Moisture content of the feedstock or raw material is an integral attribute in any biomass
utilization pathway, whether it is through thermochemical or biochemical conversion. Due to the
heterogeneous nature of biomass, its physical characteristics including moisture content vary
greatly. Moisture content affects the price, combustion optimization, storage management as well
as the handling properties of a particular biomass (Mattsson, 1990; Evald and Jacobsen, 1993;
Jensen et al., 2004; Jirjis, 2005). Kaltschmitt and Hein, 2005 also concluded that within an entire
solid biofuel (biomass) supply chain, moisture content is a primary property that ensures
successful utilization and this encompasses the transportation cost, storage management, calorific
32
value and conversion at end use. Available moisture determination methods such as oven drying
method and the Karl Fisher moisture test are commonly used for biological materials. However,
both methods have unique relative benefits and disadvantages.
Previous studies on comparison and evaluation between methods of moisture
determination have been carried out for rice (Chen, 2003), distillers dried grain with solubles
(Thiex, 2009, Ileleji, 2010) and animal feed (Thiex and Richardson, 2003). Chen compared six
oven methods and concluded that precise measurement is dependent on drying time and
temperature, where adequate drying time and temperature are needed to drive off all moisture to
give precise measurement. But at the same time high temperature can also drive off volatiles that
may corrupt the results. Similarly, when comparing different oven methods with reference to the
Karl Fisher test, Theix(2009), concluded that the procedure with the least variation to the
reference indicated the best method to drive off the moisture and ensure none or very minimal
volatile loss. Theix also found that the Karl Fisher test was the most accurate, however the labor
(time and training) as well as the cost of instruments and reagents makes this method less
accessible for implementation in industry. The Karl Fisher method should also be used as the
primary method to evaluate all oven drying methods before they are applied for practice (Thiex
and Richardson, 2003).
Therefore selection of a suitable method that is both reproducible and easy to implement
is crucial especially for a non-established feedstock such as durian biomass. Due to the lack of a
specified and standardized moisture determination test for durian as well as for other tropical
fruit waste, identification of the best suitable method for durian can also be subsequently
referenced and implemented for other fruit waste as well.
33
The objective of this experiment was to identify a suitable method for moisture content
determination of durian waste (rind). This is done through two phases, where phase one is the
comparison of existing methods of oven drying with reference to a Karl Fischer method. Phase
two consists of the evaluation of moisture content measurement through drying at different
temperatures and drying times. The results from this drying test are also compared to a reference
Karl Fisher test.
Materials and methods
Material
Due to the unavailability of raw Malaysian durian in the United States, frozen durian fruit
imported from Thailand were obtained from the local Asian market in Ames, Iowa. The specific
name of the durian cultivar used in this experiment is Mon Thong or Golden Pillow (Durio
zibethinus Murray). These fruits were harvested before maturity and post-harvest ripening was
carried out in storage at room temperature. Once ripe, the fruits were frozen at -40C (-40F).
Then each fruit was individually placed in plastic netting and packed in corrugated carton boxes.
Each box weighs about 12 kg (25 lb) and contains four to five fruits. The fruits were refrigerated
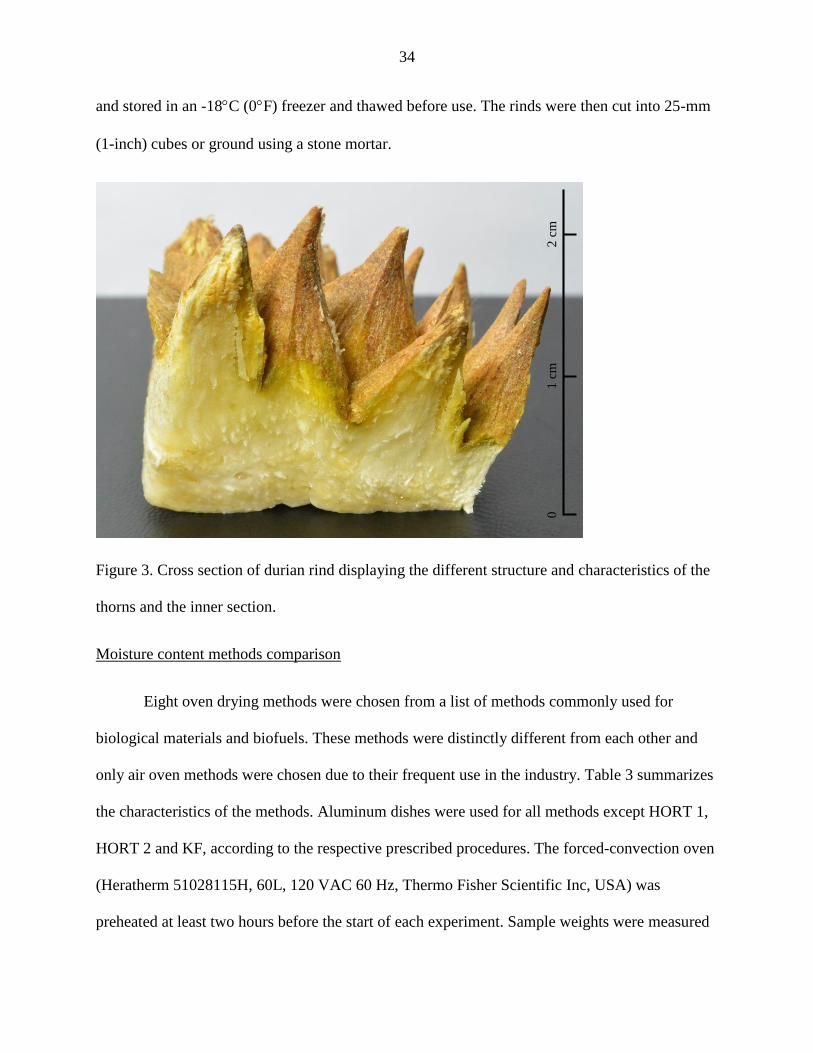
at -18C (0F) during transport and storage. Figure 3 illustrates the structural form of the rind
and its cross section. The thorns on the rind are significantly harder and studier compared to the
moist and soft inner section.
The materials used in this experiment were rinds collected from the fruits. The frozen
fruits were thawed at room temperature for at least 12 hours before separation of the edible pulp
and the rind was carried out. Separation was done manually using a sturdy cleaver or knife to pry
open the fruit. Once open, the pulp was scooped out by hand and the rinds were then collected
34
and stored in an -18C (0F) freezer and thawed before use. The rinds were then cut into 25-mm
(1-inch) cubes or ground using a stone mortar.
Figure 3. Cross section of durian rind displaying the different structure and characteristics of the
thorns and the inner section.
Moisture content methods comparison
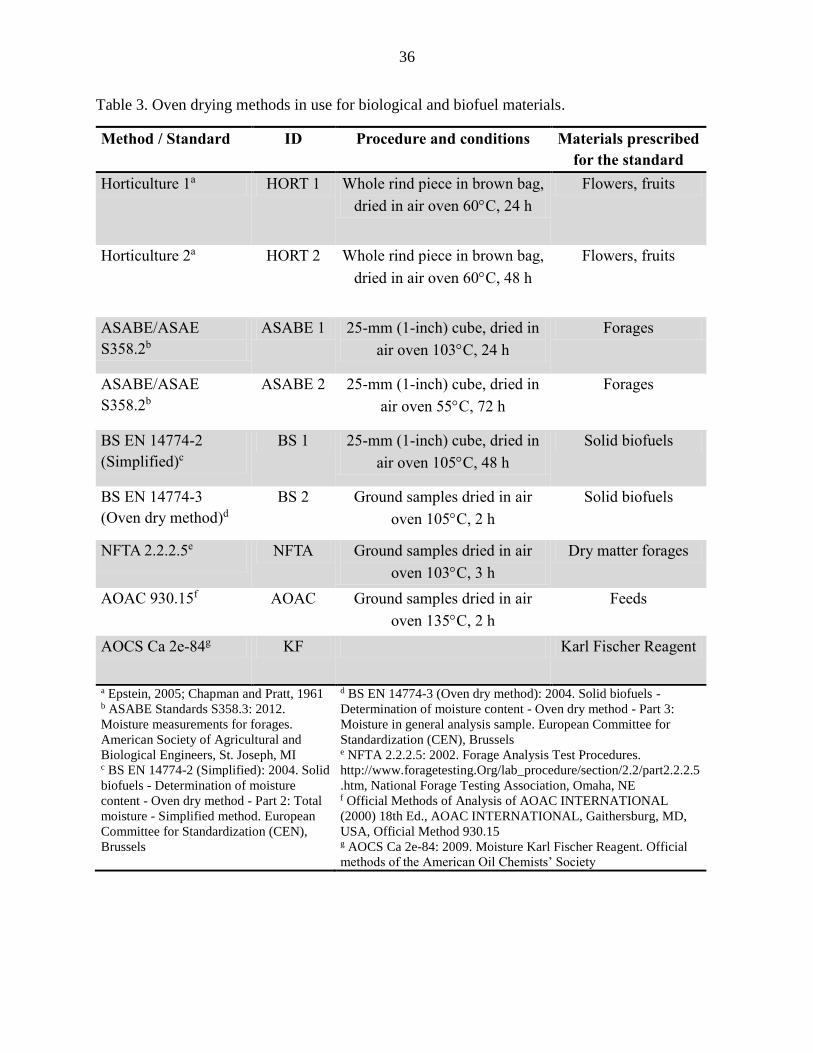
Eight oven drying methods were chosen from a list of methods commonly used for
biological materials and biofuels. These methods were distinctly different from each other and
only air oven methods were chosen due to their frequent use in the industry. Table 3 summarizes
the characteristics of the methods. Aluminum dishes were used for all methods except HORT 1,
HORT 2 and KF, according to the respective prescribed procedures. The forced-convection oven
(Heratherm 51028115H, 60L, 120 VAC 60 Hz, Thermo Fisher Scientific Inc, USA) was
preheated at least two hours before the start of each experiment. Sample weights were measured
1 c
m
2 c
m
0

35
on one of the two digital balances; Denver Instrument DI-4K (0.001g, Denver Instrument,
Bohemia, NY) and Adventurer Pro AV114 (0.0001g, Ohaus Corporation, NJ) according to the
required precision.
36
Table 3. Oven drying methods in use for biological and biofuel materials.
Method / Standard ID Procedure and conditions Materials prescribed
for the standard Horticulture 1a HORT 1 Whole rind piece in brown bag,
dried in air oven 60C, 24 h
Flowers, fruits
Horticulture 2a HORT 2 Whole rind piece in brown bag,
dried in air oven 60C, 48 h
Flowers, fruits
ASABE/ASAE
S358.2b
ASABE 1 25-mm (1-inch) cube, dried in
air oven 103C, 24 h
Forages
ASABE/ASAE
S358.2b
ASABE 2 25-mm (1-inch) cube, dried in
air oven 55C, 72 h
Forages
BS EN 14774-2
(Simplified)c
BS 1 25-mm (1-inch) cube, dried in
air oven 105C, 48 h
Solid biofuels
BS EN 14774-3
(Oven dry method)d
BS 2 Ground samples dried in air
oven 105C, 2 h
Solid biofuels
NFTA 2.2.2.5e NFTA Ground samples dried in air
oven 103C, 3 h
Dry matter forages
AOAC 930.15f AOAC Ground samples dried in air
oven 135C, 2 h
Feeds
AOCS Ca 2e-84g KF Karl Fischer Reagent
a Epstein, 2005; Chapman and Pratt, 1961 b ASABE Standards S358.3: 2012.
Moisture measurements for forages.
American Society of Agricultural and
Biological Engineers, St. Joseph, MI c BS EN 14774-2 (Simplified): 2004. Solid
biofuels - Determination of moisture
content - Oven dry method - Part 2: Total
moisture - Simplified method. European
Committee for Standardization (CEN),
Brussels
d BS EN 14774-3 (Oven dry method): 2004. Solid biofuels -
Determination of moisture content - Oven dry method - Part 3:
Moisture in general analysis sample. European Committee for
Standardization (CEN), Brussels
e NFTA 2.2.2.5: 2002. Forage Analysis Test Procedures.
http://www.foragetesting.Org/lab_procedure/section/2.2/part2.2.2.5
.htm, National Forage Testing Association, Omaha, NE f Official Methods of Analysis of AOAC INTERNATIONAL
(2000) 18th Ed., AOAC INTERNATIONAL, Gaithersburg, MD,
USA, Official Method 930.15 g AOCS Ca 2e-84: 2009. Moisture Karl Fischer Reagent. Official
methods of the American Oil Chemists’ Society
37
Temperature, drying time and form experiment
The effects of temperature, time and sample form were tested and evaluated to obtain
better definition of these effects on moisture content and to quantify their accuracy compared to
the Karl Fisher test. The different levels for each independent variable were chosen based on
values commonly found in other methods. Four levels of temperature (60C, 80C, 103C,
135C), three levels of drying times (2 h, 24 h, 48 h) and three sample preparation methods
(whole, cubed, ground) were chosen in this experiment with three replications each. The oven
and digital scale used in the previous setup were also used in this experiment.
Karl Fischer Moisture Test
Samples for the reference moisture content were sent to the University of Missouri
Agricultural Experiment Station Chemical Laboratories (ESCL) for testing. The AOCS Ca 2e-84
method (AOCS, 2009) was used to determine the moisture content using Karl Fischer reagent.
Statistical Analysis
For the method comparison experiment, each method was replicated three times and one-
way analysis of variance (ANOVA) was used to determine if the methods tested were
statistically different. Analyses were performed in SAS v9.2 (SAS Institute, Cary, NC) using
PROC GLM procedure and the different methods were then compared using Tukey’s
Studentized Range. Karl Fischer method was used as the reference or standard to measure the
accuracy of each oven drying method. Accuracy is quantified by the percent of deviation from
the Karl Fischer method and this is calculated using the formula below (Rosentrater and
Muthukumarappan, 2006):
38
𝑃𝑒𝑟𝑐𝑒𝑛𝑡 𝐷𝑒𝑣𝑖𝑎𝑡𝑖𝑜𝑛, % =𝑀𝐶𝑂𝑣𝑒𝑛 − 𝑀𝐶𝐾𝑎𝑟𝑙 𝐹𝑖𝑠𝑐ℎ𝑒𝑟
𝑀𝐶𝐾𝑎𝑟𝑙 𝐹𝑖𝑠𝑐ℎ𝑒𝑟 × 100
The coefficient of variation, CV was calculated for each method to measure the
repeatability of the procedure. The coefficient of variation for each method is calculated by the
following formula:
𝐶𝑜𝑒𝑓𝑓𝑖𝑐𝑖𝑒𝑛𝑡 𝑜𝑓 𝑉𝑎𝑟𝑖𝑎𝑡𝑖𝑜𝑛, 𝐶𝑉 (%) = 𝑆𝑡𝑎𝑛𝑑𝑎𝑟𝑑 𝐷𝑒𝑣𝑖𝑎𝑡𝑖𝑜𝑛
𝑀𝑒𝑎𝑛 × 100
Statistical analysis for the temperature, time and form experiment was also done on SAS
v9.2 (SAS Institute, Cary, NC). A three-way ANOVA procedure was used to test effects of
temperature, time, and form, as well as the respective interaction of the main effects.
Results and Discussion
Moisture content methods comparison
The results for the comparison of the nine methods used to determine moisture content
are summarized in Table 4 and Figure 4. Overall, the highest measured moisture content was
81.5% (ASABE 1) and the lowest was 57.7% (HORT 1). The coefficient of variation for all
methods was well below 5%, which indicated that the methods provide good repeatability. The
results also indicate that moisture content measured using HORT 2 was found to have the least
percent deviation (0.062%) compared to KF, whereas HORT 1 was the most different with the
highest percent deviation of -22.87. While other methods required drying temperatures of at least
103°C, the drying temperature for HORT 1 and HORT 2 were set at 60°C. The significantly
smaller percent deviation for HORT 2 indicates that low temperature drying is possible but must
be done for a prolonged period, since the drying time for HORT 2 was 24 hours as opposed to 48
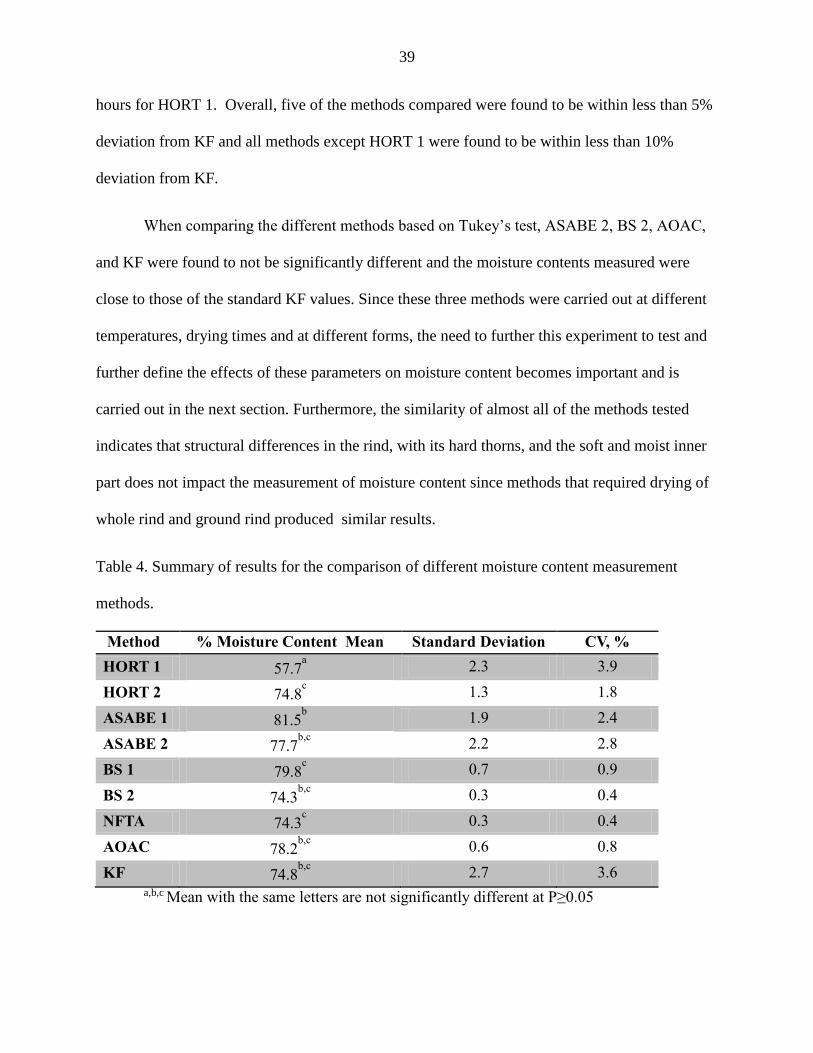
39
hours for HORT 1. Overall, five of the methods compared were found to be within less than 5%
deviation from KF and all methods except HORT 1 were found to be within less than 10%
deviation from KF.
When comparing the different methods based on Tukey’s test, ASABE 2, BS 2, AOAC,
and KF were found to not be significantly different and the moisture contents measured were
close to those of the standard KF values. Since these three methods were carried out at different
temperatures, drying times and at different forms, the need to further this experiment to test and
further define the effects of these parameters on moisture content becomes important and is
carried out in the next section. Furthermore, the similarity of almost all of the methods tested
indicates that structural differences in the rind, with its hard thorns, and the soft and moist inner
part does not impact the measurement of moisture content since methods that required drying of
whole rind and ground rind produced similar results.
Table 4. Summary of results for the comparison of different moisture content measurement
methods.
Method % Moisture Content Mean Standard Deviation CV, %
HORT 1 57.7a 2.3 3.9
HORT 2 74.8c 1.3 1.8
ASABE 1 81.5b 1.9 2.4
ASABE 2 77.7b,c
2.2 2.8
BS 1 79.8c 0.7 0.9
BS 2 74.3b,c
0.3 0.4
NFTA 74.3c 0.3 0.4
AOAC 78.2b,c
0.6 0.8
KF 74.8b,c
2.7 3.6
a,b,c Mean with the same letters are not significantly different at P≥0.05
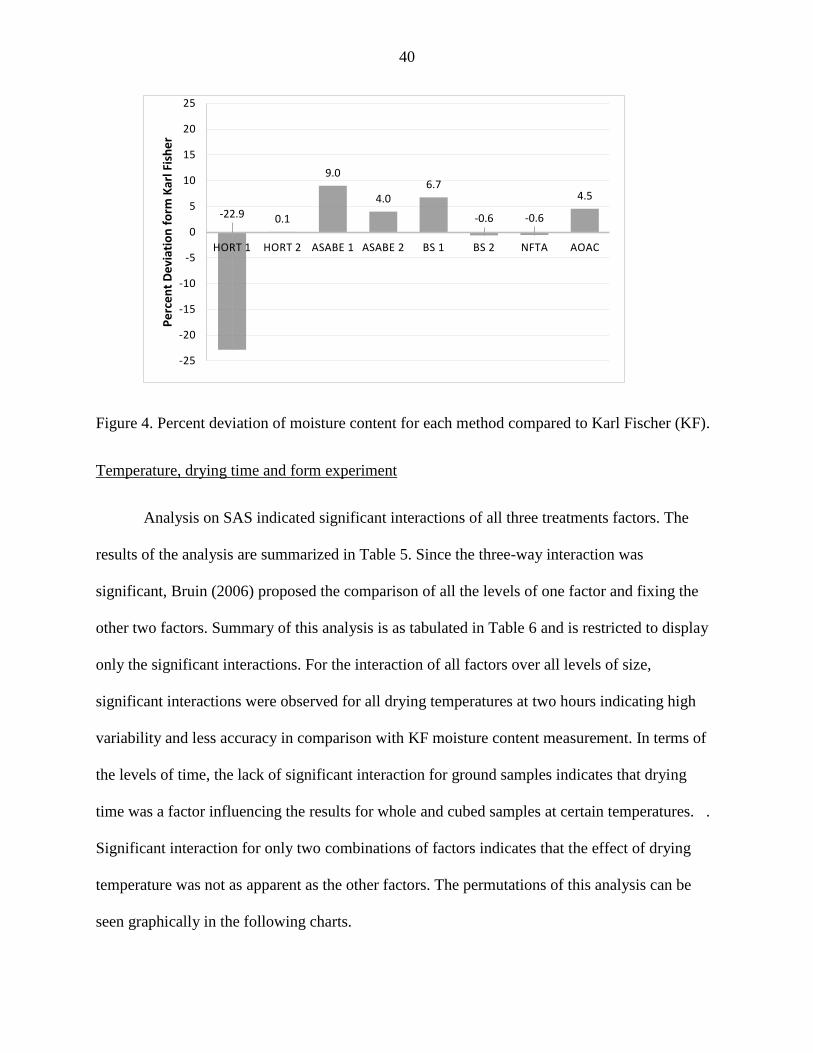
40
Figure 4. Percent deviation of moisture content for each method compared to Karl Fischer (KF).
Temperature, drying time and form experiment
Analysis on SAS indicated significant interactions of all three treatments factors. The
results of the analysis are summarized in Table 5. Since the three-way interaction was
significant, Bruin (2006) proposed the comparison of all the levels of one factor and fixing the
other two factors. Summary of this analysis is as tabulated in Table 6 and is restricted to display
only the significant interactions. For the interaction of all factors over all levels of size,
significant interactions were observed for all drying temperatures at two hours indicating high
variability and less accuracy in comparison with KF moisture content measurement. In terms of
the levels of time, the lack of significant interaction for ground samples indicates that drying
time was a factor influencing the results for whole and cubed samples at certain temperatures. .
Significant interaction for only two combinations of factors indicates that the effect of drying
temperature was not as apparent as the other factors. The permutations of this analysis can be
seen graphically in the following charts.
-22.9 0.1
9.0
4.06.7
-0.6 -0.6
4.5
-25
-20
-15
-10
-5
0
5
10
15
20
25
HORT 1 HORT 2 ASABE 1 ASABE 2 BS 1 BS 2 NFTA AOAC
Pe
rce
nt
De
viat
ion
fo
rm K
arl F
ish
er
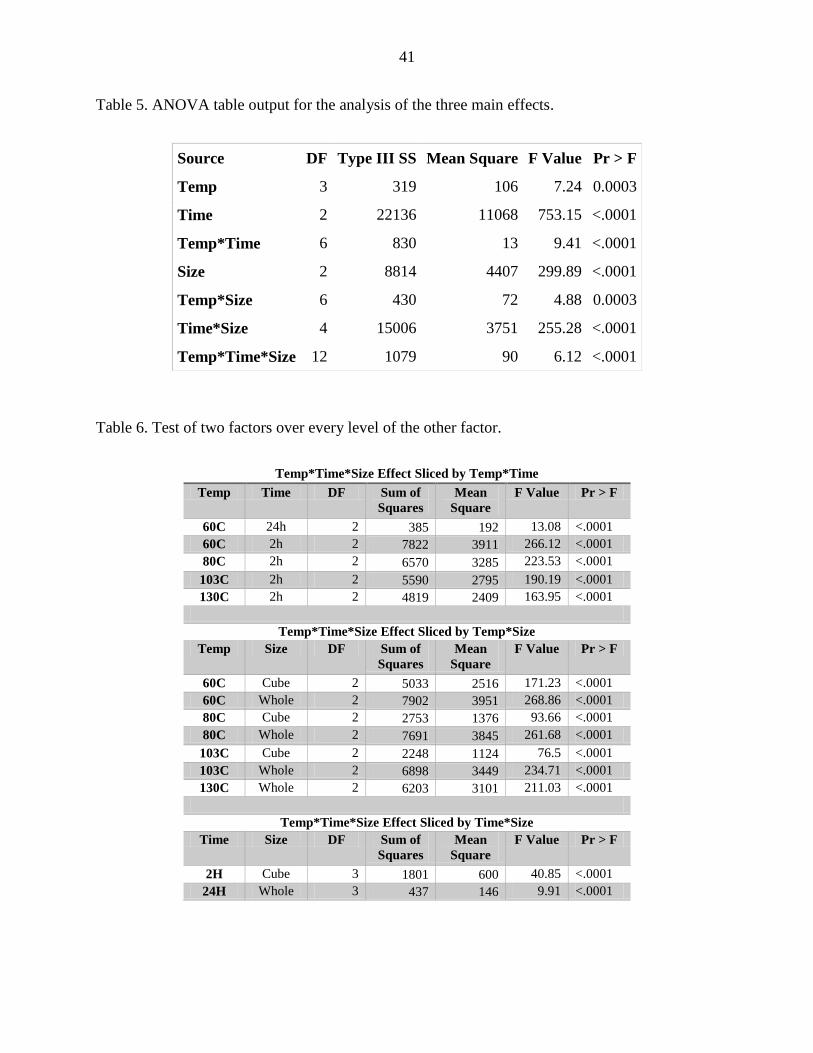
41
Table 5. ANOVA table output for the analysis of the three main effects.
Source DF Type III SS Mean Square F Value Pr > F
Temp 3 319 106 7.24 0.0003
Time 2 22136 11068 753.15 <.0001
Temp*Time 6 830 13 9.41 <.0001
Size 2 8814 4407 299.89 <.0001
Temp*Size 6 430 72 4.88 0.0003
Time*Size 4 15006 3751 255.28 <.0001
Temp*Time*Size 12 1079 90 6.12 <.0001
Table 6. Test of two factors over every level of the other factor.
Temp*Time*Size Effect Sliced by Temp*Time
Temp Time DF Sum of
Squares
Mean
Square
F Value Pr > F
60C 24h 2 385 192 13.08 <.0001
60C 2h 2 7822 3911 266.12 <.0001
80C 2h 2 6570 3285 223.53 <.0001
103C 2h 2 5590 2795 190.19 <.0001
130C 2h 2 4819 2409 163.95 <.0001
Temp*Time*Size Effect Sliced by Temp*Size
Temp Size DF Sum of
Squares
Mean
Square
F Value Pr > F
60C Cube 2 5033 2516 171.23 <.0001
60C Whole 2 7902 3951 268.86 <.0001
80C Cube 2 2753 1376 93.66 <.0001
80C Whole 2 7691 3845 261.68 <.0001
103C Cube 2 2248 1124 76.5 <.0001
103C Whole 2 6898 3449 234.71 <.0001
130C Whole 2 6203 3101 211.03 <.0001
Temp*Time*Size Effect Sliced by Time*Size
Time Size DF Sum of
Squares
Mean
Square
F Value Pr > F
2H Cube 3 1801 600 40.85 <.0001
24H Whole 3 437 146 9.91 <.0001
42
Figure 5 summarizes the results obtained from this experiment and displays the different
distribution of the results based on the type of sample preparation that was carried out. Evidently
from the boxplot in Figure 5, the ground samples were found to have less variation for all drying
times (2, 24, 48 hours) across the different drying temperatures (60⁰C, 80⁰C, 103⁰C, 135⁰C). The
range of the means was 3% moisture content, where the lowest mean was 76% moisture content
and the highest was 80%.
Conversely, the distribution for cubed and whole were significantly more dispersed
compared to the ground samples. For the cubed samples, the range of the means was calculated
to be 14% moisture content. For whole samples, the range was 11% moisture content. Overall,
based on the observation and comparison of the mean moisture contents between the three
boxplots, whole samples have the tendency to under-dry hence the lower means of moisture
content observed as compared to slight over-drying observed for the comparatively higher
collection of moisture content means for the ground samples. Since the cubed samples also
displayed the characteristics of under-drying which is undesirable, for all drying times at
temperatures below 103⁰C, the ground samples were observed to be consistently close to the KF
measurement of 74.8% moisture content.
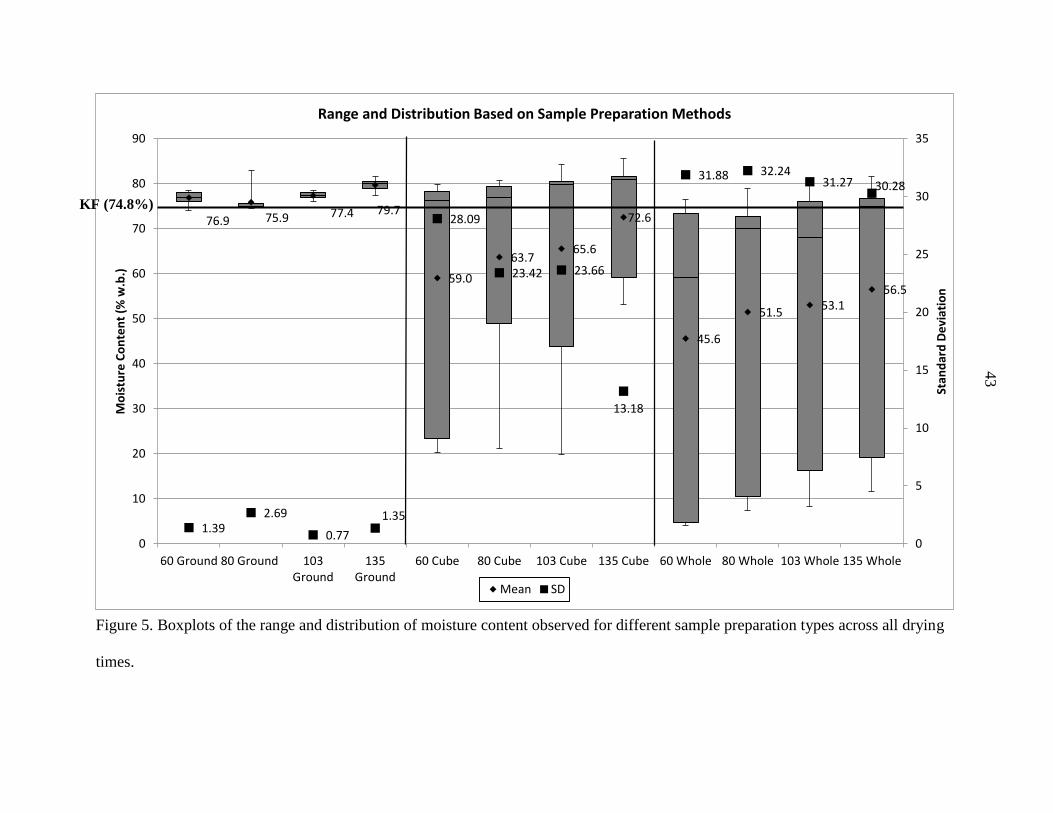
43
76.9 75.9 77.4 79.7
59.0
63.765.6
72.6
45.6
51.553.1
56.5
1.392.69
0.77
1.35
28.09
23.42 23.66
13.18
31.88 32.2431.27 30.28
0
5
10
15
20
25
30
35
0
10
20
30
40
50
60
70
80
90
60 Ground 80 Ground 103Ground
135Ground
60 Cube 80 Cube 103 Cube 135 Cube 60 Whole 80 Whole 103 Whole 135 Whole
Stan
dar
d D
evi
atio
n
Mo
istu
re C
on
ten
t (%
w.b
.)Range and Distribution Based on Sample Preparation Methods
Mean SD
Figure 5. Boxplots of the range and distribution of moisture content observed for different sample preparation types across all drying
times.
KF (74.8%)
44
When comparing the distribution of moisture content with respect to different drying time
considering all sample preparation types, the observed moisture content offers further insight
into the influence of the different treatments used in the experiment. From Figure 6, assessing the
results of 2-hour drying time, the means for all three sample preparation types vary greatly where
the highest calculated mean was 76% moisture content for 2-hour ground samples and 10%
moisture content for whole samples. The range was calculated to be 66% moisture content. For
the 24-hour drying time, the observed variation was less than the 2-hour drying set with a range
of 11% moisture content between the highest mean of 80% moisture content and lowest mean of
69% moisture content. The 48-hour drying time was found to be the most consistent where the
range was calculated to be 3% moisture content.
Based on these observations, a 48-hour time period allows the samples to dry sufficiently
with the caveat of slight over-drying the samples as seen in the upper end of the boxplot
whiskers exceeding 80% moisture content for all sample preparation types. For the 24-hour set,
except for the whole samples, the results observed for ground and cubed samples were almost
equal to the previous set, indicating that whole samples require longer time for sufficient drying
to occur or certain drying temperatures for it to sufficiently dry the samples within a 24-hour
timeframe. Evidently, all ground samples were comparatively consistent for all drying times.
However, the higher moisture content observed in the 24-hour and 48-hour set indicates that
higher temperatures may cause some over-drying.
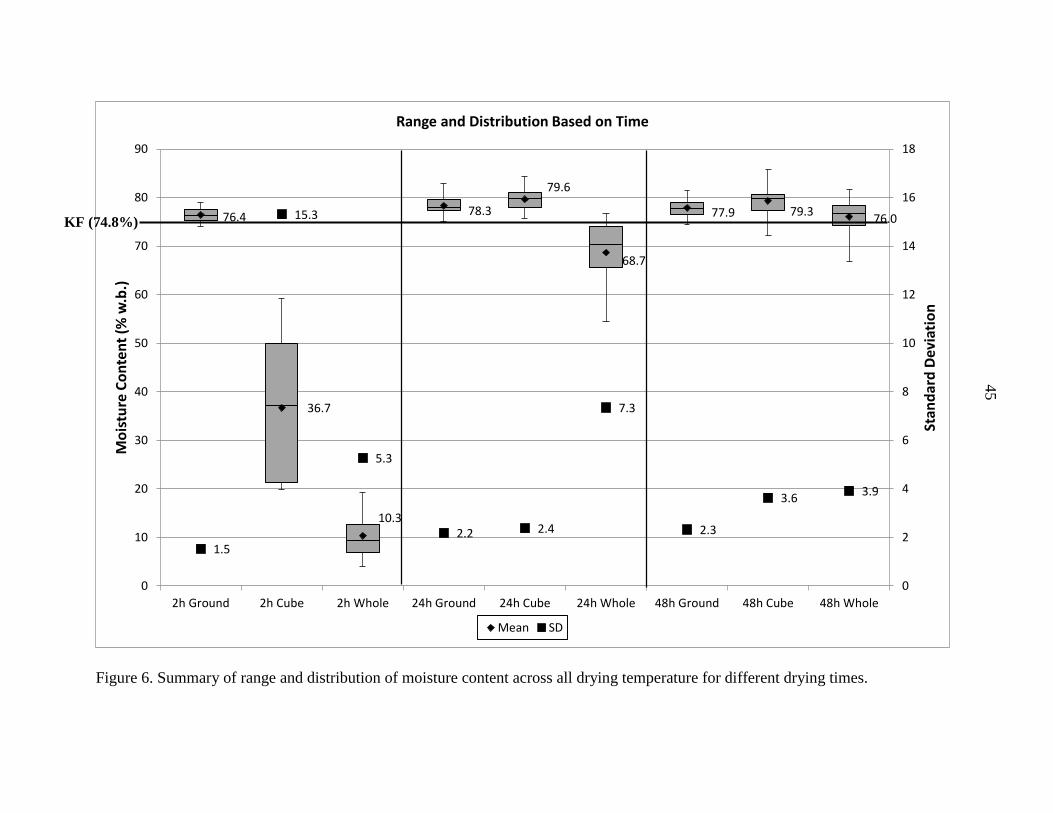
45
76.4
36.7
10.3
78.3
79.6
68.7
77.9 79.376.0
1.5
15.3
5.3
2.2 2.4
7.3
2.3
3.63.9
0
2
4
6
8
10
12
14
16
18
0
10
20
30
40
50
60
70
80
90
2h Ground 2h Cube 2h Whole 24h Ground 24h Cube 24h Whole 48h Ground 48h Cube 48h Whole
Stan
dar
d D
evia
tio
n
Mo
istu
re C
on
ten
t (%
w.b
.)Range and Distribution Based on Time
Mean SD
Figure 6. Summary of range and distribution of moisture content across all drying temperature for different drying times.
KF (74.8%)
46
In terms of the percent deviation of the moisture content measured compared to the
results measured by KF test, further details of the influence of the treatment levels can be seen
more clearly. Referring to Figure 7, although the ground samples seemed to be the best option
based on the observations made from Figure 2 and 3, drying at 135⁰C for 24 hours or more
resulted in a comparatively higher percent deviation compared to other drying temperatures and
times. Cubed samples were observed to have very big deviation for drying time of 2 hours
regardless of the temperature and the least deviation at 60⁰C and 80⁰C for drying times of more
than 24 hours. Drying at 135⁰C for more than 24 hours resulted in higher percent deviation
compared to 103⁰C for drying time more than 24 hours. Similarly, whole samples also have very
big deviations for 2-hour drying periods across all drying temperatures. However, percent
deviation was found to be reduced significantly for drying temperatures of 103⁰C and 135⁰C for
more than 24 hours of drying time. Significantly, percent deviation was the least for the
combination of 103⁰C for 48 hours and 135⁰C for 48 hours.
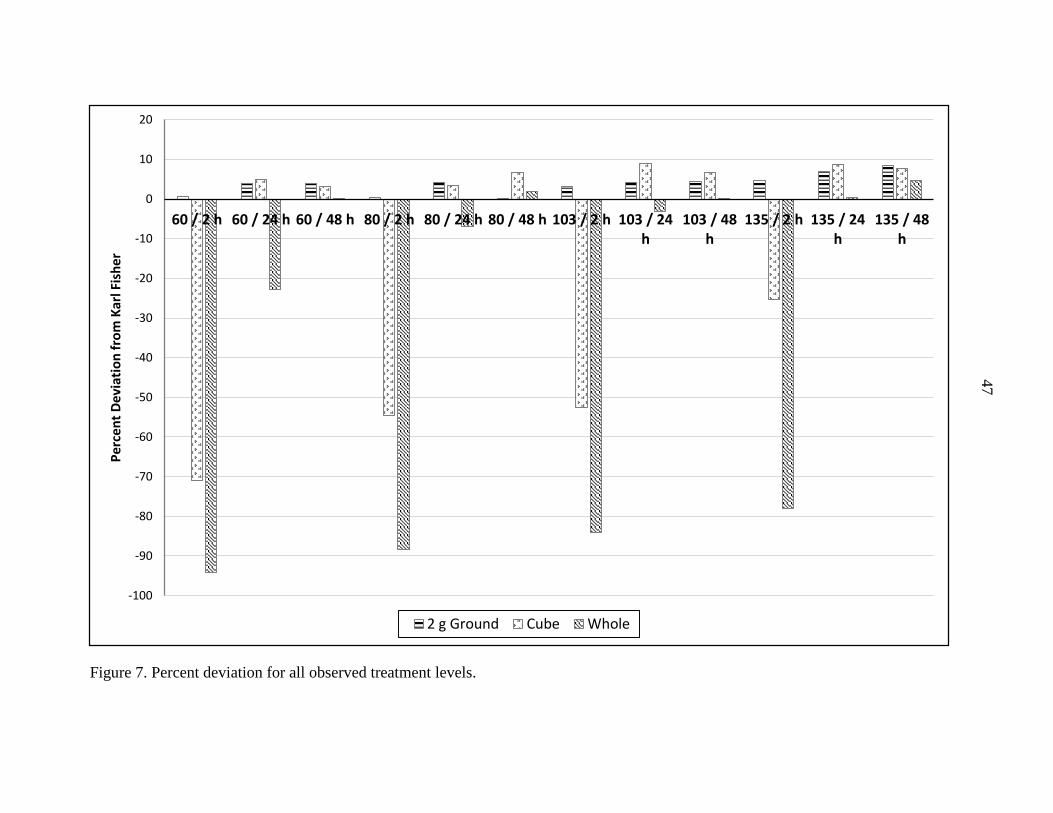
47
Figure 7. Percent deviation for all observed treatment levels.
-100
-90
-80
-70
-60
-50
-40
-30
-20
-10
0
10
20
60 / 2 h 60 / 24 h 60 / 48 h 80 / 2 h 80 / 24 h 80 / 48 h 103 / 2 h 103 / 24h
103 / 48h
135 / 2 h 135 / 24h
135 / 48h
Pe
rce
nt
De
viat
ion
fro
m K
arl F
ish
er
2 g Ground Cube Whole
48
Conclusions
HORT 2, BS 2, and NAFTA were found to be the best recommended methods that are
capable of producing high accuracy of moisture content determination. These methods produced
high reproducibility and the least percent deviation from the standard KF method. Comparison of
these three methods indicates that HORT 2 method can serve as the easiest and simplest of the
three and should be given precedence.
Because whole and cubed samples achieved similar accuracy as ground samples,
suspicion of the thorns projecting different drying attributes compared to the inner parts can be
rejected. Thus, with adequate drying time and temperature, the whole or cubed samples can be
used to simplify processing and handling of the rind during testing.
Based on statistical and graphical analyses, interaction of all three factors was found to be
significantly influencing the measurement of moisture content. Ground samples were found to be
more robust in producing accurate readings at different drying times and temperatures.
Depending on the process optimization needs, ground samples dried for two hours (at 60C,
80C, 103C, 135C) can be applied for high turn-around labs, or if handling of the tough rind is
an issue, then the use of whole rind dried at 103°C for 48 hours or 135°C for 24 hours can be
applied instead.
Acknowledgement
This research was made possible through the research funding granted by the Malaysian
Agricultural Research and Development Institute (MARDI).
49
References
AOCS Ca 2e-84: 2009. Moisture Karl Fischer Reagent. Official methods of the American Oil
Chemists’ Society.
ASABE Standards S358.3: 2012. Moisture measurements for forages. American Society of
Agricultural and Biological Engineers, St. Joseph, MI.
Brown, M.J. 1997. Durio – a bibliographic review. In R.K. Arora, V. Ramanantha Rao and A.N.
Rao (Eds.), International Plant Genetic Resources Institute (IPGRI).
Bruin, J. 2006. Slicing Interactions in SAS. UCLA: Statistical Consulting Group.
http://www.ats.ucla.edu/stat/sas/library/SASSlice_os.htm#Comparing Cell Means. Accessed
on 15th January 2014.
BS EN 14774-2 (Simplified): 2004. Solid biofuels - Determination of moisture content - Oven
dry method - Part 2: Total moisture - Simplified method. European Committee for
Standardization (CEN), Brussels.
BS EN 14774-3 (Oven dry method): 2004. Solid biofuels - Determination of moisture content -
Oven dry method - Part 3: Moisture in general analysis sample. European Committee for
Standardization (CEN), Brussels.
Chapman H.D. and P.F. Pratt, 1961. Methods of Analysis for Soils, Plants, and Waters.
University of California, Division of Agriculture, Berkeley, pg 169-170.
Chen, C. 2003. Evaluation of Air Oven Moisture Content Determination Methods for Rough
Rice. Biosystems Engineering; 86 (4): 447–457.
Department of Agriculture (DOA) Peninsular Malaysia, 2012. Fruit crop statistic, Malaysia. BK
99/09.10/250.
Epstein E. 2005. Mineral nutrition of plants: Principles and perspectives. 2nd Edition, John
Wiley and Sons, Inc.
Evald, A. and Jacobsen H.H., 1993. Facts on installation, operation and economy for wood
chips fired district heating plants in Denmark. Centre of Biomass Technology.
Ileleji, K.E., Garcia, A.A., Kingsly, A.R.P. and Clementson, C.L. 2010. Comparison of
Standard Moisture Loss-on-Drying Methods for the Determination of Moisture Content of
Corn Distillers Dried Grains with Solubles. Journal of AOAC International, 93 (3): 825-
832(8).
Jensen, P.D., Mattsson, J.E, Kofman, P.D. and Klausner, A. 2004. Tendency of wood fuels from
whole trees, logging residues and roundwood to bridge over openings. Biomass and
Bioenergy; 26:107–13.
Jirjis, R. 2005. Effects of particle size and pile height on storage and fuel quality of comminuted
Salix viminalis. Biomass and Bioenergy; 28:193–201.
50
Kaltschmitt, M. and Hein, M. 2006. Pre-Normative Work on Sampling and Testing of Solid
Biofuels for the Development of Quality Assurance Systems. BioNorm Project - Final
Technical Report. ENK6-CT-2001-00556. European Community under the 5th Framework
Program (1998-2002).
Mattsson, J.E. 1990. Basic handling characteristics of wood fuels: angle of repose, friction
against surfaces and tendency to bridge for different assortments. Scandinavian Journal of
Forest Research; 5:583–97.
NFTA 2.2.2.5: 2002. Forage Analysis Test Procedures.
http://www.foragetesting.Org/lab_procedure/section/2.2/part2.2.2.5.htm, National Forage
Testing Association, Omaha, NE.
Official Methods of Analysis of AOAC INTERNATIONAL (2000) 18th Ed., AOAC
INTERNATIONAL, Gaithersburg, MD, USA, Official Method 930.15.
Official Methods of Analysis of AOAC INTERNATIONAL (2009) AOAC INTERNATIONAL,
Gaithersburg, MD, USA, Official Method Ca 2e-84.
Rosentrater, K.A. and Muthukumarappan, K.. 2006. Corn ethanol coproducts: generation,
properties, and future prospects. International Sugar Journal, 108:1295.
Thiex, N. 2009. Evaluation of Analytical Methods for the Determination of Moisture, Crude
Protein, Crude Fat, and Crude Fiber in Distillers Dried Grains with Solubles. J. AOAC Int.
92: 61–73.
Thiex, N. and Richardson, C.R. 2003. Challenges in measuring moisture content of feeds. Jour
Animal Sci, 81:3255-3266.
University of Missouri Agricultural Experiment Station Chemical Laboratories (ESCL), Room
4 Agriculture Bldg., 700 Hitt Street, Columbia, MO 65211.
51
CHAPTER 4. PHYSICAL AND CHEMICAL CHARACTERIZATION OF DURIAN
WASTE FOR THERMOCHEMICAL CONVERSION APPLICATIONS
A paper to be submitted to The Journal of Biomass and Bioenergy
Ahmad Bujang1,2, Carl Bern2, Thomas Brumm2
Abstract
Heterogeneity of the physical and chemical characteristics of biomass is seen as a major
challenge for wider application and utilization of biomass resources. Understanding the
characteristics and make-up of the many biomass resources in Malaysia is vital in order to fully
harness its potential. Existing techniques used in the physical and chemical characterization of
biomass were applied to durian biomass. Low ash, sulfur and nitrogen content as well as
comparable calorific value found in durian biomass makes it an attractive option for co-firing
with coal. For pyrolysis applications, the high oxygen content found may result in unfavorable
products and discrepancies found in lignocellulosic fraction tests indicates further testing is
needed. Carboxylic acids and phenols were identified as the two highest compound groups.
Introduction
Sustainability, diversification, flexibility and emission reduction are key aspects of the
New Energy Policy (2011-2015) under the 10th Malaysian Plan (2011-2015). The focus of this
policy is to ensure energy security, economic efficiency and improving environmental and social
standards (EPU, 2010). Development of renewable sources such as biomass, hydroelectric and
biofuel is seen as a vital building block to achieve these targets (Ahmad, 2010).
1 Author, Malaysian Agricultural Research and Development Institute (MARDI). 2 Agricultural and Biosystems Engineering, Iowa State University.
52
Utilization of biomass resources is very attractive and is currently spearheaded by
utilization in cogeneration plants such as those under the state organized Small Renewable
Energy Power program (SREP) (Ludin et al., 2004) as well as joint state-private initiatives such
as BioGen and Chubu Electric Power. At this moment, palm oil biomass is a major contributor to
these initiatives, where total available palm oil biomass as of 2010 is estimated to be about 87
million Mg, which is equivalent to a total potential energy of 1554GJ (KeTTHA, 2011). By
2020, biomass is targeted to achieve at least 800 MW of electricity generation capacity, of which
500 MW is derived from palm oil biomass (KeTTHA, 2011). This can pave the way for adoption
of other sources of biomass, where it can take advantage of the infrastructure and management
structure established through palm oil biomass utilization.
Agricultural products such as sugar, rice and fruits generate high waste-to-product ratios.
In South East Asia, most lumber and agricultural practices generate residues in the range of 20 to
70% of raw material input ((Lacrosse and Shakya, 2004). The high waste-to-edible portion ratio
of fruits like durian, where the edible portion is only about 15-30% (Brown, 1997) of the total
fruit weight, creates a large waste stream especially in post-harvest processing centers.
Moreover, due to the climacteric nature of most tropical fruits such as durian, mangosteen,
jackfruit and mango, ripening of the fruit occurs rapidly after harvest thus decreasing its edible
and economic value in a short selling window. Coupled with the seasonal nature of these fruits,
oversupply or glut of fruit production severely decreases farmers’ income and creates waste
problems. Therefore, utilization of fruit biomass is essential to not only regulate fruit prices
through diversification of products derived from these fruits and its waste, but also reduce
53
environmental issues of waste disposal and utilizing its potential as a renewable energy
feedstock.
Total Malaysian fruit production for the year 2011 was 1.6 million Mg from a total crop
area of about 230,000 ha (DOA, 2012). Durian, banana and rambutan were the top three major
fruit crops in year 2011, with productions of 360,000 Mg, 306,000 Mg and 63,000 Mg
respectively (DOA, 2012). The Department of Agriculture (DOA) and the Federal Agricultural
Marketing Authority (FAMA) are two state agencies that provide technical resource, marketing
and logistical support to local fruit producers. Both agencies have many operation hubs
throughout Malaysia and most of their activities including collection and distribution of
commodities and most importantly dissemination of information and knowledge are channeled
through these facilities. Since availability and logistical constraints are two of the major
challenges to the development of biorefineries (Caputo et al., 2005), this problem can be
potentially alleviated through this existing network. Furthermore collection of waste as
renewable feedstock can be easily implemented in the same network as well.
Conversion of fruit biomass can be done through thermochemical processing routes other
than combustion through cogeneration with coal in an electricity generation plant.
Thermochemical processing can be summarily defined as the conversion of plant polymers in
biomass into fuels, chemicals, or electric power through the application of heat and catalysts.
There are five main thermochemical processing routes: Combustion, gasification, fast pyrolysis,
hydrothermal processing, and hydrolysis to sugar, where each is classified by its processing
temperatures and applications (Brown, 2011).
54
Fast pyrolysis is the thermal decomposition of biomass in the absence of oxygen at
temperatures typically around 400-600°C that involves very high heating rates (0.5-2s) followed
by rapid cooling and condensation of the vapor products. Fast pyrolysis yields gas, solid and
liquid product streams that distinguish it from other thermochemical methods such as
combustion and gasification. Biomass composition as well as heating rate and heating duration
influence the product distribution and the ratio between gas, liquid and solid produced. The
liquid stream or bio-oil is of particular interest due to its potential as a feedstock for conversion
into drop-in or advanced biofuels through bio-oil upgrading (Mohan et al., 2006; Czernik et al.,
2002; Elliott, 2007; Marker et al., 2005). Furthermore, as a form of liquid feedstock, bio-oil has
the potential to improve energy density and ease of transportation thus improving the overall
efficiency and viability of a biorefinery.
The high oxygen content in most plant carbohydrate polymers makes biomass
significantly different from conventional energy sources in terms of its chemical composition.
The main constituents of biomass are celluloses, hemicelluloses, lignin, organic extractives and
inorganic minerals, where the weight percent of each components are unique to each type of
biomass (Mohan et al., 2006). Compared to information available on other contemporary
feedstock such as corn residues, perennial grasses and softwoods, thermochemical studies on
durian or other tropical fruit biomass is almost non-existent. With regards to other potential
feedstock in Malaysia, there have been a number of pyrolytic studies done on palm oil (Abdullah
and Gerhouser, 2008; Abdullah et al., 2010) and these studies have found comparable results of
bio-oil yields from palm oil empty fruit bunches (EFB).
55
Chemical composition is highly critical in understanding the thermal degradation
characteristics of lignocellulosic materials in biomass (Antal, and Varhegyi, 1995; Liou et al.,
1997). Furthermore, chemical composition also affects the pyrolysis process where high nitrogen
and ash concentration negatively affect hydrocarbon yields (Sanderson et al., 1996). The
objective of this paper is to meet the overarching need to identify and characterize these traits
that will ensure further analysis of the material such as yield prediction, mathematical models,
process optimization and economic analysis can be carried out. This will eventually lead to the
ability to streamline the process making it more efficient and feasible so that it can supplant
conventional fuel and energy sources. Investigation of the energy content available is also crucial
for thermal and electrical applications, where it is normally reported in a standardized heating
value (HV) (Vargas-Moreno et al. 2012).
Therefore, for tropical fruit biomass like durian rind to be considered as feedstock, it is
imperative that its physical and chemical characteristics first be established and compared with
other potential feedstock before other analysis can proceed. Due to the scarcity of material
available, bench-scale pyrolysis was not possible. However, preliminary pyrolysis product
identification can be ascertained through a micropyrolyzer-mass spectrometer system that will
allow identification of monosaccharides and phenolic monomers that can be used as a basis for
understanding the thermal degradation of durian biomass.
56
Materials and methods
Material
Frozen Mon Thong or Golden Pillow (Durio zibethinus Murray) durians imported from
Thailand were used in this experiment. The fruits were purchased from a local Asian market in
Ames, Iowa where the fruits were refrigerated at -18C (0F) during transport and storage. It is
sold in 12-kg (25-lb) boxes containing about four to five fruits. Each fruit was individually
placed in plastic nettings and packed in corrugated carton boxes.
The materials used in this experiment were the rinds collected from the fruits. The frozen
fruits were thawed at room temperature for at least 12 h before separation of the edible pulp and
the rind was done. Each fruit was cleaned by brushing its surface to remove dirt or other foreign
contaminants. Separation was done manually using a sturdy cleaver or knife to pry open the fruit.
Once open, the pulp was scooped out by hand and the rinds were then dried at 60⁰C for 48 hours
in a forced air oven (Heratherm 51028115H, 60L, 120 VAC 60 Hz, Thermo Fisher Scientific
Inc, USA). The dried rinds were then ground using a knifemill (Heavy-Duty Cutting Mill SM
2000, Retsch GmbH) fitted with a 5- mm particle size screen. Samples were sent to the
University of Missouri Agricultural Experiment Station Chemical Laboratories (ESCL) to
determine its pre-drying moisture content. Moisture content was determined using the Karl
Fischer reagent test (AOCS Ca 2e-84).
Characterization of durian biomass
Proximate analysis was done using a thermogravimetric analyzer (Mettler-Toledo,
International Inc., Columbus, OH, USA) following the ASTM D7582 - 12 method (ASTM,
57
2012). Ultimate analysis was done using a TRUSPEC-CHN elemental analyzer (TruSpec Micro
CHNS, LECO Corporation, St. Joseph, MI, USA). Oxygen content was calculated as a
difference in relation to the other elements. Metals and inorganic component analysis were
performed at University of Missouri Agricultural Experiment Station Chemical Laboratories
(ESCL) using Inductively Coupled Plasma - Optical Emission Spectroscopy (ICP-OES) (AOAC
Official Method 985.01). Samples were also sent to this lab to determine the lignocellulosic
content of the rind, where acid detergent fiber (ADF: AOAC 973.18), lignin (ADL: AOAC
973.18) and neutral detergent fiber (NDF: JAOAC 56, 1352-1356) were determined to calculate
fraction of cellulose, hemicellulose and lignin. Samples were analyzed in duplicates.
Higher heating value (HHV) was estimated using correlation developed by Sheng and
Azevedo (2005) for different biomass fuels that is based on the ultimate analysis of the material.
This correlation was found to provide the highest accuracy and the estimation of HHV is done
using the composition of the main elements of the proximate analysis: carbon (C), hydrogen (H)
and oxygen (O). The correlation used is as follows;
𝐻𝐻𝑉 = −1.3675 + 0.3137[𝐶] + 0.7009[𝐻] + 0.0318[𝑂] (Sheng and Azevedo, 2005)
Analytical pyrolysis
A Frontier Lab Double Shot Micropyrolyzer 20202iS (Frontier Laboratories Ltd, Japan)
coupled to a Varian 450 GC (Agilent Technologies, Inc. Santa Clara, CA, USA) was used in the
pyrolysis experiment and product identification. Sample weights in the range of 250 ± 5 mg were
used and pyrolysis tests were performed at temperatures of 500⁰C. Product identification was
done using the software accompanying the mass-spectrometer. The peaks were compared to
58
those from the National Institute of Standards and Technology (NIST) mass spectral data library
in order to determine its identity.
Results and discussion
Proximate and ultimate analysis
Table 7 summarizes the results of the proximate and ultimate analyses done on the durian
samples. Values for corn residues and other fruit processing wastes are also listed for
comparison. In general, the properties of durian biomass are comparable to other biomass, with
regards to low ash content and almost similar volatile content and fixed carbon. Similar to palm
oil biomass, untreated durian waste has high moisture content and significant amount of drying
must be done to reduce the moisture content to less than 50% for most thermal conversion
(Mckendry, 2002). High moisture content in biomass may influence its pyrolytic behavior as
well as the physical properties and quality of the bio-oil. Therefore depending on the intended
aim of the process to either generate more bio-oil or char, the initial moisture content is a crucial
factor (Demirbas, 2004).
Furthermore, high moisture content of biomass can also cause ignition and combustion
problems, as well as flame stability during combustion. In electrical generation, this issue can be
solved by co-firing of biomass with coal (Demirbas (2), 2004). Therefore, sufficient drying must
be done prior to thermal conversion and due to climatic conditions in Malaysia; this can be done
by drying the biomass in the sun for a specific time. The values of volatile content and fixed
carbon serve as an indication of how well the biomass can be utilized as energy source. These
values measure the reactivity or how easily it can undergo thermal degradation (McKendry,
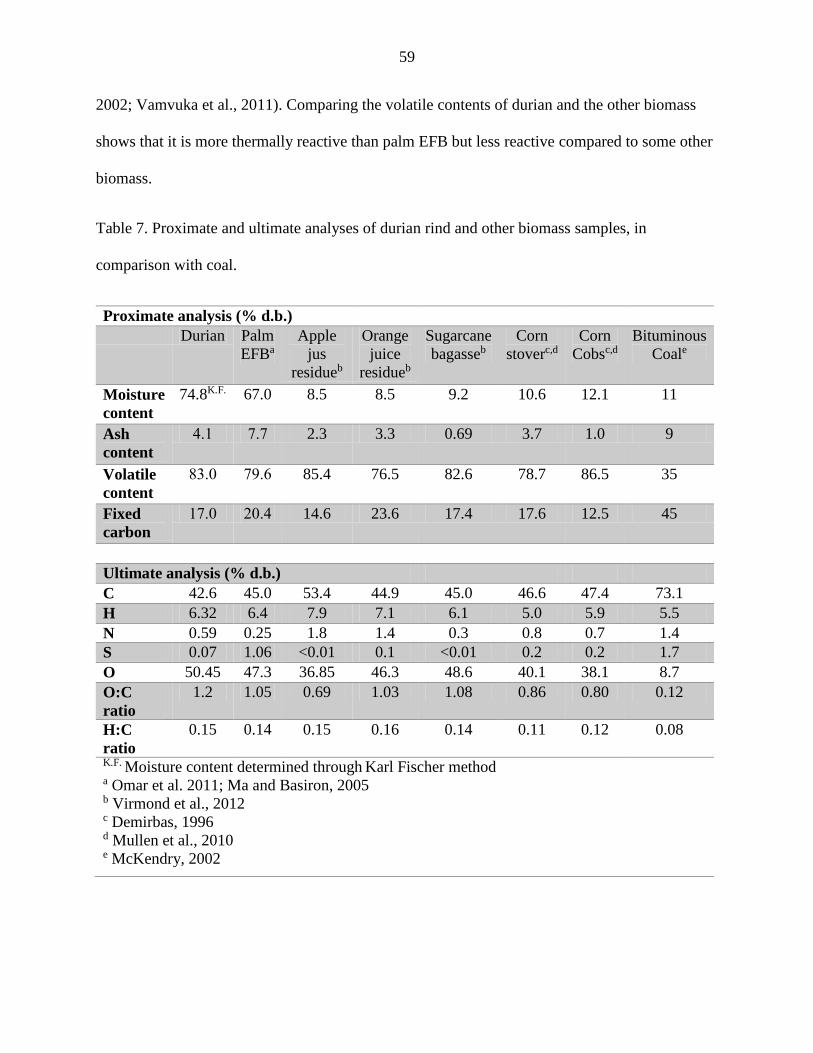
59
2002; Vamvuka et al., 2011). Comparing the volatile contents of durian and the other biomass
shows that it is more thermally reactive than palm EFB but less reactive compared to some other
biomass.
Table 7. Proximate and ultimate analyses of durian rind and other biomass samples, in
comparison with coal.
Proximate analysis (% d.b.)
Durian Palm
EFBa
Apple
jus
residueb
Orange
juice
residueb
Sugarcane
bagasseb
Corn
stoverc,d
Corn
Cobsc,d
Bituminous
Coale
Moisture
content
74.8K.F. 67.0 8.5 8.5 9.2 10.6 12.1 11
Ash
content
4.1 7.7 2.3 3.3 0.69 3.7 1.0 9
Volatile
content
83.0 79.6 85.4 76.5 82.6 78.7 86.5 35
Fixed
carbon
17.0 20.4 14.6 23.6 17.4 17.6 12.5 45
Ultimate analysis (% d.b.)
C 42.6 45.0 53.4 44.9 45.0 46.6 47.4 73.1
H 6.32 6.4 7.9 7.1 6.1 5.0 5.9 5.5
N 0.59 0.25 1.8 1.4 0.3 0.8 0.7 1.4
S 0.07 1.06 <0.01 0.1 <0.01 0.2 0.2 1.7
O 50.45 47.3 36.85 46.3 48.6 40.1 38.1 8.7
O:C
ratio
1.2 1.05 0.69 1.03 1.08 0.86 0.80 0.12
H:C
ratio
0.15 0.14 0.15 0.16 0.14 0.11 0.12 0.08
K.F. Moisture content determined through Karl Fischer method a Omar et al. 2011; Ma and Basiron, 2005 b Virmond et al., 2012 c Demirbas, 1996 d Mullen et al., 2010 e McKendry, 2002
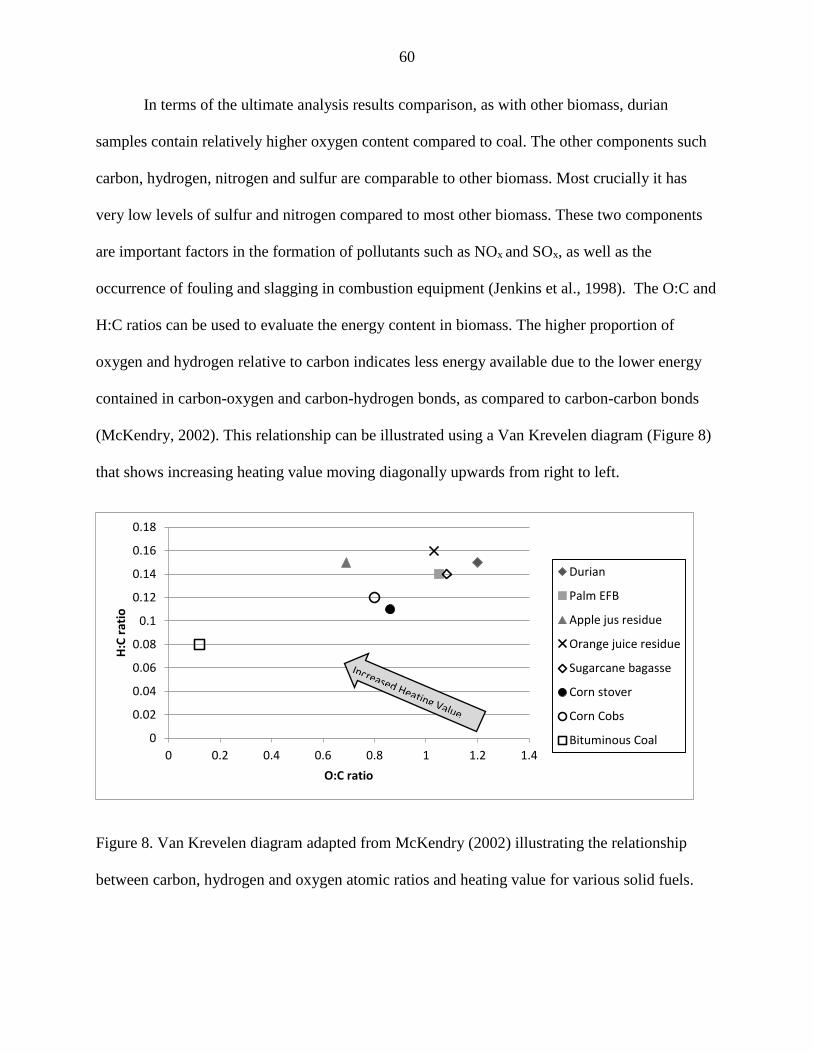
60
In terms of the ultimate analysis results comparison, as with other biomass, durian
samples contain relatively higher oxygen content compared to coal. The other components such
carbon, hydrogen, nitrogen and sulfur are comparable to other biomass. Most crucially it has
very low levels of sulfur and nitrogen compared to most other biomass. These two components
are important factors in the formation of pollutants such as NOx and SOx, as well as the
occurrence of fouling and slagging in combustion equipment (Jenkins et al., 1998). The O:C and
H:C ratios can be used to evaluate the energy content in biomass. The higher proportion of
oxygen and hydrogen relative to carbon indicates less energy available due to the lower energy
contained in carbon-oxygen and carbon-hydrogen bonds, as compared to carbon-carbon bonds
(McKendry, 2002). This relationship can be illustrated using a Van Krevelen diagram (Figure 8)
that shows increasing heating value moving diagonally upwards from right to left.
Figure 8. Van Krevelen diagram adapted from McKendry (2002) illustrating the relationship
between carbon, hydrogen and oxygen atomic ratios and heating value for various solid fuels.
0
0.02
0.04
0.06
0.08
0.1
0.12
0.14
0.16
0.18
0 0.2 0.4 0.6 0.8 1 1.2 1.4
H:C
rat
io
O:C ratio
Durian
Palm EFB
Apple jus residue
Orange juice residue
Sugarcane bagasse
Corn stover
Corn Cobs
Bituminous Coal
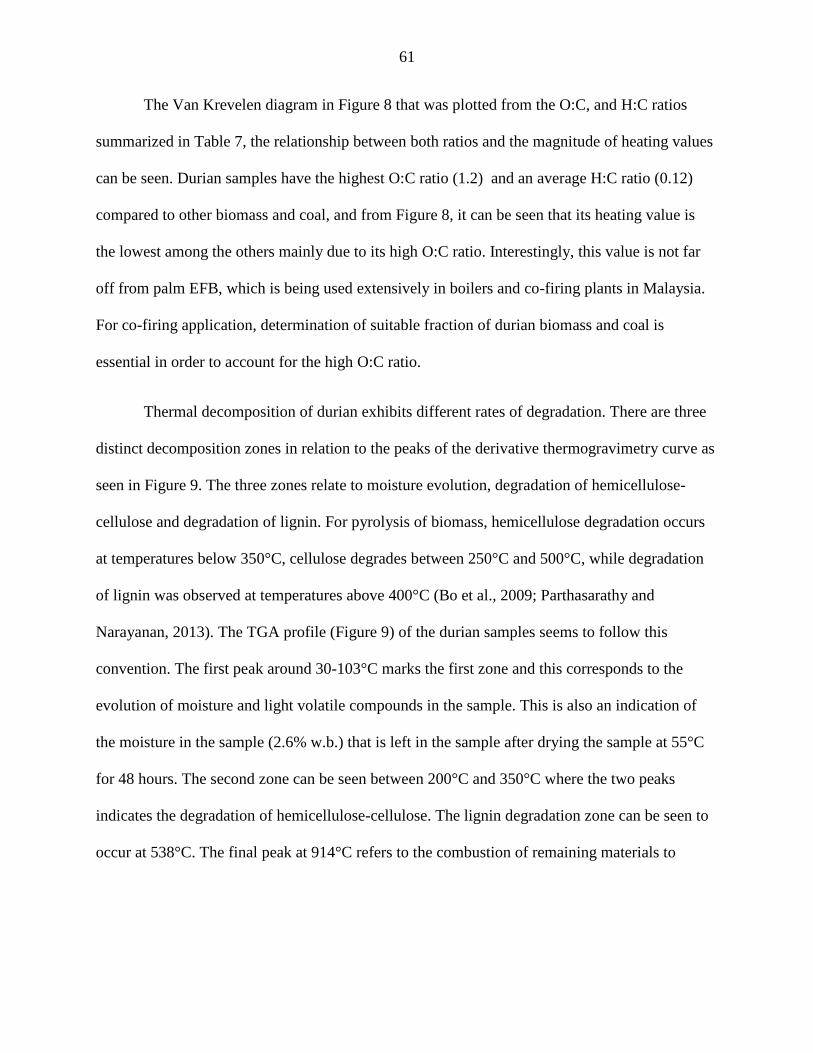
61
The Van Krevelen diagram in Figure 8 that was plotted from the O:C, and H:C ratios
summarized in Table 7, the relationship between both ratios and the magnitude of heating values
can be seen. Durian samples have the highest O:C ratio (1.2) and an average H:C ratio (0.12)
compared to other biomass and coal, and from Figure 8, it can be seen that its heating value is
the lowest among the others mainly due to its high O:C ratio. Interestingly, this value is not far
off from palm EFB, which is being used extensively in boilers and co-firing plants in Malaysia.
For co-firing application, determination of suitable fraction of durian biomass and coal is
essential in order to account for the high O:C ratio.
Thermal decomposition of durian exhibits different rates of degradation. There are three
distinct decomposition zones in relation to the peaks of the derivative thermogravimetry curve as
seen in Figure 9. The three zones relate to moisture evolution, degradation of hemicellulose-
cellulose and degradation of lignin. For pyrolysis of biomass, hemicellulose degradation occurs
at temperatures below 350°C, cellulose degrades between 250°C and 500°C, while degradation
of lignin was observed at temperatures above 400°C (Bo et al., 2009; Parthasarathy and
Narayanan, 2013). The TGA profile (Figure 9) of the durian samples seems to follow this
convention. The first peak around 30-103°C marks the first zone and this corresponds to the
evolution of moisture and light volatile compounds in the sample. This is also an indication of
the moisture in the sample (2.6% w.b.) that is left in the sample after drying the sample at 55°C
for 48 hours. The second zone can be seen between 200°C and 350°C where the two peaks
indicates the degradation of hemicellulose-cellulose. The lignin degradation zone can be seen to
occur at 538°C. The final peak at 914°C refers to the combustion of remaining materials to
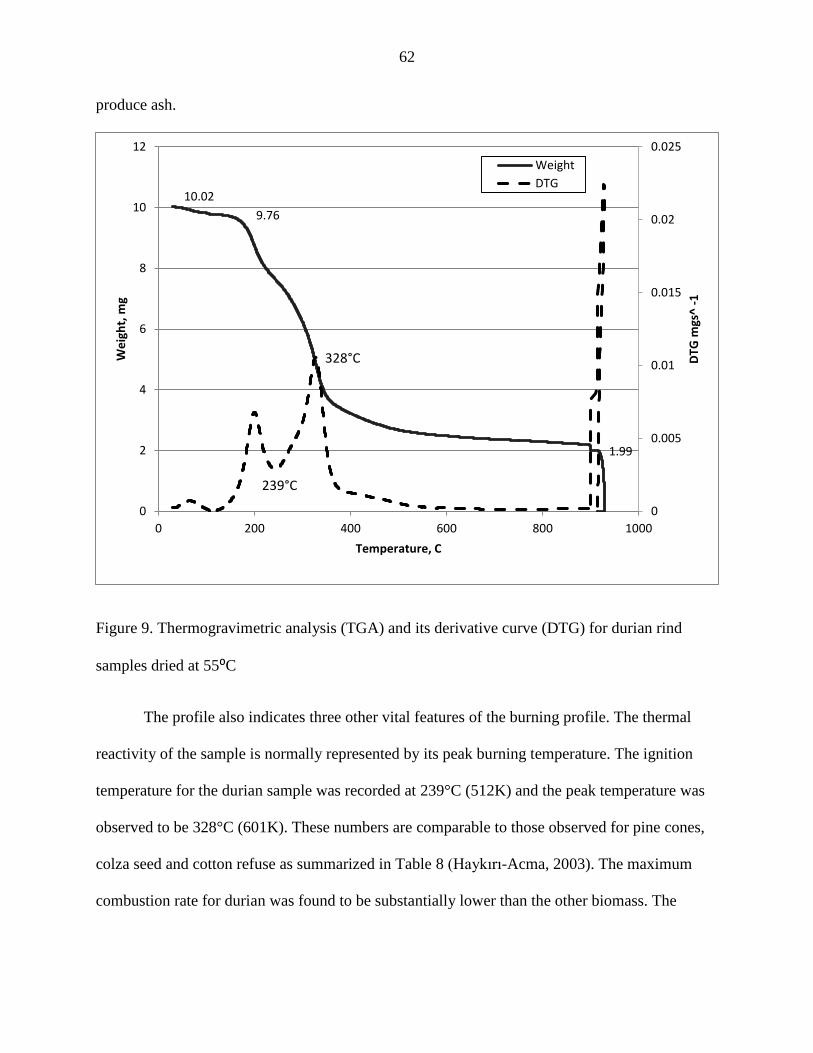
62
produce ash.
Figure 9. Thermogravimetric analysis (TGA) and its derivative curve (DTG) for durian rind
samples dried at 55⁰C
The profile also indicates three other vital features of the burning profile. The thermal
reactivity of the sample is normally represented by its peak burning temperature. The ignition
temperature for the durian sample was recorded at 239°C (512K) and the peak temperature was
observed to be 328°C (601K). These numbers are comparable to those observed for pine cones,
colza seed and cotton refuse as summarized in Table 8 (Haykırı-Acma, 2003). The maximum
combustion rate for durian was found to be substantially lower than the other biomass. The
10.02
9.76
1.99
0
0.005
0.01
0.015
0.02
0.025
0
2
4
6
8
10
12
0 200 400 600 800 1000
DTG
mgs
^ -1
We
igh
t, m
g
Temperature, C
Weight
DTG
239°C
328°C
63
higher ignition temperature, peak temperature and maximum combustion rate indicates that the
durian samples have fewer components that are easily combusted, thus making it less reactive
(Vamvuka et al., 2011).
Table 8. Comparison of burning characteristics of durian sample with other biomass (Haykırı-
Acma, 2003).
Sample Ignition temperature
(K)
Maximum
combustion rate
(mg/min)
Peak temperature
(K)
Durian 512 0.66 601
Sunflower shell 417 5.50 573
Colza seed 423 2.80 535
Pine cone 463 5.20 565
Cotton refuse 423 3.70 598
Olive refuse 438 3.40 537
Lignocellulosic analysis and heating value
The total lignocellulosic fraction of the rind amounts to about 40% of the total dry
weight. Based on the method used to determine this fraction (AOAC 973.18), the digestible
fraction or the extract contains proteins, starch, sugars, organic acids and pectin that are soluble
in a neutral detergent. The remaining lignocellulosic compounds are retained in the raffinate. The
low value of the lignocellulosic fraction in the durian samples (Table 9) indicates that it has
higher fraction of digestible components more suitably used as feed. Although Hokputsa et al.
(2004) found that durian rind contains high amounts of pectin, these numbers are lower
compared to those reported by Khedari et al. (2004). This discrepancy may be due to the frozen
durian used in this experiment, as compared to fresh durian used by Khedari et al., Our durian
samples underwent several freeze-thaw cycles and this occurrence is presumed to cause
64
significant changes in the structure of the cell walls due to ice formation (Burke et al., 1976),
thus some water-soluble cellulose might have leached out when the fruit thawed, resulting in the
skewed data. When comparing the available result and the one reported by Khedari et al., the
hemi-cellulose and lignin contents are low compared to corn residues.
Referring to the heating values presented in Table 9, the calculated heating values for
durian samples are comparable to those of other agricultural post-harvest biomass. It is almost
similar to palm EFB and higher than corn residues, but it is almost half the heating value of
bituminous coal. However, these values are well within the range of energy content found in
biomass, which is between 17 and 21 MJ/kg (Mckendry, 2002).
Table 9. Summary of lignocellulosic components and heating value of durian rind and other
biomass.
Lignocellulosic (% d.b.)
Durian Durianj Palm
EFBa
Apple
juice
residueh
Orange
juice
residuei
Sugar-
cane
bagassed
Corn
stoverc
Corn
Cobsc
Bitu-
minous
Coalg
Cellulose 10.3 60.5 23.7 7.2 9.2 45.4 51.2 52.0 n.d
Hemi-
cellulose
19.2 13.1 21.6 n.d. 10.5 7.8 30.7 32.0 n.d
Lignin 8.8 15.5 29.2 23.5 0.84 23.4 14.4 15.0 n.d
Higher heating value, HHV(MJkg-1)
18.0e n.d. 19.0f 22.1b 15.3b 15.9 17.8 17.0 34 a Omar et al. 2011; Ma and
Basiron, 2005 b Virmond et al., 2012 c Demirbas, 1996 d Pereira et al., 2011
e Sheng and Azevedo, 2005 f Yang et al., 2004 g McKendry, 2002 h Dhillon et al., 2012
i Rivas et al., 2008 j Khedari et al., 2004
n.d. (not determined)
65
Inorganic analysis
The composition of alkali and alkaline earth metallic species in biomass is of great
concern particularly in thermochemical conversion of biomass. Significant amounts of elements
such as K, Na, Mg and Ca may affect reactor operations or may inversely affect economic
feasibility of the conversion process (Mohan et al., 2006). Williams and Horne (1992) also found
that metal salts can cause lower temperatures during thermal degradation and increased
production of char at concentrations of more than 1%. Based on the results tabulated below
(Table 10) the amounts of K, Na, Mg and Ca for durian samples are low compared to most
biomass. It has considerably lower metal salts compared to palm EFB. These metals are also
catalytically active and can cause secondary cracking reactions that might result in loss of yield
and phase separation of the bio-oil produced (Brown, 2011). The total ash content of this sample
(4 % weight, d.b.) is slightly higher than the theoretical limiting value of 2.5 % (weight, d.b.) ash
content that can negatively affect the catalytic processes (Brown, 2011). Washing and
pretreatment of durian biomass with dilute acid can feasibly remove ash content and improve
processing capabilities.
Heavy metal concentrations are also negligible and this is preferred considering the
effects of having dangerous heavy metal compounds being released in the product streams and
possibly causing significant health and environmental hazards.
66
Table 10. ICP-OES analysis of common inorganic elements in durian biomass.
W/W%= grams
per 100 grams
of sample in dry
basis
Durian Palm
EFBa
Apple
juice
residueb
Orange
juice
residueb
Sugarcane
bagasseb
Corn
stoverc
Corn
Cobsc
Calcium 0.2 6.5 13.4 22.2 6.2 0.02 0.3
Phosphorus 0.2 1.1 18.5 10.7 6.9 0.1 0.2
Sodium 0.001 1.3 0.9 0.3 0.5 0.01 .02
Magnesium 0.2 n.d. 9.0 6.3 8.0 0.06 0.2
Copper 0.001 n.d. n.d. n.d. n.d. n.d. n.d.
Potassium 1.5 12.8 31.3 31.6 23.4 1.0 0.4
Iron 0.002 1.3 5.9 2.9 0.5 0.008 0.2
Zinc) 0.001 n.d. n.d. n.d. n.d. n.d. n.d.
Manganese 0.001 n.d. 0.2 0.1 0.1 0.001 0.09
Chromium 0.0001 n.d. n.d. n.d. n.d. n.d. n.d.
Cobalt 0.00002 n.d. n.d. n.d. n.d. n.d. n.d.
Molybdenum 0.00003 n.d. n.d. n.d. n.d. n.d. n.d.
Silicon as SiO2 0.05 49.1 6.6 3.2 48.7 0.5 2.8
Barium 0.001 n.d. n.d. n.d. n.d. 0.01 0.002
Thallium 0.00001 n.d. n.d. n.d. n.d. n.d. n.d.
Vanadium 0.00001 n.d. n.d. n.d. n.d. n.d. n.d.
Titanium 0.00002 n.d. 2.5 0.2 0.2 0.0003 0.04
Antimony 0.000003 n.d. n.d. n.d. n.d. n.d. n.d.
Arsenic 0.0002 n.d. n.d. n.d. n.d. n.d. n.d.
Aluminum 0.0012 0.5 n.d. n.d. n.d. 0.02 0.5
Nickel 0.00002 n.d. n.d. n.d. n.d. n.d. n.d.
Mercury 0.00001 n.d. n.d. n.d. n.d. n.d. n.d.
Cadmium 0.0001 n.d. n.d. n.d. n.d. n.d. n.d.
Lead 0.0001 n.d. n.d. n.d. n.d. n.d. n.d. a Omar et al. 2011 b Virmond et al., 2012 c Mullen et al., 2010
n.d. (not determined)
Analytical pyrolysis
Characterization of pyrolysis product is essential in predicting the characteristics of bio-
oil produced from the pyrolysis of durian biomass. Bio-oil is a dense liquid product of pyrolysis
that can increase the overall energy density of the biomass as well as having a potential
application in upgrading processes to produce biofuels or biochemicals (Brown, 2011). Tables 11
67
and 12 summarize the broad approximation and identification of products that can be derived
from pyrolysis of durian samples at 500⁰C. Based on the results, carboxylic acids and phenols
were found to be the top two highest compound groups. High percentage of acids produced is
also expected due to the high oxygen content of the biomass. Removal of organic acids such as
acetic acid in bio-oil is essential in avoiding corrosion of metals and storage instability
(Agblevor, 1995; Diebold and Bridgwater, 2002). Phenols can also be extracted to produce high
value products such as resins and adhesives. Ether soluble furans and ketones were the next two
highest compound groups. It was interesting to note the lack of the highly valued carbohydrate
derivatives, specifically levoglucosan in the list of compounds found. This is expected due to the
low percentage of carbohydrate in the biomass.
Table 11. Compounds identified from the volatiles generated by durian biomass pyrolysis.
Compounds Formula Area (%)
Acids
Acetic acid C2H4O2 9.599
n-Hexadecanoic acid C16H32O2 5.672
Propanoic acid, 2-oxo-, methyl ester C4H6O3 5.516
Tetradecanoic acid C14H28O2 1.681
Pentadecanoic acid C15H30O2 1.002
Alcohols
Cyclopropyl carbinol C4H8O 4.907
Ketones
2-Cyclopenten-1-one, 2-hydroxy- C5H6O2 4.836
3',5'-Dimethoxyacetophenone C10H12O3 2.602
1,2-Cyclopentanedione, 3-methyl- C6H8O2 2.394
2-Propanone, 1-(acetyloxy)- C5H8O3 1.749
Furans
2-Furancarboxaldehyde, 5-(hydroxymethyl)- C6H6O3 5.086
Furfural C5H4O2 4.343
2(5H)-Furanone C4H4O2 1.747
2-Furanmethanol C5H6O2 1.217
68
Table 11continued
Phenols
Phenol, 2,6-dimethoxy- C8H10O3 3.945
2-Methoxy-4-vinylphenol C9H10O2 2.355
Phenol, 2-methoxy- C7H8O2 1.983
Phenol, 2,6-dimethoxy-4-(2-propenyl)- C11H14O3 1.938
Phenol, 2-methoxy-4-methyl- C8H10O2 1.458
Phenol, 2-methoxy-4-(1-propenyl)- C10H12O2 1.444
Phenol C6H6O 1.168
Phenol, 3-methyl- C7H8O 1.085
Nitrogen Compounds
Cyclobutylamine C4H9N 4.98
Aldehydes
Undecanal C11H22O 2.839
Nonanal C9H18O 1.78
Butanedial C4H6O2 1.503
Esters
1,2-Benzenedicarboxylic acid, bis(2-methylpropyl) ester C16H22O4 0.988
Aromatics
1,2,4-Trimethoxybenzene C9H12O3 1.326
Misc. Oxygenates
4H-Pyran-4-one, 2,3-dihydro-3,5-dihydroxy-6-methyl- C6H8O4 1.702
5,9-Dodecadien-2-one, 6,10-dimethyl-, (E,E))- C14H24O 1.235
2,4-Imidazolidinedione, 5-methyl- C4H6N2O2 1.167
2-Methyliminoperhydro-1,3-oxazine C5H10N2O 1.02
Tricyclo[2.2.1.0(2,6)]heptan-3-ol, 4,5,5-trimethyl- C10H16O 0.911
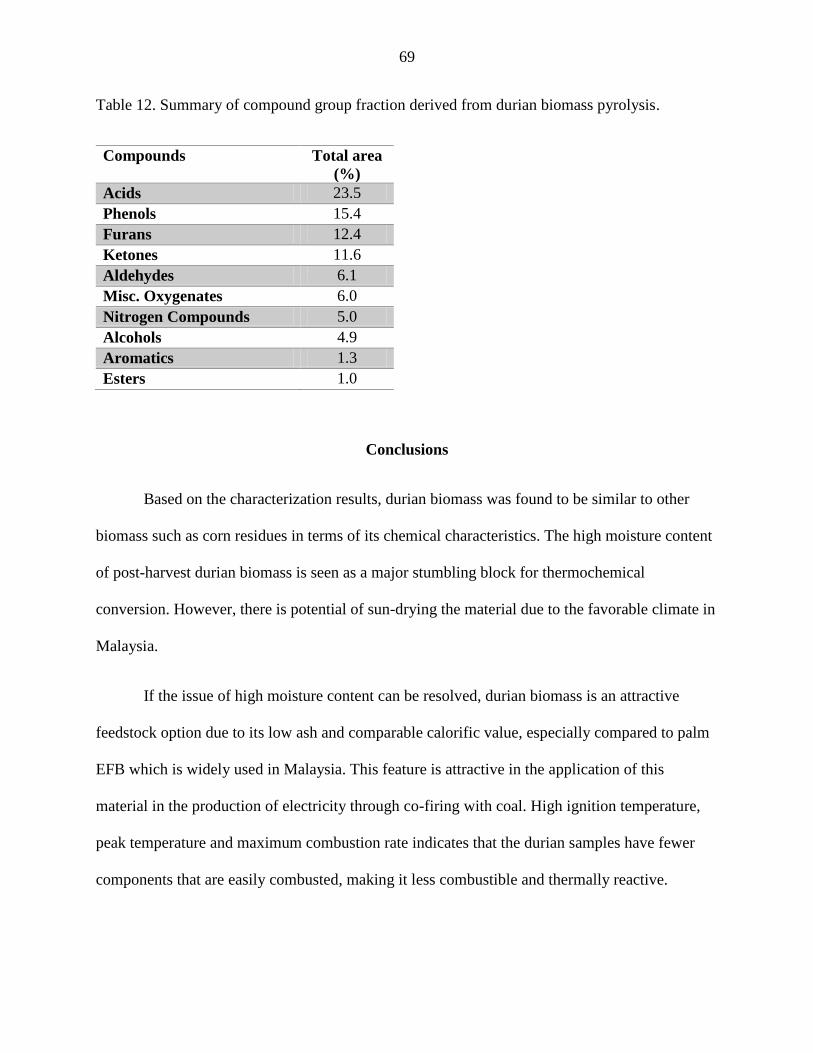
69
Table 12. Summary of compound group fraction derived from durian biomass pyrolysis.
Compounds Total area
(%)
Acids 23.5
Phenols 15.4
Furans 12.4
Ketones 11.6
Aldehydes 6.1
Misc. Oxygenates 6.0
Nitrogen Compounds 5.0
Alcohols 4.9
Aromatics 1.3
Esters 1.0
Conclusions
Based on the characterization results, durian biomass was found to be similar to other
biomass such as corn residues in terms of its chemical characteristics. The high moisture content
of post-harvest durian biomass is seen as a major stumbling block for thermochemical
conversion. However, there is potential of sun-drying the material due to the favorable climate in
Malaysia.
If the issue of high moisture content can be resolved, durian biomass is an attractive
feedstock option due to its low ash and comparable calorific value, especially compared to palm
EFB which is widely used in Malaysia. This feature is attractive in the application of this
material in the production of electricity through co-firing with coal. High ignition temperature,
peak temperature and maximum combustion rate indicates that the durian samples have fewer
components that are easily combusted, making it less combustible and thermally reactive.
70
For pyrolysis applications, there are still some uncertainties in terms of its high oxygen
content and the discrepancies with other published results on the fraction of lignocellulosic
compounds. More detailed analysis must be done to study the pyrolysis properties of durian
biomass which include, larger scaled pyrolysis testing and determining the yield and properties
of bio-oil and char produced. Based on available results, carboxylic acids and phenols were
found to be the two highest compounds identified from the micropyrolyzing experiment. Future
studies can also include identifying suitable pretreatment processes to improve its processing
parameters, yield and overall economic viability.
Acknowledgement
This research was made possible through the research funding granted by the Malaysian
Agricultural Research and Development Institute (MARDI).
The author would also like to thank the members of the Iowa State University
Biorenewable Lab (BRL); Ryan Smith, Kaige Wang, Kwang Kim Ho, Chamila Thilakaratne,
Juan Proano, Matt Kieffer and Bernando del Campo.
References
Ahmad, N. 2010. New Energy Policy and direction in the 10th Malaysian Plan. Energy Forum,
9th August 2010.
Agblevor, F. A., Besler, S., Montane, D., and Evans, R.J. 1995. Influence of inorganic
compounds on char formation and quality of fast pyrolysis oils. ACS 209th National
Meeting, Anaheim, CA.
Antal, Jr M.J. and Varhegyi, G. 1995. Cellulose pyrolysis kinetics: The current state of
knowledge. Industrial and Engineering Chemistry Research, 34(3): 703-720.
71
ASTM D7582 – 12, 2012. Standard Test Methods for Proximate Analysis of Coal and Coke by
Macro Thermogravimetric Analysis. ASTM International, West Conshohocken, PA,
2003, DOI: 10.1520/D7582-12, www.astm.org.
Bo, L.H., Yu, Z.G. and Xia, J.C. 2009. Analysis on TG–FTIR and Kinetics of Biomass
Pyrolysis, In: Proceedings on Sustainable power generation and supply (SUPERGEN),
Nanjing, China, April 6–7, IEEE Xplore
Brown, M. J. 1997. Durio – a bibliographic review. In R. K. Arora, V. Ramanatha Rao, & A. N.
Rao (Eds.), International Plant Genetic Resources Institute (IPGRI).
Brown, R.C. 2011. Chapter 1: Introduction to thermochemical processing of biomass into fuels,
chemicals, and power. In Thermochemical Processing of Biomass: Conversion into
Fuels, Chemicals and Power, 1-5. First Ed., John Wiley & Sons, Ltd.
Burke, M.J., Gusta, L.V., Quamme, H.A., Weiser, C.J. and Li, P.H. 1976. Freezing and injury in
plants. Ann. Rev. Plant Physiol. 27: 507-28.
Caputo, A.C., Palumbo, M., Pelagagge, P.M. and Scacchia, F. 2005. Economics of biomass
energy utilization in combustion and gasification plants: effects of logistic variables.
Biomass and Bioenergy, 28: 35–54.
Czernik, S., French, R., Feik, C., and Chornet, E. 2002. Hydrogen by catalytic steam reforming
of liquid byproducts from biomass thermoconversion processes. Industrial &
Engineering Chemistry Research, 41: 4209-4215.
Demirbas, A. 1996. Calculation of higher heating values of biomass fuels. 1997. Fuel Vol. 76,
No. 5: 431-434.
Demirbas, A. 2004. Combustion characteristics of different biomass fuels. Progress in Energy
and Combustion Science, 30, Issue 2: 219-230.
Demirbas, A. 2004. Effect of initial moisture content on the yields of oily products from
pyrolysis of biomass, Journal of Analytical and Applied Pyrolysis, 71, Issue 2: 803-815.
Department of Agriculture (DOA) Peninsular Malaysia, 2012. Fruit crop statistic, Malaysia.
BK 99/09.10/250.
Diebold, J.P., and Bridgwater, A.V. 2002. Overview of fast pyrolysis of biomass for the
production of liquid fuels. Fast Pyrolysis of Biomass: A Handbook. Vol 2. CPL Press,
Newbury, UK: 14-32.
Dhillon, D.S., Kaur, S., Brar, S.K. and Verma, M. 2012. Potential of apple pomace as a solid
substrate for fungal cellulase and hemicellulase bioproduction through solid-state
fermentation. Industrial Crops and Products. Volume 38: 6-13.
72
Economic Planning Unit (EPU), Prime Minister’s Department Malaysia. 2010. 10th Malaysian
Plan (2011-2015) Chapter 3.
http://www.epu.gov.my/eputheme/RMKE10/img/pdf/en/chapt3.pdf. Accessed on 5-28-
2013
Elliott, D.C. 2007. Historical development in hydroprocessing bio-oils. Energy and Fuels, 21:
1792-1815.
H. Haykırı-Acma. 2003. Combustion characteristics of different biomass materials. Energy
Convers Manage, 44: 155–162.
Hokputsa, S., Gerddit, W., Pongsamart, S., Inngjerdingen, K., Heinze, T., Koschella, A. Harding,
S.E. and Paulsen, B.S. 2004. Water-soluble Polysaccharides with Pharmaceutical
Importance from Durian Rinds (Durio ziberthinus Murr): Isolation, Fractionation
Characterization and Bioactivity. Carbohydrate Polymers, 56: 471–481.
Jenkins, B.M., Baxter, L.L. and Miles Jr T.R. 1998. Combustion properties of biomass. Fuel
Processing Technology, 54: 17–46.
Kementerian Tenaga, Teknologi Hijau dan Air (KeTTHA). 2011. Green Impact: Low Carbon
Green Growth Ministry of Energy, Green Technology and Water, Putrajaya, Malaysia.
Khedari, J., Nankongnab, N., Hirunlabh, J. and Teekasap, S. 2004. New low-cost insulation
particleboards from mixture of durian peel and coconut coir, Building and Environment,
39(1): 59-65.
Lacrosse L. and Shakya S.K. 2004. Clean and efficient biomass cogeneration technology
ASEAN. Power-Gen Asia conference and exhibition. 5-7 October, Bangkok, Thailand.
Liou, T.H., Chang, F.W. and Lo, J.J. 1997. Pyrolysis kinetics of acid leached rise husk.
Industrial and Engineering Chemistry Research, 36(2): 568-571.
Ma A.N. and Basiron, Y. 2005. Biomass energy from the palm oil Industry in Malaysia.
Ingenieur, 27: 18–25.
Marker, T.L., Petri, J., Kalnes, T. et al. 2005. Opportunities for biorenewables in oil refineries,
Final Technical Report, US Department of Energy, prepared by UOP, Inc., 12 December,
http://www.osti.gov/bridge/purl.cover.jsp;jsessionid=CE524ACAABE8C174BD29C254
16E6C780?purl=/861458-Wv5uum/ (accessed 10 August 2013)
McKendry, P. 2002. Energy production from biomass (part 1): overview of biomass. Bioresour.
Technol., 83(1): 37–46.
Mohan, D., Pittman, C.U. and Steele, P.H. 2006. Pyrolysis of Wood/Biomass for Bio-oil: A
Critical Review. Energy & Fuels, 20: 848-889.
73
Mullen, C.A., Boateng, A.A., Goldberg, N.M., Lima, I.M., Laird, D.A. and Hicks, K.B. 2010.
Bio-oil and bio-char production from corn cobs and stover by fast pyrolysis. Biomass and
Bioenergy: 34, 67-74.
Omar, R., Idris, A., Yunus, R., Khalid, K and Aida Isma, M.I. 2011. Characterization of empty
fruit bunch for microwave-assisted pyrolysis. Fuel, 90: 1536–1544.
Parthasarathy, P. and Narayanan, S.K. 2013. Determination of kinetic parameters of biomass
samples using thermogravimetric analysis. Environmental Progress & Sustainable
Energy. 33, Issue 1: 256–266.
Pereira, P. H. F., Voorwald, H. C. J., Cioffi, M. O. H., Mulinari, D. R., Da Luz, S. M., and Da
Silva, M. L. C. P. 2011. Sugarcane bagasse pulping and bleaching: Thermal and chemical
characterization. BioRes. 6(3): 2471-2482.
Sanderson, M.A., Agblevor, F., Collins, M. and Johnson, D.K. 1996. Compositional analysis of
biomass feed stocks by near infrared reflectance spectroscopy. Biomass Bioeng, 11:365–
370.
Sheng, C. and JAzevedo, .L.T. 2005. Estimating the higher heating value of biomass fuels from
basic analysis data. Biomass and Bioenergy, Volume 28, Issue 5: 499-507.
Vamvuka, D., El Chatib,N. and Sfakiotakis, S. 2011. Measurements of Ignition Point and
Combustion Characteristics of Biomass Fuels and their Blends with Lignite. Proceedings
of the European Combustion Meeting 2011.
Vargas-Moreno, J.M., Callejón-Ferre, A.J., Pérez-Alonso, J. and Velázquez-Martí, B. 2012. A
review of the mathematical models for predicting the heating value of biomass materials,
Renewable and Sustainable Energy Reviews, Volume 16, Issue 5: 3065-3083.
Virmond, E., Rennio, F., Sena, D., Albrecht, W., Althoff, C.A., Moreira, R.F.P.M. and José, H.J.
2012. Characterization of agroindustrial solid residues as biofuels and potential
application in thermochemical processes. Waste Management, Volume 32, Issue 10:
1952-1961.
Yang, H., Yan, R., Chin, T., Tee Lian, D., Chen, H. and Zheng, C. 2004. Thermogravimetric
analysis-fourier transform infrared analysis of palm oil waste pyrolysis. Energy Fuel, 18:
1814–21.
74
CHAPTER 5. COMPOSTING OF DURIAN RIND FOR GREENHOUSE MEDIA
APPLICATION
A paper to be submitted to The Journal of Bioreseource Technology
Ahmad Bujang1,2, Carl Bern2, Thomas Brumm2
Abstract
Composting is a viable, simple and comparatively inexpensive method of waste disposal.
Greenhouse media application for compost is an attractive option that can replace peat and also
provide necessary organic matter and nutrients as well as containing plant growth regulators and
pathogenic inhibitors for optimal plant growth. Weight change, CO2 production rate and
temperature profiles were observed for different levels of C:N ratios and sample preparation
methods. Size of composting volume affected the temperature profile, where thermophilic heat
rate was not achieved. The combination of 30:1 and 50:1 ratios, with Fitz and knife mill
preparation methods seemed to produce better composting conditions as well as producing better
quality compost.
Introduction
With agricultural activities being a major economic driver in Malaysia, there are sizable
amounts of biomass from various sources that can potentially be utilized for the generation of
energy, fuel or other usable form. Malaysia’s major agricultural crops are rubber (39.7%), oil
palm (34.6%), rice (12.7%), cocoa (6.8%) and coconut (6.3%) from an estimated 4.9 million
1 Author, Malaysian Agricultural Research and Development Institute (MARDI). 2 Agricultural and Biosystems Engineering, Iowa State University.
75
hectares (14.9% of Malaysian land mass) of agricultural land (Basiron, 2007). These practices
generate residues in the range of 20 to 70% of the raw material input (Lacrosse and Shakya,
2004) indicating the vast amount of biomass that would otherwise be discarded and pose
environmental issues. Crucially, open burning of agricultural residues is a prevalent practice
among South East Asian countries, which leads to the yearly-occurrence of smog and haze
across the region and resulting in decreased air quality (Afroz et al., 2003).
Tropical fruits play an important role in the nation’s agroindustry with durian being the
most highly valued commodity. Total Malaysian fruit production for the year 2011 was 1.6
million Mg from a total crop hectarage of about 230,000 ha (DOA, 2012). Durian, banana and
rambutan are the top three major fruit crops in year 2011, with productions of 360,000 Mg,
306,000 Mg and 63,000 Mg respectively (DOA, 2012). Due to its seasonal and climacteric
nature, tropical fruits like durian face seasonal glut issues that cause oversupply and substantial
loss of income to growers. This creates large volumes of waste from unsold and over-ripened
durians and improper disposal results in environmental issues. Despite increased diversification
of value added products derived from these fruits, post-harvest processing also creates a
considerable waste stream as only 15-30% of the fruit is edible (Brown, 1997). Therefore,
identifying a cost-effective way of managing this waste or preferably finding useful applications
of this waste stream is paramount to the national agenda.
Composting is a viable, simple and comparatively inexpensive method of waste disposal.
Composting can replace landfilling and incineration of waste by transforming organic matter into
a stable product through a biological oxidative process that naturally occurs in soil (Bertoldi et
al., 1983). By definition, it is the exothermic biodegradation of organic waste involving a
76
complex interaction of biochemical reactions and microbial catabolism (Paul and Clark, 1996).
Here, carbonaceous substrates or organic matter in the waste materials are hydrolyzed and
oxidized to produce carbon dioxide and heat, and subsequently conversion into compost. In this
stable and mature form, compost is widely applied in agricultural activities such as agronomic
and horticultural crops in both field and greenhouse settings, forest soil amendment
(silvicultural), and land reclamation applications. (Shiralipour et al., 1992). More recently,
compost is also evaluated for its use as highway embankment erosion control (Glanville et. al,
2004; Bakr et al., 2012) and as a treatment measure for bio-security purposes in response to large
scale emergency livestock mortality (Glanville and Trampel, 1997; Glanville et al., 2006).
Its application as growing media as a substitute for peat is an attractive proposition due to
increasing cost and the inherent environmental impact of peat extraction (Herrera et al., 2008;
Benito et al., 2005). Compost as growing media also benefits the plant where it provides the
necessary organic matter and nutrients as well as containing plant growth regulators and
pathogenic inhibitors (Atiyeh et al., 2002; Tilston et al., 2002).
Composting is a mature process and this is reflected in the vast amount of prior studies
done on a multitude of subjects that range from municipal solid waste to kitchen wastes, and
animal carcasses. However, to the best of the author’s knowledge, composting study on tropical
fruit waste or durian biomass has not been done. In order to capitalize on the potential of durian
biomass and tropical fruit waste in general, ideally it is vital to understand its composting
characteristics. Therefore, this study will evaluate key composting characteristics such as
temperature profiles and carbon dioxide (CO2) production rates observed during the composting
of durian rind at different levels of carbon and nitrogen (C:N) ratios and sample preparation
77
methods. The compost products will then be evaluated through relevant chemical and physical
tests to gauge its viability for greenhouse media applications.
Materials and methods
Material
Frozen Mon Thong or Golden Pillow (Durio zibethinus Murray) durians were used in this
experiment. The fruits were purchased from a local Asian market in Ames, Iowa. These fruits
were harvested before maturity and post-harvest ripening was carried out in storage at room
temperature. Once ripe, the fruits were frozen at -40C (-40F). Then each fruit was individually
placed in plastic netting and packed in corrugated carton boxes. Each box weighs about 12 kg
(25 lb) and contains four to five fruits. The fruits were refrigerated at -18C (0F) during
transport and storage.
The materials used in this experiment were the rinds collected from the fruits. The frozen
fruits were thawed at room temperature for at least 12 hours before separation of the edible pulp
and the rind was done. The fruits were cleaned by brushing their surfaces to remove dirt or other
foreign contaminants. Separation was done manually using a sturdy cleaver or knife to pry open
the fruit. The collected rinds were then randomly divided into three portions. Each portion was
then processed to reduce its size according to its randomly assigned sample preparation method.
The samples were then poured into one-gallon round wide-mouth corrosion resistant HDPE jars
(S-17077, Uline, Pleasant Prairie, WI), where each jar was filled with approximately 800g of
durian rind samples.
78
Ultimate analysis was done using a TRUSPEC-CHN elemental analyzer (TruSpec Micro
CHNS, LECO Corporation, St. Joseph, MI, USA) to determine the C:N ratio of the durian
sample, which was found to be 75:1. Moisture content of the durian rind was determined by oven
drying at 60⁰C for 48 hours. Moisture content was found to be 65% (w.b.).
Experimental set-up
The C:N ratio is an essential factor in composting. By influencing microbial cell growth
and functioning, the process is slowed down if nitrogen is a limiting factor and loss of nitrogen in
the form of ammonia or other compound will occur if the nitrogen content is in excess.
Depending on the material, optimum range of C:N ratio is reported to be around 25-40 (Golueke,
1991). Addition of manure or food scraps are usual sources of nitrogen in common compost
processing. For this particular experiment, in order to simulate conditions in Malaysia and
eliminate possible variation in the characteristics of manure sourced locally compared to those
available in Malaysia, urea is chosen due to is ubiquity and explicit nitrogen content that will aid
replication in Malaysia and calculation of C:N ratios. The different C:N ratios will enable the
observation of the effect of different nitrogen content on the compost process. The experiment
was designed to test three types of sample preparation methods and three C:N ratios, with three
replications.
Due to the recalcitrance and rigidity of the durian rind structure, a suitable method of size
reduction is essential with regards to the process management, cost and particularly how it will
affect the composting process. Particle size of the material is essential for microbial activity and
airflow, where smaller sizes will result a in larger surface area, therefore enabling the microbes
79
to access more substrates and oxygen (Cooperband, 2000). Particle size selection is usually a
compromise between achieving high rates of aeration to facilitate the aerobic process and at the
same time ensuring adequate surface area for the aerobic decomposition to occur. Based on
several studies, the optimal particle size should be between 3 to 50 mm (Gray and Biddlestone,
1974; Hamoda et al., 1998; Snell, 1991; Wilson, 1993).
The three methods chosen for this study incorporate common methods and equipment
that can easily be applied in Malaysia. For the three sample preparation methods selected for this
study, the first method (cube) was to manually cut the rind into 25-mm (1-inch) cubes. The
second method (knifemill) was to use a cutting mill (Heavy-Duty Cutting Mill SM 2000, Retsch
GmbH) with a 20-mm screen, and lastly (Fitzmill) a comminutor mill (Fitzpatrick 5 HP Stainless
Steel Fitz Mill, Fitzpatrick Co.) with a 30-mm screen.
The three levels of C:N ratios selected were 10:1, 30:1, and 50:1. Different levels of C:N
ratios were achieved by adding urea (46-0-0) calculated using the following formula;
𝑅𝑎𝑡𝑖𝑜 =𝑄𝑑𝑢𝑟𝑖𝑎𝑛(𝐶𝑑𝑢𝑟𝑖𝑎𝑛 × 100 − 𝑀𝑑𝑢𝑟𝑖𝑎𝑛) + 𝑄𝑢𝑟𝑒𝑎(𝐶𝑢𝑟𝑒𝑎 × 100 − 𝑀𝑢𝑟𝑒𝑎)
𝑄𝑑𝑢𝑟𝑖𝑎𝑛(𝑁𝑑𝑢𝑟𝑖𝑎𝑛 × 100 − 𝑀𝑑𝑢𝑟𝑖𝑎𝑛) + 𝑄𝑢𝑟𝑒𝑎(𝑁𝑢𝑟𝑒𝑎 × 100 − 𝑀𝑢𝑟𝑒𝑎)
Where:
Q = mass of material
C = carbon (%)
N = nitrogen (%)
M = moisture content (%) of the material
80
Moisture content for urea was assumed to be negligible (0 % w.b.) and by plugging in
the mass of durian samples used (10-kg) and the respective carbon, nitrogen and moisture
contents, the mass of urea needed for 10:1, 30:1, and 50:1 C:N ratio levels was calculated to be
200g, 50g, and 13g respectively.
Experimental Chamber
Composting needs to occur at a specific temperature and moisture content to enable
thermophilic microbes to breakdown the organic materials. Optimal conditions for composting
were found to be in the range of 52-60⁰C ((Bach et al., 1984; McKinley and Vestal, 1984), with
moisture content of the material at 50-60% (Tiquia et al., 1998; McKinley et al., 1986; Suler and
Finstein, 1977). Temperature and relative humidity is generally high throughout the year in
Malaysia. Annual temperature range is around 23-33⁰C with a relative humidity range of 70-90%
(McGinley, 2011). In order to simulate climate conditions similar to those found in Malaysia, as
well as providing an optimal composting environment, a controlled environment chamber model
IUF3050A (Puffer-Hubbard, MI) was used to house the compost jars. The temperature in the
chamber was maintained at 27⁰C ±2 (80F ±3) using a fan powered space heater (Sunbeam
SFH442-WM1, Sunbeam Products, Inc.). Relative humidity was maintained at 80% ± 5 using an
evaporative humidifier (Essick Air MA0800 Digital Humidifier, Essick Air Products, Inc. AR,
USA).
Temperature and carbon dioxide production rate
During the composting process, temperature and carbon dioxide production rate was
measured every two days after the jars were thoroughly shaken. Duration of the composting
81
process is dependent on when it achieves stability and maturity. Evaluation of stability and
maturity are based on the metabolic activity of the microbes involved in the degradation of the
organic material that can be determined by a drop in compost temperature (Flynn and Wood
1996) and a decline in carbon dioxide respiration rate (Switzenbaum et al., 1997; TMECC,
2002). Temperature was recorded using temperature recorders (TRIX-8 LogTag Temperature
Data Recorder, MicroDAQ.com, Ltd., NH 03229 USA) that were placed in each jar and in the
experimental chamber to observe the respective temperature profiles. Carbon dioxide production
rate was recorded using a carbon dioxide sensor (PASPORT Carbon Dioxide Gas Sensor,
PASCO Scientific, CA 95747 USA). CO2 production rates (ppm/s) were recorded by placing the
probes in the plastic jar for two minutes and the rate determined by the slope was recorded.
Analysis of compost
Compost samples were sent to the Iowa State University Soil and Plant Analysis Lab to
determine pH, electrical conductivity, and water-dissolved macronutrients (phosphorous,
potassium, calcium, and magnesium). Statistical analysis was done on SAS v9.2 (SAS Institute,
Cary, NC). Removal of outliers for percent Zn was necessary to compare treatment means.
Results and Discussion
Temperature
Metabolism and population dynamics of microbes are highly dependent on temperature
during composting (Namkoong and Hwang, 1997; Joshua et al., 1998). For the composting
process to be effective, a minimum temperature must be attained to achieve high rates of
decomposition (Finstein and Morris, 1975; Finstein et al., 1986; Miller, 1992). Based on several
82
studies, a temperature range of 52-60 ⁰C is optimal for the composting process (MacGregor et
al., 1981; Bach et al., 1984; McKinley and Vestal, 1984). However, it is also worth to note that
optimal composting temperature varies with different composting material type and process
control and it is possible to achieve high microbial activity at lower temperatures (Suler and
Finstein, 1977). Furthermore, Miller et al. (1990) found that composting at moderately
thermophilic temperatures (47-54 ⁰C) also produces good quality compost.
Figure 10(A) to (D) summarize the temperature profiles for all three C:N ratios and
control that were observed during the experiment. The temperature in the chamber was set at
30°C throughout the experiment and any increase in temperature is assumed to be induced by the
heat generated from the composting process. In general, all four groups showed positive
deviations from the chamber temperature up to the 11th day, which indicates that heat was
generated in experimental compost jars. The highest temperature observed in all groups was
38.2°C which is well below the optimal range of 52-60 °C or the more moderate thermophilic
range of 47-54°C. Based on these observations, it seems that the initial mesophilic stage (10-
45°C) was allowed to commence but the pile did not reach the next stage of process, where
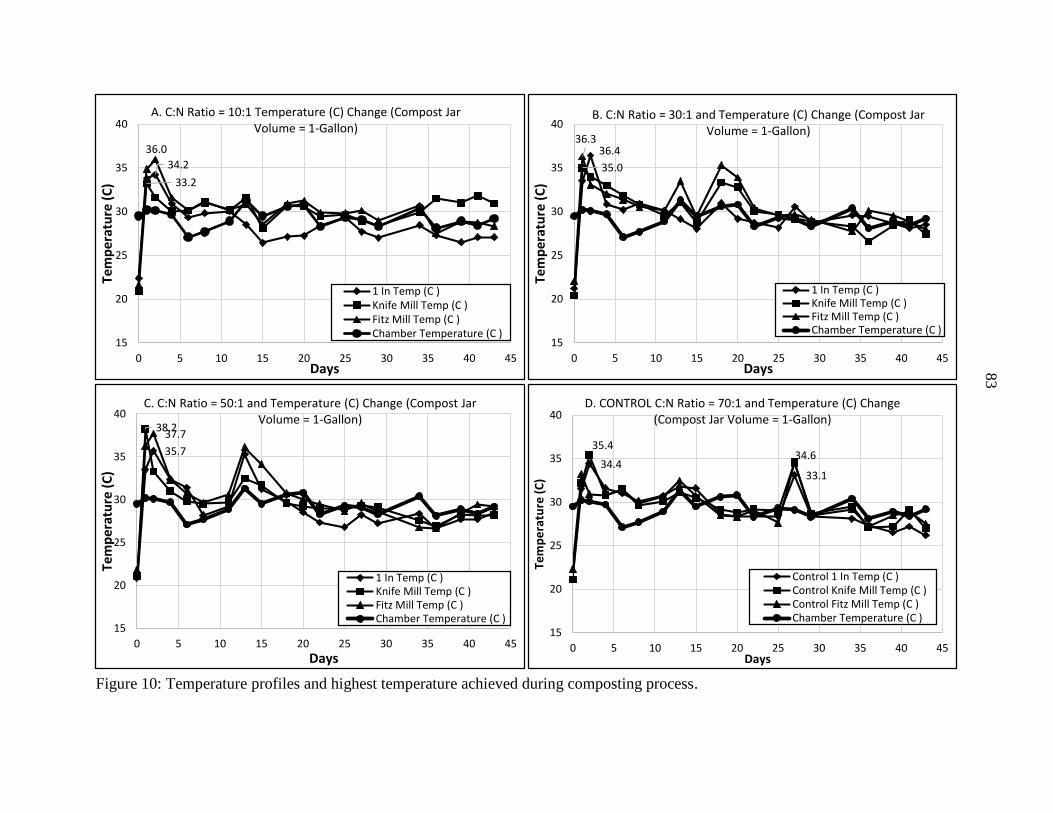
83
Figure 10: Temperature profiles and highest temperature achieved during composting process.
34.2
33.2
36.0
15
20
25
30
35
40
0 5 10 15 20 25 30 35 40 45
Tem
per
atu
re (
C)
Days
A. C:N Ratio = 10:1 Temperature (C) Change (Compost Jar Volume = 1-Gallon)
1 In Temp (C )Knife Mill Temp (C )Fitz Mill Temp (C )Chamber Temperature (C )
36.4
35.0
36.3
15
20
25
30
35
40
0 5 10 15 20 25 30 35 40 45
Tem
per
atu
re (
C)
Days
B. C:N Ratio = 30:1 and Temperature (C) Change (Compost Jar Volume = 1-Gallon)
1 In Temp (C )Knife Mill Temp (C )Fitz Mill Temp (C )Chamber Temperature (C )
35.7
38.237.7
15
20
25
30
35
40
0 5 10 15 20 25 30 35 40 45
Tem
per
atu
re (
C)
Days
C. C:N Ratio = 50:1 and Temperature (C) Change (Compost Jar Volume = 1-Gallon)
1 In Temp (C )Knife Mill Temp (C )Fitz Mill Temp (C )Chamber Temperature (C )
34.433.1
35.434.6
15
20
25
30
35
40
0 5 10 15 20 25 30 35 40 45
Tem
pe
ratu
re (
C)
Days
D. CONTROL C:N Ratio = 70:1 and Temperature (C) Change (Compost Jar Volume = 1-Gallon)
Control 1 In Temp (C )Control Knife Mill Temp (C )Control Fitz Mill Temp (C )Chamber Temperature (C )
84
oxidation of carbon compounds will produce heat to move the process to the thermophilic stage
(45-75°C). The initial volume of the compost pile in the experimental jar was about 6.7 cm3
(6.7x10⁻³ m3) and this is considerably smaller than the critical volume of 0.76 m3 for compost
piles to heat up and retain heat (Cooperband, 2000). Therefore, the lower maximum temperature
observed may be caused by the combination of reduced organic material, microflora, and thermal
insulation as seen in bigger piles.
When comparing the temperature profiles of the different C:N ratios and the control, the
10:1 (Figure 10(A)) was observed to have just one temperature spike compared to the other
groups that had multiple spikes. Nitrogen supply to the compost will either cause nitrogen uptake
by the microbes through nitrogen immobilization or release through mineralization in the form of
ammonia gas. Mineralization occurs at a C:N ratio of 20:1 or lower (Cooperband, 2000). A
strong ammonia stench was observed in the chamber during the initial two weeks of the
experiment and this seemed to confirm that some portion of nitrogen was lost and the
decomposition process was relatively inhibited in the 10:1 ratio group. The multiple temperature
peaks in the 30:1 and 50:1 ratio group may also indicate that nitrogen availability to the microbes
was limited and due to rigorous mixing and shaking of the jar, where some pockets/clusters of
material came into contact with the urea later in the experiment. As seen in Figure 11, the carbon
dioxide evolution profile seemed to concur with this observation due to the lower overall carbon
dioxide reading in the jar.
Particle size affects moisture retention, free air space (Jeris and Regan, 1973) and
porosity of the compost mixture (Naylor, 1996). Based on the results, the different profiles may
indicate some effect of the different preparation methods used in this experiment. For the other
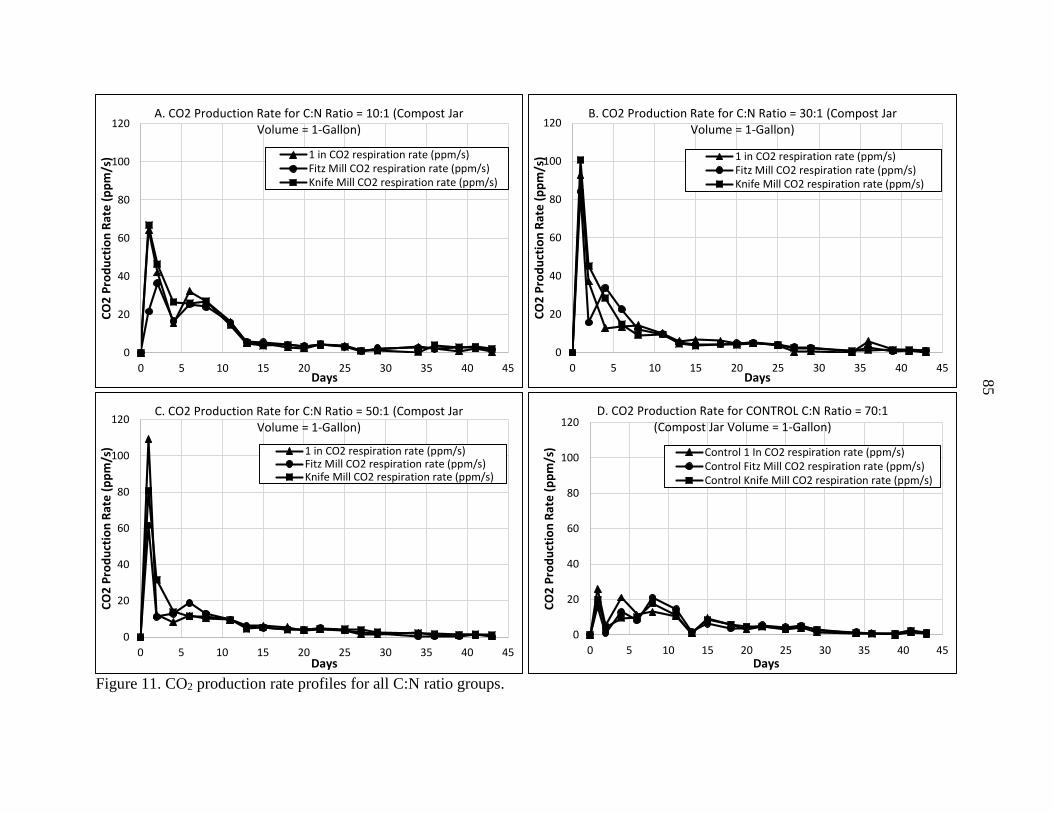
85
Figure 11. CO2 production rate profiles for all C:N ratio groups.
0
20
40
60
80
100
120
0 5 10 15 20 25 30 35 40 45
CO
2 P
rod
uct
ion
Rat
e (
pp
m/s
)
Days
D. CO2 Production Rate for CONTROL C:N Ratio = 70:1 (Compost Jar Volume = 1-Gallon)
Control 1 In CO2 respiration rate (ppm/s)Control Fitz Mill CO2 respiration rate (ppm/s)Control Knife Mill CO2 respiration rate (ppm/s)
0
20
40
60
80
100
120
0 5 10 15 20 25 30 35 40 45
CO
2 P
rod
uct
ion
Rat
e (
pp
m/s
)
Days
A. CO2 Production Rate for C:N Ratio = 10:1 (Compost Jar Volume = 1-Gallon)
1 in CO2 respiration rate (ppm/s)Fitz Mill CO2 respiration rate (ppm/s)Knife Mill CO2 respiration rate (ppm/s)
0
20
40
60
80
100
120
0 5 10 15 20 25 30 35 40 45
CO
2 P
rod
uct
ion
Rat
e (
pp
m/s
)
Days
B. CO2 Production Rate for C:N Ratio = 30:1 (Compost Jar Volume = 1-Gallon)
1 in CO2 respiration rate (ppm/s)Fitz Mill CO2 respiration rate (ppm/s)Knife Mill CO2 respiration rate (ppm/s)
0
20
40
60
80
100
120
0 5 10 15 20 25 30 35 40 45
CO
2 P
rod
uct
ion
Rat
e (
pp
m/s
)
Days
C. CO2 Production Rate for C:N Ratio = 50:1 (Compost Jar Volume = 1-Gallon)
1 in CO2 respiration rate (ppm/s)Fitz Mill CO2 respiration rate (ppm/s)Knife Mill CO2 respiration rate (ppm/s)
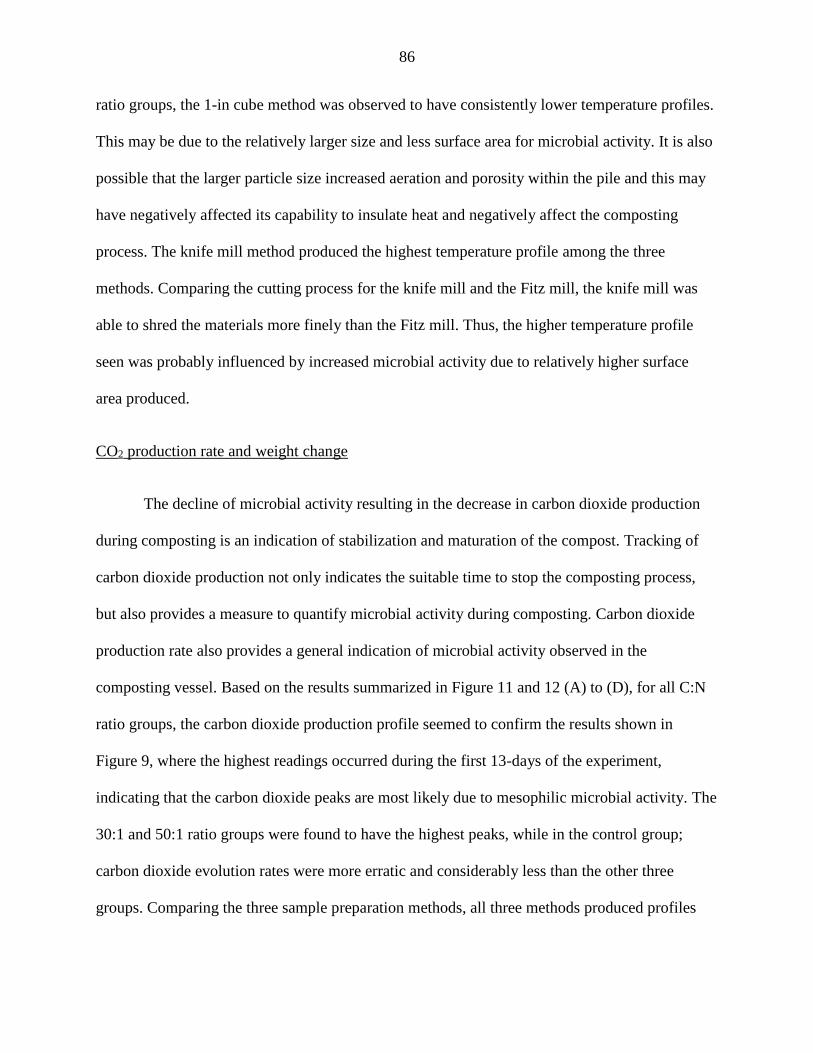
86
ratio groups, the 1-in cube method was observed to have consistently lower temperature profiles.
This may be due to the relatively larger size and less surface area for microbial activity. It is also
possible that the larger particle size increased aeration and porosity within the pile and this may
have negatively affected its capability to insulate heat and negatively affect the composting
process. The knife mill method produced the highest temperature profile among the three
methods. Comparing the cutting process for the knife mill and the Fitz mill, the knife mill was
able to shred the materials more finely than the Fitz mill. Thus, the higher temperature profile
seen was probably influenced by increased microbial activity due to relatively higher surface
area produced.
CO2 production rate and weight change
The decline of microbial activity resulting in the decrease in carbon dioxide production
during composting is an indication of stabilization and maturation of the compost. Tracking of
carbon dioxide production not only indicates the suitable time to stop the composting process,
but also provides a measure to quantify microbial activity during composting. Carbon dioxide
production rate also provides a general indication of microbial activity observed in the
composting vessel. Based on the results summarized in Figure 11 and 12 (A) to (D), for all C:N
ratio groups, the carbon dioxide production profile seemed to confirm the results shown in
Figure 9, where the highest readings occurred during the first 13-days of the experiment,
indicating that the carbon dioxide peaks are most likely due to mesophilic microbial activity. The
30:1 and 50:1 ratio groups were found to have the highest peaks, while in the control group;
carbon dioxide evolution rates were more erratic and considerably less than the other three
groups. Comparing the three sample preparation methods, all three methods produced profiles
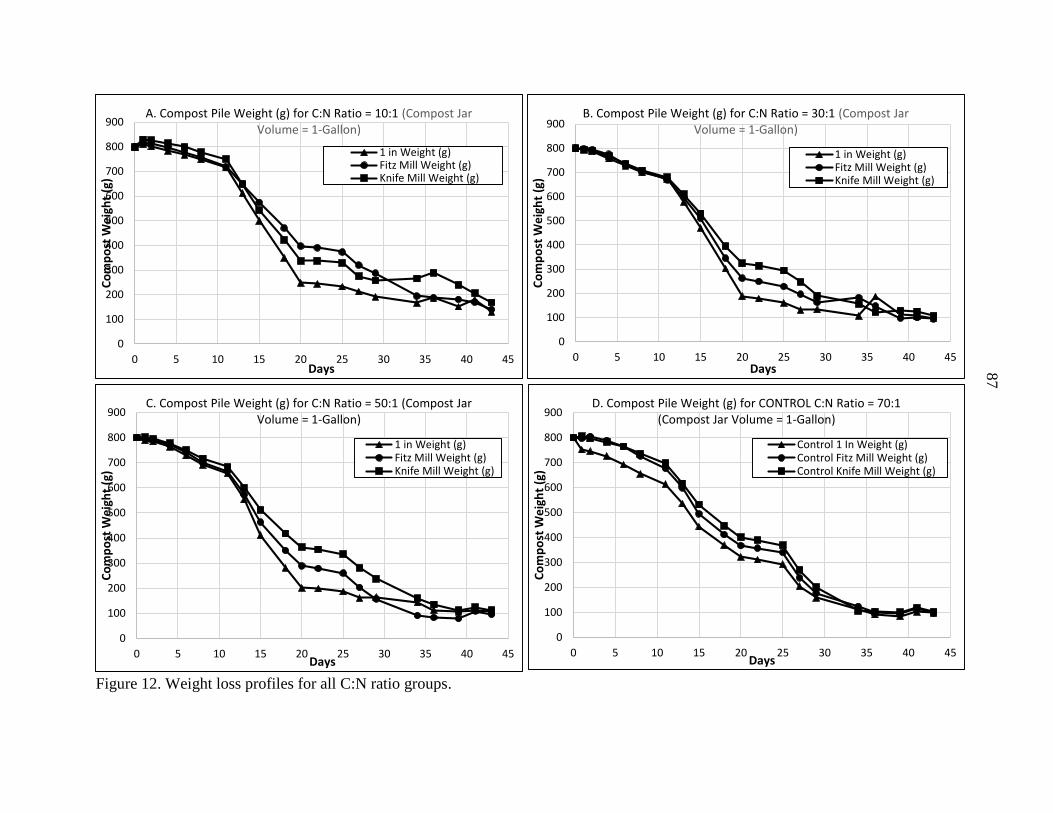
87
Figure 12. Weight loss profiles for all C:N ratio groups.
0
100
200
300
400
500
600
700
800
900
0 5 10 15 20 25 30 35 40 45
Co
mp
ost
We
igh
t (g
)
Days
D. Compost Pile Weight (g) for CONTROL C:N Ratio = 70:1 (Compost Jar Volume = 1-Gallon)
Control 1 In Weight (g)Control Fitz Mill Weight (g)Control Knife Mill Weight (g)
0
100
200
300
400
500
600
700
800
900
0 5 10 15 20 25 30 35 40 45
Co
mp
ost
We
igh
t (g
)
Days
C. Compost Pile Weight (g) for C:N Ratio = 50:1 (Compost Jar Volume = 1-Gallon)
1 in Weight (g)Fitz Mill Weight (g)Knife Mill Weight (g)
0
100
200
300
400
500
600
700
800
900
0 5 10 15 20 25 30 35 40 45
Co
mp
ost
We
igh
t (g
)
Days
B. Compost Pile Weight (g) for C:N Ratio = 30:1 (Compost Jar Volume = 1-Gallon)
1 in Weight (g)Fitz Mill Weight (g)Knife Mill Weight (g)
0
100
200
300
400
500
600
700
800
900
0 5 10 15 20 25 30 35 40 45
Co
mp
ost
We
igh
t (g
)
Days
A. Compost Pile Weight (g) for C:N Ratio = 10:1 (Compost Jar Volume = 1-Gallon)
1 in Weight (g)Fitz Mill Weight (g)Knife Mill Weight (g)
88
that generally follow the same trends albeit with marginal peak height in some cases.
Viewing the weight change profile in Figure 12, the pile weight started to level off after
day 34 for all groups. In general, all three C:N ratio groups and control group did not differ much
in terms of weight change during the composting process. However, it is hard to discount the
influence of drying during the composting process unless periodical moisture content sampling
was conducted. Cubed samples were found to lose weight more rapidly than other methods.
Based on the carbon dioxide production rate in Figure 11, this may be due to higher aeration
rates within the pile and possible drying out of the material.
Analysis of Compost
Depending on its use, compost characteristics such as pH, moisture content, soluble salt
content and nutrient content are vital indicators of its quality and suitability (US Composting
Council, 2001). This information will be used to determine if further adjustment or addition of
supplemental nutrients should be done to promote optimal plant growth.
Compost contains different minerals that a plant needs in different amounts. It is
normally divided into three categories: primary macronutrients (N, P and K), secondary
macronutrients (Ca, Mg, Na and S) and micronutrients (B, Cl, Cu, Fe, Mn, Mo and Zn).
Typically, macronutrients are required in greater amounts than micronutrients (Brinton, 2000).
Table 1 lists the mean water soluble macronutrients available in the compost compared to the
recommended levels suggested by CEC (1986). Due to its solubility in water, it is more
accessible and more readily absorbed by the plant roots to supplement its growth.
89
Looking at the results obtained in Table 13, the amount of nutrients available to the plants
are generally lower than the amount recommended by the CEC. This low amount may affect the
overall growth of the plants and may result in stunted growth (Morgan 1998) or deformation of
flowers (Eysinga et al., 1980). Lower amounts of macronutrients were also reported by Kala et
al. (2009) in their study on oil palm wastes composting. It was suggested that addition of other
materials such as sludge compost can increase or improve these numbers. Nutrient supplement is
essential in compost application as the levels of nutrients in most compost are not sufficiently
high to provide adequate nutrients for horticultural plants (Chaney et al., 1980; Hue and
Sobieszczyk, 1999).
Results for the quantities of nutrients were not expected to be different because only
durian rinds were used except for the addition of urea. From Table 13, some variability was
found in the amount of nutrient content for K, Mg and Zn for the different treatments. This
discrepancy may possibly be caused by the difficulty in preparing the sample for chemical
analysis due to the rigid and recalcitrant structure of the durian rind. Because the analysis
requires washing the compost with distilled water and quantifying the nutrient absorbed by the
filtrate, the cubed samples were harder to breakdown and this resulted in less surface area for
contact with the distilled water. Hence, values obtained for the cubed samples were generally
lower than the other treatments. Furthermore, different parts of the rind may contain different
amount of macronutrients as observed by Kala et al. (2009) where different parts of the oil palm
waste were found to have different amounts of macronutrients.
90
Table 13. Mean water soluble macronutrients for all treatment levels compared to the
recommended CEC (1986) values.
C:N Size P (%) K (%) Ca (%) Mg (%) Zn (%)
10:1 Cube 0.1a 1.0c 0.002c 0.026c 0.001c
10:1 Fitz Mill 0.1a 1.6bc 0.003abc 0.047abc 0.003ab
10:1 Knife Mill 0.1a 1.5bc 0.004abc 0.050ab 0.001ab
30:1 Cube 0.1a 1.6bc 0.003abc 0.047abc 0.003ab
30:1 Fitz Mill 0.1a 3.3a 0.004ab 0.048abc 0.002ab
30:1 Knife Mill 0.1a 2.4abc 0.005a 0.054a 0.002ab
50:1 Cube 0.1a 1.5bc 0.002bc 0.028bc 0.001ab
50:1 Fitz Mill 0.1a 2.5ab 0.003abc 0.037abc 0.003ab
50:1 Knife Mill 0.1a 2.4abc 0.003abc 0.041abc 0.005ab
Control Cube 0.1a 1.2bc 0.002bc 0.022c 0.001ab
Control Fitz Mill 0.1a 2.1abc 0.003abc 0.036abc 0.002ab
Control Knife Mill 0.1a 3.1a 0.005a 0.057a 0.008a
Recommended 0.5 0.3 2.0 0.3 n/a
Means with the same letters are not significantly different
For application as greenhouse media, essential quality indicators such as pH, electrical
conductivity, moisture content, particle size, stability and maturity of the compost must be in a
certain range (US Composting Council, 2001; Stoffella and Kahn, 2001). Table 14 lists values of
pH, electrical conductivity and final moisture content for the compost produced from this
experiment, compared to the recommended range suggested by the US Composting Council
(2001). Based on the results summarized in Figure 10 to 12, the compost is assumed to be stable
and mature except for the treatment controls, where it is suspected that based on the result
profiles, sufficient decomposition was not achieved. In terms of the particle size of the compost,
all samples except the cubed samples passed the ½-inch screen test.
The final pH range is highly dependent upon materials used, addition of amendments and
the composting process itself (Stoffella and Kahn, 2001). Very high or low pH can negatively
91
affect plant growth and development, as well as injuring the roots. In general, the pH values were
found to be on the high side for all treatments. Only the first treatment combination (10:1, Cube)
was found to be within the recommended range. Compost obtained from 10:1 C:N ratios were
found to be lower than other C:N ratio groups. Conversion of urea into ammonia and its release
as described earlier may have caused the lower pH value. To condition this compost for
application as greenhouse media, high levels of pH can be reduced with the addition of elemental
sulfur (S), but it must be in a very fine form in to ensure its effectiveness (Marfa et al., 1998).
Electrical conductivity (EC) is used to measure the ability of the soluble ions to conduct
electricity. This will indicate the amount of soluble salts available in a compost sample.
Excessive salt content, particularly sodium and chloride, can be phytotoxic to the plant (US
Composting Council, 2001). Based on the results in Table 14, the soluble salts are low in the
compost samples as indicated by the low values of electrical conductivity in all samples.
Moisture content affects handling, storage and transportation of the compost. High
moisture compost can increase transportation cost due to reduced bulk density and also cause
handling issues, where dry compost (<35% moisture) can be dusty and irritating, and wet
compost (>55% moisture) can cause clumpyness. From Table 14, moisture content observed for
all compost samples, except the first two treatment combinations (10:1, Cube; 10:1, Fitz Mill)
were found to be within the recommended range.
92
Table 14. Summary of means of essential compost quality parameters compared to the range
recommended by US Composting Council (2001).
C:N Size pH Electrical
Conductivity
(dS/cm)
Moisture
(% w.b.)
Particle Size
10:1 Cube 7.9d 0.04c 28.0c No
10:1 Fitz Mill 8.8bc 0.06ab 28.9c Yes
10:1 Knife Mill 8.5cd 0.06ab 45.1ab Yes
30:1 Cube 9.3ab 0.07ab 46.6a No
30:1 Fitz Mill 9.7a 0.10a 48.5ab Yes
30:1 Knife Mill 9.3ab 0.08ab 37.2ab Yes
50:1 Cube 9.6a 0.06ab 34.3ab No
50:1 Fitz Mill 9.8a 0.09a 36.8ab Yes
50:1 Knife Mill 9.6a 0.06ab 35.4ab Yes
Control Cube 9.8a 0.06ab 50.0ab No
Control Fitz Mill 9.6ab 0.09ab 42.3ab Yes
Control Knife Mill 9.8a 0.11a 51.9a Yes
Recommended for
greenhouse media
5.5 to 8.0 < 3.0 35 to 55 Pass through
1/2–inch screen
Means with the same letters are not significantly different
Based on the criteria recommended by the Composting Council (US Composting Council
2001), comparison of the results in Table 14 is illustrated in Table 15. Each treatment
combination was assessed based on the recommended range. Attributes that fell within the range
were assigned with check marks (). Conversely, ‘x’ marks () were assigned to attributes that
were outside the recommended range. This tabulated result can then be used in relation to the
observations gathered from the temperature (Figure 10), carbon dioxide evolution (Figure 11)
and weight (Figure 12) profiles to narrow down plausible treatment combinations that can
produce good composting process and product. The assessment can then proceed with
elimination of treatment combinations that indicate retarded composting process with the most
amount of attributes outside the recommended range.
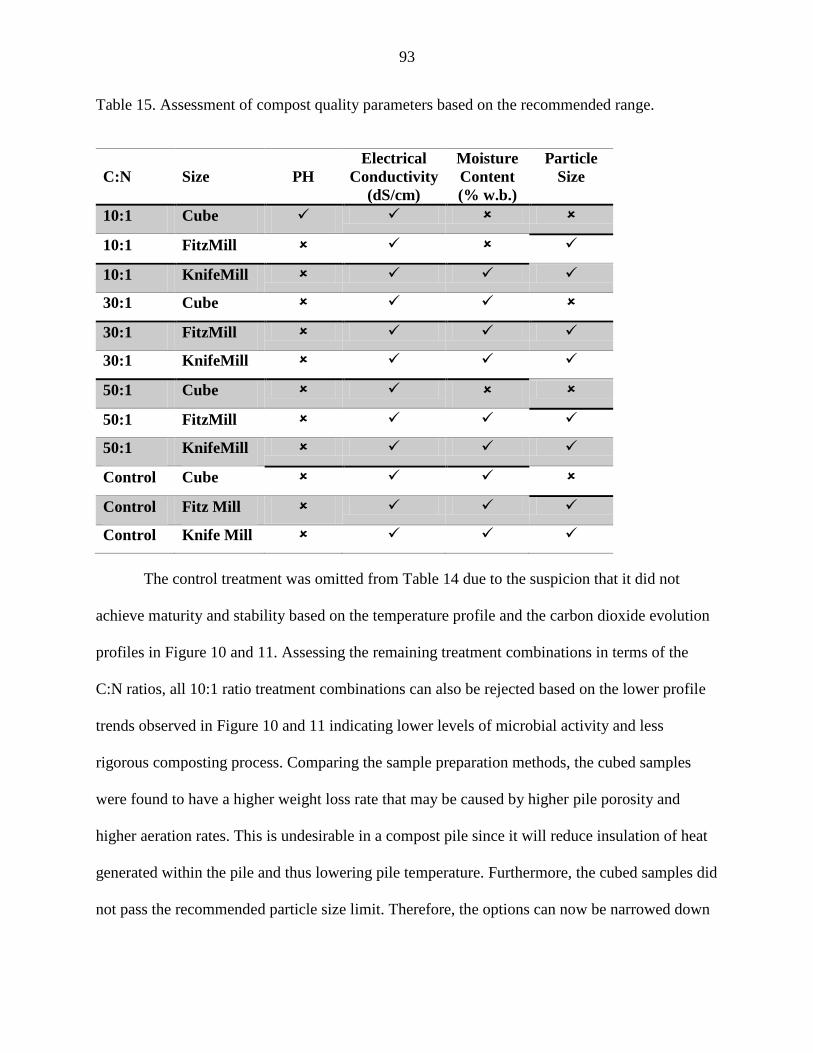
93
Table 15. Assessment of compost quality parameters based on the recommended range.
C:N Size PH
Electrical
Conductivity
(dS/cm)
Moisture
Content
(% w.b.)
Particle
Size
10:1 Cube
10:1 FitzMill
10:1 KnifeMill
30:1 Cube
30:1 FitzMill
30:1 KnifeMill
50:1 Cube
50:1 FitzMill
50:1 KnifeMill
Control Cube
Control Fitz Mill
Control Knife Mill
The control treatment was omitted from Table 14 due to the suspicion that it did not
achieve maturity and stability based on the temperature profile and the carbon dioxide evolution
profiles in Figure 10 and 11. Assessing the remaining treatment combinations in terms of the
C:N ratios, all 10:1 ratio treatment combinations can also be rejected based on the lower profile
trends observed in Figure 10 and 11 indicating lower levels of microbial activity and less
rigorous composting process. Comparing the sample preparation methods, the cubed samples
were found to have a higher weight loss rate that may be caused by higher pile porosity and
higher aeration rates. This is undesirable in a compost pile since it will reduce insulation of heat
generated within the pile and thus lowering pile temperature. Furthermore, the cubed samples did
not pass the recommended particle size limit. Therefore, the options can now be narrowed down
94
to treatment combinations involving C;N ratios of 30:1 and 50:1 for both Fitz mill and knife mill.
This is also beneficial from a cost and logistics standpoint as the high C:N ratio indicates that
addition of manure or other nitrogen source is not critical in obtaining good compost.
Furthermore, the inherent concern of pathogenic risk with the use of manure or other biological
waste is also eliminated and lessens the concerns related to safety and health regulations.
Conclusions
Stability and maturity are key factors that ensure successful application of compost.
Temperature and carbon dioxide production profiles can be used to monitor and evaluate the
composting process of durian rind. Decomposition and breakdown of the durian rind was
observed in all treatment combinations at different rates. Temperature and weight change
profiles between the C:N ratios were found to follow similar trends. However, comparing the
profiles for the different sample preparation methods, the cubed samples were found to have
lower temperature and weight change profiles compared to the other two. Although tested
processes did not achieve thermophilic heat rates, this is not crucial as thermophilic temperature
is essential in the destruction of pathogens particularly from manure or human waste, both of
which are not used in this experiment. Carbon dioxide production rate profiles seemed to
indicate that the high C:N ratio seen in the control as unfavorable to providing optimal
conditions for high microbial activity. Similarly, using the same profiles and based on
observations during the experiment, the 10:1 ratio was also found to be unfavorable to the
composting process.
The nutrient content observed from the analysis of the compost indicates that durian rind
compost is suitable for greenhouse media application. However, pH conditioning, nutrient
95
supplement, and particle size reduction are needed to amend and improve its quality. Selection of
the best treatment combination is difficult due to uncertainties seen during composting.
However, based on the observed temperature, weight change and carbon dioxide evolution
profiles, as well as comparison of treatment combinations that fall within the recommended
product attributes, the 30:1 and 50:1 ratios for both Fitz Mill and knife mill methods are seen as
the most plausible treatment combination.
Acknowledgement
This research was made possible through the research funding granted by the Malaysian
Agricultural Research and Development Institute (MARDI).
References
Afroz, R., Hassan, M.N. and Ibrahim, N.A., 2003. Review of air pollution and health impacts in
Malaysia. Environ Res.; 92(2):71-7.
Atiyeh, R. M., Arancon, N. Q., Edwards, C. A., and Metzger, J. D., 2002. The influence of
earthworm-processed pig manure on the growth and productivity of marigolds.
Bioresource technology, 81(2): 103-108.
Bach, P. D., SHODA, M., and KUBOTA, H., 1984. Rate of composting of dewatered sewage
sludge in continuously mixed isothermal reactor. Journal of Fermentation Technology,
62(3): 285-292.
Bach, P.D., Shoda, M. and Kubota, H., 1984. Rate of composting of dewatered sewage sludge in
continuously mixed isothermal reactor. J. Ferment. Technol. 62: 285–291.
Bakr, N., Weindorf, D.C., Zhu, Y., Arceneaux, A.E. and Selim, H.M., 2012. Evaluation of
compost/mulch as highway embankment erosion control in Louisiana at the plot-scale,
Journal of Hydrology, Vol 468–469, 25: 257-267.
Basiron Y., 2007. The palm oil advantage in biofuel. Available from: www.mpoc.org.my.
Benito, M., Masaguer, A., De Antonio, R., and Moliner, A., 2005. Use of pruning waste compost
as a component in soilless growing media. Bioresource technology, 96(5): 597-603.
96
Bertoldi, M.D., Vallini, G. and Pera, A., 1983. The biology of composting. Waste Management
& Research 1: 157-176.
Brinton, W. F. 2000. Compost quality standards and guidelines: an international view. New York
State Association of Recyclers: New York: Wood End Research Laboratory: 15-72.
Brown, M. J., 1997. Durio – a bibliographic review. In R. K. Arora, V. Ramanatha Rao, & A. N.
Rao (Eds.), International Plant Genetic Resources Institute (IPGRI).
CEC—Council of the European Communities.1986. Council directive on the protection of the
environment, and in particular of the soil, when sewage sludge is used in agriculture.
Chaney, R. L., Munns, J. B., and Cathey, H. M. 1980. Effectiveness of digested sewage sludge
compost in supplying nutrients for soilless potting media. Journal of the American
Society for Horticultural Science, 105(4): 485-492.
Cooperband, L. R. (2000). Ce Update—Waste III Composting: Art and Science of Organic
Waste Conversion to a Valuable Soil Resource. Lab Medicine, 31(5): 283-290.
Department of Agriculture (DOA) Peninsular Malaysia, 2012. Fruit crop statistic, Malaysia. BK
99/09.10/250.
Eysinga, J.P., V. Roorda and N.L. Smilde. 1980. Nutritional disorders in Chrysanthemum.
Centre for Agricultural Publishing and Documentation, Wageningen. pp.42.
Finstein, M.S. and Morris, M.L., 1975. Microbiology of municipal solid waste composting. In:
Perlman, D. (Ed.), Advances in Applied Microbiology, Vol. 19. Academic Press Inc.,
New York: 113–151.
Finstein, M.S., Miller, F.C. and Strom, P.F., 1986. Waste treatment composting as a controlled
system. Biotechnology 8: 396–443.
Flynn, R. P., and Wood, C. W., 1996. Temperature and chemical changes during composting of
broiler litter. Compost Science & Utilization, 4(3): 62-70.
Glanville, T. D., & Trampel, D. W., 1997. Composting alternative for animal carcass disposal.
Journal of the American Veterinary Medical Association: 210.
Glanville, T. D., Richard, T. L., Harmon, J. D., Reynolds, D. L., Ahn, H., and Akinc, S., 2006.
Environmental impacts and biosecurity of composting for emergency disposal of
livestock mortalities. Agricultural and Biosystems Engineering Project Reports. Paper 1.
Golueke, C.G., 1991. Principles of composting. In: The Staff of BioCycle Journal of Waste
Recycling. The Art and Science of Composting. The JG Press Inc., Pennsylvania, USA,
pp. 14-27.
97
Gray, K. R., and Biddlestone, A. J. 1974. Decomposition of urban waste. Biology of plant litter
decomposition. Acedemic Pres, London, UK.
Hamoda, M. F., Abu Qdais, H. A., and Newham, J. 1998. Evaluation of municipal solid waste
composting kinetics. Resources, conservation and recycling, 23(4): 209-223.
Herrera, F., Castillo, J. E., Chica, A. F., and López Bellido, L. 2008. Use of municipal solid
waste compost (MSWC) as a growing medium in the nursery production of tomato
plants. Bioresource technology, 99(2): 287-296.
Hue, N. V., and Sobieszczyk, B. A. 1999. Nutritional values of some biowastes as soil
amendments. Compost science & utilization, 7(1): 34-41.
Jeris, J.S and Regan, R.W. 1973. Controlling environmental parameters for optimal composting
II. Compost Sci., 14 (1): 10–15.
Joshua, R.S., Macauley, B.J. and Mitchell, H.J., 1998. Characterization of temperature and
oxygen profiles in windrow processing systems. Compost Sci. Util. 6: 15–28
Kala, D. R., Rosenani, A. B., Fauziah, C. I., and Thohirah, L. A. 2009. Composting oil palm
wastes and sewage sludge for use in potting media of ornamental plants. Malaysian
Journal of Soil Science, 13: 77-91.
Lacrosse L. and Shakya S.K., 2004. Clean and efficient biomass cogeneration technology
ASEAN. Power-Gen Asia conference and exhibition. 5-7 October, Bangkok, Thailand.
MacGregor, S.T., Miller, F.C., Psarianos, K.M. and Finstein, M.S., 1981. Composting process
control based on interaction between microbial heat output and temperature. Appl.
Environ. Microbiol. 41: 1321–1330.
Marfà, O., Tort, J. M., Olivella, C., Cáceres, R., and Martínez, F. X. 1997. Cattle manure
compost as substrate. II-Conditioning and formulation of growing media for cut flower
cultures. International Symposium on Composting & Use of Composted Material in
Horticulture 46 : 305-312.
McGinley, M. 2011. Climate of Malaysia. Retrieved from
http://www.eoearth.org/view/article/151260 on March 21, 2014.
McKinley, V. L., and Vestal, J. R., 1984. Biokinetic analyses of adaptation and succession:
microbial activity in composting municipal sewage sludge. Applied and Environmental
Microbiology, 47(5): 933-941.
McKinley, V. L., Vestal, J. R., and Eralp, A. E., 1985. Microbial activity in composting.
BioCycle (USA).
98
McKinley, V.L. and Vestal, J.R., 1984. Biokinetic analysis of adaptation and succession:
microbial activity in composting municipal sewage sludge. Appl. Environ. Microbiol. 47:
933–941.
Miller, F.C., 1992. Composting as a process based on the control of ecologically selective
factors. In: Blaine-Metting, F. (Ed.), Soil Microbial Ecology: Applications in Agriculture
Environment Management. Marcel Dekker Inc., New York, p. 646.
Miller, F.C., Harper, E.R., Macauley, B.J. and Gulliver, A., 1990. Composting based on
moderately thermophilic and aerobic conditions for the production of commercial
mushroom growing compost. Aust. J. Exp. Agric. 30: 287–296.
Morgan, D.1998. What is Plant Nutrition? Dyna-Gru Corporation, pp. 1-5.
Namkoong, W. and Hwang, E. Y., 1997. Operational parameters for composting night soil in
Korea. Compost Science & Utilization, 5(4): 46-51.
Naylor, L. M. 1996. Composting. Environmental Science and Pollution Control Series 193-269.
Paul, E.A. and Clark F.E., 1996. Soil Microbiology and Biochemistry, 2nd edn. Academic Press.
San Diego, CA.
Persyn, R. A., Glanville, T. D., Richard, T. L., Laflen, J. M., and Dixon, P. M., 2004.
Environmental effects of applying composted organics to new highway embankments:
Part 1. Interrill runoff and erosion. Transactions of the ASAE, 47(2): 463.
Shiralipour, A., McConnell, D.B. and Smith, W.H., 1992. Uses and benefits of MSW compost:
A review and an assessment. Biomass and Bioenergy Vol. 3, (34): 267-279.
Snell, J. R. (1957). Some engineering aspects of high-rate composting. In Proc. ASCE Vol. 83:
1178-1).
Stoffella, P. J., and Kahn, B. A. 2001. Compost utilization in horticultural cropping systems.
CRC press. Chapter 4: 96-120.
Suler, D. J., and Finstein, M. S., 1977. Effect of temperature, aeration, and moisture on CO2
formation in bench-scale, continuously thermophilic composting of solid waste. Applied
and Environmental Microbiology, 33(2): 345-350.
Suler, D.J. and Finstein, M.S., 1977. Effect of temperature, aeration, and moisture on CO2
formation in bench-scale, continuously thermophilic composting of solid waste. Appl.
Environ. Microbiol. 33: 345–350.
Switzenbaum, M. S., Moss, L. H., Epstein, E., Pincince, A. B., and Donovan, J. F., 1997.
Defining biosolids stability. Journal of Environmental Engineering, 123(12): 1178-1184.
99
Tilston, E. L., Pitt, D., and Groenhof, A. C., 2002. Composted recycled organic matter
suppresses soil‐borne diseases of field crops. New Phytologist, 154(3): 731-740.
Tiquia, S. M., Tam, N. F. Y., and Hodgkiss, I. J., 1998. Changes in chemical properties during
composting of spent pig litter at different moisture contents. Agriculture, ecosystems &
environment, 67(1): 79-89.
TMECC. 2002. Organic and biological properties - 05.08 respirometry. In Test Methods for the
Examination of Composting and Compost. Edited by W.H. Thompson, P.B. Leege, P.D.
Millner, and M.E. Wilson. United States Department of Agriculture, and Composting
Council Research and Education Foundation, Holbrook, NY, 05.08-1–05.07-24.
US Composting Council. 1995. Suggested compost parameters & compost use guidelines.
Composting Council, Alexandria, Virginia.
Willson, G.B. 1993. Combining raw materials for composting, p 102-105. In: J. Goldstein (ed.)
The Biocycle Guide to Yard Waste Composting. JG Press, Emmaus, Pennsylvania.
100
CHAPTER 6. GENERAL CONCLUSIONS
The diversification of energy sources through the development of renewable resources in
line with the guidelines of the current Malaysia plan can be seen as a step in the right direction in
securing energy security and environmental conservation. However, a more aggressive stance in
terms of utilizing the abundant biomass resources needs to be pursued. Implementation of
biomass utilization methods can be facilitated by the existing framework within relevant
governmental agencies such as FAMA, DOA, MARDI (Malaysian Agricultural Research and
Development Institute) and PORIM (Palm Oil Research Institute Malaysia).
When compared to Karl Fischer reagent test which was designated as the reference or
standard in this study, HORT 2, BS 2, and NAFTA were found to be the best methods for
producing accurate moisture content tests. These methods produced high reproducibility and the
least percent deviation from the standard KF method. Comparison of these three methods
indicates that HORT 2 method can serve as the easiest and simplest of the three and should be
given precedence.
The three factors chosen (drying time, drying temperature and sample preparation
method) were found to be significantly influencing the accuracy of a moisture test. Ground
samples were found to be more robust in producing accurate readings at different drying times
and temperatures. Cubed and whole samples require adequate drying time and temperature to
remove moisture from the samples. Depending on the process optimization needs, ground
samples dried for two hours can be applied for high turn-around labs, or if handling of the tough
rind is an issue, then the use of whole rind dried at 103°C for 48 hours or 135°C for 24 hours can
be applied instead.
101
Durian biomass was found to display similar physical and chemical characteristics to
other established biorenewable feedstocks such as corn stover or oil palm biomass. Although the
high moisture content of post-harvest durian biomass is seen as a major stumbling block for
thermochemical conversion, the favorable drying climate in Malaysia can potentially be applied
as a cost effective pretreatment method. In terms of its chemical properties, durian biomass is an
attractive feedstock option due to its low ash and comparable calorific value, especially
compared to palm EFB which is widely used in Malaysia. This feature is attractive for the
application of this material in co-firing with coal to produce electricity. For pyrolysis
applications, there are still some uncertainties in terms of its high oxygen content and the
discrepancies with other published results on the fraction of lignocellulosic compounds.
However, the results show that it is comparable to corn and the bio-oil product was chemically
similar to other biomass based on the identification of pyrolysis products.
Temperature and carbon dioxide production profiles can be used to monitor evaluate the
composting process of durian rind, as well as a method of compost maturity indication. A
controlled environment was erected to mimic conditions in Malaysia and found to provide an
adequate environment for composting. Different rates of decomposition and breakdown of the
durian rind was observed in all treatment combinations. The results indicate that higher C:N
ratios and smaller particle size are key parameters that ensure good compost production. The
nutrient content observed from the analysis of the compost indicates that durian rind is suitable
for greenhouse media application. However, pH conditioning, nutrient supplement, and particle
size reduction are needed to amend and improve its quality.
102
Future work
One of the biggest goals in this study was to fill the fundamental gaps in understanding
the potential of utilizing durian biomass as potential feedstock for biorenewable resources. As
acknowledged earlier, this study aims to be the starting point by extending the knowledge and
techniques acquired from this exploratory study of durian biomass to other tropical fruit in
Malaysia. Since there a myriad of other fruits available and some are indigenous to a specific
region in Malaysia, characterization of other tropical fruits will not only further add to the
fundamental insight but also enable the identification of the most suitable conversion route that
can fully utilize a particular feedstock type at the highest efficiency and economic viability.
Extension of this knowledge can also include application of the moisture content test for
durian biomass established in this study for other tropical fruit biomass. It is vital to confirm if
the same test can be applied without considerable loss in accuracy or if it requires a different set
of processing parameters in order to obtain test results with the highest accuracy. The latter
scenario would also include determining if the same levels of treatment can be applied or if it
requires a different approach should its characteristics differ greatly than those considered in this
study.
Future studies can also include further optimization of feedstock selection by way of
assessing different blend or fractions of biomass in order to minimize the effect of a particular
undesirable trait. This include blending fruit biomass with high oxygen content with other fruit
biomass or other types of biomass in order to reduce its O:C ratio. Blending can also be a form of
pretreatment to reduce the overall moisture content of the blend by blending dryer biomass. By
103
studying its thermochemical processing and product properties, favorable results will point
towards avoiding the necessity of drying and its inherent high cost.
Composting of durian biomass in a larger scale can further extend the understanding of
the composting parameters as well as assessing the compost produced. Composting of other
tropical fruit biomass can also be carried out and assessment of composting different types of
fruit biomass blend can also be done. Food processing and livestock research are two other
major research activities carried out in MARDI. Therefore, future research can also include
studying the composting attributes of different blend of tropical fruit biomass with food
processing waste and/or animal waste. As seen in the results of the compost analysis discussed
earlier, blending tropical fruit biomass with these two waste streams can potentially improve its
overall quality such as its nutrient content.
Expansion of this research area will also include assessing the potential of utilizing this
feedstock from an economical perspective. The viability of logistical and processing parameters
and how it converges with its economic feasibility is normally done through techno-economic
analyses. It will be interesting to gauge the performance of utilizing this feedstock either
individually or in lieu with oil palm EFB, and comparing it with existing resources. This will
also provide vital indications of the avenues for optimization in order to fully integrate this
feedstock into the energy mix.