Embed Size (px)
Citation preview

Bangkok, Thailand, 5-13 February 2018
WMO/ASEAN Training Workshop on Weather Radar Data Quality and Standardization
Japan Meteorological Agency
Utilization of Doppler velocity
8 February 2018
Hiroshi Yamauchi Observation Department
Japan Meteorological Agency

Bangkok, Thailand, 5-13 February 2018
WMO/ASEAN Training Workshop on Weather Radar Data Quality and Standardization
Japan Meteorological Agency
Contents
• Issues in using Doppler velocity
– Velocity aliasing
– Doppler velocity pattern
• Applications of Doppler Observations
– Low level wind shear detection
– Mesocyclone detection
– VAD
• Summary

(1) Velocity Aliasing (Folding)
3
• Doppler velocity Vd is determined by Doppler frequency fd .
• However fd is too small to be directly measured. So fd is
measured using phase difference of pulse to next pulse.
• Then maximum measurable Doppler velocity (Vnyq) is
determined by PRF (pulse reputation frequency).
• If true Doppler velocity Vd is larger than Vnyq, Vd is aliased
(folded) to be a value ranging between –Vnyq and +Vnyq .
fd =-2Vd
cf
4max
PRFVVnyq
2
dd
fV

a. fd measurement using phase change
4
The first pulse
The second pulse
time
time
1/PRF (sec)
2pfd = f / (1/PRF) (rad / sec)
f
The first pulse
The second pulse
time
time
1/PRF (sec)
f f
If true phase change f is equal or larger than p, it is aliased to be a value ranging between –p and p.

)(obsVd
)(trueVdnyqVnyqV2 nyqV3nyqVnyqV2nyqV3nyqV4
nyqV4
nyqV
nyqV
5
If the Doppler velocity was folded, the true velocity has a value that is added or subtracted the integer multiple of 2Vnyq.
-2×2Vnyq
-1×2Vnyq
+2×2Vnyq +1×2Vnyq
b. Nyquist velocity

PRF
cr
2max
4
PRFV nyq
Vnyq is inversely proportional to rmax
Range-Doppler Dilemma
Maximum detectable range Maximum detectable velocity
max
1
8 r
cV nyq
const
6
Vnyq becomes smaller when you try to increase rmax
maxr
nyqV
c. Range–velocity ambiguity (Doppler dilemma)
Because the observation limit is highly dependent on the PRF, it is necessary to set correctly the PRF in accordance with the observation purpose.

range
azimuth
High PRF (short pulse interval)
time
Low PRF (long pulse interval)
time
the same pulse interval in the range of 1 degree.
7
d. Dual-PRF method (Dealiasing of Doppler velocities)
Radio wave is transmitted with PRFs changed at regular interval (azimuth of about 1 degree), and you can increase measurable doppler velocity.
Do
pp
ler
velo
city
Observed Doppler velocity
Azimuth
2Vnyq1
2Vnyq1
2Vnyq2
2Vnyq1
2Vnyq1
2Vnyq2
2Vnyq2
・・・
・・・
・・・
・・・
・・・
・・・
・・・
・・・
8 equidistance
・・・
Remind : If the Doppler velocity was folded, the true velocity has a value that is added ±N ×2Vnyq.
If it is assumed that 2 different PRF observed same target, the true Doppler velocity can be estimated from the difference of 2 Doppler velocities obtained by these 2 PRF.
1 time 2 times
3 times 2 times
・・・
a. the concept of dual-PRF method
Unfolded true Doppler velocity
0m/s

9
c. Extended Nyquist velocity
4:5[Hz] 752:[Hz] 940
[m/s] 5.52551.10max V
In dual-PRF method, maximum measurable Doppler velocity is determined by the least common multiple of two frequency.
+20 +10 +30 +40 +50 -40 -50 -30 -20 -10 0 -60 +60 [m/s]
true Doppler velocity
ob
serv
ed
Do
pp
ler
velo
city
[m/s]
0
-10
-20
-30
+10
+20
+30
+40
+50
-40
-50
940Hz (Vmax 13.14m/s) 752Hz (Vmax 10.51m/s) real Doppler velocity
4:5[Hz] 480:[Hz] 600
[m/s] 5.33437.8max V
)(obsVd
)(trueVd

10
b. How to calculate unfold velocity
2222
1111
2
2
nyqobstrue
nyqobstrue
Vnvv
Vnvv
RlroundRln
RlroundRln
2
1 1
212 nyqnyq
obs
VV
vl
where
vtrue1, vtrue2 : true Doppler velocities, vtrue1 ≒vtrue2 vobs1, vobs2 : observed Doppler velocities, vobs= vobs1 - vobs2
Vnyq1, Vnyq2 : Nyquist velocities, Vnyq1:Vnyq2=R : R-1
n1, n2 : Nyquist folding numbers
round : rounding function
vtrue1
vtrue2
Radar

Vd:Doppler velocity
V:Target’s moving velocity
11
Doppler radar can only observe the radial component of target’s velocities.
When θ =0 , Doppler velocity is equal to
target’s moving velocity.
Vd = Vcos(0)=V θ=0°
V
By putting θ as the angle formed by radial
direction and the target’s moving direction,
Doppler velocity(Vd) is expressed as
Vd=Vcosθ Vd
θ
V
θ=90°
When θ=π/2, Doppler velocity is 0.
Vd=Vcos(π/2)=0
V
∟
Vd
Figure as seen from above
Figure as seen from above
Figure as seen from above
(2)Radial velocity
∟

2014/05/12/23:30(JST)@Tokyo radar The 0-line of Doppler Velocity is perpendicular to the real wind direction.
Doppler radar can only observe the radial velocity. Conventionally, positive Doppler velocities are drawn in warm color, in contrast, negative Doppler velocities are drawn in cold color.
Typical pattern of Doppler Velocity (uniform flow)

Divergence wind field
radar site
+
-
0
13
Typical pattern of Doppler Velocity (divergence and vortex)
Vortex wind field
radar site radar site radar site
The 0-line of Doppler Velocity.

14
Hook echo
Tornadic Supercell
radar
Dopple
r ve
locity (
m/s
) R
eflectivity (
dB
Z)
radar
Doppler velocity
pattern of a divergence
radar
Downburst
toward
away
toward
away
Tornado
Downburst
Divergence
Vortex
Doppler velocity
pattern of a vortex
Dopple
r ve
locity (
m/s
) R
eflectivity (
dB
Z)

Applications of Doppler Observations
15
1) Microburst detection
– Airport weather
2) Mesocyclone detection
– Hazardous wind potential nowcast
3) Velocity Azimuth Display (VAD)
– Vertical wind profile

JMA provides low-level wind shear and microburst alerts
in all weather conditions.
Normal Landing Path
ATC Tower
Active Convection Cloud
Microburst
If the airplane could not avoid the microburst, it would be smashed into the ground
due to the sudden decrease of lifting power.
DRAW: Doppler Radar for Airport Weather (a Japanese version of a TDWR)
DRAW (TDWR) detects low-level wind shears in Rainy condition.
Shear Line convergence
Microburst divergence
LIDAR: Light Detection and Ranging
Doppler LIDAR detects low-level wind shears
in Sunny or Cloudy condition.
All Weather Observation
Cancel Landing
Crash
Pilots receive Low-level Wind Shear Alerts
from ATC and cancel Landing
0837 34LA MBA 39kt- 1nm FNL
0837 34LA SLA 25kt+ 3nm FNL
1) Microburst detection
downdraft
divergence
Sw
ee
p d
irectio
n
+
-
Do
pp
ler ve
locity
Range
increasing area
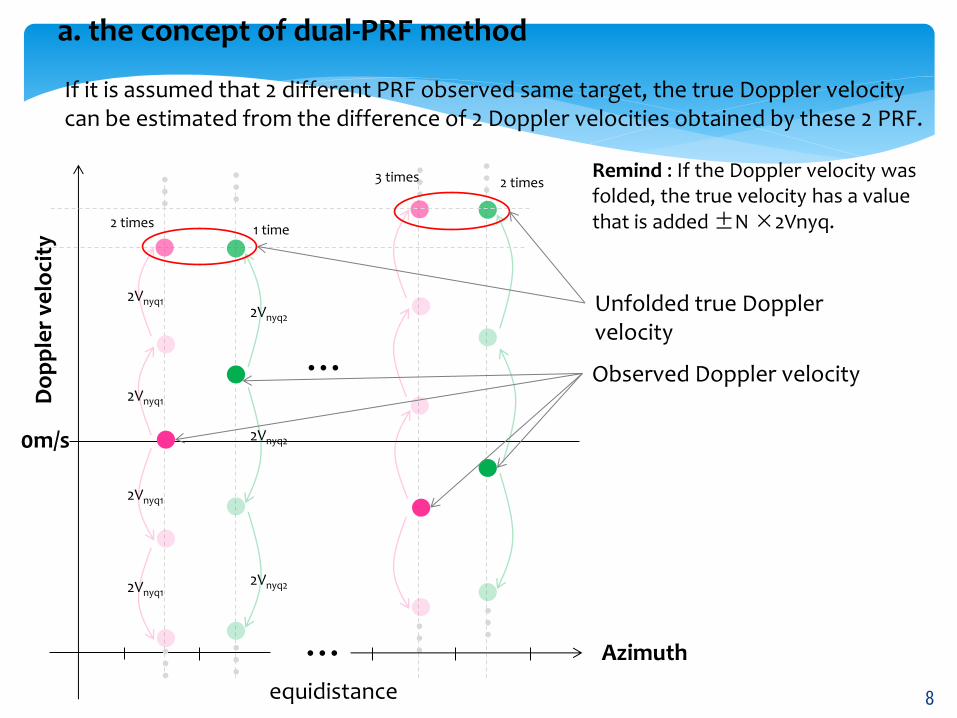
Step1. Define shear segment 1.Search area of incresing Doppler Vel.
2.Start and end shear more than 2.5m/s/450m
3.Maximum velocity difference more than 5m/s
Step3. Define Microburst 1.Area of feature more than 3km2
2.Maximum velocity difference more than 8m/s 3. Time correlation between present detection and past
Step2. Define feature Define feature by combining adjacent segments.
shear segment
feature
start
end velocity difference
17
Detection Algorithm of Microburst in JMA
Step0. QC Error data removal

Example of Microburst Detection
18

Sw
ee
p d
irectio
n
Range
+
-
Do
pp
ler ve
locity
Step1. Radial shear segment
Step2. Azimuthal shear segment
Azimuth
+
-
Do
pp
ler ve
locity
Shear line
Step3. Define feature
Step4. Define shear line
Step5. Wind vector Calculate wind vector in both side of shear line by VVP method
Decreasing area
19
Detection Algorithm of Shear line in JMA
Shear line
Radial shear segment
Azimuthal shear segment
Radial shear segment Azimuthal shear segment
Step0. QC Error data removal
1.Search area of incresing Doppler Vel.
2.Maximum shear more than 2.0m/s/km 3.Maximum velocity difference more than 5m/s
2.Maximum shear more than 0.9m/s/deg.
1.Search area of Doppler Vel. change
Define feature by combining adjacent segments.
1.Length of feature more than 10km. 2. Correlation bettween el=0.7 and 1.1.

Example of Shear Line Detection
20

tornadoes
Potentially tornado-generating vortex (meso-cyclones)
Doppler Weather Radar
Provision of effective information on the risk of tornado outbreaks
Detection of the potential outbreak area of tornadoes/gusts using radar observation data
and numerical prediction results
Radial-wind component 2013/09/02 14:20JST Tokyo-radar
Detection of meso-cyclones A strongly-localized pair of receding winds (warm color) and approaching winds (cold color)
Echo intensity 2013/09/02 14:20JST Tokyo-radar
2) Meso-cyclone Detection
(JMA Web page) http://www.jma.go.jp/en/highresorad/
“Hook”-shaped echo

Example of automatic meso-cyclone detection
Radar Reflectivity
Doppler Velocity
Direction from Radar
Series of detected meso-cyclones
1h before tornado
30min after tornado
August 8, 2003

23
3) Velocity Azimuth Display (VAD)
PPI
Wind
Determine wave form using Least-square method
Courtesy of Kajiwara and Ono

24
3) Velocity Azimuth Display (VAD)
VAD (Nagoya radar) Wind Profiler (Nagoya)
Color shade indicates reflectivity Color shade indicates signal level
Courtesy of Kajiwara and Ono

25
3) Velocity Azimuth Display (VAD)
VAD (Nagoya radar) Wind Profiler (Nagoya)
Color shade indicates vertical shear Color shade indicates vertical shear
Courtesy of Kajiwara and Ono

26
Summary
The maximum measurable Doppler velocity is determined by PRF and wave length.
Dual-PRF method can extend maximum measurable Doppler velocity.
Doppler radar can only observe the radial component of a target’s velocity.
Doppler velocity is useful for
- Detecting low level wind shear
- Detecting meso-cyclone
- Retrieving vertical wind profile (VAD).