Embed Size (px)
Citation preview

Utility Procurement Study: Solar Electricity in the
Utility Market

Utility Solar Procurement Study Team Name/Title Organization Role Mike Taylor Director of Research
Solar Electric Power Association Project Management
Frederick Morse President
Morse Associates, Inc. Project Management
Cynthia Hunt Jaehne Program Manager
Morse Associates, Inc. Project Management
Mark McGree Consultant
Consultant Traditional Procurement Study
Bud Beebe Consultant
Consultant Traditional Procurement Study
Arthur O’Donnell Executive Director
Center for Resource Solutions Innovative Procurement Study
Ray Dracker Technical Director
Center for Resource Solutions Innovative Procurement Study
Andreas Kareles Program Associate
Center for Resource Solutions Innovative Procurement Study
Andrew Nourafshan Program Analyst
Center for Resource Solutions Innovative Procurement Study

3
Solar Electric Power Association The Solar Electric Power Association (SEPA) is a non-profit organization, formed in 1992 as the Utility Photovoltaic Group, with more than 375 utility and solar industry members. From national events to one-on-one assistance, SEPA is the go-to resource for unbiased and actionable solar intelligence. Breaking down information overload into business reality, SEPA takes the time and risk out of implementing solar business plans and helps turn new technologies into new opportunities. SEPA was selected by the US Department of Energy (USDOE) Solar America Initiative to provide Utility Technical Outreach for the initiative. The goal of the Solar America Initiative is to make grid-connected photovoltaic (PV) installations cost-competitive with other utility energy sources via research, development and market transformation activities. For more information about SEPA: www.SolarElectricPower.org For more information about the USDOE Solar America Initiative: www1.eere.energy.gov/solar/solar_america
Acknowledgements SEPA and the Innovative Procurement Study Team would like to thank the members of the Advisory Committee for their support, guidance and input to the procurement studies and this report. This report is based on work supported by the US Department of Energy Office of Energy Efficiency and Renewable Energy through the Solar America Initiative. The associated grant number is DE-FC36-07GO17040, and the project is entitled “Facilitating Utility Use and Integration of Solar Electric Power.” Cover Photos (top to bottom): #1 courtsey of the National Renewable Energy Laboratory #2-4 courtesy of Abengoa Solar #5 courtesy of Cagayan Electric Power and Light Company
Disclaimer This report was prepared as an account of work sponsored by an agency of the United States Government. Neither the United States Government nor any agency thereof, nor any of their employees, makes any warranty, express or implied, or assumes any legal liability or responsibility for the accuracy, completeness, or usefulness of any information, apparatus, product or process disclosed, or represents that its use would not infringe privately owned rights. Reference herein to any specific commercial product, process, or service by trade name, trademark, manufacturer, or otherwise does not necessarily constitute or imply its endorsement, recommendation, or favoring by the United States Government or any agency thereof. The views and opinions of authors expressed herein do not necessarily state or reflect those of the United States Government or any agency thereof.

4
Letter from SEPA Leadership December 2008 Utility and Solar Colleagues,
We are pleased to release a new report, “Utility Procurement Study: Solar Electricity in the Utility Market,” the sixth report that the Solar Electric Power Association (SEPA) has released in 2008.
This year has seen an unprecedented number of utility-scale photovoltaic and concentrating solar thermal project announcements – some 3,000 to 5,000 megawatts over the next five years. However, SEPA believes this is only the cornerstone of what’s to come. The effect of the long-term extension of the federal investment tax credit—which includes eligibility for utilities—combined with the expansion of global solar manufacturing, rapidly declining cost and price curves, and federal and state environmental policies, is laying a foundation for utility solar innovation at unprecedented scales.
SEPA’s new report addresses utilities’ acquisition of large-scale solar, which currently occurs primarily through requests for proposals (RFPs) and subsequent power purchase agreement (PPA) contracts. This report draws best practices from both the utility and solar industries, and provides education and insights for both parties that can lower costs, improve expectations, and streamline efficiency. Additionally, it looks beyond traditional RFP/PPA processes, and investigates other innovative ways utilities can procure large amounts of solar in new and potentially better ways.
The authors of the report have provided specific recommendations for SEPA related to utility personnel education. Traditionally, utilities have been engaged with solar mainly through incentive program managers and distribution engineers. However, as utility-scale solar projects develop, education efforts need to move across the utility into new departments, specifically targeting utility planning and plant engineering personnel. We are pleased to report that SEPA has identified a similar need through internal strategic planning and is responding with new initiatives in 2008 and 2009:
1. SEPA Regional Directors – In July 2008, three regional directors started working full-time in the western, central and eastern parts of the U.S., providing one-on-one assistance to utilities at no cost. If you are a utility, contact SEPA for more information.
2. Fact Finding Missions – In June 2008, SEPA conducted its first fact finding mission, taking 31 utility executives and managers to Germany to see and hear first-hand how a three percent solar penetration level has impacted utilities. The activity was such a success that a similar trip will become part of SEPA’s annual activities.
3. National Utility Solar Conference – SEPA will host a national utility solar conference, featuring content for employees across departments at both investor-owned and consumer-owned utilities.
4. Regional Workshops – In coordination with the regional directors, SEPA will be hosting regional utility solar workshops designed to address more localized issues.
5. Training Courses – SEPA will also begin hosting solar training courses for utility employees.

5
These educational events, and reports such as the “Utility Procurement Study” are examples of how SEPA bridges electric utilities, solar companies, and other stakeholders to push solar forward more tangibly, one real business at a time. From research projects and national conferences to one-on-one counseling and peer matching services, SEPA’s unique joint partnership offers members critical access to key business relationships and unbiased, actionable intelligence needed to make solar practical and profitable in today’s shifting energy landscape.
If you have any suggestions or comments, feel free to contact either of us.
David Rubin Julia Hamm SEPA Board Chairman SEPA Executive Director Pacific Gas & Electric Company Solar Electric Power Association

6
Table of Contents Utility Solar Procurement Study Team .......................................................................................... 2 Solar Electric Power Association .................................................................................................. 3 Acknowledgements ....................................................................................................................... 3 Disclaimer ..................................................................................................................................... 3 Letter from SEPA Leadership ....................................................................................................... 4 Table of Contents .......................................................................................................................... 6 Figures .......................................................................................................................................... 8 Advisory Committee Members ...................................................................................................... 9 Abbreviations .............................................................................................................................. 10 Executive Summary .................................................................................................................... 12 1 Introduction .............................................................................................................................. 14
1.1 The Utility Procurement Studies .................................................................................. 14 1.1.1 Study Objectives ......................................................................................................... 14 1.1.2 Study Descriptions ...................................................................................................... 14 1.1.3 Utility Solar Procurement Study Advisory Committee ................................................. 15
1.2 Solar Energy Benefits ........................................................................................................ 15 1.2.1 Benefits for the Utilities ............................................................................................... 15 1.2.2 Benefits for the Solar Industry .................................................................................... 16 1.2.3 Other Considerations .................................................................................................. 17
1.3 Solar Market Drivers .......................................................................................................... 17 1.3.1 State Requirements .................................................................................................... 17 1.3.2 Current Market and Cost Competitiveness of PV and CSP ........................................ 17
1.4 Utility Procurement ............................................................................................................ 18 1.4.1 Joint Procurement ....................................................................................................... 19
2 Traditional Procurement Study: Acquisition and Contracting ................................................... 20 2.1 Introduction ........................................................................................................................ 20 2.2 The Surveys ...................................................................................................................... 20
2.2.1 About the Surveys ...................................................................................................... 20 2.2.2 The Utility Survey ........................................................................................................ 20
2.2.2.1 Utility Response Analysis ..................................................................................... 21 2.2.2.2 Utility Value Assessment of Solar Attributes ........................................................ 25 2.2.2.3 Utility Familiarity with Solar Generation ............................................................... 25 2.2.2.4 Solar in Planning Models and Generation Variations ........................................... 26 2.2.2.5 Solar Generation Patterns .................................................................................... 27 2.2.2.6 Risk Sharing Between Solar Developers and Utilities .......................................... 27 2.2.2.7 Current Motivation for Utilities to Purchase Large-Scale Solar ............................ 27 2.2.2.8 RFP Terms that Have Led to the Most Disagreements ....................................... 28 2.2.2.9 Utility Confidence in Solar Developers and EPC Contractors .............................. 28 2.2.2.10 What Length of Contracts are Utilities Willing to Sign with Solar Companies? . 29 2.2.2.11 What Effects do the FASB Capital Lease Rules have on RFPs and PPAs?...... 29 2.2.2.12 Why Large-Scale Solar Bids have been Unsuccessful with Utility RFPs ........... 30 2.2.2.13 Regional Differences .......................................................................................... 30 2.2.2.14 Some Overall Perceptions Derived from the Utility Surveys .............................. 30
2.2.3 The Solar Industry Survey .......................................................................................... 31 2.2.3.1 Overview: Solar Industry Response Analysis ...................................................... 31 2.2.3.3 Will the Solar Industry Help Utilities Own Large-Scale Solar Facilities? .............. 32 2.2.3.4 Solar Industry’s Value on the Non-Price Attributes of Solar ................................. 32 2.2.3.5 What Do Solar Companies Get Paid for in PPAs? ............................................... 33

7
2.2.3.6 Solar Company Perceptions about Impediments to Solar Generation Market Penetration ....................................................................................................................... 33 2.2.3.7 Solar Company “Surprises” in PPA Negotiations ................................................. 34 2.2.3.8 Transmission Impediments to Solar PPAs ........................................................... 34 2.2.3.9 To What RFPs Have Solar Companies Responded? .......................................... 34 2.2.3.10 Solar Industry Perceptions to RFP Transparency and Understandability .......... 35 2.2.3.11 Changes in Utility Behavior Recommended by the Solar Industry ..................... 35 2.2.3.12 Where will Solar Companies Bid? ...................................................................... 35 2.2.3.13 Risk Sharing between Solar Developers and Utilities ........................................ 36 2.2.3.14 Management of Contracting Risk by Solar Companies ..................................... 36
2.3 Elimination of Market Barriers ........................................................................................... 36 2.4 Recommended Key PPA Elements ................................................................................... 37
2.4.1 Solar Industry Perspective .......................................................................................... 38 2.4.2 Utility Perspective ....................................................................................................... 38
2.5 Recommended Principles for Solar RFP and PPA Design ............................................... 39 2.6 Conclusions from the Traditional Procurement Study ...................................................... 39
3 Innovative Procurement Study: Procurement and Aggregation Techniques ........................... 41 3.1 Introduction ........................................................................................................................ 41 3.2 Utility Aggregation and Solar Power Collaboratives .......................................................... 42
3.2.1 Opportunities and Drawbacks ..................................................................................... 42 3.2.2 Background and Discussion ....................................................................................... 42 3.2.3 Early Attempts at Collaborations ................................................................................ 42 3.2.4 Current/Evolving Market Situation .............................................................................. 43 3.2.5 Economy of Scale Issues ........................................................................................... 43 3.2.6 Joint Utility Ownership ................................................................................................ 45
3.2.6.1 Joint Development Group .................................................................................... 47 3.2.6.2 Joint Parabolic Trough RFP – New Mexico ......................................................... 49
3.2.8 Issues and Challenges Associated with Joint Commercial Actions ............................ 50 3.3 Large-scale Solar Photovoltaic Acquisition ....................................................................... 51
3.3.1 Opportunities and Drawbacks ..................................................................................... 51 3.3.2 Background and Discussion ....................................................................................... 51 3.3.3 From Demonstration to Grid Operation ...................................................................... 53 3.3.4 Southern California Edison’s PV Deployment Program .............................................. 56 3.3.5 Duke Energy’s Model .................................................................................................. 57 3.3.6 San Diego Gas & Electric’s Solar Energy Project ....................................................... 58 3.3.7 Resistance at the Regulatory Level ............................................................................ 59
3.4 Feed-in Tariffs ................................................................................................................... 60 3.4.1 Opportunities and Drawbacks ..................................................................................... 60 3.4.2 Background and Discussion ....................................................................................... 61
3.4.2.1 PURPA and Standard Offers ............................................................................... 61 3.4.2.2 Solar Pioneers ...................................................................................................... 63
3.4.3 European FiTs ............................................................................................................ 63 3.4.4 North American FiTs ................................................................................................... 64 3.4.5 Potential Federal Legislation ...................................................................................... 67 3.4.6 Strengths of a FiT ....................................................................................................... 67 3.4.7 Critiques of the FiT ..................................................................................................... 68 3.4.8 FiT Conclusions and Considerations .......................................................................... 69
3.5 RPS, Solar Set-asides and REC Markets ......................................................................... 69 3.5.1 Opportunities and Drawbacks ..................................................................................... 69 3.5.2 Background and Discussion ....................................................................................... 69 3.5.3 National and Regional REC Markets .......................................................................... 71

8
3.5.4 New Jersey’s REC Markets ........................................................................................ 72 3.6 E-Procurement and Electronic Auctions ............................................................................ 73
3.6.1 Opportunities and Drawbacks ..................................................................................... 73 3.6.2 Background and Discussion ....................................................................................... 73 3.6.3 Reverse Auctions ........................................................................................................ 74
3.6.3.1 Mixed Experiences ............................................................................................... 76 3.6.3.2 Other Criticisms of Reverse Auctions .................................................................. 77
3.6.4 Reverse Auction Conclusions ..................................................................................... 78 3.7 Forward Procurement Commitment .................................................................................. 78
3.7.1 Opportunities and Drawbacks ..................................................................................... 78 3.7.2 Background and Discussion ....................................................................................... 78
3.8 Conclusions from the Innovative Procurement Study ....................................................... 79 4.0 Overall Conclusions and Recommendations ........................................................................ 80
4.1 Recommendations from the Traditional Procurement Study ............................................. 80 4.2 Recommended Principles for Solar RFP and PPA Design ............................................... 81 4.3 Recommendations from the Innovative Procurement Study ............................................. 82
References .................................................................................................................................. 85 Appendix A: PV Projects Table ................................................................................................... 88 Appendix B: CSP Projects Table ................................................................................................ 90 Appendix C: Traditional Procurement Study Utility Questionnaire Respondent Tables and Comments ................................................................................................................................... 92
Abbreviation Key for the Utility and Industry Questionnaire Tables and Comments ........... 92 Description of Utility Respondents ....................................................................................... 92 Compilation of Utility Questionnaire Responses .................................................................. 93
Appendix D: Traditional Procurement Study Solar Industry Questionnaire Respondent Tables and Comments .......................................................................................................................... 109
Figures Figure 1: Steam Turbine Performance as a Function of Size16................................................... 44 Figure 2: Cost of Solar Trough Power as a Function of Plant Size16 .......................................... 45 Figure 3: Solar Energy Support Mechanisms in State RPSs (as of April 2008) ........................ 70

9
Advisory Committee Members Name/Title Organization Role Mehmet Altin Project Manager
Abencs Engineering, Procurement and Construction
Tandy McMannes VP Business Development
Abengoa Solar Industry (CSP)
Barbara D. Lockwood Manager, Renewable Energy
Arizona Public Service Company
Utility
Larry Stoddard Senior Project Manager
Black & Veatch
Engineering, Procurement and Construction
Bill Rever Manager, Strategic Marketing
BP Solar Industry (PV)
Charlie Ricker SVP Business Development
BrightSource Energy
Industry (CSP)
David Olsen
Center for Energy Efficiency and Renewable Technologies
Non-Stakeholder Advisor: Transmission
Jan Hamrin CEO
HMW International Corp Non-Stakeholder Advisor: Renewable Energy Credits Advisor
Jonathan Forrester Principal, Structured Transactions
Pacific Gas & Electric
Utility
Greg Nelson Director, Advanced Generation Development
Public Service Company of New Mexico
Utility
Gary Nakarado Managing Director
Regulatory Logic Non-Stakeholder Advisor: Regulation Advisor
Jon Bertolino Superintendent of Renewable Generation
Sacramento Municipal Utility District
Utility
Rainer Aringhoff President
Solar Millennium
Industry (CSP)
Katie Sloan Project Manager, Renewable & Alternative Power
Southern California Edison Utility
Greg Ashley Business Development
Sun Edison Industry (PV)
Randy Manion Renewable Resource Program Manager
Western Area Power Administration
Public Power Authority
Carl Weinberg
Weinberg Associates Non-Stakeholder Advisor: ‘At-Large’ Advisor

10
Abbreviations
AC Advisory Committee ACP Alternative Compliance Payment APPA American Public Power Association ART Advanced Renewable Tariff CanSEIA Canadian Solar Energy Industries Association C-BED Community-based Energy Development CCHP Combined cooling, heat and Power CPUC California Public Utilities Commission CSI California Solar Initiative CSP Concentrating Solar Power DOE Department of Energy DRA CPUC’s Division of Ratepayer Advocates Duke Duke Energy Carolinas EEI Edison Electric Institute EIAG Environmental Innovation Advisory Group (UK) EPC Engineering, Procurement and Construction EPRI Electric Power Research Institute E-Procurement Electronic Procurement E-PWR PUC pricing category for pubic water customers ERDA Energy Research and Development Administration E-SRG PUC pricing category for small customer-located systems FCP Forward Commitment Procurement FERC Federal Energy Regulatory Commission FiT Feed-in Tariff GCPV Grid-connected Photovoltaics IEP Independent Energy Producer IOU Investor-Owned Utility JDG Joint Development Group kW Kilowatt LBNL Lawrence Berkeley National Laboratory LEC Levelized Energy Cost; e.g., $/MWh Muni Municipal Utility MW Megawatt NREL National Renewable Energy Laboratory O&M Operations and Maintenance OPM Office of Policy and Management OSEA Ontario Sustainable Energy Association PPA Power Purchase Agreement PSC Public Service Commission PUC Public Utilities Commission PURPA Public Utility Regulatory Policies Act PV Photovoltaic REC Renewable Energy Certificate Renewables Renewable Energy Technologies RFP Request for Proposals RPS Renewable Portfolio Standard Sandia Sandia National Laboratories

11
SCE Southern California Edison SDG&E San Diego Gas & Electric SEGS Solar Electric Generation Station SCCPA Southern California Public Power Authority SEPA Solar Electric Power Association SMUD Sacramento Municipal Utility District SREC Solar Renewable Energy Certificate WECC Western Electricity Coordinating Council

12
Executive Summary Utilities represent the largest potential market for the solar industry. More and more, utilities regard large-scale solar procurement as a resource option to help them meet their strategic needs and/or regulatory mandates. This report details the results of two studies conducted to explore both traditional and innovative methods for the procurement of large-scale solar electricity by the utility market. In the Traditional Procurement Study, requests for proposals (RFPs) and power purchase agreements (PPAs) were examined to uncover what changes might be made to make them better suited to solar energy procurement. The Innovative Procurement Study examined inventive avenues for solar procurement by utilities. In sum, traditional RFPs and PPAs might be improved to better reflect the needs of both utilities and the solar industry, and innovative procurement for solar generation may help utilities find more cost-effective and better methods for acquiring solar power generation. The Traditional Procurement Study This study examined utility RFPs and PPAs to determine how utility procurement and the response by the solar industry might be improved to the benefit of both stakeholder groups. The primary tool used by the consulting team was a set of utility and solar industry surveys that were sent to select representatives of these two groups in an effort to achieve candid feedback of their utility procurement experiences. Additionally, key stakeholders were interviewed to gain more detailed information regarding their traditional procurement experiences with renewable resources. Highlights of the study findings:
To increase solar industry success in RFPs that do not specify solar or renewable technologies, developers should quantify the higher valued non-price attributes, especially environmental attributes, and specifically monetize the value in their responses.
The solar industry should accept that utilities will not typically accept cost escalation, financing or performance risk for large-scale projects, and the industry should look to other options such as joint development or hedging commodities to spread this risk.
Industry and utility comments that utility planners and engineers are less familiar with solar technologies reinforces the need for a utility education program, which should be undertaken by the solar industry and their supportive organizations.
The Innovative Procurement Study This study explored other, potentially innovative, approaches to better facilitate utility solar resource acquisition, and overcome limitations or unnecessary transactions costs of traditional methods. Highlights of the study findings:
Renewable Energy Certificates (RECs) can assist utilities in meeting their renewable energy goals where it is difficult to site sufficient renewable energy capacity, but cannot provide the financial underpinning for fully financing the development of new capacity.
Electronic procurement and reverse auctions may help drive bid costs lower, but need to be tested for large-scale acquisitions and contractual commitments.
Combined purchases, aggregation of demand and joint ownership have been very successful strategies for large-scale utility resource development (for both generation and transmission), but the most successful efforts are aided by already-existing legal utility frameworks that can assist the management of the process. Without these

13
frameworks, new utility consortiums attempting aggregation are encountering significant problems from attrition of participants, changed expectations, and the difficulty of balancing the allocation of risks and rewards.
Though utility procurement remains a complicated picture for renewable energy resources, new models are being developed, and those that prove effective in one region are being adopted in others. In conclusion, the utility and solar industries have made great progress in the increased use of large-scale solar technologies, but there is room for innovation and improvement for both groups if they wish to produce more successful projects and improve project benefits. This will require continued efforts by both parties to improve the utility procurement and project development processes, and will also require consideration of innovative solutions as utility-scale solar projects become more common. Utility planners need assistance to increase their familiarity of the various solar technologies and their benefits. The solar industry must gain a greater understanding of what drives the utilities, and how utility planning and procurement procedures might be used more effectively to develop large-scale utility photovoltaic and concentrating solar power projects.

14
1 Introduction
1.1 The Utility Procurement Studies
1.1.1 Study Objectives This report details the results of two studies conducted to explore innovative procurement of solar electricity in the utility market. Two separate study teams were engaged in the study and reporting effort, and the studies were conducted with input from a stakeholder Advisory Committee (AC). The studies addressed large-scale Concentrating Solar Power (CSP), and grid-connected photovoltaic (GCPV) solar technologies. The Traditional Procurement Study focused on utility procurement via Requests for Proposals (RFPs) and Power Purchase Agreements (PPAs). The Innovative Procurement Study examined inventive and pioneering procurement scenarios and market aggregation techniques for large-scale solar electric acquisitions. Both studies examined approaches that have been or may be utilized by the utilities and their partners to plan and develop solar power plants or projects.
1.1.2 Study Descriptions The Traditional Procurement Study When electric utilities require additional electricity capacity or energy needs, the most common method to obtain power is by issuing a request for proposals (RFP) and, after selecting their best option among the respondents, negotiating a power purchase agreement (PPA) to purchase the power on a contractual basis. Renewable energy generation sources are generally treated the same as conventional energy sources in how they are procured, although utilities will sometimes release renewable energy only or solar-specific RFPs to meet their generation requirements. The directive for this study, focusing on acquisition and contracting via RFPs and PPAs, was to examine the impediments to traditional solar power procurement. The consulting team examined utility RFPs (both renewable and all-source) and identified key elements of the term sheet and PPAs as they specifically relate to utility acquisition of large-scale solar power technologies. The consulting team was asked to recommend a series of principles for the design of solar RFPs and PPAs and explain the key elements of the term sheets and PPAs that should be uniquely tailored for solar procurement. The consultants also utilized AC members in their study research. The study consultants developed two questionnaires, which were distributed to utilities and solar industry companies recommended by the AC, SEPA and the management team. Though the questionnaires were limited to a small group of utility and industry representatives, they were expected to reveal insights as to how the utilities and the solar industry operate, and areas where their standard operating procedures or lack of understanding of one another is creating impediments to working together and creating successful large-scale solar projects. The questions and compiled responses for the utility questionnaires are available in Appendix C and for the solar industry in Appendix D. The Innovative Procurement Study

15
The focus for this study was to explore all identifiable non-traditional procurement options, including but not limited to electronic auctions, standard offers, franchise bidding, combined purchasing, reverse auctions, and forward pricing with volume guarantees, as well as to examine mechanisms, develop processes, and create linkages to effectively aggregate demand. As a part of the study, the consulting team investigated obstacles to cooperation among the stakeholders and possible techniques to overcome state regulatory differences. The team also looked at relationships among utility capacity aggregation and procurement techniques, as well as system design and delivery for CSP and GCPV. The consulting team researched various RFPs, combined purchase opportunities, available solar technology studies, and RPS activities across the US. Non-traditional procurement efforts and emerging procurement models were also examined. Members of the Advisory Committee as well as experts with insights into the various aggregation and procurement models were interviewed as key sources for this effort and the corresponding report.
1.1.3 Utility Solar Procurement Study Advisory Committee The Advisory Committee (AC) included representatives from four key stakeholder groups: utilities and public power authorities; the PV and CSP industry; engineering procurement and construction (EPC) contractors; and nonstakeholder advisors. Non-stakeholder advisors consisted of experts with specialized experience with Renewable Energy Certificates (RECs), transmission or regulatory policies. The role of the AC was to help shape the study effort, provide input to the study effort and review the findings in this report. Advisory efforts included participating in interviews by the study teams and commenting on the scope of the studies and how they might be made more relevant to their stakeholder groups. In addition, some of the AC members participated by completing the Utility & Industry Questionnaires.
1.2 Solar Energy Benefits
1.2.1 Benefits for the Utilities In addition to providing clean, renewable energy—and aside from regulatory mandates and climate-change concerns—there are a number of reasons for utilities to find innovative ways to increase their portfolio of renewable electricity in general, and solar power in particular. The recently released “Utility Solar Assessment Study” from Clean Edge and Co-op America1 offers the following compelling arguments for utilities to redevelop their planning constructs and business models so that a greater value can be placed on solar energy:
Utilities need to compare solar costs with peak generation costs [and/or new plant acquisition] rather than base load [or avoided cost] electricity generation;
The distributed nature of PV adds to grid reliability; The distributed generation of PV has limited transmission and distribution costs;
1 “Utility Solar Assessment Study,” 2008, Clean Edge Technologies and Co-op America.

16
Solar-project developers actively pursuing residential and commercial customers to install their own solar generation are taking business away from utilities and driving utilities to acquire solar resources in order to remain competitive;
In a carbon regulated world, solar will offer utilities credits rather than costs that will be incurred for their carbon polluting generation;
Increasing solar integration will be aided by and will in turn aid adoption of “smart-grid” technologies;
Utilities improve their image to the public by taking voluntary environmental measures; Solar “fuel” will remain free while costs of coal and natural gas continue to fluctuate in
volatile markets. Although, historically, utilities outside of the Southwest have played a lesser role in the direct growth of solar power, within a decade solar power is expected to be cost-competitive in most regions of the U.S. on both a wholesale and retail basis. Silicon-based PV, a semiconductor-based technology, is projected to continue downward pricing and efficiency improvements much like the computer chip. New technologies, including thin-film and non-silicon components, will also change pricing dynamics. PV prices are projected to fall from today’s $0.15 to $0.32 KWh range to $0.07 to $0.15 cents/KWh within a decade. By 2025, the PV price could be $0.04 to $0.08 cents/KWh.1 As utilities and others scale up their solar efforts, they are reaching economies of scale unlike anything seen in the past. In 2008 alone, large scale PV and CSP projects totalling 3,000-5,000 MW were announced. An example is Southern California Edison’s (SCE) 250 MW distributed rooftop PV installation program with estimated installed capacity prices as low as $3.50/watt by 2010.1 Utilities in New York, Massachusetts, North Carolina, Oregon and California have also followed suit with a similar announcements, though at a lesser scale. On a centralized basis, projects have ranged from Arizona Public Service’s announcement of a 280 MW concentrating solar power project with 6 hours of thermal storage, to Pacific Gas and Electric’s 550 and 250 MW PV projects. Clearly the solar industry is changing rapidly. Utilities also need to asses new business models. They face increasing competition from third-party companies which own solar plants located on the premises of commercial and residential customers. These companies then sell the power or rent the panels to the customer at a fixed rate. Additionally, utilities could generate new revenues by developing service plans and financing options for solar instead of ceding the market opportunities to new players. In short, electricity market dynamics are changing and the business aspects of solar should not be ignored over the medium- and long-term. For these reasons it is recommended that solar be included in the utility’s planning processes.
1.2.2 Benefits for the Solar Industry The utility market represents the largest potential market for the solar industry. The ever-increasing demand for electricity by utility customers provides a vast market that continues to grow, even as the popularity of large-scale utility solar power is increasing.2 As mentioned above, the scale of the potential utility demand can help the industry in meeting its cost-reduction goals by providing demand that allows for increased and more automated solar manufacturing production, as well as anticipated efficiency increases with continued R&D. The utility market is a potential boon for the solar industry, but continued success in this market
2 See Appendices A and B for recent large-scale utility GCPV and CSP projects.

17
requires a better understanding of the utilities and how to meet their needs. In addition, new business models and innovative procurement techniques will optimize the costs and benefits for both the industry and the utilities.
1.2.3 Other Considerations Variable generation resources, such as solar, are different in character than base-loaded fossil-fueled generators or nuclear facilities. Their successful integration may require new ways of thinking about grid operations and resource dispatch. One model is an “energy first” concept that values renewable energy’s benefits and puts it at the center of the system, rather than marginalizing it. The move toward “smart grid” technologies enhances this ability to maximize the benefits of energy production more intelligently utilizing capacity resources to support energy production, rather than expecting that all generation provides some capacity value.
1.3 Solar Market Drivers
1.3.1 State Requirements Spurred by regulatory dictates to increase their commitment to renewable energy by meeting Renewable Portfolio Standards (RPS), electric utilities and other retail sellers of power have substantially stepped up the pace of solicitations for energy from wind, solar, biomass and geothermal technologies. With 26 states and the District of Columbia establishing various levels of RPS mandates, the projected demand for new renewable capacity is currently expected to grow tenfold over the next 12 years, from 5,627 MW in 2008 to 57,841 MW, according to figures from the Lawrence Berkeley Laboratory.3 By 2025, under current state-level RPS requirements, the demand for renewable capacity could exceed 70,000 MW. Even in states and jurisdictions without RPS requirements, utilities large and small are responding to expectations of carbon emission regulation by devoting more resources to the acquisition of renewable energy via competitive power solicitations or direct contracting with developers. Utilities are also deciding to add renewable energy technologies (renewables) to their ownership portfolios, finding value in a more diversified resource base as well as a more welcoming attitude among rate setting regulatory bodies that are also more conscious of a potentially carbon constrained economy. Further, federal energy policies are already raising the potential for a national RPS standard and other supports for various clean energy technologies as part of a new regime of climate-change policies expected to be enacted with the change of administration during 2009.
1.3.2 Current Market and Cost Competitiveness of PV and CSP The increase in utility interest has corresponded with significant improvements in relative cost profiles for renewable technologies. Not only are the metrics for installation costs and electrical output improving as greater amounts of new capacity begin operating, renewable power’s competitiveness against natural gas has been vastly improved by the current high prices in oil and natural gas markets.
3 Lawrence Berkeley National Laboratory spreadsheet unpublished, Sept. 2008

18
In the first wave of new purchase commitments in the last two years, wind energy found great favor in this new contracting era, with installed capacity in the United States doubling from about 10,000 MW in 2006 to 20,152 MW as of September 2008.4 Solar power is now following a similar early stage trend, with advances seen in the cost competitiveness for a new generation of CSP technologies and a plethora of global companies pressing innovations in PV – whether for individual residential/commercial/institutional installations, or much larger utility scale PV systems. As a utility-grade resource, CSP has leaped into the competitive fray after a nearly 15-year hiatus in new development opportunities. Building on a base of some 354 MW of installed capacity at the original Solar Electric Generation Stations (SEGS) in Southern California built from 1985 through 1991, an additional 65 MW of new parabolic trough designs came into operation in Arizona and Nevada in the past two years. These will soon be followed by more than 4,803 MW5 of recently announced or contracted CSP in California, Arizona and Florida that have been announced with online dates between 2009 and 2014. This next generation of CSP features a variety of technology types, including parabolic troughs, dish Stirling-engines, linear Fresnel concentrators, and power tower designs that update some of the earlier installations from the 1980s and 1990s.6 In addition to the effect of mandates embodied in state RPS programs, CSP is also being driven by government-backed initiatives to expedite utility-scale development. The Southwest Concentrating Solar Power 1000-MW Initiative has set a goal of achieving 1,000 megawatts of concentrating solar power systems in the Southwestern United States by 2010. To achieve this goal, the US Department of Energy is working closely with the Western Governors' Association Clean and Diversified Energy Initiative whose goal is to develop 30,000 MW of new generation by 2015.7 At the same time, PV is making greater strides into the competitive marketplace. During 2007 alone, U.S. PV manufacturing increased by nearly 75 percent while grid-connected PV (GCPV) increased by 45 percent with over 150 MW installed.8 In addition to RPS requirements, smaller scale PV development has been targeted under the California Solar Initiative, which intends to bring 3,000 MW of distributed PV into operation by 2016.9 In a similar vein to CSP’s rapid centralized growth, over 1,500 MW of utility PV announcements have been documented in 2008 alone.
1.4 Utility Procurement For the last two decades, utility use of competitive procurement (via RFPs) has been increasing. Competitive procurement is seen as a good method to ensure that utility customers enjoy the best fit and price of electricity supply.10
4 American Wind Energy Association release Sept. 3, 2008 5 See Appendix B: CSP Project Table for details. 6 Power purchase agreements signed or announced, as of July 2008, Fred Morse presentation. 7 http://www.nrel.gov/csp/1000mw_initiative.html 8 “US Solar industry Year in Review 2007,” Prometheus Institute/Solar Energy Industries Association. 9 http://www.gosolarcalifornia.org/csi/index.html 10 “Competitive Procurement of Retail Electricity Supply: Recent Trends in State Policies and Utility Practices, ” Susan F. Tierney and Todd Schtazki for NARUC July 2008.

19
Recent announcements of utility contracting for grid-connected PV have upped the ante in size and cost-competitiveness, including two very large-scale power purchase agreements signed by Pacific Gas & Electric—one for 250 MW and another as much as 550 MW—to be located in the Carrizo Plains region of Central California. These two projects alone would more than double the worldwide installed GCPV capacity, and they represent greater than an order-of-magnitude increase in the size of the largest individual projects currently under development. Despite these new developments, many utilities and members of the solar industry are finding that the traditional method of utility procurement via a sole entity issuing a competitive RFP to meet its expected future demand has drawbacks to bringing solar technologies into commercial operation. They are looking to institute innovative approaches to resource acquisition that will accommodate larger sized designs of both CSP and PV in order to capture increased efficiencies of scale.
1.4.1 Joint Procurement In the past there have been many successful efforts among utilities to jointly procure resources—whether renewables or such traditional infrastructure as fossil-fueled power stations and transmission lines. Individual companies could not cost-effectively develop such resources by themselves, so they pooled or aggregated their need, finding greater leverage in terms of scale, cost, financing ability and risk diversification. This aggregation model is now being applied by several groups of utilities for acquisition and joint operation of renewable energy, and in two notable current instances, by consortiums of utilities to potentially contract for larger scale CSP in the Southwest.

20
2 Traditional Procurement Study: Acquisition and Contracting
2.1 Introduction This study focused on improving traditional utility RFP and PPA processes to the benefit of both the utilities and the solar industry and to examine the impediments to solar power procurement. In support of this effort the study team interviewed AC members as well as utility and industry representatives. Two questionnaires were developed and distributed to a small, select group of utility and industry representatives in an effort to identify major impediments to expanding utility use of large-scale solar generation across the country. The survey focused on identifying (1) mismatches in values, perceptions and behaviors that impede large-scale solar’s penetration of the generation market and (2) other barriers to increased solar penetration. From the survey results, we expected to identify barriers that—with work—could be significantly lowered. The questions and compiled responses to the surveys may be found in Appendices C and D.
2.2 The Surveys
2.2.1 About the Surveys The results of this survey should not be considered a scientific sample. The companies asked to participate were not selected at random, but were recommended by SEPA and members of the Utility Procurement Studies team. Furthermore, from this small survey group, the number of responses from both utility and solar industry sectors was too few to justify statistically valid results. Hence, one should consider the validity of the survey’s results to be similar to that of a focus group’s results. Similarly, the conclusions derived from the surveys depend on relatively few responses and are subject to that limitation. It should be noted that the term “utilities” generally refers to “utilities responding to the survey,” unless otherwise noted and the conclusions and recommendations are unlikely to apply ubiquitously to all utilities. In addition, the utility personnel that responded were using their professional experience and judgment in their responses at their particular, which may or may not be representative of any official utility positions or decisions.
2.2.2 The Utility Survey The utility survey was sent to 33 utility companies, while 15 responded, resulting in a 45% response rate. Many respondents did not completely answer all the questions in the survey, which means some questions had fewer than 15 answers. As measured by “coefficient of variation” (CofV), wide variation occurred among most answers, suggesting divergent opinions among the respondents for many of the questions. Seven investor owned utilities (IOUs) and eight publicly owned utilities (POUs) returned the survey.11 One utility submitted two surveys, giving us insight into two different groups within the company. Southwestern utilities(which includes Texas) returned three surveys; Midwestern utilities returned five surveys and Western utilities (which included California) returned seven surveys.
11 Publicly owned utilities were defined as municipal, cooperative, federal, and irrigation or utility districts.

21
The study team arbitrarily created three size categories for the responding utilities: small, medium and large utilities. Small is defined as having less than or equal to 100,000 customers; medium is defined as having less than 750,000 customers; and large is defined as having more than 750,000 customers. Customer data was retrieved from each utility’s website.
2.2.2.1 Utility Response Analysis12 The two lists below give an overview of the utility survey observations and recommendations based on the study team’s analysis of the survey responses. The survey questions and additional analysis are provided, beginning after the two lists. Observations Drawn from Utility Survey Analysis
1. Non-price Attributes: a. All utilities value solar generation’s positive environmental attributes much more
than other non-price attributes. i. Publicly owned utilities (POUs) value environmental attributes more than
Investor owned utilities (IOUs) ii. Smaller utilities value environmental attributes more than medium utilities,
which value them more than large utilities. b. Utilities moderately value “Correlation between Solar Generation and Peak Hours
of Utility,” “Dispatchability (CSP w/storage),” “Elimination of Fuel Price Uncertainty,,”and “Fuel Diversification.
c. Utilities do not value ”Potential for Location Close to Load,” “Minimal Water Usage (PV),” ”Delay of Transmission or Distribution Investment,” “Power Factor Correction and Local Voltage Support.”
2. Utility planners and plant engineering personnel are not as familiar with large-scale solar generation technology and costs as they are with coal and natural gas technologies, which may lead utilities to assign greater risk to solar technologies.
3. Utilities, especially IOUs, do not believe solar project developers and EPC contractors have as much knowledge and expertise as their counterparts in the coal and natural gas generation business.
4. Price escalation and financing risks are two risks that utilities believe large-scale solar developers should bear and that solar developers try to shift to utilities.
5. Regulation is the strongest motivator for utilities to purchase large-scale solar, although “Fuel Diversification,” “Generation Portfolio Diversification,” and “Life-Cycle Costs” also received positive responses.
6. According to utilities, pricing, default terms, performance guarantees and penalties for failing performance guarantees are the most contentious issues in RFPs and contract negotiations.
7. If possible, utilities wish large-scale solar developers would lower their costs and provide higher quality responses to RFPs.
Recommendations Drawn from Utility Survey Analysis
12 Question 1 asked the utility respondents to describe their company’s main business and whether or not it involves solar. This information was used by the study team to gain insight into the types and expertise of the responding utilities.

22
1. To increase success in RFPs that do not specify a solar or renewable technology, solar developers should quantify its higher valued non-price attributes, especially its environmental attributes, and explicitly charge for them in RFP responses.
2. To increase acceptance (or lower solar generation’s perceived risk) among utilities, the solar industry should create an educational effort for utility planners, engineering and construction personnel.
3. The large-scale solar industry should accept that utilities will not typically accept cost escalation, financing or performance risk. The solar industry thus has to use other ways, such as joint development or hedging strategies to buffer such risk.
4. As a whole, solar developers should respond to RFPs with higher quality responses, which means standing behind the offer made and responding to all the RFP’s terms and conditions rather than some subset of it.
Recommendations for Changing the RFP Process to Reduce Bidding Barriers for the Solar Industry and Clarify Utility Interests in the Bid Evaluation and Negotiation Phases The survey responses have revealed several areas in the utility RFP and PPA processes that are not working as well as they could. The hope was that this study would reveal some common current utility and solar-developer activities that could be changed to increase acceptance of large solar projects in the marketplace. Below are some of the conclusions drawn from the surveys with suggestions for possible changes to the RFP process that may lead to increased acceptance of large solar projects and solar-sourced PPAs as fully competitive options to other current alternatives for adding new utility generating resources. As the surveys show, both the utility and solar industry might make some changes in their approach to RFPs. The most obvious suggestion is to increase the knowledge of both stakeholders, but how this education will occur is still an open question. It is important to remember that running an RFP and preparing bids are costly, time-consuming activities. To reduce utility and bidder costs, many utilities over years have shaped their RFP’s to ask bidders “just what they need” to evaluate and differentiate bids assuming competing offers are of a particular resource type. Changing these processes will not be easy; however, utilities are beginning to recognize that a “business as usual” approach with conventional generation resources will itself have difficulties. This should make them more open to changes in the RFP and PPA processes. Performance guarantees – On-line dates and replacement power guarantees are very important to utilities. If a utility has specific need for capacity or renewable energy, this information needs to be available in the bid package and not left to discovery during negotiations. Solar unit availability may be quite different from the utility’s experience with fossil fueled generators or other renewable energy technologies. Routine solar equipment maintenance can be done at night without affecting normal availability. Longer planned outages can be done in winter with minimum reduction in annual capacity factor, similar to seasonal hydro-generator maintenance. Therefore, requiring a 90% or 95% availability for standardized Levelized Energy Cost (LEC) comparisons is inappropriate for large-scale solar projects. To help utilities manage this difference in availability patterns, solar bidders should provide their own availability guarantees or data from reference projects that may be a better means to deal with plant availability and its effect on the LEC for comparison with other technologies.

23
Capacity variability from large-scale solar projects due to the variable nature of insolation is a more complex and harder piece of information to convey to utilities. The output from solar power is complex and the utilities should not label this as unreliable capacity as a response to this complexity. To help avert this label, the solar industry must provide valid, understandable information describing the output characteristics of a project. In practice, solar project designers use well know averaging techniques and (hopefully) site representative solar data to characterize and quantify “daily average energy per month” or “hourly average energy per hour per month” and similar annual or monthly averages. These techniques are quite good for understanding average energy production costs and pricing, but they do not convey a clear picture of capacity variability to be expected. They also do not convey a clear picture of how the plant will actually be operated. For their part, utilities should include in the bid package information on peak and super-peak hours plus any significant information pertinent to availability of capacity or energy. To help utility evaluators better understand their technology, solar developers need to improve their capacity variability responses in the presentation of their bid. Most non-solar people do not understand a great deal about large-scale solar technology and insolation patterns. (For example, solar noon isn’t at 12:00 pm in most of the U.S. in the summer.) When you consider that plant output is shaped not only by latitude, climate and weather, but also by collector design, tracker design and controls, PV cell temperature, or energy stored in thermal components, it becomes difficult for utility evaluators to have confidence in the exact operational characteristics. Until utility decision makers become more informed about solar electrical generation, solar bidders will need to include descriptive information that paints a practical vision of their project’s output along with the averaging information used for pricing. Planners need to know if the project will ever produce more power than the “rated” output, if the power output degrades over time, and what the project output looks like over the course of both completely sunny days and typically overcast days. The availability of a solar power integration study similar to the wind industry integration studies may present a good option in future, but until this is available, reference plant output data may be very helpful. Utilities are wary of solar developers, designers and builders. Though this seems to be an issue, it can be addressed. Prior to RFP release, the utility should decide what constitutes “sufficient” proof of capability to complete the project on time. Several possibilities standout from answers to our survey, but only the utility can decide what would be “sufficient” for them. The specific RFP suggestion is that the utility should provide a clear description of what constitutes the minimum specifications a solar developer needs to provide in its bid response in order to show their capability to do the project. These specifications could include:
A listing of reference plants or projects Site control Control of some permits Availability of financing Whether PPAs or utility partners are required to secure financing
Other examples of project capability are possible, but utilities should remember that the more assurances a bidder must provide, the more it will cost to bid, and over-reaching for assurance may dissuade qualified, earnest bidders from participation. Equivalence of assurance with other

24
generation types should be a guide. For instance, when accepting bids for a conventional new power project, does the utility require bidders to have site control, air permits, or emission credits in hand, and turbines or other long-lead items to be on order? In summary, wary utilities should ask themselves what it is fair to request of bidders that will overcome the utility’s wariness without affecting project cost or causing bid preparation cost increases that would drive bidders away. Also, if specific partnering or other risk-sharing devices are (in the utility’s opinion) needed before consideration of a solar project offer will be accepted, this should be a clear requirement in the RFP. The failure of bidders to commit to a firm price seemed to be a serious and often mentioned problem. The survey did not point to a resolution to this problem. The other side of this issue is that RFP pricing requirements may be overly prescriptive and not particularly good at finding the best, least-cost scenario for the utility’s needs. Solar and other renewable resource technologies tend to be capital intensive with maintenance and fuel a smaller portion of life-cycle costs than natural gas technologies, for example. Consequently, utilities may have difficulty fairly comparing large-scale solar bids to other generating options that have low per-MW capital requirements, but high and uncertain fuel costs. Resolution of this issue may be aided if both utilities and solar developers make efforts to understand the best analysis of the capital financing portion of the bid and separating it from the O&M and any other variable costs. Utility RFPs often permit fossil generators to “pass through” their fuel costs to the utility. In many states, utilities still have fuel adjustment clauses. This may give an unfair advantage to fossil generators over large-scale solar developers because fuel costs are not a large component of solar’s total life-cycle costs and because it unfairly diminishes the value of owning a fully capitalized asset with low variable generation costs. This long-term stability of value provides a utility or solar developer much greater certainty about large-scale solar’s variable costs 10 to 30 years in the future. This stable enduring asset value is not a characteristic of coal or natural gas generating resources. Providing appropriate escalation factors for capital, operations and maintenance costs requires more cost data than most bidders are comfortable providing to a utility in a bid situation. This is also true of equipment life projection confidence. Yet, it is this information that allows a utility to fully value large-scale solar projects, and for negotiation to reveal whether developer or utility financing is the better way. Design of the RFP to produce bids with sufficient information to have confidence in first year capital (debt service and/or equivalent power) costs should be considered. In addition, adequately evaluating the cost savings for reducing fuel costs for existing generation resources should be factored into the net cost of the solar resource. Some methods that use variability of forward pricing indices show substantially more savings than the average projected cost of fuel might otherwise indicate.13 In any case, simplified fuel cost methods that are reasonable when evaluating fossil fuel technologies, are not adequate for evaluating obviated fuel costs for a solar project that provides fuel savings over twenty or more years.
13 “Accounting for Fuel Price Risk” by Bolinger, Wiser, Golove, August 2003. Available for download at http://eetd.lbl.gov/ea/EMS/reports/53587.pdf.

25
2.2.2.2 Utility Value Assessment of Solar Attributes Question 314: Please assess the relative value of the listed on-price solar attributes. Question 3 assessed the relative value utilities have for various solar attributes. The question requested respondents to allocate 100 points among various options assigning more points for stronger values. Respondents were also permitted to add their own options. Utilities clearly value the environmental attributes of solar generation. The “No Emissions of Carbon or Pollutants” attribute scored much higher than any other option. If “No Emissions of Carbon or Pollutants” and “Carbon Offset Value” are considered together, utilities value solar’s environmental attributes much more than any other attribute listed; the combined average score is 40 points of the 100. Interestingly, POUs valued these attributes more than IOUs, although both valued them the most. Smaller utilities valued them more than medium utilities, who valued them more than large utilities. After environmental attributes including RECs, utilities moderately valued “Correlation between Solar Generation and Peak Hours of Utility,” “Dispatchability (CSP w/storage),” “Elimination of Fuel Price Uncertainty,” and “Fuel Diversification” with scores ranging from 10 to 8 points respectively. Utilities placed their lowest value on the attributes of “Potential for Location Close to Load,” “Minimal Water Usage,” “Delay of Transmission or Distribution Investment,” “Power Factor Correction and Local Voltage Support.” All had average scores less than 4. About an 80% correlation exists between IOU and POU responses to this question. “No Emissions of Carbon or Pollutants” showed the largest difference between the two categories with POUs scoring it 36.9 and IOUs scoring it 18.6, an 18.2 point difference. Conclusions From a marketing perspective, given these utility values, solar companies should emphasize the environmental attributes of its product and perhaps segment its pricing into “ordinary electricity value” and environmental segments. Companies should also emphasize solar’s fuel diversification and fuel price certainty characteristics. Solar companies should not spend much time trying to convince utilities of the transmission and distribution benefits of their product; the utilities did not value it very much. Unless it is a required part of a bid package, there seem to be lesser benefits in discussing the transmission and distribution benefits.
2.2.2.3 Utility Familiarity with Solar Generation
Question 2: Please indicate those generation technologies with which your utility’s generation, engineering and construction personnel are more familiar with than they are with solar technologies. Question 4: Are the utility planners and power contracts personnel as knowledgeable about the following large-scale solar attributes as they are about coal, combined cycle, or combustion turbine attributes? Question 5: Are the utility’s generation engineering and construction personnel as knowledgeable about the following large-scale solar attributes as they are about coal, combined cycle, or combustion turbine attributes? 14 The analysis is grouped by topic and references to specific question numbers may occur out of order, in groups, or not at all. For example, question 1 asked the utility respondents to describe their main business and whether their business included solar technologies. This information was used by the consultant team to gain insight into the types and expertise of the responding utilities, but is not explicitly discussed in the analysis. Question 2 is grouped in the next section with questions 4, 5, and 8. Etc.

26
Question 8: Please indicate those generation technologies with which your generation planning personnel are more familiar with than they are with solar technologies. The hypothesis for questions 2, 4, 5 and 8 was that utility planners and generation engineering and construction personnel are not as familiar with solar generation as they are about coal, combined cycle, or combustion turbine technologies. From the results, this hypothesis appears to be correct. Surprisingly, IOUs and large utilities’ answers indicated less relative knowledge about solar technologies than POUs or medium/small utilities. (There is some overlap among the categories.) Within the context of these questions, utility planners know significantly more about solar than utility engineering and construction personnel, and their relative degree of influence within the procurement process may affect decisions accordingly. Only about half of planners knew as much about solar technologies and their performance patterns as they do about similar concepts for other generating technologies, and this was the “best” response. The answers indicate that solar EPC contractors are relatively unknown to the utility industry, particularly among IOUs and large utilities. A similar result exists for “Total Life-Cycle Costs” and “O&M Costs of Solar Technologies.” Conclusions To the extent utilities choose large-scale generating options with which they are more familiar and comfortable, then solar technologies are at a disadvantage to more familiar technologies such as coal, natural gas, or even wind energy. To date, utility solar incentive program managers and distribution engineers have had the most contact with solar technologies and applications. As centralized and large-scale solar emerges, the solar industry needs to now educate utility planners and particularly utility generation engineering and construction personnel about solar products and attributes. Utilities are no different from other large corporations, and it cannot be assumed that knowledge and understanding about a particular product is necessarily transferred across departments and job functions. The solar industry should focus on all aspects of solar generation, but knowledge about EPC contractors, total life-cycle costs and O&M costs are particularly lacking among utility planners and engineering personnel. These basic information limits increase perceived risk and thus lower the probability of being chosen as a supply option. To increase confidence in this important but subjective issue, solar project developers in their bids, should underscore items that support capability and commitment. The issue of risk is not new but, given the lack of confidence cited, this issue may require additional focus on the part of solar developers. From the utility side, the bid request could include some specific items that would indicate developer experience and commitment. The RFP could request specifics regarding site control, status of transmission and interconnection studies, reference plants, etc.
2.2.2.4 Solar in Planning Models and Generation Variations Question 6: Where is planning for adding large-scale solar generation to your system done within the utility? Question 7: If large-scale generation is an option, where in your generation planning process is large-scale solar analyzed and decided upon? In questions 6 and 7, respondents were asked to determine whether solar technologies are included in the detailed planning models utilities use, which would indicate whether solar technologies are getting past “initial screening” and are true competitors with traditional technologies. Unfortunately, the study team neglected to ask whether the utility used detailed

27
planning models for other generation types as well. However, it appears that about half of the utilities include solar technologies in their detailed planning models. POUs tend not to use detailed, quantitative models to assess large-scale solar, but we do not know if these POUs use detailed, quantitative models for any generation technology.
2.2.2.5 Solar Generation Patterns Question 9: Does your company have concerns about fluctuating generation patterns of large-scale PV? If not, at what percent of your generation mix would it become a concern? The responses to question 9 indicate that utilities have concerns about the “fluctuating generating patterns of large-scale solar.” The utilities remarked that the percentages of generation mix at which the intermittent output from solar generation would become a concern are >20%, >5%, >10% and 0.1%. Conclusions The solar industry should consider allaying this concern by educating utility planners and engineers about storage or backup potential for its technologies or by sponsoring studies bounding the costs of solar generation variability, such as those the wind industry has done concerning wind’s variability on a system’s daily generating costs. In addition, the solar industry may need to understand better the needs of the utility issue regarding load following, what types of plants utilities use, and at what time they use them, to provide this capability.
2.2.2.6 Risk Sharing Between Solar Developers and Utilities Question 10: What contractual risks does your company believe that solar developers should rightly bear that they most often attempt to place on your company? Question 11: How does your utility address risk when acquiring “new” technology; e.g., through PPAs, partnering with other utilities or government organizations, pilot projects, contract escape ramps, etc.? The study team hoped that question 10 would provide useful information about the mismatches between solar developers and utilities concerning risk sharing. Unfortunately, little information on risk sharing was provided. Price escalation before commercial operation date was mentioned most often, with financing risks, construction or operational risks also being mentioned. One solar-experienced utility noted that, while PPAs can accommodate various risks, the utility is not in the best position to manage the risk. The answers to question 11 reveal ways utilities use to mitigate risks associated with “new” technologies. These include PPAs, partnering, demonstrated pilots, and paying for output only. See Appendix C, question 11 for a complete listing. Conclusions The solar industry should increase its use of the tools suggested in the answers to question 11 in partnership with utilities to help educate planners and engineers about solar technologies’ costs and operational characteristics.
2.2.2.7 Current Motivation for Utilities to Purchase Large-Scale Solar Question 12: If your utility has chosen or intends to choose a large-scale solar option as a current or future generation addition through an RFP-PPA process, what reasons led to that decision?

28
Although only 53% of utility respondents answered question 12, the answers suggest that the strong motivators for utilities that are buying large-scale solar are still regulatory in nature, including the “Investment Tax Credit” and “Mandates and Other Commitments.” This reveals that the solar industry currently still depends on non-market forces to generate sales. There is some optimistic information in the results as well. “Fuel Diversification,” “Generation Portfolio Diversification,” and “Life-Cycle Costs” received positive responses, denoting market concepts that the solar industry could use in its educational effort recommended earlier. On this question, IOUs and POUs had nearly zero correlation between their answers. POUs gave “Total Life-Cycle Costs” their highest score; whereas, IOUs gave “Mandates” their highest score. Conversely, each scored the other’s highest motivation low. This discrepancy may exist because POUs are not always bound by regulatory or legislative mandates.
2.2.2.8 RFP Terms that Have Led to the Most Disagreements Question 13: What terms in your RFP or in your PPA negotiations have led to the most disagreement in RFP discussion or power purchase negotiations with solar developers? Only five utilities answered question 13; so the following observations have a high degree of “statistical error.” The responses indicate that pricing, default terms, performance guarantees and the penalties for failing performance guarantees are the most contentious issues in RFPs and contract negotiations. Conclusions One survey analyst familiar with contract negotiations for wind and traditional generation resources believes these are issues across power purchase contracting for any type of purchased generation resource. That said, if the solar industry and the utility industry can get some general agreement outside of specific RFPs or negotiations, agreements may be reached faster, which is in everyone’s interests. The solar industry could incorporate these issues in the educational effort previously recommended. In addition, the solar industry itself may need to pay more attention to utility requests in RFPs and price the risk management into its responses. Utilities usually mean what they say in their RFPs regarding security guarantees and performance requirements.
2.2.2.9 Utility Confidence in Solar Developers and EPC Contractors Question 14: Does your utility believe the following entities have relatively the same knowledge and expertise about their business as their counterparts in the fossil-fueled generation fields, e.g. coal developers or combined cycle generators? The answers to question 14 clearly reveal that utilities do not have as much faith in the abilities of solar developers and EPC contractors as they do in the abilities of similar entities in the coal and combustion turbine industries, although POUs were about 50-50 in their responses. One possible conclusion from this result is that utilities perceive a higher risk with solar development than traditional generation resources, including wind. This is another barrier that large-scale solar must overcome. Conclusions Utility lack of confidence in solar developers and solar EPC contractors, combined with the utilities’ relative lack of knowledge about solar technologies is a significant market barrier for large-scale solar. The solar industry must somehow convince utilities that its developers and EPC contractors know what they are doing. As was previously mentioned, educating utility

29
planners an engineers through workshops, success stories, and utility-solar conferences are recommended for bridging the information gap. The large-scale solar industry needs to impress upon the decision makers in the utility industry the fact that it can design, finance, build and successfully generate utility-scale solar power plants.
2.2.2.10 What Length of Contracts are Utilities Willing to Sign with Solar Companies? Question 15: What is the maximum length of a PPA contract your utility would consider for a large-scale solar project. Thirteen utilities responded to Utility question 15 with the following results.
20 to 30 years 9Up to 20 years 13 to 5 years 1Unknown 1Prefer to own 1
One respondent qualified its answer with a note about capital leasing issues; the "up to 20 years" respondent commented that it could go longer if the value of project is longer.
2.2.2.11 What Effects do the FASB Capital Lease Rules have on RFPs and PPAs? Question 16: When issuing an RFP or designing a PPA for solar generation sources, does your utility factor in the following Financial Accounting Standards Board (FASB) issues regarding capital lease effects of the contract? Utility respondents to question 16 were asked to determine if the Financial Accounting Standard Board's (FASB) capital lease rules were a hurdle for utility power purchase agreements with solar companies. Six utilities answered the question. Regarding the specific FASB issues, the six utilities responded to factoring FASB issues into their RFP or PPAs as follows:
The PPA transfers ownership of the property to the lessee by the end of the PPA term
6
The PPA contains a bargain purchase option 5 The PPA term is equal to 75 percent or more of the estimated economic life of the PPA'd property
2
The value at the beginning of PPA term of minimum PPA payments (excluding executory costs such as insurance, maintenance and taxes, including any profit thereon, equals or exceeds 90 % of the excess of the fair value of the PPA property)
2
IOUs responded that they consider all four issues in their RFPs or PPAs; whereas, POUs responded that they consider only the first two. All indicated that they were concerned about the FASB issues cited in the question. Conclusions The utility industry is starting to utilize FASB rules governing whether or not a utility must consider a particular power purchase agreement a capital lease. Solar companies should become familiar with pertinent FASB rules and be prepared to respond to RFPs accordingly.

30
2.2.2.12 Why Large-Scale Solar Bids have been Unsuccessful with Utility RFPs Question 17: If large-scale solar option for future generation additions has not been selected through your RFP and PPA process, what has prevented the utility from selecting large-scale solar? The answers to question 17 indicate that utilities have rejected large-scale solar mostly because of cost. The scores of three cost options in the question, “Total Cost over Life of Project,” “Uncertainty of ITC,” and “Waiting for Solar Cost Reductions,” which together averaged 45 out of 100 points, support this conclusion. Technology and knowledge risk also enter into the rejection of large-scale solar bids. An interesting conflict occurred between the answers to question 12 and question 17. Total life-cycle costs was the fourth most popular answer to why a utility selected large-scale solar in question 12; yet, it was the most cited reason for rejecting large-scale solar in question 17. It appears that different utilities have different generation cost horizons in front of them. Conclusions Of course, cost reductions for large-scale solar are very important to increasing its penetration into the utility generation market. In addition to striving for cost reductions, the large-scale solar industry needs to emphasize and quantify the value of its environmental attributes to its utility clients, as indicated by utility question 3. The response to question 18 suggests that utilities would consider joint projects to help drive large-scale solar down. The large-scale solar industry might avail itself of this utility interest.
2.2.2.13 Regional Differences It should be no surprise that Southwestern utilities favor solar more than non-Southwestern utilities. Simply, the region has better solar resources that reduce life-cycle costs significantly. Southwestern US electricity peak demand also correlates well with solar generation availability. For these same reasons, regulatory agencies in the Southwest may be pushing solar harder than other generation technologies.
2.2.2.14 Some Overall Perceptions Derived from the Utility Surveys 1. There are regional variations in renewable energy interest as well as the type of renewables. 2. For renewable energy, IOUs use commonly available resource evaluation models, POUs do
not. 3. RPS or solar mandates are the strongest motivator for adding or bidding renewables. 4. T&D benefits of distributed generation are not an important bid evaluation criteria. 5. Bid negotiation challenges include high cost, but terms in contract guarantees are also
important, including project completion time, energy and capacity, and ITC risk. 6. Overall, utilities have low confidence in the ability of developers or solar EPC contractors to
complete the projects as bid. 7. Nearly all respondents indicate they are willing to partner or to aggregate in order to
decrease risk.

31
2.2.3 The Solar Industry Survey The solar industry survey was sent to 34 companies; 12 sent back a response, a 35% response rate. Again, many respondents did not completely answer all the questions in the survey, which means some solar industry questions had considerably fewer than 12 answers. The Traditional Procurement Study team classified the 12 solar industry responses into manufacturing (M), developer (D), and “engineering, procurement and construction” (EPC) categories. The team allowed for classifying a respondent into more than one category and, based on our conclusions, the team received responses from seven manufacturers, six developers and eight EPC companies. Three respondents were classified as “MDEPC,” indicating they are doing all three activities. Three industry respondents were classified as “DEPC,” or doing both development and engineering, procurement and construction work. Two were classified as “EPC” only. Four were classified as “M” only.
2.2.3.1 Overview: Solar Industry Response Analysis The two lists below give an overview of the solar industry survey observations and recommendations based on the study team analysis of the survey responses. The survey questions and additional analysis are provided, beginning after the two lists. Observations Drawn from Solar Industry Survey Analysis
1. Utilities can find solar developers and suppliers to help utilities build, own and operate
their own large-scale solar generation. 2. Solar companies, just like utilities, value solar’s environmental attributes higher than
solar’s other non-price attributes. 3. Solar companies value solar generation’s correlation with utility peak demand periods. 4. Solar companies with PPAs responded that they get paid in several different ways; for
example, energy only, capacity payments plus energy payments, and on a time-of-day basis.
5. Solar companies, just like utilities, report that life-cycle costs are the biggest barrier to increased market penetration.
6. Solar companies believe that utilities’ undervaluing of environmental attributes is a barrier to increased market penetration.
7. Solar companies report that utilities’ poor understanding of solar technologies, costs and benefits moderately inhibits large-scale solar’s market penetration.
8. Solar companies are often surprised that utilities take much longer to process RFPs or negotiate a contract than indicated in the RFP.
9. Solar companies report that transmission interconnection delays beyond original estimates are a problem.
10. Very few solar developers have responded to RFPs that are not restricted to solar or renewable resources, such as for peaking or intermediate resources.
11. Information about “collateral/security deposits” and transmission paths are often not adequately described or stated in the RFP.
12. Solar companies would like utilities to accept cost risk caused by investment tax credit changes or material cost changes beyond an established period of time, especially if transmission interconnection takes longer than anticipated.
Recommendations Drawn from Solar Industry Survey Analysis

32
1. The solar industry should quantify the value of its environmental attributes, the non-price attribute utilities value most.
2. The solar industry’s belief that its production correlates highly with utility peak demand periods may be flawed. Without storage, solar’s best production period does not match 4 PM to 8 PM, which is the typical utilities’ daily peak period.
3. Furthermore, solar’s production in the spring and fall, when utility demands are relatively low, may cause plant scheduling problems for the utility.
4. Solar companies’ belief that utility planners and engineers do not know their technology reinforces the need for a utility education program.
5. To improve solar companies’ ability to provide high quality responses to RFPs, utilities must improve their estimates of the time they take to process RFPs and negotiate contracts.
6. To improve solar companies’ ability to provide high quality responses to RFPs, utilities and RTOs must improve their estimates of the time they will take to analyze and construct needed transmission expansion.
7. Solar companies should respond to more RFPs for “all-source,” intermediate or peaking generation.
8. Utilities should help solar companies mitigate cost escalation risks that are beyond a solar company’s control and are beyond a period of time where the solar company is solely responsible for the risk.
2.2.3.3 Will the Solar Industry Help Utilities Own Large-Scale Solar Facilities? Question 2:15 Will your company provide EPC services to a utility that wishes to own and operate its own solar facility? If not, why not? The intent of question 2 was to discover if the large-scale solar industry was reluctant to provide services to a utility that wanted to own and operate its own large-scale solar facility. Of the seven “yes” answers, one was a developer and EPC entity (DEPC), two were EPC entities, two were manufacturers, developers and EPC entities (MDEPC) and two were strictly manufacturers (M). Consequently, responses to this question, although not unanimous, show that solar EPC contractors exist who are willing to support a utility that wanted to own and operate its own large-scale solar.
2.2.3.4 Solar Industry’s Value on the Non-Price Attributes of Solar
Question 3: Please assess the relative value of the listed non-price solar attributes. The intent of question 3 (in both the utility and the solar industry surveys) was to learn about positive and negative correlations between the two industries’ beliefs about the value of large-scale solar power. If one combines the various environmental values, both utilities and solar companies give it the highest value rating. In combination, the solar industry valued “No Emissions of Criteria Pollutants,” “Carbon Offset Value,” “Hedge Against Carbon Policy Uncertainty,” and “RECs” with a combined score of 38 out of 100. After environmental attributes, the solar industry next valued the correlation between the output of a solar power plant with utility peak demand, with an average score of 26 out of 100.
15 Question 1 asked the industry respondents to describe their company’s main business and technology type. This information was used by the consultant team to gain insight into the types and expertise of the responding companies.

33
Fuel diversification was poorly valued by the solar industry, while moderately valued by the utility industry. Conclusions Both industries highly value the environmental characteristics of large-scale solar production. The solar industry should capitalize on this positive correlation and start to quantify its environmental attributes. It then can argue from a quantitative base, which planners and engineers may prefer, that solar production deserves a premium above the cost of competitive products like combined cycle or combustion turbine. The high value that the solar industry places on its correlation with peak periods may be a veiled barrier to utilities accepting large-scale solar power. Without storage to bridge the time period, solar’s best production occurs before most utilities daily peak period. Solar produces best from about 10 AM to 2 PM; whereas, most utilities’ daily peak occurs from 5 PM or so to 8 PM or so. Furthermore, solar contracts usually are “must take” contracts, which means that utilities must take or pay for solar generation whenever it’s produced, including spring and fall periods when utility daytime demands are quite low. It might behoove the solar industry to work with the utility industry and develop a capacity, energy and environmental pricing scheme for large-scale solar rather than the simple pay for energy delivered.
2.2.3.5 What Do Solar Companies Get Paid for in PPAs? Question 4: In your experience, do the majority of utilities explicitly pay you for or have terms governing the following attributes in utility PPAs? The hypothesis behind question 4 was that solar companies get paid only for energy produced. That is, there is no capacity payment and no variation in energy rates for different time-of-day periods or seasons. The answers do not sustain our hypothesis. Ten solar companies responded. Eight told us that they get explicitly paid on a time-of-day or seasonal basis; six told us that they get paid for capacity.
2.2.3.6 Solar Company Perceptions about Impediments to Solar Generation Market Penetration Question 5: For the US, assess the major impediments you perceive to the development of large-scale solar facilities through utility RFPs or merchant development in unregulated states. Responses to question 5 reflect similar answers to utility responses to question 12. Both industries believe that life-cycle costs are the biggest barrier to increased market penetration of large-scale solar facilities. The solar industry also believes the utility industry undervalues solar’s environmental attributes, which is number 2 in ranking on this question. Transmission interconnection cost uncertainty, and the utility industry’s lack of knowledge about solar technology were moderately valued. The rest of the options were valued pretty low by the solar industry. Conclusions Both the solar and utility industries agree that cost and lack of utility knowledge about large-scale solar technologies are barriers to increased market penetration. The solar industry obviously needs to reduce these barriers. More successes in reducing costs must be made, and as suggested previously, the solar industry should undertake a utility education effort to raise awareness of its potential.

34
2.2.3.7 Solar Company “Surprises” in PPA Negotiations Question 6: Please check any utility “surprises” that arose in PPA negotiations that were not described or apparent in the RFP and impacted your ability to develop the deal? The responses to question 6 clearly indicate that delays in the time it takes utilities to process RFP bids and to negotiate contracts are issues that concern the solar industry. About 25% of respondents on this question replied that utilities insisted on price reductions in negotiations, presumably from what the solar company initially bid, and changed performance guarantees from those written in the RFP. Conclusions The utility industry needs to understand the solar industry’s concern about utilities taking longer to process RFPs and PPA negotiations than indicated in the RFPs. Incorrect estimates in this regard can upset a developer’s financing schedule and plans, and its hedge against commodity cost increases.
2.2.3.8 Transmission Impediments to Solar PPAs Question 7: In your company’s project development (bid planning, negotiations or actual construction) with utilities on solar projects, have you experienced any of the following difficulties? If so, please explain, and indicate the approximate size of project and interconnect voltage. Seven solar companies responded to question 7. Five of these companies each replied that the “Time to Get Interconnected with Utility Differed Significantly from Original Utility Estimates,” and “The Interconnection Queuing Process Delayed Interconnecting the Project to the Grid Significantly More Than Estimated.” Clearly, interconnection problems and delays were common. Transmission expansion, cost sharing and queuing are difficult concepts to understand and to anticipate. The newness of Regional Transmission Organizations and federal rules limiting transmission information access to utility RFP decision makers and utility PPA negotiators also contribute to the transmission interconnection problems. Question 9: Who is the best contact for obtaining transmission information? The responses to question 9 denote ambivalence regarding which entity, RTOs or utilities, are the best source for transmission information. This might be part of the underlying delay issue.
2.2.3.9 To What RFPs Have Solar Companies Responded? Question 8: Have you ever submitted a bid to any of the following utility RFPs? The replies to question 8 indicate that solar companies have mostly responded to renewable-only and solar only RFPs with one company having bid into a baseload process and one into an intermediate process. This makes sense because bids are expensive to prepare and odds are better for a solar project in a renewable or solar only process. On the other hand, large-scale solar penetration will not greatly expand until the solar industry goes after the larger solicitations for baseload, peaking or intermediate power sources. By responding to only renewable-only or solar-only RFPs, solar companies may be creating a self-imposed barrier to increased market penetration. Conclusions RFPs for “all-source” baseload, peaking or intermediate resources request the most new capacity for the utility industry. Requests for new renewable or solar only capacity are relatively
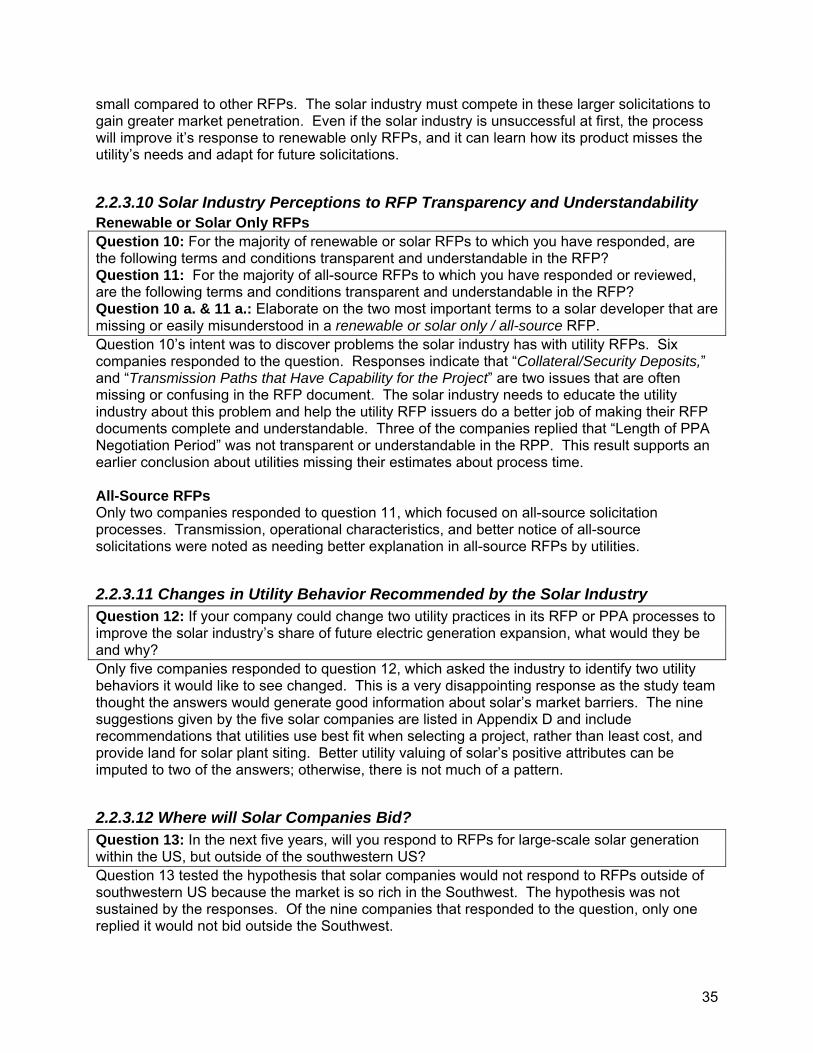
35
small compared to other RFPs. The solar industry must compete in these larger solicitations to gain greater market penetration. Even if the solar industry is unsuccessful at first, the process will improve it’s response to renewable only RFPs, and it can learn how its product misses the utility’s needs and adapt for future solicitations.
2.2.3.10 Solar Industry Perceptions to RFP Transparency and Understandability Renewable or Solar Only RFPs Question 10: For the majority of renewable or solar RFPs to which you have responded, are the following terms and conditions transparent and understandable in the RFP? Question 11: For the majority of all-source RFPs to which you have responded or reviewed, are the following terms and conditions transparent and understandable in the RFP? Question 10 a. & 11 a.: Elaborate on the two most important terms to a solar developer that are missing or easily misunderstood in a renewable or solar only / all-source RFP. Question 10’s intent was to discover problems the solar industry has with utility RFPs. Six companies responded to the question. Responses indicate that “Collateral/Security Deposits,” and “Transmission Paths that Have Capability for the Project” are two issues that are often missing or confusing in the RFP document. The solar industry needs to educate the utility industry about this problem and help the utility RFP issuers do a better job of making their RFP documents complete and understandable. Three of the companies replied that “Length of PPA Negotiation Period” was not transparent or understandable in the RPP. This result supports an earlier conclusion about utilities missing their estimates about process time. All-Source RFPs Only two companies responded to question 11, which focused on all-source solicitation processes. Transmission, operational characteristics, and better notice of all-source solicitations were noted as needing better explanation in all-source RFPs by utilities.
2.2.3.11 Changes in Utility Behavior Recommended by the Solar Industry Question 12: If your company could change two utility practices in its RFP or PPA processes to improve the solar industry’s share of future electric generation expansion, what would they be and why? Only five companies responded to question 12, which asked the industry to identify two utility behaviors it would like to see changed. This is a very disappointing response as the study team thought the answers would generate good information about solar’s market barriers. The nine suggestions given by the five solar companies are listed in Appendix D and include recommendations that utilities use best fit when selecting a project, rather than least cost, and provide land for solar plant siting. Better utility valuing of solar’s positive attributes can be imputed to two of the answers; otherwise, there is not much of a pattern.
2.2.3.12 Where will Solar Companies Bid? Question 13: In the next five years, will you respond to RFPs for large-scale solar generation within the US, but outside of the southwestern US? Question 13 tested the hypothesis that solar companies would not respond to RFPs outside of southwestern US because the market is so rich in the Southwest. The hypothesis was not sustained by the responses. Of the nine companies that responded to the question, only one replied it would not bid outside the Southwest.

36
2.2.3.13 Risk Sharing between Solar Developers and Utilities Question 14: What contractual risk does your company believe utilities should rightly bear that those utilities most often attempt to place on your company? Question 15: Are these risks identified in the RFP or are they usually discovered in PPA negotiations? Question 14 sought to identify the risks that the solar industry thought the utility industry should bear that they currently do not. Eight companies responded. Three of the eight responses involved cost-increase risk caused by tax law changes, material cost changes beyond a certain point or delays in the transmission process. Two others suggested protecting the solar developer from performance issues and the risks of a first-of-a-kind technology. Only three of the eight replies indicated that these risk allocations are identified in the RFP, which makes accurate bidding more difficult.
2.2.3.14 Management of Contracting Risk by Solar Companies Question 16: How does your company handle the risk that a bid price cannot be met, after the time it takes a utility to process a response to its RFP and negotiate a contract? Although concern about the risk of price escalation occurs throughout the solar industry according to responses to this survey, the seven companies responding to question 16 indicate that they feel they manage this issue well. The respondents’ answers to this question may be contradictory with responses to other questions that suggest that “allocation of cost escalation risk as a concern” is a problem. If the solar industry does manage price escalation well, perhaps they should more easily accept the risk and charge accordingly.
2.3 Elimination of Market Barriers The combined responses of the utility and solar industry respondents can be mined for suggestions to reduce barriers to increased penetration by large-scale solar generation into the new generation market. Both industries said they valued the environmental attributes of solar generation highly. The solar industry needs to use these attributes to argue for the higher price for its product. Much like a hybrid car demands a premium over a regular car, solar production can argue for an environmental premium over new coal or natural gas facilities. The difference is that a car owner can compare the premium for the purchase of the hybrid to the savings the hybrid will generate over time. Right now, utilities have a hard time doing this. It behooves the solar industry to quantify the value of its environmental attributes for the utility industry. Researchers can help by quantifying the uncertainty and risk premium associated with unknown future environmental restrictions, existing market prices or alternative compliance payments, or existing and hypothetical taxes on criteria pollutants, mercury, water use, carbon, etc. Both industries said that solar’s costs is a barrier to greater penetration. Although quantifying the value of solar’s positive environmental attributes, fixed price and dispatchability, may close the perceived cost gap, continued cost reductions in solar technology are needed. Joint participation in risky projects is one way to spread the risk for new facilities intended to achieve cost reduction goals. The utilities lack of knowledge about the types, costs and output characteristics of large-scale solar generation is also a barrier to solar’s market penetration. The solar industry should

37
establish a thorough educational process for utility planners and plant engineers through workshops, conferences, phone seminars, and other events, i.e. target more than just distributed PV utility personnel. As utility understanding of the costs and types of solar technologies improves, the perceived barriers to solar that exist for utility planners and engineers will diminish. Furthermore, utilities should identify the data and information they need to adequately compare the performance of large-scale solar to its fossil competitors, mostly combined cycle or combustion turbine natural gas plants. Utilities should then require this information in RFPs. A related issue is that utilities do not have as much confidence in solar developers and EPC contractors as they do in similar fossil-fuel entities. Utilities need to develop criteria that would persuade them of the competence and ability of solar developers to perform, and include these criteria in their RFPs. The solar industry needs to eliminate its self-imposed RFP participation barrier demonstrated by only two responding companies having bid in a baseload, intermediate or peaking solicitation. To prepare itself for these competitions, the solar industry should quantify its positive attributes and thoroughly understand utility business and operational characteristics and needs. For example, the solar industry highly values its product’s correlations with utility peak demand periods. Yet without storage, solar’s maximum production misses utility daily peak demand hours by four or five hours. Even with tracking, the correlation uncertainty is high. Furthermore, utility loads are relatively low during the spring and fall when solar companies expect to be paid for generation. Figuring out how to manage this mismatch could go a long way to increasing solar’s appeal to utilities. Another aspect of competing in baseload, intermediate and peaking solicitations is understanding what other generation technologies solar can best displace. Is it baseload generation? Can solar technologies provide 24/7 generation at a cost within reach of its competitors? Or is it better to focus on displacing intermediate generation like combined cycle technology, which tends to operate when the sun shines. Until the solar industry figures out a way to compete in these all-source solicitations, it is limiting its longer-term expansion potential. Another effort that might reduce market barriers is one that educates both parties about how to improve RFP processes. Utilities need RFP responses that align with their RFP requests and are reliable offers that will not change in negotiations; solar companies need more information in the RFPs about transmission paths, security guarantees, and performance standards. Although the responses to the two surveys were not as numerous as hoped, the results have provided useful insights into reducing market barriers for the large-scale solar industry. More work is needed to implement the actions suggested by an analysis of the responses, but the solar industry can accomplish them with cooperative efforts within the solar and utility industries.
2.4 Recommended Key PPA Elements On the whole, the survey results did uncover concerns about RFP and PPA terms and conditions. The solar industry wanted looser security and performance requirements; whereas, utilities wanted solar developers to respond to the stated RFP. Following are conclusions about what each party desires in a PPA that codifies an agreement stemming from a response to an RFP.

38
2.4.1 Solar Industry Perspective From the survey results, we can glean solar industry perspectives about what they want and need in a PPA, and perhaps earlier in the RFP. Solar Companies’ Needs or Wants in a PPA
Explicit payment for correct time-of-day value of solar generation. Explicit payment for capacity value. Assumption of cost escalation risk during the engineering,
procurement and construction phase after a specified period of time, if caused by regulatory delay or transmission improvement delay, beyond a reasonable estimate for these activities.
Pass-through to the utility of transmission improvement costs assigned to the solar developer, if those costs exceed original estimates by an excessive amount.
Utility uses performance guarantees and penalties they wrote in the RFP.
Utility uses delivery requirements in PPA that they described in the RFP.
Utility uses risk assignment they wrote in RFP. Utility uses collateral/security guarantees that they wrote in the RFP. Ability to adjust operational costs over time for inflation. Recognition that some solar technologies are not a firm resource and
adapting performance guarantees to that fact. Utilities should accept the risk of a change in the Investment Tax
Credit law. Eliminate consequential damages for newer solar technologies. Permit escape clause if costs escalate beyond a reasonable amount. Explicit payment for the value the utility places on solar’s ability to
reduce fuel price uncertainty, to reduce pollutant tax uncertainty, and to free-up emission space for traditional generation technologies.
2.4.2 Utility Perspective Similarly, we can glean utility industry perspectives about what they want and need in a PPA, and perhaps earlier in the RFP, Utility Companies’ Needs or Wants in a PPA
Solar companies adhere to pricing and other terms originally bid.
Acceptance of default performance guarantees and force majeure clauses that are stated in RFP.
Acceptance of a discount for the costs to the utility for following a highly variable generating pattern

39
2.5 Recommended Principles for Solar RFP and PPA Design After reviewing the survey results and using their industry experience, the survey analysts developed a list of principles for developing solar RFPs and PPAs.
The RFP should clearly and transparently describe all solicitation process rules and guidelines.
The RFP should clearly and transparently describe all terms and conditions that the utility expects bidder to incorporate into its bid by including a model contract.
The RFP should clearly and transparently describe any transmission paths that could accommodate the requested capacity’s size. Also, the utility should describe transmission expansion costs for paths that cannot accommodate the desired capacity.
The RFP should clearly and transparently describe the value the utility places on positive environmental attributes and on the value of avoiding emissions of criteria pollutants and carbon.
The RFP should clearly and transparently describe the peak hours of the utility by season or month.
The RFP should clearly and transparently describe the relative value of delivering energy during each hour of daylight for each season or month of the year.
The RFP should clearly and transparently describe the criteria the solar developer must meet to be considered as being a reliable developer capable of meeting the timelines of the RFP and the commitments in its response to the solicitation.
The RFP should permit developers to bid offering different pricing schemes besides “pay for energy only,” including capacity payments, time-of-day pricing, and seasonal pricing.
The developer should accept the terms of the RFP and model contract in the RFP and bid in accordance with those terms and not assume the developer can bargain away some of them.
Each party should accept the risk that it can best manage. For example, the developer should bear the cost of materials and construction based on a reasonable estimate for the time it takes to process bids, negotiate a contract, arrange financing, and complete EPC work. On the other hand, the utility should bear some risk for misestimating the time it takes to process the RFP, gain regulatory approval or denial, or develop an adequate transmission path.
Improve the education of both parties about how to improve RFP processes to their mutual benefit.
Utilities need RFP responses that reflect their RFP requests with reliable offers that will not change in negotiations.
Solar companies need more information provided in the RFPs about transmission paths, security guarantees and performance standards.
2.6 Conclusions from the Traditional Procurement Study This survey’s results have provided insights into the barriers to increasing market penetration of large-scale solar and into the mismatches between the solar and utility industries in their expectations for a solar-utility power purchase agreement. The three most severe barriers identified are: (1) the cost of large-scale solar compared to “traditional” resources; (2) the lack of solar technological and cost knowledge by utility engineers and planners; and (3) failure of solar developers to respond to RFPs for intermediate, peaking or “all-source” RFPs.

40
The survey analysts developed several recommendations to mitigate some of these barriers. Some of these recommendation include: (1) continued efforts to reduce the cost of solar; (2) quantification of solar generation’s positive environmental attributes through decision or risk modeling and analysis, which would close the pricing gap between solar generation and “traditional” generation; (3) encouragement of participation in joint development projects that have the goal of reducing solar costs and spreading the risk of purchasing new technologies; (4) development of an education program for utility engineers and planners that would increase their knowledge about large-scale solar technology and cost parameters; and (5) solar industry response to utility RFPs for peaking and intermediate capacity, which requires that solar companies learn more about utility needs, concerns and culture. Also, we recommend that the solar and utility industries get together and discuss the issues identified from this survey. Although our sample results are not statistically rigorous, the study team believes the information gathered from the responses can advance the potential for large-scale solar’s penetration of the market for new electric generating capacity. To succeed, the industry must understand its clients, price its product appropriately, and educate the utility’s planners and engineers about the benefits of its product.

41
3 Innovative Procurement Study: Procurement and Aggregation Techniques16
3.1 Introduction In order to achieve a more cost-effective scale for resource procurement or development, many utilities have in the past joined together to form “joint power agencies” or less formal buying pools. With several buyers acting together, this form of demand aggregation can lead to better economies of scale for developers, and also encourage innovation in procurement practices. Often, however, these joint purchasers rely on the traditional framework of issuing requests for proposals (RFPs). Beyond the framework of traditional RFPs, there are novel methods for procurement being developed in other industries that may have application for the solar industry. Building on a generation of efforts to deploy rooftop PV, for example, in recent months four large electric utilities—Southern California Edison, San Diego Gas & Electric, Long Island Power Authority and Duke Energy Carolinas—have announced somewhat similar projects to aggregate a large number of mid-sized PV installations in disparate locations into a distributed power plant. Ranging in size from Duke’s 10 MW to SCE’s 250 MW proposal, these projects not only expect to achieve cost saving from scale deployment, standardization of designs, and forward procurement contracts, but also by delivering the energy directly to the distribution level and avoiding transmission upgrades or siting hurdles. A different kind of aggregation takes the form of third parties attempting to aggregate the energy or renewable energy certificates (RECs) from disparate household/commercial PV installations. This potential scheme is being driven by the increasingly robust marketplace for RECs, particularly in states that have a special solar set-aside requirement as part of their RPS (notably New Jersey). It is also made possible by advances in computer tracking and solar financing options and subsidies that bring down the cost of producing and aggregating PV into a combined resource. Even further afield from traditional solicitations but increasingly attractive for certain kinds of resource acquisitions, are electronic procurement (e-procurement) platforms that allow for real-time transparent bidding and “reverse auctions” to drive bid prices lower than might be achieved otherwise. Initially put to use by pools of buyers in retail markets that allowed for direct access competition in the 1990s, these electronic auction mechanisms are being tried with varying degrees of success by utilities and may offer a new forum for solar power transactions. Additionally, other means for promoting the utility acquisition of solar and other renewable resources, such as feed-in tariff structures, may not technically be considered competitive procurement options, but in fact derive from the legacy of standard-offer contracts and fixed-price procurements that helped spur the renewable energy industry in the 1980s. Contemporary feed-in tariffs have been popularized in European markets, and are now being enacted in several US states as complementary policies to boost compliance with RPS, or to spur development of renewable market niches, such as smaller scale PV that could not effectively compete in RPS solicitations. As is often the case, California is taking a leading role 16 The complete references for the Innovative Procurement Study may be found in Appendix C.

42
in FiT designs, with legislation to set targets for new capacity of PV units up to 1.5 MW, and an increasing regulatory interest in possibly applying these pricing structures to utility-grade technologies. This section of the report will attempt to survey the field of innovative procurement options to determine which may offer greater chances of successful partnerships between utilities and developers of large solar installations. Key to this effort will be to identify techniques that have been tried in one region that may have application elsewhere and that will help spread the use of solar power from its traditional base in California and the Southwest to other potential markets. It will also identify some hurdles to successful utilization of these new tools, while offering conclusions and recommendations for more effective procurement in future markets.
3.2 Utility Aggregation and Solar Power Collaboratives
3.2.1 Opportunities and Drawbacks Combined purchases, aggregation of demand and joint ownership have been very successful strategies for the development of large-scale utility resources, whether generation or transmission. However, the most successful of these efforts come about because there already exists a legal framework (i.e., joint powers agreement, professional association, or affiliate relationship among the purchasers) that can better manage the process. New consortiums of utilities that have tried to aggregate are encountering significant problems from attrition of participation, changed expectations over time, and the difficulties of properly allocating risks and rewards among participants.
3.2.2 Background and Discussion There has been widespread interest in large-scale concentrating solar thermal power among southwestern US utilities for nearly 30 years. After the second oil shock of the 1970s, the US Energy Research and Development Administration (ERDA), and its successor organization, the Department of Energy (DOE), established a well-funded program to accelerate the commercialization of solar power. Dish Stirling, central receiver, and parabolic trough technologies advanced from the conceptual stage to commercial prototypes over a five-year period. DOE viewed Southwest US utilities as the principal constituency to be served by this new technology. Most of the major utilities joined user groups, established internal research and development efforts, and supported early demonstration projects on a collaborative basis. The simple thinking behind these collaborations was that by pooling resources for research and possible development of such resources, the entities could achieve greater shared benefits beyond what each might be able to achieve individually.
3.2.3 Early Attempts at Collaborations Solar 1 Project In the late 1970s, DOE established solar central receiver technology as the most promising bulk solar power option. Southern California Edison (SCE) took the lead to develop and implement a commercial demonstration project in collaboration with Sandia National Lab and several large

43
industrial participants. Several other Southwest utilities were non-funding participants in technical advisory committees. Solar One was completed in 1981 and was operational from 1982 through 1986. Solar 2 Project The early 1990s saw advancement in central receiver technology in the form of molten salt as the heat transfer fluid and storage media. Again, SCE worked with Sandia to define and fund the project. But this time, other California and Southwest utilities co-funded the project, including the Sacramento Municipal Utility District (SMUD). Solar Two was operational from 1995 to 1999. After the demonstration period, SMUD and SCE briefly formed a central receiver buyers’ consortium to stimulate market pull for the technology. However,mass restructuring of the electric industry in the mid 1990s put a temporary halt to the utilities’ pursuit of new CSP power plants in California. MacDonald Douglas Dish Program While solar central receiver (and solar trough) technology has significant economies of scale at the power plant level, technologies like dish Stirling and PV have significant economies of mass production. MacDonald Douglas worked on development of the solar dish Stirling system beginning in the late 1970s. Attempts were made to establish mass-buys from the utility industry to stimulate sufficient demand to warrant development of large-scale production facilities. SCE, PG&E and Arizona Public Service Company were among utilities that stepped forward. However, MacDonald Douglas abruptly abandoned the program when oil and gas prices began to fall in the late 1980s PVUSA In the 1980s, PG&E, DOE and about six other Southwest utilities began the PVUSA project to establish utility criteria and gain experience with PV technology. Large purchases (by the standards of the time) were made from eight vendors. SMUD took over the program from PG&E in the early 1990s and used it as a programmatic springboard for the “sustained orderly development” of utility PV markets.
3.2.4 Current/Evolving Market Situation As renewable portfolio standards emerged throughout the Southwest in the early 2000s, and wind and geothermal resource availability began to become constrained, utility interest in solar power re-emerged. Again, as utilities began to seek large amounts of solar power (fractions of TWh/yr), given the benefits of economies of scale (plant economies with troughs, central receivers, and linear Fresnel; production economies with PV and dish Stirling), larger projects gained additional utility consideration.
3.2.5 Economy of Scale Issues Power plants that use steam Rankine cycle prime mover heat engines to convert thermal energy into electricity, such as coal, nuclear, parabolic trough, central receiver, and linear Fresnel power systems, typically have significant economies of scale. Due to a number of physical features, steam turbines perform better as they get bigger.

44
Figure 1: Steam Turbine Performance as a Function of Size17
As steam turbines get larger, they also cost less per MW of installed capacity. And finally, the operation and maintenance cost of steam turbines is nearly independent of size. The number of operators and maintenance costs for a 50 MW steam turbine is about the same as for a 250 MW steam turbine. As a result of these extreme power block economies-of-scale, large concentrating solar plants have lower electricity costs compared to smaller plants.17
17 “Large Plant Studies” by Bruce Kelly, Nexant, Inc. presented at the Parabolic Trough Review Meeting, February 14, 2006.

45
Figure 2: Cost of Solar Trough Power as a Function of Plant Size17
As mentioned earlier, these size effects have been well known throughout the utility industry for many decades. There are numerous instances where utilities have come together to develop very large projects as a group, to gain the cost economies of scale, while only receiving a portion of the plant output consistent with their individual needs. Examples of such projects across the Southwest US are the Four Corners and San Juan coal plants in northwest New Mexico, and the Palo Verde Nuclear station near Phoenix.
3.2.6 Joint Utility Ownership In addition, several major transmission lines have been built by consortiums of utilities on a joint-ownership basis, including the 500 KV Palo Verde-Navajo line, employing differing configurations of ownership for each segment of the project.18 Among precepts to successful joint projects embodied in the Southwestern model are:
Facilities are owned by participants as “tenants in common” with each owning a pro-rata share;
All costs and liabilities are shared in proportion to ownership percentages; One of the owners typically acts as operating agent and takes direction from other
owners; Various administrative committees ensure all owners are appropriately involved in the
oversight and administration of the project; Pre-established voting processes are used for approval of budgets, major expenditures
and significant operational costs; Modifications to the joint-ownership agreement must be approved by all owners;
18 “Joint Ownership of Transmission Projects,” American Public Power Association, January 2006.

46
Owners indemnify each other and the operating agent; Owners have a reasonable right to assignment of another owner’s share to a third party.
Though specific to transmission, these concepts may be valuable model for ownership of joint assets of any kind.
Spotlight: Southern California Public Power Authority Among the most successful efforts to aggregate utility resource acquisition are those of the joint powers agency, the Southern California Public Power Authority (SCPPA). Founded in 1980, SCPPA currently has twelve members representing the public power utilities for the cities of Anaheim, Azusa, Banning, Burbank, Cerritos, Colton, Glendale, Los Angeles, Pasadena, Riverside and Vernon, plus the Imperial Irrigation District. SCPPA members deliver electricity to approximately 2 million customers over more than 7,000 square miles, with a total population of 4.8 million. SCPPAs joint financing and development efforts include four generation projects, three transmission projects, four natural gas projects and four renewable energy projects, with several others pending. Each joint project consists of a differing configuration of participants within the authority, depending on each utility’s resource needs. A milestone in this joint ownership scheme for generation was the 240 MW natural gas-fired Magnolia power station in Burbank, representing the first project to be wholly owned and operated by SCPPA members, with participation by Anaheim, Burbank, Cerritos, Colton, Glendale and Pasadena. This combination of facilities brings power into California from Arizona, New Mexico, Utah, and Nevada. The agency also has jointly contracted for energy scheduling and trading services, demand response and local resource adequacy, financial services, risk management, and even a greenhouse-gas mitigation study for two units of the coal-fired Intermountain Power Plant in Utah. “Our members actively look for ways to work together,” said SCPPA general manager Bill Carnahan.19 Since 2002, SCPPA has issued four solicitations for renewable energy resources, which together sought as much as 810 MW of capacity. According to Carnahan, the initial two solicitations did not result in as much capacity as was originally sought, but a 2006 RFP seeking 300 MW eventually resulted in 500 MW of purchase commitments. The 2008 solicitation being wrapped up currently asked for up to 315 MW, but was met with offers from dozens of viable projects, Carnahan indicated. The results of the bid will help member utilities meet their renewable portfolio standard goals, which range from 20 percent by 2010 to 35 percent by 2020. In California, municipal utilities operate autonomously from California Public Utilities Commission RPS standards, which require regulated entities to reach 20 percent by 2010.
19 Interview with Bill Carnahan, August 2008.
47
So far, SCPPA has contracted for purchases of energy from 500 MW of wind, up to 12 MW of small hydroelectric, and 50 MW of geothermal power, along with much smaller landfill gas and feedlot biogas projects. “We’ve probably committed hundreds of millions of dollars to renewables,” Carnahan said. “What we’ve found is that as we’ve gotten more sophisticated, the proposals have gotten more sophisticated. We now get more proposals than needed, which allows us to pick and choose.” So far, there have been no SCPPA commitments to solar power, although the group is considering proposals for concentrating solar in the current RFP process, Carnahan indicated. “We had been working for a year on a CSP project, but it has a long way to go before it is cost-competitive with wind,” he said. “It didn’t pan out.” However, SCPPAs evaluation did not assign higher value to CSP if it were made dispatchable with thermal energy storage. SCPPA has also pioneered contracting techniques that result in lower costs and more certainty for project developers, with added benefits for the utilities. One example is the contract announced in early 2007 for up to 200 MW from the UPC Milford Wind project in Utah. Structured as a 20-year power purchase agreement, SCPPA committed to pre-paying for energy deliveries as soon as the project reaches completion in December 2008. The agency also negotiated an option to buy the facility after the first 10 years of the agreement. The pre-payment will be made from proceeds of a tax-free municipal bond sale. The assurance of funds provided for easier financing for the developer, and the ability to capture benefits of federal investment tax credits/production tax credits, for which the munis would not be eligible. Carnahan estimated that the overall savings will amount to somewhere between 15 and 20 percent of a comparable capital investment and for “energy delivery at the lowest possible cost.” In other cases, SCPPA members would prefer to take ownership of the projects from the beginning, as in three deals the agency is currently negotiating, Carnahan said. Also critical to SCPPAs success in joint acquisition is its role as builder and owner of transmission lines. “Every project has to be capable of being physically delivered to our members,” he said. Developers must also be able to pass every step along the permitting and siting process.
3.2.6.1 Joint Development Group In early 2006, a group of Southwest utilities from four states came together to consider how they could pool solar electricity demand in a way that could result in substantial cost savings to each compared to unilateral actions. The premise was that a regionally developed solar power project, built at as large a scale as plausible at the time, could provide significant economies of scale and lower electricity costs. Generation from a very large CSP facility had the potential to add energy, capacity value, and renewable energy credits at costs far lower than that of a facility designed to serve any individual utility. So, the utilities moved to aggregate the opportunity by engineering, designing and developing such a project.

48
Initially, the Joint Development Group (JDG) consisted of APS, SMUD, Salt River Project, Public Service of New Mexico, Xcel Energy, Tucson Electric Power, El Paso Electric, and the Northern California Power Agency. NREL and Sandia National Laboratory supported the group with technical advice. The group issued a request for information relating to a potential CSP plant approximately 250 MW in size. Due to a more favorable transmission situation and being central to most of the participants, Arizona was identified as the preferred location for the initial facility. The original target date for commercial operation was 2010. The JDG members were interested in evaluating both utility and IPP models for plant ownership. Several members had sites that could serve as the power plant site and the RFI sought information on both developer-provided sites and member-supplied sites. The group solicited information on a wide range of CSP technologies to better understand the commercial readiness of each technology as well as to understand costs and economies of scale potential. Storage was of key interest to most of the members. Information on solar-fossil hybrids was also solicited. With an interest in near-term commercial viability, the group indicated a preference for trough, dish Stirling, and concentrating photovoltaic power. The solicitation requested information on design, performance, O&M requirements and costs, and options for financing. Several of the original members of the JDG dropped out of the group during 2007, evidently because their individual comfort level and need for large quantities of solar power grew to a level that would allow them to achieve the anticipated economies unilaterally, i.e. they decided to pursue large projects on their own. APS issued an RFP on behalf of the six remaining JDG members in December 2007. The solicitation requested offers for a 250 MW project with options for thermal energy storage and fossil energy backup. The selected project would be owned by the third-party developer, with each of the consortium members signing long-term power purchase agreements. A strong preference for projects sited in Arizona or Nevada was specified. In July 2008 several developers were pre-short-listed for the project. Negotiations between these developers and each of the JDG members for off-take contracts are still underway and project proponents are unable to forecast when agreements will be reached, but expectations for commercial operation have been pushed back to at least 2012. According to utility participants in the JDG, market conditions have changed significantly since the inception of the project, leading to uncertainty over the necessity of the joint approach. “No one at the time was ready to proceed by themselves,” noted Barbara Lockwood, manager of renewable energy for APS. “The glue that held us together was the renewables component. We needed each other two years ago, to even talk about this. Now the market has changed. For us it’s no longer about meeting the RPS, but it was extremely important at the time. I couldn’t see this getting started in today’s atmosphere.”

49
Allocation of risk among developer and participants is “the heart of the matter right now,” according to Lockwood. “It will be the defining factor going forward and will determine the ultimate success of the process.”20 Lead sponsor APS has, in the meantime, contracted for the 280 MW Solana Generating Station CSP project to be built near Gila Bend, south of Phoenix. The plant will be built by Abengoa Solar Inc., and is scheduled to provide electricity beginning in 2011. APS has also issued two recent renewable energy RFPs on its own. The first, a traditional PPA solicitation for 5- to 30-year power sales (minimum 35,000 MWh with targeted purchases of 250,000 to 1 million MWh annually) would also contemplate buyout options, build/transfer arrangements or joint ownership. According to APS’ manager of resource acquisitions, Gordon Samuel, the solicitation received “our biggest response ever,” from a wide variety of resource types, including CSP, PV, wind and geothermal.21 The utility has also issued an RFP for distributed renewable energy, meant in part to elicit new approaches to meeting its “distributed energy requirement” as part of the Arizona RPS, which Samuel termed, “very difficult to meet.” The purpose of the solicitation, he said, is to “look for different business models that we can take to the [Arizona Corporation] Commission for consideration.” Another intent is to find ways to reduce costs of smaller roof-top PV installations. At least one bidder has approached the utility to discuss third-party aggregation of as many as 50,000 roof-top installations into a single resource, he indicated.
3.2.6.2 Joint Parabolic Trough RFP – New Mexico In 2007, the Electric Power Research Institute (EPRI) was contracted by a group of utilities led by Public Service Company of New Mexico (PNM) to conduct a feasibility study to determine options for a 50 MW to 500 MW solar plant in New Mexico. The EPRI study investigated different solar technologies, mapped the solar resources of the region, and estimated transmission costs from various parts of the state. Taking into account other variables including water access, EPRI studied cost projections for a number of technology and location models, determining that parabolic trough technology was the most viable resource to be considered under current market conditions.22 Part of the push for expanding solar comes as a result of changes to the New Mexico RPS. The new carve outs require IOUs to use renewable sources to supply 10 percent of retail sales by 2011, 14 percent by 2012, and 20 percent by 2020. Following up on the EPRI report, the group of four electric-power providers released a joint RFP for a large scale CSP project to be built in New Mexico. The project participants include PNM, El Paso Electric (EPE), Southwestern Public Service Company (SPS), and Tri-State Generation and Transmission Association, Inc. (TSGT).
20 Interview with Barbara Lockwood, APS, June 2008. 21 Interview with Gordon Samuel, APS, August 2008. 22 “New Mexico Central Station Summary Report,” EPRI, April 2008.

50
While the project selection will be jointly executed, individual PPAs will be developed with the four project participants. However, PNM has expressed an interest in owning the project outright, but a joint-ownership model is still on the table. One issue with a standard PPA between the developer and utilities is that some participants are concerned that a long-term purchase commitment might be viewed as a financial liability (debt equivalence) by credit ratings agencies. The joint ownership model has been used by PNM and several of the group members for shares of the Palo Verde Nuclear Generating Station, and the San Juan and Four Corners power stations. The project is requested to produce between 211,000 MWh/yr and 375,000 MWh/yr. The projected online date would be in 2011, with energy being purchased beginning January 2012. Sitting recommendations are offered by the project participants but are not exclusive; any site in the state is acceptable. Although transmission responsibilities lie on the project developer, transmission costs may be reflected in energy pricing. First and foremost among the noteworthy points of this PPA is the fact that the project participants have determined that building a central solar power station to serve them all will be more cost-effective than building smaller individual plants in their own distribution areas. Secondly, the utilities are placing a value on learning about CSP from the project, which indicates they recognize the value which increased solar resources can provide.23
3.2.8 Issues and Challenges Associated with Joint Commercial Actions While the potential benefits of utility procurement collaboratives can be large, there are also many challenges that make them difficult to implement in practice. Contracting Utilities, like all large companies, typically have unique contracting processes, legal criteria, and perception of risk. As such, they have unique needs and requirements when it comes to structuring contracts, particularly for electric power procurement. It was the APS JDG’s stated intention to negotiate individually with the bid winner and enter into unique, bilateral contracts. This eliminates the need for the utility members to agree upon a standard set of terms and conditions, and more weighty commercial terms. But it puts the developer in the potentially untenable position to craft five separate, unique contracts for the same project. Financing Large solar projects typically are financed with bank debt, often on a non-recourse or limited recourse basis. While having a portfolio of off-takers on a PPA would be viewed as desirable from a bank’s perspective, the credit rating of each off-taker is relevant to the risk perception. If not carefully crafted, the entire project might be saddled with the rating of the least credit worthy utility off-taker. If the strongest utility participant is willing and able to guarantee the entire purchase (from the debt financing’s perspective), this can alleviate the credit-rating problem. Geography While there are numerous examples of utility consortia successfully developing projects that were quite distant from member utility control areas, this may prove more problematic for solar
23 Interview with Travis Coleman, PNM project manager, May 2008.

51
projects. Utilities are likely interested in being able to show off high-profile renewable projects to their constituency, which becomes difficult if projects are located far away. In addition, utilities are looking to solar power to provide a great deal of capacity value. Often this capacity value can only be derived if the plants are close-coupled to their load centers. Transmission The entire Western Electricity Coordinating Council (WECC) is well interconnected, and power plants routinely provide energy and capacity to utilities across the West from 1,000 miles away. But the WECC is also becoming increasingly constrained from a transmission perspective, and it is no longer possible to easily transmit power from new electric resources that are far from utilities into their control areas. Mixing IOUs and Munis: Several of the coal and nuclear plants identified above that are examples of successful utility procurement collaborations involved a mix of investor-owned and publicly-owned utilities. However, with consideration of tax treatment, and future ownership scenarios, the challenges of mixing IOUs and munis in the same deal are increasingly complex for renewable projects.
3.3 Large-scale Solar Photovoltaic Acquisition
3.3.1 Opportunities and Drawbacks Despite advances in technology and performance, solar photovoltaic systems remain at a competitive disadvantage in traditional utility procurement solicitations. In head-to-head comparisons with other technologies for total cost of installation, interconnection, maintenance and power production, PV costs to date have been perceived as far above the competitive field. One novel method to overcome these perceived drawbacks is a defined deployment program, under which a utility will commit to installing a specified amount of PV capacity in a defined period. Current proposals along these lines favor both utility ownership of the facilities and adding this capacity into the regulated rate base, with the argument that it is an effective mechanism to expedite certain niches for solar PV currently not served well by competitive markets. Nonetheless, these proposals face significant opposition from competitive market players, consumer advocates, and others based on proposed cost, ratemaking treatment, and the perception of utility monopoly control.
3.3.2 Background and Discussion In the recent EPRI study to determine parameters for a joint Southwestern utility solicitation of solar power, large-scale PVs did not even make the first cut of consideration, largely because of high cost relative to other solar types, and also because there was no working experience with a facility in the United States larger than 20 MW. For these reasons, commercial PV tends to lend itself to smaller scale applications, on homes and commercial rooftops (1,500 watts and up), or as part of somewhat larger sized (200 KW to 3 MW) installations at public facilities.

52
Even so, these projects often rely upon financial support in the form of “buy downs” of costs subsidized by “public goods charges” or utility bill levies that reimburse the hosts of the systems for some portion of the initial expense of installation. Increasingly, these supports are being supplemented with novel financing arrangements to reduce the long-term cost of the units, or even incorporating them into the mortgage for homeowners. Over the past decade-and-a-half, these utility-grade solar PV supports have evolved to match marketplace needs and the desires of customers. The following instructive case study is a review of how the programs sponsored by the Sacramento Municipal Utility District changed over the years.
Spotlight on Sacramento Municipal Utility District from Pioneers to SolarShares Among the earliest PV demonstration projects in the United States were the Photovoltaics for Utility Scale Applications (PV-USA), sponsored by the U.S. Department of Energy. The Sacramento area was one of three sites nationally, and served as the “flagship” of the program—in part because of the media publicity attached to its location adjacent to the failed Rancho Seco nuclear facility. The visual juxtaposition of Rancho Seco’s defunct cooling towers and the arrays of PV panels appeared to provide the general public with some clear sense that solar PV was an emerging “alternative” technology. This experience also provided a solid basis for SMUD’s PV Pioneer program, launched in 1993. The program initially recruited utility customers to pay an additional $4 per month to have the utility install small 2 KW to 4 KW arrays on their roofs. This monthly fee did not cover the entire cost of the program, which was spread among all of SMUD’s customers. Importantly in this first program, the PV systems on customers’ homes belonged to the utility, as did the electricity they produced. PV customers did not receive a discount on their electricity usage or any ‘net-metering’ allowance, but were pioneering participants in advancing the use of PV. A second phase of PV Pioneers matched a reduced-cost installation of PVs with a “net metering” option that credited the customer at retail rates for power generated by their system beyond what was used at the location. In short order, the PV Pioneer II program was delivering over 1.5 MW into the utility grid—with 1.2 MW new capacity installed on over 220 homes in the year 2001 alone. By 2002, SMUD boasted a then-leading 10 MW of total PV capacity at over 1,000 locations, thanks to its Pioneers and program incentives. The rapid growth pushed the utility to add staff and resources to the program, and in 2004 the Pioneer program was revamped to add the use of non-utility system sales and installation contractors. The utility helped to train and certify approved contractors for installation services under the program and revised its support to initially provide up to $3.50/watt toward the installation cost of the PV systems. Since then, as a result of popularity of the program, lessons learned about optimal solar placement, and somewhat improved economics, SMUD reduced the support level to $2.50/watt, based on expectations of system performance. The incentive is paid directly to the approved contractor, but reflected in the vendor’s bid to the customer. A newer iteration of utility support for PV takes the form of SMUD’s “SolarShares” program that commenced July 2008. In this program, the utility will allow all customers—including renters and occupants of multi-unit buildings—to purchase solar power at a fixed monthly price from a

53
centrally located PV facility and remotely offset their retail electric bills. The program, the first of its kind in California, is also billed as the largest solar PV project in the United States built in response to customer enrollment via a voluntary green pricing program. For an average of $5 to $30 extra per month over current retail rates, customers will subscribe to least 10 percent and up to 50 percent of their energy from the new SMUD solar farm located near Wilton in southern Sacramento County. Additional benefits include portability of the contract if the consumer moves within the SMUD service territory, potential bill savings during the summer months when electricity prices and solar production is highest, and a long-term fixed price for the solar portion of their bill. If rates rise faster than the embedded inflation in the solar rate, consumers could save money over the long-term. The utility held a solicitation in 2007 and selected enXco, a division of EDF Energies Nouvelles Company, out of a field of 25 bidders. SMUD purchases the 1 MW project's output under a 20-year Power Purchase Agreement. The ground-mounted, fixed-tilt solar array consists of approximately 14,000 First Solar modules, and is expected to generate enough electricity to power approximately 600 homes.
3.3.3 From Demonstration to Grid Operation In the United States at the utility level, there are many instances of small to medium sized solar units currently in operation, contracted as a result of strictly tailored solicitations or pilot contracts—driven either by attempts to meet the goals of a Renewable Portfolio Standard (RPS) or through other regulatory mandates. A prominent example of a targeted PV development is the California Solar Initiative (CSI) that seeks to “jump start” the marketplace for rooftop PVs with a $3 billion commitment over 10 years, adding at least 1,750 MW of solar photovoltaics in that time. The energy from these units is not counted toward fulfillment of the regulated utilities’ RPS goals. Originally promoted by Governor Arnold Schwarzenegger as a “Million Solar Roofs” program, the program initially stalled in the state Legislature, but was picked up by the California Public Utilities Commission (CPUC) as a mandate for the state’s three largest electric utilities and other regulated load-serving entities in 2005 and re-named the “California Solar Inititative.” After regulatory adoption, the Legislature followed with a revision to the program under Senate Bill 1, which was authored by Sen. Kevin Murray (D-Los Angeles) and signed into law in 2006. SB 1 expanded the CPUC’s CSI mandates to customers of municipal-owned utilities, and allowed for greater use of net metering by customers as a further incentive to installing PV panels. SB 1 also required developers of more than 50 new single-family homes to offer the option of a solar energy system to all customers beginning January 1, 2011. In the first 18 months since it became law, the California Solar Initiative resulted in the installation of 78.6 MW. This represents a 40 percent increase in the total amount of rooftop PV capacity in state compared to when the CSI program was first launched as a mandate in 2005. Currently, the state has a total 340 MW of grid-connected PV in operation. The CSI program is geared toward smaller units, for both residential and commercial applications. In all, more than 12,055 small PV projects have applied to participate in CSI, representing 304.4 MW of installed capacity. Of these 11,653 projects remain in active

54
development or have reached operation, bringing 251.5 MW on-line. To date, the CPUC program has committed $763 million in ratepayer funds.24 With successful operations being documented for earlier installations, confidence is growing in the use of PV, and recent contracts indicate willingness by some utilities to sign long-term contracts for larger facilities as part of their RPS commitments. For example, the CPUC in December 2007 approved a PG&E contract with CalRenew-1 for a 5 MW unit, while in July 2008, SCE received approval for a 7.5 MW solar PV facility developed by FSE Blythe. This last project could be scaled up to 21 MW eventually. Currently, the largest operational PV system is the 14 MW facility at Nellis Air Force Base in Nevada, which went into service in 2007 to provide energy to Nevada Power utility. Internationally, there are now two 20 MW PV stations in operation in Spain, and the first 24 MW of an ultimately 40 MW Solarpark Waldpolenz in Germany reached grid operations in 2008, with the full 40 MW expected to reach completion in 2009. The scale of utility-grade PV is on the cusp of tremendous expansion. In recent months, PG&E announced signing contracts for two new projects that far outstrip the scale of previous designs. The largest at 550 MW is planned for operation in 2011 by OptiSolar, a subsidiary of Topaz Solar Farms in San Luis Obispo County. The second project, with capacity of 250 MW, will be developed in the Carrizo Plains region by SunPower, a subsidiary of High Plains II. The growth in the U.S. market for utility-grade PVs should be viewed within the international context, as European installations dominate the world market. According to the latest figures, by the end of 2007, there was a total 147 MW of large-scale (>200 KW) PV systems in operation in the U.S, representing 15 percent of the global market of 955 MW.25
Spotlight on Community Choice Aggregation While the majority of this report looks at efforts geared specifically towards utilities and electric service providers, the following examples highlight recent innovative techniques for municipalities to acquire community-owned renewable capacity. Community Choice Aggregation is a policy that allows local governments to act as procurement agents, while maintaining a relationship with a franchised utility to provide distribution and related services. In competitive retail markets around the nation, such as in Ohio, Massachusetts and Connecticut, community aggregation practices tend toward periodic competitive solicitations of wholesale energy from utility or non-utility providers, with least-cost outcomes favored by the purchasing entity. To date, there has been little emphasis on obtaining renewable energy under these solicitations. In California, however, the community choice model being pursued by several cities is favoring acquisition of renewable energy, often with a specific focus on solar PV. In the City of Berkeley and Marin County, both in California, there are currently two different and highly creative approaches to inducing renewable energy developments. 24 “California Solar Initiative,” CPUC Staff progress report, April 2008. 25 “U.S. Solar Industry Year in Review 2007,” Prometheus Institute/Solar Energy Industries Association.

55
Berkeley The Berkeley City Council has unanimously voted to implement a solar energy finance option that will begin in late 2008. Called Berkeley FIRST (Financing Initiative for Renewable and Solar Technologies), this program will use the city’s credit to obtain favorable rates on loans for PV. Rather than having each homeowner seek individual financing for solar PV installations, the city will acquire a pool of funds for individual solar projects to be paid back through the homeowners’ property taxes, as a special property-tax district. The payback for the loan to the city will be over 20 years with collateral being the value of the home or property. The first round will feature 40 installations with up to $37,500 loaned to each home. This is aimed to help the city reach its goal of 80 percent GHG-emissions reductions by 2050. The innovative function of this program is twofold. The first hurdle it overcomes is project finance. By having the city sponsor the loans, it allows for a much greater accessibility to capital. Attaching the payback of the loan to the property tax allows the city the confidence in its expected return. The second hurdle it overcomes is up-front costs for customers. Eliminating up front costs in turn spurs participation. The streamlining of the process allows the homeowner to receive the loan through the city rather than having to search for individual financing, saving time and money. Additionally the panels become incorporated into the property and if the house or building is sold before the mortgage has been paid off, the mortgage debt transfers to the new owner of the building. The question of acquiring the technology is straightforward. The city will not be controlling the project development of the technology, leaving that to private contractors and homeowners. The contractor must be certified through the California Solar Initiative, which will also allow for the homeowner to receive a rebate from the state. In that way, each homeowner will still be acquiring contractors for their own projects, while financing has been taken care of by the city. Marin County Across the San Francisco Bay, Marin County is proposing its own innovative plan to rapidly green its grid. The Marin Clean Energy plan aims at reducing greenhouse-gas emissions by 15 to 20 percent in its first year of operation. This Community Choice Aggregation model would allow the 11 municipalities within Marin to form a joint powers authority (similar to the legal form used by Southern California Public Power Authority described earlier) that will offer customers various shades of “green” electricity as an alternative to the franchised utility service from Pacific Gas & Electric. The benefit of the JPA is that its focus will offer its customers increased electricity from renewable energy. The initial stage of the JPA would be to send out a Request for Proposals (RFP) for Electric Service Providers (ESP) to work with the county in a multi-year contract. The selected ESP will first be supplying clean energy from outside the county. In time, the second stage of the process will be to have the ESP assist in finding financing and developing projects to build renewable generation capacity that would be owned by the community. The JPA expects to offer two electricity options, a “light green” and a “dark green” option. The light green could allow customers to purchase between 25 percent to 50 percent renewable power at the same rate or cheaper than their average utility rate. The dark green option will allow them to buy 100 percent renewable electricity at a premium of 8 percent to 10 percent above the standard utility rate. This added cost is expected to diminish to below the utility rate around the eighth year.
56
The local benefits of the program include increased economic activity, lower electric bills in a short time frame, and decreases in greenhouse gas emissions. By aggregating the demand from all participating counties and using competitive solicitations for an ESP, the model anticipates identifying least-expensive options to provide renewable electricity to the JPA members. Alternatively, if each county or individual for that matter were installing its own capacity or individual units, they would be smaller in size and higher in cost. Conclusion The Berkeley project offers an innovative finance mechanism that aggregates the need for loans into one loan that is administered by the city, while the project development is handled by individuals. The Marin CCA does the opposite. It is financed by each individual who buys into a program while the project development is handled in aggregate by the JPA. The project costs are ultimately cheaper by virtue of more individuals participating in the program and thereby aggregating demand. Both examples offer innovative techniques that could be adopted for more case-specific renewable procurement strategies.
3.3.4 Southern California Edison’s PV Deployment Program In March 2008, Southern California Edison (SCE) announced an ambitious utility-scale solar project in the form of an announcement to install 250 MW of rooftop PV over a five year period—with an option to double the program if it proves successful.26 This program, with an estimated price tag of $875 million would complement the state’s solar program, according to the utility, by bridging a gap between the focus on small PV units in the CSI program, and larger facilities that would bid into resource procurement solicitations meant to meet the RPS. What SCE envisioned was a portfolio of 1 MW and 2 MW units built on commercial rooftops in solar favorable locations, such as San Bernardino and other “Inland Empire” counties. The units would be part of the utility rate base, installed under long-term leases for rooftop space—what SCE President John Fielder calls a “rent-a-roof” model.27 Each installation would require approximately 25,000 square feet and the rooftop leases are for 20 years. Rudy Perez, the utility’s manager of the Large Rooftop Solar program, recently told an industry audience, “We want portfolio owners of relatively new buildings (less than 45 years) that can hold 4 pounds/square foot. Lease rates are undetermined, subject to negotiation, as this is all ‘new ground’.”28 The first lease negotiated for this program had a floor and ceiling cost that ranged from $0.10/sq ft to some (unspecified) percentage of the total value of the power. No on-site power will be provided for any of the projects. “The only thing the roof owner gets is the lease payment,” Perez said. Though the DC nameplate capacity is 250 MW, the utility estimates effective AC grid capacity will be 200 to 225 MW. Power would not be used for on-site applications but delivered to the distribution system, limited to 12 kV and 16 kV circuits to avoid the need for special
26 A08-03-015, Southern California Edison, filed with CPUC March 18, 2008. 27 Interview with John Fielder, June 4, 2008. 28 Presentation to SEPA teleconference, April 29, 2008.

57
interconnection studies or transmission system upgrades. SCE said it would limit output to 15 percent of the local circuit load. The utility argues that the program will provide a sufficient boost in demand for PV, will transform the marketplace, and will result in considerable cost-efficiencies through standardized designs and development of a trained installation workforce drawn from the ranks of the International Brotherhood of Electrical Workers union. The utility conducted a limited Request for Offers for the first installation and in April signed a purchase order for 2.4 MW from FirstSolar. The installer will be the building owner, ProLogis REIT, using subcontractors approved by the IBEW. Initially, the utility anticipated circulating a larger Request for Offers by the end of 2008, but delays in the regulatory approval process will likely push that into 2009. The utility is anticipating a “winner takes all” vendor for the program and will consider smaller proposals, but not single project bids. It is also discussing “volume discounting” with component manufacturers. SCE is looking for a vendor who could supply 50 MW of PV panels per year for five years at a cost of $3.50/watt to $3.85/watt, or “half the cost of typical small commercial installations,” according to a confidential URS market study cited by the utility during an April public presentation. Each installation is equivalent to approximately 83 household installations. SCE also filed for approval of a memo account mechanism that would allow spending $25 million for its first three installations, while the regulatory proceedings occur. The CPUC has signaled it will allow the utility to begin recording its initial expenses, but the resolution approved in September withholds a decision on the reasonableness of the expenditures. In anticipation, SCE is already proceeding with its first installation, which is expected to reach commercial operation December 1st, 2008.
3.3.5 Duke Energy’s Model Soon after SCE proposed its PV deployment plans, Duke Energy (NC) announced a similar, if smaller scale version in North Carolina. Duke originally asked for approval of a two-year, $100 million program to install up to 20 MW of distributed PV on residential and commercial rooftops throughout its territory, or on property owned by the company or its customers. After encountering cost concerns from regulators, the utility in October 2008 revised its program to $50 million and 10 MW.29 Duke foresees a wide variety of locations for the installations, including large warehouses, commercial and industrial buildings, office buildings, schools, single- and multi-family homes and subdivisions.30 Noting that the current combined total of PV in its territory is just 60 customer installed units and 300 KW, Duke said its new program would “help evaluate the impact of distributed generation of 29 Duke has since announced that this commitment may be cut in half, due to perceived risks and the weakened economy. 30 Application before the North Carolinas Utilities Commission, No. E-7, Sub 856, filed June 6, 2008.

58
a significant scale on the company’s electric system, explore the nature of solar distributed generation offerings desired by customers, fill knowledge gaps to enable successful, wide-scale deployment of solar PV distributed generation technologies, and promote the commercialization of the solar market in North Carolina through utility ownership.” Similar to SCE’s program, Duke expects that most of these installations would not be used for on-site power at each location, but would be connected to the utility system at the distribution level to reduce costs and avoid grid upgrades. However, some of the ground-mounted or larger warehouse facilities may be connected to the transmission system, depending on location and voltage levels. The utility estimates that 80 percent of the installed capacity will consist of larger ground-mounted or rooftop units ranging in capacity from 500 KW to 3 MW. About 10 percent are to be located on schools, office buildings, or other commercial facilities and would range from 15 KW to 500 KW. The rest of the installations will be located at residential sites and would be sized from 1.5 KW to 5 KW. This variety of sizes and configurations indicates that Duke’s solicitations for equipment and services will be less of a “one-size-fits-all” RFP than SCE’s. Duke said that its volume purchases would lead to economies of scale in the pricing of components and costs of installation, although it has not yet offered an estimation of expected savings. While its acquisition program has not been fully determined, the utility said it intends to employ competitive solicitations “when reasonable” to contract with a variety of solar PV component manufacturers and will seek to purchase materials and services from North Carolina suppliers—to the extent that they can be cost-competitive—in order to promote local economic development. Although the utility would own all installed facilities, it has argued that this would be a preferable way to bolster the PV industry because it allows for “faster, larger and coordinated installations, as opposed to sporadic installations by customers.” It also believes that the program would attract potential suppliers of PV equipment to establish their businesses in the state. Besides ratepayer support, Duke is also counting on a favorable tax regime in North Carolina, that provides a 35 percent investment tax credit (with some limits on total) for distributed PV. The utility called this support “more generous” than tax credits or other incentives for PV than “almost any other state in the nation.” Duke’s proposal underwent hearings at the North Carolina Utilities Commission consideration in November. A final decision was not yet available.
3.3.6 San Diego Gas & Electric’s Solar Energy Project Another new development in utility deployment of PV systems is the attempt to use not only larger scale installations but also improved designs to optimize energy generation. In July 2008, San Diego Gas & Electric announced a program for installing up to 77 MW of distributed PV at locations in its territory, employing advanced solar-tracking technology that the utility claims will produce 65 percent more energy during system peak periods, and 40 percent greater output annually.31
31 CPUC A.08-07-017, filed July 11, 2008.

59
The SDG&E “Solar Energy Project” calls for a hybrid ownership model, with the utility owning about two-thirds of the capacity and the remainder being customer-owned or third-party developments. In its application for approval of up to $250 million through 2013 to build, own, maintain and operate the facilities, SDG&E said its ownership share of the units would amount to 52 MW at direct current, effectively providing 35 MW of grid capacity. The utility anticipates individual units would range in size between 1 and 2 MW and specifically target ground-mounted open spaces,such as parking lots, municipal land, landfills, or other similar locations. Another 25 MW of customer-owned facilities might be induced through opportunities for co-construction with the utility in order to capture cost savings. One example provided by the utility is a planned series of 12-foot tall “solar trees” to be installed at several locations in the parking lot of a La Jolla shopping mall. Besides providing shading for cars, the installations may eventually serve as plug-in stations for electric vehicles, allowing customers to recharge their cars while shopping. SDG&E proposed to concentrate on PV in the 1 MW to 2 MW range because it sees a gap in deployment of units in this size range. The incentives provided by the California Solar Initiative go only up to 1 MW, resulting in most installations in San Diego area being of a fixed-panel design, whether flat or tilted, which do not maximize capacity output coincident with the time of day when the utility needs power the most. The Renewable Portfolio Standard, while encouraging contracts with commercial solar developers, also leaves a gap, in that to date, no projects in the 1 MW to 2 MW range have been built in SDG&E’s load center.
3.3.7 Resistance at the Regulatory Level From the time of SCE’s initial regulatory filing in late-March, it was clear that the rooftop PV program would encounter heavy resistance from industry competitors, ratepayer advocates, and other stakeholders. Even entities that provided initial support for the general goals of the program, such as the California Solar Energy Industries Association, expressed concerns about proposed implementation details. Representative of utility customers groups and the CPUC’s Division of Ratepayer Advocates focused their strongest arguments against the estimated cost of the proposal and the incentive ratemaking treatment sought by the utility. SCE proposed including all capital costs of the installations in its rate base, earning the standard 8.75 percent rate of return on investment, plus an additional 1 percent premium. In all, DRA claims, the utility program would cost ratepayers $1 billion in capital, leasing expenses, and operation and maintenance in the first five years, for the equivalent of 225 MW of output. DRA questioned whether that expense was reasonable compared to costs to add solar capacity under RPS solicitations and the CSI program, and suggested that rooftop leasing represented “a large uncontrolled risk” going forward. The California Independent Energy Producers (IEP) trade association and other competitive solar developers also cited the relative costs of the program. IEP estimated that the average

60
cost of energy provided under the rooftop solar program would average more than $0.46 cents/KWh in its first phase. Recurrent Energy, a solar power developer, for example, protested the utility’s application by claiming that it would confer the utility with a monopoly on commercial-scale distributed solar in its service territory and shut out competitive equipment manufacturers that did not win the “winner takes all” bid. IEP instead proposed that the CPUC allow a feed-in tariff for the amount of capacity identified under SCE’s proposal, with prices ranging from a discount of 10 percent—compared to the utility’s projections for solar PV capacity that does not require transmission interconnect—to a capped feed-in tariff of $0.30/KWh for PV that might require transmission or distribution upgrades. In light of the concerns raised by these protests, the CPUC has scheduled a full hearings process to investigate aspects and impacts of the SCE proposal to determine if it is a “reasonable” expenditure of ratepayer dollars. The CPUC conducted evidentiary hearings on Edison’s proposal in November 2008, and a final commission determination is expected by March 2009, thus deferring Edison’s plan by about six months. Many of the same arguments against utility ownership of distributed PV systems were also raised in the SDG&E Solar Energy Project proceeding. Although several parties urged the commission to consolidate the two cases, the CPUC decided to pursue the two cases on individual tracks. SDG&E’s case will see hearings in February 2009, with a decision expected the following July. Similar to SCE’s filing, some parties argued that instead of a utility-owned competitive solicitation for equipment, SDG&E should offer a feed-in tariff structure to allow third parties to provide the capacity. SDG&E’s application was relatively sparse on financial aspects of the program, but parties questioned the cost-effectiveness of the plan by claiming it would be roughly twice as expensive on an installed capacity level as SCE’s case. The utility has either rejected these arguments or declared them to be “findings of fact” that should be determined during regulatory hearings.
3.4 Feed-in Tariffs
3.4.1 Opportunities and Drawbacks A feed-in tariff (FiT) is defined as “a policy that sets a fixed guaranteed price at which power producers can sell renewable power into the electric power network, which could either supplement or replace competitive solicitations. Some policies provide a fixed tariff while others provide fixed premiums added to market- or cost-related tariffs.”32 Though not a “procurement technique” widely embraced by electric utilities, a FiT model serves as a policy platform and provides a mechanism for pricing resource additions, thus inducing market growth for the technologies it targets. At least seven states are considering or have enacted feed-in tariffs that would set a standard rate structure for new projects that meet certain criteria.
32 Renewable Energy Policy Network (REN21), 2008

61
However, because of residual distrust of any procurement based on a kind of “standard offer” pricing inducement, adopted tariffs must be carefully designed to avoid a situation in which changes in market economics render existing contracts uneconomic compared to competitive alternatives. The major elements that should be considered in a FiT policy include: price, duration, subsidy/support reductions over time, preferred project size, technology specific support, and location specific support.
3.4.2 Background and Discussion The FiT is not a single procurement model that can be replicated everywhere but a fundamental idea that can be shaped to suit a given political and economic climate. In the United States, the 1978 Public Utilities Regulatory Policies Act (PURPA) had close similarities to today’s European FiT but also some key differences. PURPA required utilities to purchase electricity from renewable and cogeneration facilities at a standard-offer rate that was based on their avoided costs. Once contracts were in place, however, a drop in the cost of natural gas led to a wide differentiation between what the producers were being paid and the new market price. In the minds of utilities and regulators, PURPA led to “exorbitant rates” for generators when their own cost of generation plummeted below their earlier forecasts.33 For these reasons, it is instructive to briefly review the California experience with developing standard offer contracts for non-utility generation.
3.4.2.1 PURPA and Standard Offers When the U.S. Congress passed PURPA in 1979, lawmakers expressed a commitment to the development of smaller-scale technologies from renewable resources and those that could improve the generating efficiency of an aging utility fleet, particularly through cogeneration of both electricity and thermal energy. While leaving implementation up to state-level regulators, Congress also imposed a key economic restraint on the development of these new generation resources—that they should be able to produce electricity at an “avoided cost” calculated at or below the price a utility would otherwise pay to build its own resources or purchase power from another source. Added to the traditional regulatory requirement demanding that new power be procured on a “least cost” basis, this meant that the new class of non-utility generation needed to meet a stringent cost hurdle, particularly in regions and territories where the system average cost of generation was perceived as low. For example, there was little or no PURPA-related generation allowed in the Pacific Northwest where hydroelectricity made up a large portion of the resource, or where regulators determined that the marginal cost of electricity from fully depreciated coal-fired or nuclear power plants would constitute the avoided-cost threshold. In some states, however, the avoided-cost determination led to new ways of thinking about generation costs that opened up new resource markets. In New York State, for instance,
33 Grace, et al., 2007
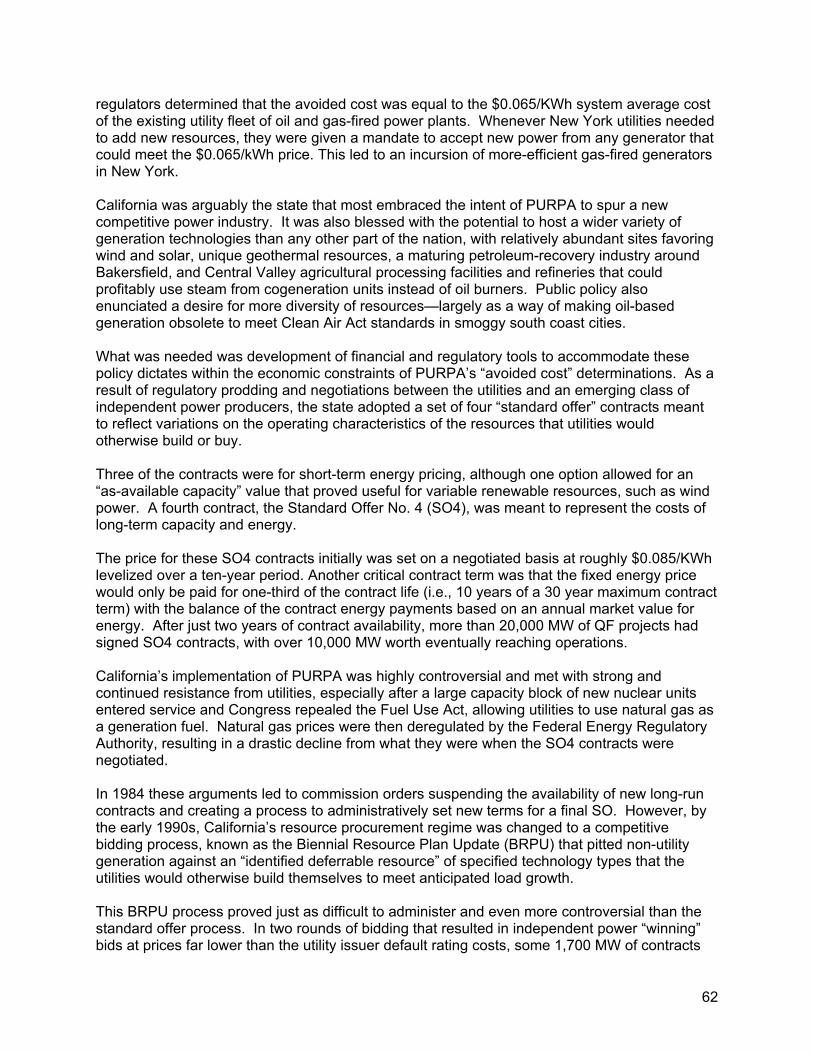
62
regulators determined that the avoided cost was equal to the $0.065/KWh system average cost of the existing utility fleet of oil and gas-fired power plants. Whenever New York utilities needed to add new resources, they were given a mandate to accept new power from any generator that could meet the $0.065/kWh price. This led to an incursion of more-efficient gas-fired generators in New York. California was arguably the state that most embraced the intent of PURPA to spur a new competitive power industry. It was also blessed with the potential to host a wider variety of generation technologies than any other part of the nation, with relatively abundant sites favoring wind and solar, unique geothermal resources, a maturing petroleum-recovery industry around Bakersfield, and Central Valley agricultural processing facilities and refineries that could profitably use steam from cogeneration units instead of oil burners. Public policy also enunciated a desire for more diversity of resources—largely as a way of making oil-based generation obsolete to meet Clean Air Act standards in smoggy south coast cities. What was needed was development of financial and regulatory tools to accommodate these policy dictates within the economic constraints of PURPA’s “avoided cost” determinations. As a result of regulatory prodding and negotiations between the utilities and an emerging class of independent power producers, the state adopted a set of four “standard offer” contracts meant to reflect variations on the operating characteristics of the resources that utilities would otherwise build or buy. Three of the contracts were for short-term energy pricing, although one option allowed for an “as-available capacity” value that proved useful for variable renewable resources, such as wind power. A fourth contract, the Standard Offer No. 4 (SO4), was meant to represent the costs of long-term capacity and energy. The price for these SO4 contracts initially was set on a negotiated basis at roughly $0.085/KWh levelized over a ten-year period. Another critical contract term was that the fixed energy price would only be paid for one-third of the contract life (i.e., 10 years of a 30 year maximum contract term) with the balance of the contract energy payments based on an annual market value for energy. After just two years of contract availability, more than 20,000 MW of QF projects had signed SO4 contracts, with over 10,000 MW worth eventually reaching operations. California’s implementation of PURPA was highly controversial and met with strong and continued resistance from utilities, especially after a large capacity block of new nuclear units entered service and Congress repealed the Fuel Use Act, allowing utilities to use natural gas as a generation fuel. Natural gas prices were then deregulated by the Federal Energy Regulatory Authority, resulting in a drastic decline from what they were when the SO4 contracts were negotiated. In 1984 these arguments led to commission orders suspending the availability of new long-run contracts and creating a process to administratively set new terms for a final SO. However, by the early 1990s, California’s resource procurement regime was changed to a competitive bidding process, known as the Biennial Resource Plan Update (BRPU) that pitted non-utility generation against an “identified deferrable resource” of specified technology types that the utilities would otherwise build themselves to meet anticipated load growth. This BRPU process proved just as difficult to administer and even more controversial than the standard offer process. In two rounds of bidding that resulted in independent power “winning” bids at prices far lower than the utility issuer default rating costs, some 1,700 MW of contracts

63
were awarded—but only a single 49 MW gas-fired power plant was ever built. Then, in 1994, the California Public Utilities Commission suspended the BRPU process entirely in favor of its anticipated movement towards an “all resource” spot-power bidding program via a new Power Exchange as part of a broad based “restructuring” of the electric services industry. After this restructuring program was implemented and subsequently collapsed, for a period of about 10 years, existing power plants holding standard offer contracts were kept on regulatory life support and utility acquisition of CSP—indeed any independent power—was all-but halted.
3.4.2.2 Solar Pioneers For the solar power industry, however, the economic platform of standard offers allowed for development of the nation’s first grid-connected solar thermal generation units, pioneered by an Israeli-based technology company called Luz in San Bernardino County. Under a set of several standard offer contracts, Luz and partners installed about 360 MW of the Solar Electric Generation Stations (SEGS) at several locations in and around the Harper Lake area, near Mohave. SEGS featured a curved mirror solar collector array that tracked the vertical movement of the sun and concentrated the thermal energy to superheat an oil that ran through pipes. The heated oil was in turn connected to a more-or-less standard heat-exchange unit and generator set to produce grid-scale electricity. In keeping with terms of PURPA, the SEGS units also employed limited natural gas burning to supplement the production of thermal energy—thus smoothing out variations in output and improving capacity factors for the units. Luz, however, was unable to successfully weather the economic turmoil brought about by the changing regulatory policies for resource procurement. Although Luz and partners had plans to develop an additional 240 MW of SEGS units, the company went bankrupt by 1992 and its assets were sold or assumed by other companies. Nonetheless, the SEGS technology proved its longevity in energy markets, and not only continues to operate profitably today for new owners, but also provided the technological template for a newer generation of concentrating solar projects now in development throughout the Southwest.
3.4.3 European FiTs In 2001 the European Parliament issued an edict to its member countries encouraging them to develop their own renewable energy policies, but stated that by 2005 a harmonized policy tool would be chosen for the EU. In the years that followed, rigorous debate ensued as countries tried to prove different policies’ efficacy before the deadline. The two primary policies being compared during that time were the FiT and one similar to a renewable energy certificate (REC) trading scheme under an RPS as found in the U.S. Germany is known for being the most aggressive example of the FiT, meeting its 2010 target of 12.5 percent renewable electricity three years ahead of schedule. Germany originally set its tariff at 90 percent of the retail electricity rates. However due to extenuating circumstances resulting in the fall of retail electricity price, the FiT failed to continue to incent RE developers. At that point Germany switched to fixed rates based on the estimated cost of generation by technology. Within a technology class, the FiT varies by project size and/or installation type

64
(roof, ground, etc), with the design intent to provide a modest, but positive single-digit rate of return. The FiT for new projects declines each year by 5-10% and the baseline is revised every few years to accommodate changing renewable market conditions. Germany, Spain and Denmark are among the most frequently cited examples of successful FiT programs. These countries were among the earliest enactors and have shown the strongest results. From 1990 to 2005, for example, these three countries installed 31,000 MW of wind energy capacity, equaling 53 percent of the world’s total.34 The FiT has allowed Germany to double its renewable electricity supply between 2000 and 2007 and in doing so, Germany has emerged as the largest market for photovoltaic systems and wind energy in the world. Spain’s market is also poised for similar rapid growth. Denmark’s situation is most notable for its early action, starting a wind subsidy in 1979, and its unique ownership models, which supported ownership models for cooperatives and guilds. This, along with the cultural values and community organization, resulted in about 80 percent of wind turbines in Denmark being privately owned by cooperatives or farmers. A recent debate has emerged in Germany as to the continuation of the FiT. Lawmakers of the conservative Christian Democratic Union political party are circulating proposals to reduce the generous fixed-rate currently offered for solar development. Members of the party believe that if solar generation continues to grow at such a fast pace, the rate for electricity will rise too high for consumers.35 Opposing the limiting of the FiT are those who believe that cutting the FiT price would significantly harm Germany’s position as world leader of the PV industry. Member of Parliament Hermann Scheer, who helped write the German FiT, holds the view that as Germany is the leading example of the success of FiT, “it is very important that the driving force not become a lame duck.”36 What might serve as an important example to Germany is the experience in Denmark. In 2002 with a conservative government in office, the FiT was halted and has left their renewable energy installations at a standstill.
3.4.4 North American FiTs The European debate of FiT versus RPS is fruitful in that it brings out the strengths and weaknesses of both policies, but ultimately the two policies can be compatible.37 This leaves room for creative policy making that incorporates the positive aspects of the FiT in addition to an RPS structure. Some of the proposed FiT legislation in certain states is using the FiT, or some aspect of it, to meet the RPS as a hybrid policy model. Currently, six states have introduced FiT bills, another eight are considering legislation, and one federal FiT bill has been introduced to Congress.
34 Grace, et al., 2007. 35 Landler, 2008. 36 Ibid. 37 Grace, et al., 2007

65
As in the EU experience, the North American versions of the FiT vary in many ways. Below are some of the key distinctions being proposed by some states and locales. Ontario In May 2006 the province of Ontario, Canada implemented the first FiT in North America since PURPA over twenty years ago, which is currently set at $0.42/kWh (CAD). The program is still in its infancy, but has already had an impact in terms of renewables on the ground. In a little more than two years, the FiT has led to 106 contracts with an installed capacity of 53 MW, and 356 contracts totalling 1,470 MW in development. Some criticism has been raised by solar energy advocacy groups for the solar tariff being too low and subsequently not encouraging community-based renewable energy generation. In particular, the Canadian Solar Industries Association (CanSIA) believes that the low number of applications for small projects is due to a low tariff price for photovoltaics (PV). However, PV developers that benefit from economies of scale are expecting to continue utilizing the FiT. The FiT will be reviewed every two years so that tariff prices for new projects may change based upon the renewable technology market conditions which exist at that time.38 California The California Feed-in Tariff AB 1969 was enacted on February 14, 2006. The Public Utilities Commission establishes prices for state utilities to buy renewable energy from customers in two separate categories: Schedule E-PWR (for public water and wastewater customers) and Schedule E-SRG (small customer located systems).
The statewide cap for both sets of tariffs is 478.45 MW. Seven utilities will buy renewable energy at a set price from public water and
wastewater facilities with a total capacity limit set at 250 MW, distributed proportionally among the utilities based on size.
For PG&E and SCE, a separate feed-in tariff applies for any customer-located renewable energy systems up to 1.5 MW (with 104.6 MW allocated to enrollment in PG&E’s tariff and 123.8MW allocated to SCE’s).
The tariffs require a long-term contract of 5, 10 or 15 years. The tariffs range from $0.08 to $0.31/KWh, adjusted for time-of-day of generation. Facilities are not eligible for the tariff if they participating in other state incentive
programs. For the E-PWR, PG&E, SCE, and SDG&E are required to offer to buy all the power
generated from customers, or to buy only the excess power generated, while other utilities have the latter as an option.
At this time it is too early to say whether or not the California FiT has had any significant effects on the market. However, of the two tariffs, it appears as though the small generator tariff is gaining more significant criticism than the tariff for the water and wastewater facilities. These criticisms touch on the pricing, the disharmony with other renewable incentives, and the low cap. Currently the fee paid to generators by utilities for the FiT is based on the market-price referent (MPR), which is determined annually by the CPUC in association with RPS solicitations. The current MPR is between $0.09 - $0.11 cents/KWh, and is based on a a hypothetical natural gas plant. Even considering time of generation multipliers, the cost that a generator receives from 38 Lacey, 2007

66
the FiT fee can be less than what a generator would receive from a net-metering situation receiving full retail value for each KWh put back on the grid, or from a direct RPS solicitation. A second critique of the California FiT regarding generators smaller than 1.5 MW is that it removes the ability to receive other incentives, such as the California Solar Initiative (CSI) and the option of net-metering. Another factor is that the CA FiT only allows for systems of 1.5 MW or smaller to receive the tariff. While for residential and most commercial solar this seems to be a reasonable range, other technologies like wind are limited in most instances. There is discussion addressing these key areas of concern. Assembly Bill 1807 (Fuentes) and Senate Bill 1714 (McLeod) were introduced to expand the program to include more utilities, increase individual system capacity limits, and aim toward increasing program enrollment. Also, as part of its 2008 Integrated Energy Policy Report process, the California Energy Commission has begun consideration of the value of a FiT for renewable resources larger than 20 MW., The concern among regulators is that standard competitive solicitations have been unable to keep utilities on track to meet their 20 percent RPS goals. Michigan A Michigan house bill (HB 5218) is modeled directly on Germany’s FiT using the same size caps and tariff rates. Minnesota The unique HF 3537 bill introduced in Minnesota is noteworthy due to its ownership specification. The projects supported by the FiT would need to be majority-owned by Minnesotans as is stipulated in the state’s Community-Based Energy Development (C-BED) statute. Hawaii Unlike the German style FiT being adopted in Michigan, Hawaii has chosen to incorporate net-metering into its FiT. The fixed-rate contracts only apply to the excess electricity delivered by a generator. Wisconsin In July 2008 the Governor of Wisconsin’s Task Force on Global Warming recommended implementing a FiT program to be called the Advanced Renewable Tariffs (ART). This is the first time that an advisory committee to a U.S. governor has formally endorsed a FiT policy. Projects developed under Wisconsin's proposed renewable tariff program would be limited to 15 MW. The task force has recommended that the advanced renewable tariffs should: be based upon the specific production costs of each particular generation technology; include a return comparable to the utilities’ allowed returns; and be fixed over a period of time that allows for full recovery of capital costs. At the moment, the specific prices have yet to be determined and there has yet to be legislation proposed. If the Public Service Commission (PSC) does not currently have authority to establish these tariffs through ratemaking, legislation would be needed to allow such rule-making.39
39 Wisconsin Governors Task Force, 2008
67
3.4.5 Potential Federal Legislation On June 25, 2008, U.S. Representative Jay Inslee (D-WA) introduced a federal FiT legislation known as the “Renewable Energy Jobs and Security Act.” The bill is modeled after the European experience and includes three key design requirements:
1. Guaranteed interconnection for proposed generators; 2. Mandatory purchase by utilities of all eligible generators for a fixed-rate for 20 year
contracts; 3. A rate recovery program known as RenewCorps, which under the FERC's supervision
would reimburse utilities by collecting funds from ratepayers through electricity rates. Critics of the bill argue that the initiative to prioritize transmission of renewables to the grid goes against existing open-access rules, which are designed to be non-discriminatory. Secondly, it is argued that states will oppose the legislation, as they tend to be protective of their ratemaking abilities. Thirdly, it has been suggested that the FERC may not have the capacity to administer a policy of this magnitude on a national level. While these are key considerations, they are not necessarily roadblocks and are part of the policy details of FiT development.
3.4.6 Strengths of a FiT Long-term, Single-Source Financial Guarantees One of the most important concerns among the renewable energy industry today is renewal of financial incentives by the government that are constantly vulnerable to discontinuation. A FiT gives investors a stable investment climate through a long-term power purchase agreement upon which they can base their financial projections. In addition, a FiT provides a single revenue source which—unlike the current conglomeration of federal, state, local and utility sources—is not based on tax appetite. As a result, the project economics are much more predictable, and financing costs are lowered. Targeted Diversification of Resources and Technologies Depending on how the FiT is structured, it can support a diverse renewable portfolio. Offering higher prices for energy from less prominent resources or less mature technologies gives investors more incentive to develop them with the long-term vision of a diversified portfolio. Supporting emerging technologies could result in cost savings to society in the long term. Technological Innovation FiTs encourage competition among technology manufacturers, rather than between individual projects. While critics hold that a FiT lacks the ability to put downward pressure on the price of renewables—such as the way a RPS puts generators in competition with each other—advocates point out that it merely transfers the competition from the generators to the technology manufacturers, thus promoting more technological development in a shorter amount of time. As tariff levels decline, new generators are incented to produce more efficiently. Simplicity One of the most attractive qualities of the FiT is its simplicity. If carefully structured, the tariff promotes a large increase of renewable generation in a fairly short time period, with predictable market growth. When compared to tax incentives and volatile REC markets, the FiT’s simplicity often makes it more appealing to generators. This simplicity may translate into lower

68
transaction costs. Studies showed that the FiT is more efficient and cost effective than an RPS-only strategy.40
3.4.7 Critiques of the FiT Cost While Germany experienced significant growth with its FiT, the country also had a significant budget and popular support for supporting renewable energy. The German Solar Energy Association estimates an average cost of USD$1.37/month/customer in 2008 and USD $2.91/customer/month in 2014. Other countries have designed FiT structures to provide a cap or a flexible pricing schedule that adjusts depending on market response. FiTs Require Strong Political Support The current U.S. incentive structure distributes the costs among different sources, i.e. federal tax credits are paid through national general taxes, state rebates by state tax payers, utility rebates by utility ratepayers, etc. The single-source FiT design, while simple, clearly delineates these currently dispersed costs into one source, making it the direct target for FiT opponents and subject to budget reevaluations during economic downturns.
Need for Exit Strategy An important critique of the FiT is that it may not always have an exit strategy built-in to its policy. Without such consideration, the renewable energy industry might not have a way to wean itself off of the fixed rate and thus grow dependent on the policy remaining in place. The annual decrease in the FiT rate targets this concern, but only if it progresses equally relative to actual market conditions.
FiTs Limit Utilities’ Decision Making Capacity The issue has been raised that if renewables are to reach a point of providing a significant percentage of the country’s electricity, there must be a strategic plan for connecting, transmitting, and serving the new load supply reliably. If utilities are forced to buy renewables under a FiT from any PV generator, guaranteeing all applicants access to the grid will mean that planning for these operational considerations will be more difficult. This may negatively effect the utility’s and the RTO’s ability to discern what types of technologies are appropriate; and where these technologies locate may not mesh with where infrastructure development has been planned. This may require a rethinking of the way new generation and transmission capacity is deployed to adequately serve new generation and load requirements. In the short-term, this is an unlikely problem, but over the long-term, the FiT may seem like too blunt an instrument to address grid integration and operation issues as they are currently managed.
FiTs Fail to Put Downward Pressure on Price of Technology The standard price offered to all generators under a FiT could be contrary to the market’s need for competition. Without competition, it is presumed that less efficient project developers would be insulated from the rigors of the market, be kept afloat by the FiT, and subsequently result in higher product or system prices for consumers.
Uncertainty
40 Grace, et al. 2007.

69
Another critique is that regulators are not in a position to guess future market conditions. This artificial price setting by government officials, if inaccurate, can reduce the rate of technological innovation.
3.4.8 FiT Conclusions and Considerations One of the recent trends in the United States is that many states are considering FiTs, and many are building FiT-like characteristics into their RPS models. Since the RPS is already the preferred model in the U.S., the use of the FiT might begin with specified niche markets. Starting small and growing the FiT over time with a thorough monitoring mechanism may be an important practice to be investigated.
3.5 RPS, Solar Set-asides and REC Markets
3.5.1 Opportunities and Drawbacks Regulatory requirements for utilities to increase their procurement of renewable energy as a substantial part of their energy deliveries have spurred a tremendous increase in development of wind and solar powered generation. Currently 26 states and the District of Columbia have established various levels of RPS mandates, with the projected demand for new renewable capacity currently expected to grow tenfold over the next 12 years, according to the Lawrence Berkeley National Laboratory. By 2025, under current state-level RPS requirements, the demand for renewable capacity could exceed 70,000 MW. 41 While, in general, RPS polices can be successful in stimulating new project development, such policies will commonly only provide this benefit to the least-expensive projects available. This is further reflected by the LBNL study, which showed that of the non-hydro capacity additions in the U.S. from 1998 through 2007, 93 percent were from wind power, 4 percent from biomass, 2 percent from solar and 1 percent from geothermal.
3.5.2 Background and Discussion As a result, a number of states have designed their RPS policies to create differential support for specific renewable energy technologies that are considered favorable, but because of their higher costs would not likely be deployed by utilities and load-serving entities to meet their RPS mandates without further incentive. These incentives typically take the form of either a set-aside, in which it is required that a certain percentage of the total RPS mandate is met with specified renewable technologies, or a credit multiplier, where specific renewable technologies receive greater credit against meeting the RPS target than other technologies. The most frequent implementation of these mechanisms has targeted solar energy, both for utility-scale and distributed generation. Currently, 12 of the 27 existing RPS policies nationwide have specific solar or DG set-asides. In four of these states, set-asides are combined with credit multipliers of some form. Washington and Texas are currently the only states that employ only a credit multiplier.42 41 Ibid. p. 1 42 Ibid. p. 16

70
Figure 3: Solar Energy Support Mechanisms in State RPSs (as of April 2008)
Source: LBNL
In recent years, states have begun to favor set-asides over credit multipliers after experience has demonstrated greater success with these mechanisms in terms of stimulating new project development. As a Nevada state PUC representative recently remarked, while multipliers may serve as “good marketing tools” and are intuitively attractive to policymakers, they often have very little effect on the analysis of a project from a resource-planning perspective. They can serve to simply make it easier for a utility to comply, with fewer contracts.43 There is significant diversity among the state set-asides currently embedded in RPS policies, with some being restricted to PV applications and not including solar-thermal electric technologies, others including solar heating and cooling, and even three states that simply have a distributed generation set-aside in which solar PV competes against other qualifying renewable forms of distributed generation. In fact, many of the set-asides included in current policies have yet to take effect, with only three states (Arizona, Nevada and New Jersey) having at least three years of operational experience with their policies.44 Despite relatively little experience thus far—at least compared to what should be expected in the years to come as more state RPS requirements “ramp up”—it is clear that solar and distributed generation set-aside instruments have had demonstrated and successful impacts on
43 “Renewable Portfolio Standards – the Nevada Experience,” Anne-Marie Cuneo, Nevada Public Utilities Commission, presenting to the State-Federal RPS Collaborative. April 2008. 44 “Renewables Portfolio Standards in the United States: A status Report through 2007” Ryan Wiser and Galan Barbose, Lawrence Berkeley National Laboratory. April 2008.

71
solar energy procurement in their respective RPS states, particularly with regard to grid-connected PV.45 Of all states, New Jersey has experienced the most growth in their PV market, having administered its program since 2000. In recent years, Nevada and Colorado have additionally seen the strongest growth, in large part spurred by RPS solar set-aside policies, followed by Arizona and New York. According to LBNL, assuming full compliance is achieved and other variable factors, a sum of 550 MW of solar capacity may be required by these policies by 2010 nationwide, growing to approximately 2,200 MW by 2015 and 6,700 MW by 2025.46 Arizona, New Jersey, Maryland and Pennsylvania appear to be the states poised to demand the most growth in solar capacity over the terms of their RPS policies, followed by New Mexico, Nevada, North Carolina, and Colorado.
3.5.3 National and Regional REC Markets Renewable Energy Certificates (RECs) represent the environmental attributes of electric generation from renewable resources. Unlike the energy component of generation, which must be transmitted and consumed immediately or somehow stored for future use, RECs represent a break from the physical, locational and temporal barriers of delivering power. In other words, RECs can be separated from the underlying energy, do not require transmission interconnection and may be “banked” for use at any time. RECs can serve as an important instrument in facilitating contracts for solar project developers. By unbundling the environmental attributes from commodity electricity generation, RECs have the potential to bring a much larger set of buyers to the table from both voluntary and compliance markets for renewable energy. The ability for RECs to be used for RPS compliance has generally been borne out of the development of regional electronic tracking systems that issue certificates, track transactions, and retire certificates when appropriate. Almost all states with current RPS mandates in place fall within one of the five electronic tracking systems currently in operation. The exceptions are, New York, which is currently working on its own electronic tracking system for RECs, and Hawaii, which does not allow the use of unbundled RECs for compliance with the renewables target. Within the boundaries of a regional tracking system, Iowa, Arizona and California do not permit the unbundling of RECs for RPS compliance at present. However, there is an ongoing proceeding at the California Public Utilities Commission to establish the rules that would allow use of tradable RECs for RPS compliance in that state. Tracking flows of power in real time from specific generators to given points of demand can be an extremely complicated and resource-intensive task, in addition to being inconsistent with the reality of how the electric grid truly operates. REC tracking systems can significantly reduce the administrative burden of tracking the ownership of these environmental attributes, and in doing so, reduce the transaction costs borne by both project developers, utilities, and other REC buyers in this effort.
45 “New Jersey’s Solar Renewable Energy Certificates (SREC) Program and New Jersey’s Solar Market: Transition to Market-Based REC Financing System” New Jersey Clean Energy Program website. 46 Ibid.

72
In an environment in which nearly all utilities are able to purchase unbundled RECs (albeit with some regional geographic restrictions) for RPS compliance, and with generators increasingly joining regional electronic tracking systems, entities looking to procure solar would be able to do so with greater options and flexibility, and potentially lower administrative costs. Financing capital-intensive solar generation facilities requires investors that have sufficient assurance of long term energy and REC prices. Thus, while a fully functional REC market can certainly aid utilities in terms of RPS compliance, ultimately what ends up aiding project development—by incentivizing long-term contracts—is the price of those RECs and the long-term certainty of those prices. These pricing and contract-term issues of course are largely driven by the RPS policies themselves. States have dealt with these issues in a number of ways, including 10 states that have inserted contract duration requirements in their RPS policies. In summary, RECs clearly serve as valuable sources of revenue for extant projects, and can provide a new and important channel through which utilities can purchase solar power. However, while the REC market certainly can enhance a buyer’s ability to procure solar energy that has already been brought online, it is not clear that RECs alone can provide the incentive and financial foundation required for new project development.
3.5.4 New Jersey’s REC Markets The state of New Jersey has had significant success in promoting the growth of their state solar capacity with their Clean Energy Program, a specific subset of policies established to provide support the solar set-aside prescribed in the general RPS. Along with explicit RPS policies, New Jersey’s model program has also included a solar rebate initiative that helps to finance at least 50% or more of the initial installation costs. Also, favorable interconnection and net-metering standards make it much easier for systems to connect to the distribution system. Perhaps most importantly, though, is a robust Solar Renewable Energy Certificate (SREC) trading program that provides important long-term financing for solar installations. In 2001, upon the inception of the state’s Clean Energy Program, there were only 6 solar electric installations in the state of New Jersey. As of August 31st, 2008, 3,320 of such installations have been put into place, with approximately 62 MW in capacity.47 While generous rebates have certainly played a significant role in stimulating solar development in the state, so too has the SREC trading program. The utility demand for SRECs and the structure of the RPS policy has driven New Jersey’s solar RECs to the highest value in the country. Recently, in July of 2008, 857 SRECs were traded at a weighted average of $308.00/MWh. As further evidence in support of New Jersey’s confidence that RECs can provide sufficient incentive for the continued development of the state’s solar industry, state regulators have begun the process of phasing out the Clean Energy Program’s rebates and increasing the reliance on the SREC trade as a market-based incentive support for the state. In making this transition, regulators have proposed adjusting the alternative compliance payment (ACP) levels to provide further market-based incentive as well increased market certainty for long-term REC
47 New Jersey Board of Public Utilities – Proposal to Stakeholders 2-5-2008

73
contracting. The solar ACP will be established by regulators in advance overl long-term eight year schedules. This issue of long-term REC contracts is clearly important for establishing investor confidence and a robust market, and states such as Maryland, North Carolina, Colorado and Nevada have also attempted to address the issue by simply requiring long-term contracting for solar energy or RECs in their solar set-aside policies. What may separate New Jersey from the rest, however, is the high price levels being reached by their SRECs, largely as a result of the state’s high ACP, currently set at $300/MWh. Moving forward with the establishment of the eight-year ACP schedule, New Jersey regulators have set the schedule based on an internal rate of return of 12 percent, with the intention of this translating to a six-year payback period for investments made in a solar electric generation systems. As of February 2008, this schedule pinned ACP levels at roughly between $600-700/MWh for the period from June of 2008 to May of 2016. As New Jersey continues in its effort to transition its solar set-aside to one wholly supported by a market-based REC trading regime, policymakers, solar developers and electric service providers around the nation will be observing the New Jersey experience to gauge the efficacy and cost-effectiveness of their innovative solar policy design.
3.6 E-Procurement and Electronic Auctions
3.6.1 Opportunities and Drawbacks Electronic procurement of energy appears in many instances to help drive bid costs lower and can greatly streamline the procurement process, but they are generally used for relatively small, identified blocks of energy. They have not been tested for large capacity acquisitions or long-term contractual commitments. Although thus far, the use of online auctions (and in particular, reverse auction pricing mechanisms) does not appear to be a commonly pursued avenue for procuring solar power, utilities may be able to derive benefits from the use of this strategy moving forward. Similar to general e-procurement methods, a utility or group of utilities engaging in a reverse auction could solicit bids from a number of potential suppliers who would compete for the winning contract.
3.6.2 Background and Discussion Utilities that engage in creative or innovative procurement strategies do so in an effort to avoid or reduce the high costs associated with the traditional RFP process. One strategy that many companies and institutions in other industries have increasingly begun to employ in this regard is to shift much of their procurement management system to an online platform. Referred to broadly as e-procurement, such electronic and web-based systems can serve to reduce costs for buyers and sellers by increasing transparency, efficiency, competition, and access to all potential participants. Electronic procurement can serve to automate aspects of supply chain management, lower business to business transaction costs, and improve buyer and seller communication through a shared web-based infrastructure. For utilities that are seeking to procure solar and are looking beyond contracting with solar developers through traditional RFPs, e-procurement may present opportunities to capture significant value and cost savings. If utilities were capable of becoming more directly involved

74
with the procurement of the raw materials associated with the construction of a solar facility, e-procurement could potentially serve as a valuable tool in driving down the high costs of these materials by connecting directly with individual suppliers. Admittedly, this would directly impact the nature of the relationship between a utility and the typical solar developer. If this task can be effectively performed by the utility via an online procurement platform, or at least with significantly less reliance on the turnkey services provided by many typical solar developers, there could be newfound efficiencies and savings achieved. These cost benefits could be increased even further in the event of cooperation among multiple utilities. If utilities were able to organize and aggregate their demand for solar development, their increased purchasing power could potentially accrue even further savings in terms of reduced costs from their suppliers. Another specific form of e-procurement that has the potential to bring a number of benefits to utilities procuring solar is the use of electronic reverse auctions in place of the traditional RFP process. While the concept of auctions is certainly not new to business, in recent years the popularity and breadth of online auctions has seen dramatic growth. Such auctions are flexible procurement tools, and can be orchestrated in a variety of ways in order to best maximize their usefulness and value for participants. According to Forrester Research online U.S. consumer auction sales will reach $65 billion economy-wide by 2010, accounting for nearly one-fifth of all online retail. Business-to-business auction-based e-commerce is increasing at a pace comparable to the growth rate of economic benefits. The value of expanding competition to a greater number of suppliers is becoming more self -evident and is strongly documented through thousands of successful procurements.48
3.6.3 Reverse Auctions Unlike a typical auction in which various buyers compete against one another to win the favor of a single seller, in a reverse auction the role of the buyer and seller are flipped, with the buyer driving the auction. Typically, a buyer contracts with an intermediary party that specializes in coordinating the online platform to manage the auction. This intermediate party can provide additional services as well, such as taking on the task of finding potential suppliers and training the suppliers on the auction process. Online auctions can provide significant price transparency and control which the paper-based RFP process may not always provide. With the reverse auction approach, quoting performed in real-time via a web-based platform results in dynamic bidding, helping to achieve rapid downward price pressure that is not normally achieved using more conventional and static paper-based bidding and procurement. Buyers (in this case utilities) can either award contracts to the suppliers who bid the absolute lowest price, or winners who meet the utility’s specific and pre-established conditional needs with preferable terms of quality, capacity, or other value-adding capabilities.
48 “Reverse Auctions Drive Prices Lower: Online Auctions Set Stage For Success” World Energy White Paper. http://www.worldenergy.com/files/PR_2007_01_19_Reverse_Auction_White_Paper.pdf Accessed 9/8/2008.

75
While online auctions may have achieved significant penetration in the supply chain management and procurement procedures of other industries, such practices are a relatively new phenomenon in energy markets. After mixed results in several markets, there has been some success reported in capacity and ancillary markets operated by regional transmission operators (RTOs). In the PJM market, for instance, reverse auctions are being used to acquire “blackstart” capacity, one of several reliability services in its ancillary services market. According to World Energy, some 95 percent of the energy procured in deregulated markets is still acquired through paper-based RFP processes protracted over days, weeks or even months. In wholesale markets, in which utilities and electric service providers need to acquire generation and capacity from third party providers, manual RFPs and individual negotiations with suppliers are even more commonplace. However, in recent years, interest in such online procurement techniques including reverse auctions and dynamic competitive bidding has certainly increased. World Energy has specialized in conducting auctions for government agencies and commercial buying pools in states that allow competitive retail electricity markets. The company boasts several “success stories” resulting form its use of reverse auctions as illustrated by the following examples. In June of 2006, World Energy held an online auction event for a Midwestern state government agency. The auction involved the procurement of 180 million KWh with a term of 17 months for an aggregation of participants. The World Energy Exchange auction delivered a wholesale price of $0.061/KWh resulting in a retail price of $0.065/KWh for members of the aggregation group. According to the company, the state agency has saved approximately $840,000 in electricity supply purchased over the course of three auction events for various contract periods. Compared to estimated utility rates, the three auctions realized cost savings of 12.4 percent, 3.5 percent, and 21.6 percent respectively.49 In another case, World Energy said its process proved far superior to use of a traditional RFP, saving both time and money. Not only were resulting bid prices and turn around time lowered, but there was an increase in the efficiency of conducting the auction. One of the largest cities in New England had been buying its power through a state consortium since 1998. With a goal of reducing electricity costs to the bare minimum and the need to buy power for more than 400 accounts—including all city buildings, public schools, street lights, and the convention center— the city contracted with World Energy to run more than 30 separate auction events of individual and bundled loads in a single day. The added time over traditional procurement methods, would have resulted in inflation of price offerings with premiums to cover the financial risk incurred by suppliers as they held their prices against a potentially volatile market, World Energy claimed. Under the multiple standardized online RFPs created by World Energy, however, suppliers offered their best prices in a matter of hours during the online auction event. “The buyer watched the prices fall in real time, chose the suppliers with the most to offer, and awarded contracts promptly,” according to World Energy. With a total of 123 bids tendered, the World Energy Exchange auctions yielded results that outperformed the then-current consortium pricing by $870,000.
49 www.worldenergy.com

76
3.6.3.1 Mixed Experiences In Connecticut, a state law (PA 98-28) required the Office of Policy and Management (OPM) to operate an electricity purchasing pool for state facilities. Under the act, households receiving means-tested assistance from the state or federal government had to be offered the same rates offered to state facilities. OPM initially issued an RFP to obtain suppliers to serve the pool. OPM received very few timely proposals, and after conferring with market participants, revamped its solicitation such that the RFP, which did not include the requirement that the pool be open to low-income customers, and chose a supplier for state facilities. In a second attempt to secure resource for the pool, OPM conducted reverse auctions to procure power for state facilities. The auction process placed pre-qualified bidders (using the same criteria as the RFPs) in competition with one another. The lowest bid at the close of the auction won the contract. More than 55 auctions were conducted between September 19 and November 29, 2007, resulting in eight separate contracts covering executive, legislative, and judicial branch facilities and the state university systems.50 According to the OPM, the reverse auction process resulted in more than $20 million in savings. In addition, the state increased its purchases of green and renewable power by more than 17 percent above the Renewable Portfolio Standard. However, the auction did not cover low-income customers as was originally intended. The Independent System Operators of New England (ISO-NE) in February 2008 employed a reverse auction to contract for future capacity requirements in the 2011-12 period. As many as 31,000 MW of existing and new generation projects participated in eight rounds of bidding that resulted in price bids diminishing from as high as $15 per KWh-month to the final clearing price of $4.50/KWh-mo. This bid was considered successful in that it elicited winning offers from 1,813 MW of new supply and demand projects, allowing the ISO to reduce higher cost capacity payments to over 3,000 MW of older resources. However, the use of reverse auctions has not always resulted in improved costs for purchasers. In 2006, for example, Illinois utilities that were ending a rate-freeze period under restructuring regulations were directed under law to use reverse auctions. Because of changed market economics at the time, the resulting bid prices from these auctions were substantially higher than previous power purchase costs, leading to great controversy. Although the utilities were initially bound to accept the auction results, a settlement among the utilities and state officials later in 2006 scrapped the use of reverse auctions in favor of more traditional procurement techniques. In Ohio, by contrast, an attempt last year by utility Toledo Edison to employ a reverse auction process to reduce rates was considered unsuccessful. Under the reverse auction, the utility divided its service territory into slices of the system, referred to as “tranches” typically consisting of 100 MW. Any supplier, including the utility’s affiliate (with appropriate codes of conduct and an independent consultant conducting the auction) could bid up to an amount specified by the auction rules.
50 “Reducing Electric Rates for Low-Income Customers,” Kevin E. McCarthy, Principal Analyst OLR Research Report 2008-R-0068; January 29, 2008.

77
The price in the auction started at a level where it was believed there would be more than enough bidders. In a successive online process, the bid price was lowered in each round with suppliers responding to serve at the new lower price until the number of bids from multiple suppliers equaled the number of tranches available. During the December 2007 auction process, no significant customer savings on electricity were generated as the bidding produced a price of $0.545/KWh, down slightly from the opening price of $0.55 cents/KWh. The mixed results for reverse auctions has had a negative impact on public perceptions of their effectiveness in eliciting lower prices for energy and capacity, and has led to residual skepticism among utility regulators. For example, Colorado utility Xcel initially proposed using a reverse auction structure to purchase new or existing generation units in its territory as part of its 2007 Colorado Resource Plan, but ran into heavy opposition from other parties. The largest criticism was that the plan could result in the utility owning 100 percent of new generation units, rather than contracting for power, thus limiting competition. The Colorado Public Utilities Commission in June determined that the proposed use of a reverse auction for this purpose was not in the public interest51.
3.6.3.2 Other Criticisms of Reverse Auctions While California utilities have so far not engaged in the use of reverse auctions for energy procurement, there might be a strong regulatory resistance to their use, if proposed. In 2004, the California Public Utilities Commission issued an order barring the use of reverse auctions by utilities in the context of large construction projects.52 Though specific to large capital construction—as opposed to resource procurement—the commission’s arguments would certainly be considered should the issue arise. In the order, regulators held that “reverse auctions may not consistently result in lower prices than sealed bids. Reverse auctions permit bidders to start the bidding high in order to maximize the opportunity for profits. They need only reduce their bids in response to the bids of others. The potential for a utility accepting an artificially high bid in a reverse auction would be especially pronounced where a market . . .is not highly competitive. Sealed bid procedures, in contrast, provide bidders a single opportunity to present their best estimate of a project’s costs and are therefore less likely to lead to the type of gaming that is possible with reverse auctions. Because bidders do not know the estimates of other bidders, they are more likely to provide their own best estimates of actual costs plus a reasonable profit.” These arguments have carried over to competitive energy markets in Texas, where regulators had considered using such a mechanism to achieve savings compared to utility default rates for residential and small commercial customers. One power supplier, Phyllis Anzalone of CETX Energy Agency, authored a magazine article that was highly skeptical of reverse auctions, concluding that auctions do not allow for consideration of non-price terms—a factor that could disadvantage renewable energy—and that such auctions have not consistently demonstrated a result of the lowest possible price for the buyer or cost-savings compared to sealed-bid processes.53
51 Decision No. C08-0929; Docket No. 07A-447E 52 D04-12-056 53 “Reverse Auctions vs. Seal Bids in Utility Energy Procurement,” Phyllis Anzalone, NBIZ, Spring 2007.

78
3.6.4 Reverse Auction Conclusions In today’s electricity market, only a small percentage of utility procurement takes place via online auction. However when utilities have pursued this route there has been some evidence of both success and lack of success in reducing energy prices. While to date there has been little documentation, if any, of large scale utility solar e-procurement, given the potential benefits offered by online procurement techniques, this is likely a procurement strategy that interested electric service providers should continue to investigate further.
3.7 Forward Procurement Commitment
3.7.1 Opportunities and Drawbacks Forward Commitment Procurement (FCP) is a procurement model developed by the United Kingdom’s Environmental Innovation Advisory Group (EIAG), a government entity which claims to deliver cost-effective environmental products and services to the public sector. The concept is perceived as away to exert “market pull” for environmental innovations, by providing a predictable, if not guaranteed government demand for products, technologies or services. Currently, the model has been adopted in nations such as South Africa and Australia, and is associated with a range of environmentally friendly markets including ultra efficient lighting systems, innovative combined cooling, heat and power (CCHP), water efficiency, and sustainable waste management solutions. FCP models are being tested by certain public sector agencies and seem suited for “technology pull” tactics in which the incentive of a guaranteed market or forecast pricing will spur technology or service innovations. However, they also seem better suited for obtaining components or services rather than the large-scale utility grade generation resources being considered here.
3.7.2 Background and Discussion Jack Frost, chairman of the EIAG, described FCP as “how Government and its agencies can improve on the way they manage the supply chain in this sector.”54 The model involves providing the market with advance information of future needs, early engagement with potential suppliers, and the incentive of a “forward commitment” to purchase a product or service that currently does not exist, at a specified future date, providing it can be delivered to agreed performance levels and costs. It is perceived as a way to manage risk in the marketplace by making the market aware of genuine needs and requirements and offering to buy products which meet these needs once they are available at a price commensurate with their benefits. EIAG developed FCP as a supply chain management tool primarily for use by public sector policy makers and procurers, although the approach it is equally relevant to, and has been
54 Chairman’s report: Environmental Innovation: Bridging the gap between environmental necessity and economic opportunity. First report of the Environmental Innovations Advisory Group, November 2006.

79
picked up by, private sector bodies such as the New Swindon Company in a project concerning an innovative CCHP plant and services. FCP projects may be completely unlike each other, but generally exhibit these characteristics:
Identifiying unmet needs; Placing this need in the context of a market opportunity; Offering a forward commitment contract; Articulating the requirement in outcome terms to potential suppliers; Providing sufficient time for the market to respond; Assisting the development of a supply chain; Providing the supply chain with information and a route to wider markets; Ensuring procurement processes do not preclude small and medium sized companies; Use a competitive process.
In the context of utility acquisition of large-scale solar energy, FCP might be considered to be a model for the purchase of standardized components for widespread deployment of PV systems—as in the proposals forwarded by SCE,and Duke Energy mentioned previously.
3.8 Conclusions from the Innovative Procurement Study Driven by regulatory dictates to increase their commitment to renewable energy under RPS, and to meet public concerns over the potential effects of climate change caused by release of greenhouse gas emissions, electric utilities and other retail sellers of power have substantially stepped up the pace of solicitations for energy from wind, solar, biomass and geothermal technologies. Traditional approaches to operating utility-scale resources include individual utility ownership and contracting for power-purchase agreements (PPAs) with third-party developers of projects. Often these PPAs result from competitive solicitations or direct contracting opportunities in special circumstances. However, renewable resources in general, and solar power in particular, have been at something of a disadvantage in these competitive solicitations that look mainly at “least-cost” resource acquisition. But the demands of RPS policies have led to an increased use of renewables-only RFPs. Initially, wind resources dominated these RFPs, accounting for as much as 97 percent of new capacity added to meet RPS requirements. However, solar power is coming into greater cost-competitiveness and in the past two years alone, utilities have entered into contracts for nearly 5,000 MW of solar technologies of various types. These technologies include parabolic trough and power tower designs that have evolved from the earliest utility-scale CSP projects dating back to California’s experience with qualifying facilities and stand offer contracts. New technologies include dish Stirling engines and linear Fresnel concentrators – some sized up to 600 MW. Even PV systems are now achieving a scale that allows them to compete in this field, with recent contract signings for projects in the 250 MW to 550 MW range. The advent of such large projects also has encouraged a pattern of joint purchasing by utilities, in which demand is aggregated to achieve cost economies of scale and advantageous financing that a single entity might not achieve. However, joint actions are complicated. PPAs derived from them may be difficult to negotiate and often take longer to reach completion than single-buyer solicitations.

80
Beyond the traditional use of competitive RFPs, there are several other potential methods of resource acquisition either in use or possible for utilities. Some, like the use of feed-in tariffs that set a fixed price to encourage certain types or sizes of renewable resources, might complement the achievement of RPS goals, but are more generally perceived to be additional policy dictates rather than competitive solicitations. They need to be carefully crafted to avoid a repeat of the complaints about standard offers leading to higher priced energy resources. Other types of procurements, including electronic platforms that feature “reverse auction” price bidding, have a mixed record of success for specialized market niches, but could lend themselves to procurement of shorter-term renewable energy. Similarly, developing markets for renewable energy certificates (RECs) that unbundle the environmental attributes of energy from renewable technologies, may answer pressing needs to achieve RPS compliance milestones – but are unlikely to lead to long-tern commitments by utilities. Finally, there is a growing trend for utilities to propose programs for broader deployment of PV systems of certain sizes that do not currently seem competitive in standard RPS markets. This return to utility ownership of assets offers some opportunities to advance technologies by encouraging “forward procurement commitments” to suppliers of components, but it also raises concerns from potential competitors who would prefer to build, own and operate projects under utility PPA structures. These proposals are also encountering initial resistance in regulatory forums from ratepayer advocates who question the costs of installation, operations and rate-base treatment compared to competitively procured resources.
4.0 Overall Conclusions and Recommendations
4.1 Recommendations from the Traditional Procurement Study The following recommendations were derived from the responses to a survey by representatives of the solar and the utility industries.
Quantify Value - To increase its success in RFPs that do not specify a solar or renewable technology, solar developers should quantify its higher valued non-price attributes, especially its environmental attributes, and explicitly charge for them in RFP responses.
Accept Risk - The large-scale solar industry should accept that utilities will not typically
accept cost escalation, financing, or performance risk. The solar industry thus has to use other ways such as joint development or hedging commodities to spread such risk. Utilities should help solar companies mitigate cost escalation risks that are beyond a solar company’s control and are beyond a period of time in which the solar company is solely responsible for the risk.
Accept Terms - Solar developers should respond to RFPs with higher quality
responses, which means standing behind the offer made and responding to all of the RFP’s terms and conditions rather than some subset of them.

81
Performance Guarantees - If a utility has specific requirements for items such as on-line date, replacement power guarantees, capacity, or renewable energy, this information needs to be available in the bid package and not left to discovery during negotiations.
Solar Unit Availability - Solar bidder-supplied guarantees, or use of data from
reference projects may offer more effective ways to deal with plant availability and it’s effect on levelized energy cost than a comparison with other technologies.
Capacity Variability - Utilities should include in the bid package information on peak
and super-peak hours, plus any significant information pertinent to availability of capacity or energy. The bidder should provide the output characteristics of the proposed solar plant under a range of operation conditions.
Proof of Capabiity - The RFP should specify what the developer is required to provide
as a minimum in order to demonstrate capability. These could include items such as a list of reference plants or projects, site control, previous permits, whether project financing is securable, and whether PPAs or utility partners are necesssary (for utility or financing confidence). Also, if other specific partnering or risk-sharing devices are needed before consideration of a solar project offer, this should be a clear requirement in the RFP.
Commit to a Firm Price - RFP pricing requirements may be overly prescriptive and not
particularly good at finding the best, least cost scenario for the utility’s needs. Solar and other renewable resource technologies tend to be capital intensive, with a smaller cost proportion for maintenance and free or low cost for input energy. To overcome the often misunderstood nature of this issue, everything that can be done to help all stakeholders understand the best treatment of the capital financing portion of the bid, and to separate that from the O&M and any variable costs—will be an improvement. Design of the RFP to produce bids with sufficient information to have confidence in first year capital (debt service and/or equivalent power) costs should be considered.
Time Requirements - To improve solar companies’ ability to provide high quality
responses to RFPs, utilities must improve their estimates of the time they take to process RFPs and negotiate contracts. To improve solar companies’ ability to provide high quality responses to RFPs, utilities and RTOs must improve their estimates of the time they will take to analyze and construct needed transmission expansion.
All-Source RFPs - Solar companies should respond to more RFPs for “all-source,”
intermediate or peaking generation.
4.2 Recommended Principles for Solar RFP and PPA Design After reviewing the survey results and using their industry experience, the survey analysts developed a list of principles for developing solar RFPs and PPAs.
The RFP should clearly and transparently describe all solicitation process rules and guidelines.
The RFP should clearly and transparently describe all terms and conditions that the utility expects bidder to incorporate into its bid by including a model contract.
82
The RFP should clearly and transparently describe any transmission paths that could accommodate requested capacity’s size. Also, the utility should describe transmission expansion costs for paths that cannot accommodate the desired capacity.
The RFP should clearly and transparently describe the value the utility places on positive environmental attributes and on the value of avoiding emissions of criteria pollutants and carbon.
The RFP should clearly and transparently describe the peak hours of the utility by season or month.
The RFP should clearly and transparently describe the relative value of delivering energy during each hour of daylight for each season or month of the year.
The RFP should permit developers that bid to offer different pricing schemes besides “pay for energy only,” including capacity payments, time-of-day pricing, and seasonal pricing.
The developer should accept the terms of the RFP and model contract in the RFP and bid in accordance with those terms, and not assume the developer can “for free” bargain away some of them.
Each party should accept the risk that it can best manage. For example, the developer should bear the cost of materials and construction based on a reasonable estimate for time its take to process bids, negotiate a contract, arrange financing, and complete EPC work. On the other hand, the utility should bear some risk for misestimating the time it takes to process the RFP, gain regulatory approval or denial, or develop an adequate transmission path.
The education of both parties about how to improve RFP processes will be to their mutual benefit.
Solar companies need more information provided in the RFPs about transmission paths, security guarantees and performance standards.
4.3 Recommendations from the Innovative Procurement Study While it is clear that the U.S. utility industry is being expected to greatly accelerate its reliance on renewable energy resources, there remains great uncertainty about the best methods of doing so. The tension rises from the lingering utility mindset that new renewable resources generally, and solar power technologies in particular, are costly compared to traditional coal- or fossil-fueled generation options. However, this long-held notion is being upturned by several factors:
Rising costs associated with natural gas and coal fuels are making renewables seem more reasonable;
Unprecedented demands for reducing greenhouse gas emissions associated with energy will add further to the costs of traditional resources; and
Economies for scale for both CSP and PV technologies are bringing these resources further into the competitive realm.
In reviewing the field of potential procurement options for utilities, it seems clear that each of the following approaches has some potential role but also has drawbacks to widespread adoption: Standard RFP solicitations can be costly for participants and often eliminate entire categories of technologies from consideration. Power-purchase agreements derived from renewables-only RFPs, or bids tailored to meet solar set-aside requirements must be explicitly supported as reasonable by regulators.

83
Feed-in tariffs, though increasingly seen as an attractive and politically acceptable means to induce large amounts of renewable capacity, must be carefully designed to avoid a repeat of the “standard–offer” experience of the 1980s and 1990s in which a change in market economics can render existing contracts uneconomical compared to competitive alternatives. Combined purchases, aggregation of demand, and joint ownership have been very successful strategies for the development of large-scale utility resources, whether for generation or transmission. However, the most successful of these efforts come about because there already exists a legal framework (i.e., joint power agreement, professional association, or affiliate relationship among the purchasers) that can better manage the process. New consortiums of utilities which try to aggregate are encountering significant problems from attrition of participation, changed expectations over time, and the difficulties of properly allocating risks and rewards. Defined deployment programs under utility ownership regimes, such as those proposed in California and North Carolina, are being promoted as effective mechanisms to expedite certain market niches for solar PV. Nonetheless, they can face significant opposition from competitive market players, consumer advocates, and others based on proposed cost, ratemaking treatment and the perception of extension of utility monopoly control. Forward procurement commitments are being tried by certain public sector agencies and seem suited for “technology pull” tactics in which the incentive of a guaranteed market or forecast pricing will spur technology or service innovations. However, they also seem better suited for obtaining components or services rather than for the large-scale utility grade generation resources being considered here. Renewable Energy Certificates (REC) markets can be very useful for utilities in meeting RPS goals in places where it may be difficult to site sufficient renewable capacity, or where transmission links to those resources do not exist. But REC sales alone cannot provide the financial underpinning for financing the development of new capacity. Electronic procurement and use of reverse auctions appear in many instances to help drive bid costs lower and can greatly streamline the procurement process, but they are generally used for relatively small, identified blocks of energy. Past attempts by utilities to use this mechanism for large capacity acquisitions or long-term contractual commitments have proven unsuccessful, but a more positive experience is being reported by transmission system operators for acquiring forward capacity commitments and ancillary services. Despite this very mixed picture for future utility procurement, the most important realization is that there are new models for success being developed, and that ideas that prove effective in one region or territory are quickly being adopted and adapted in others. The exposure of these new ideas is valuable in and of itself, but much more experience is needed and more work needs to be done to refine their applicability to the utility acquisition of solar power before they become widespread practices.
Recommendations for SEPA

84
The following recommendations have been extracted from the report and describe how SEPA can help overcome some of the barriers impeding the greater utility market expansion of grid-connected solar technologies. 1. The Electric Power Research Institute (EPRI), SEPA, and possibly state-wide or regional groupings of utilities could be important entities in an effort to help educate planners and engineers about solar technologies’ costs and operational characteristics. (section 2.2.2.6 on page 23) 2. SEPA and other solar industry organizations can play a significant role in increasing utility confidence in solar developers and EPC contractors by sponsoring workshops for utility planners and engineers, thereby getting developer and EPC success stories out to utility planners and engineers. SEPA should also encourage the solar industry entities to attend utility conventions (like PowerGen). SEPA can help utilities become more informed about the solar industry, and can also help utility planners become more confident in the solar industry’s ability to design, finance, build, and successfully generate utility-scale solar power plants. (2.2.2.9 on page 24) 3. SEPA, along with other solar industry organizations and consulting firms, can help quantify the value of solar power’s environmental attributes for the utility sector, and can help quantify such things as the uncertainty and risk premium associated with unknown future environmental restrictions, taxes on pollutants, etc.

85
References APPA, “Joint Ownership of Transmission Projects,” American Public Power Association, January 2006. American Wind Energy Association news release Sept. 3, 2008. Anzalone, P., “Sealed Bids vs. Reverse Auctions in Utility Energy Procurement,” NBIZ, Spring 2007. Barbose, G., Wiser, R., Renewable Portfolio Standards in the Western United States. Berkeley, CA: Lawrence Berkeley National Laboratory, May 2008. California Public Utilities Commission, “California Solar Initiative,” CPUC Staff progress report, April 2008. Cuneo, Anne-Marie, “Renewable Portfolio Standards-the Nevada Experience,” Nevada Public Utilities Commission, presenting to the State-Federal RPS Collaborative, July 31, 2008. EIAG, “Chairman’s report: Environmental Innovation: Bridging the gap between environmental necessity and economic opportunity. First report of the Environmental Innovations Advisory Group,” November 2006. Farrell, J., Minnesota feed-in-tariff could lower cost, boost renewables, and expand local ownership. Minneapolis, MN: Institute for Local Self-Reliance, New Rules Project, 2008. Fox, Kevin T. “Options for Selling Solar Distributed generation to an Interconnected Utility in California.” Wilson Sonsini Goodrich & Rosati, Feb. 2008. Geller, H., Energy Revolution: Policies for a Sustainable Future. Washington D.C.: Island Press, 2003. Governors Task Force on Global Warming, Wisconsin’s Strategy for Reducing Global Warming, July 2008. Grace, R., Rickerson, W., The Debate over Fixed Price Incentives for Renewable Electricity in Europe and the United States: Fallout and Future Directions. The Heinrich Boll Foundation, February 2007. Kallock, et al., An Analysis of Potential Ratepayer Impact of Alternatives for Transitioning the New Jersey Solar Market from Rebates to Market-based Incentives, Summit Blue Consulting prepared for NJ BPU, 2007. Lacey, S., Mixed Reviews for Ontario’s Feed-In Tariff. Renewable Energy World.com, May 2007. Lacey, S, U.S. State Solar Debate: Will SRECs Create Unhealthy Market Concentration? Renewable Energy World.com, May 2008.

86
LaMonica, M., Spain's Iberdrola commits $8 billion to renewable energy in U.S. CNET News, May 19, 2008. Landler, M., Solar Valley Rises in an Overcast Land. The New York Times, May 16, 2008. Lesser, J., Xuejuan, S., Spencer, Y, Design of an Economically Efficient Feed-in tariff: Presentation to the California Energy Commission. Bates-White LLC, May 21, 2007. McCarthy, K., “Reducing Electric Rates for Low-Income Customers,” OLR Research Report 2008-R-0068; January 29, 2008. Ontario Power Authority, Standard Offer Program - Renewable Energy for Small Electricity Generators: An Introductory Guide, 2008. Pickman, H., Data Points: Green-Collar Jobs, What we Know so Far. Apollo News, May 21, 2008. Pierobon, Jim, US Rep. Inslee Introduces Renewable Energy Pricing Legislation. Renewable Energy Access.com, June 27, 2008. Poetter, B., People Power, Danish Style. On Earth Magazine from NRDC. June 1, 2007, Proceedings of the California Energy Commission Integrated Energy Policy Report Committee Workshop on the Mid-Course Review of the Renewables Portfolio Standard Process, 2006 Renewable Energy Access.com, Spain's RE Feed-in tariff Attracts U.S. Developers. March 31, 2005. Renewable Energy Policy Network for the 21st Century (REN 21). Renewables 2007 Global Status Report. Paris, Washington DC. Rickerson, W., Bennhold, F., Bradbury, J., Feed-in tariffs and Renewable Energy in the USA- a Policy Update. North Carolina Solar Center, Heinrich Boll Foundation, World Future Council, March 31, 2005. Rickerson, W., et al, Is California the Next Germany? Renewable gas and California's New Feed-in Tariff, BioCycle, 2008. Rickerson, W., The outlook for feed-in tariffs in the United States of America, Proceedings of the World Wind Energy Conference 2008. SEIA, “U.S. Solar Industry Year in Review 2007,” Prometheus Institute/Solar Energy Industries Association. Wiser, R., Feed-in tariff Design: International Experience and Recommendations for China. Energy Foundation’s China Sustainable Energy Program, July 2005. Wiser, R. and Barbose, G., “Renewables Portfolio Standards in the United States: A Status Report through 2007”, Lawrence Berkeley National Laboratory, April 2008. Wiser, R., et al. Lawrence Berkeley National laboratory, unpublished spreadsheet, Sept. 2008.

87
Wobus, et al., Preliminary Review of Alternatives for Transitioning the New Jersey Solar Market from Rebates to Market-based Incentives, Summit Blue Consulting prepared for NJ BPU, 2007. World Energy, “Reverse Auctions Drive Prices Lower: Online Auctions Set Stage For Success,” World Energy White Paper 2007. World Future Council. (2008) Feed-in-Tariffs-Boosting Energy for our Future, a guide to one of the world’s best environmental policies. Hamburg, Germany.

88
Appendix A: PV Projects Table The following table shows the large-scale (more than 20MW) US utility PV projects either completed or in development as of September 2008.
US Large-scale Utility Photovoltaic, Contracts, RFPs and Proposals
Capacity
(In MW) Utility Developer Status Operational Type
550 Pacific Gas & Electric
Topaz Solar Farms/ OptiSolar
Contract announced Aug. 2008; awaiting regulatory approval.
2011-2013 Thin film
250 Pacific Gas & Electric
High Plains II/ SunPower
Contract announced Aug., 2008, awaiting regulatory approval.
2010-2012 Microcrystalline PV/tracking system
250 over 5 years
Southern California Edison
TBD In regulatory approval process; first 2 MW unit under construction, Sept. 2008.
First unit Fall
2008.
52 –77 over 4 years
San Diego Gas & Electric
TBD In regulatory approval process.
2009-2013 TBD/tracking system
Up to 50 Long Island Power Authority
TBD RFP released July 2008.
2009-2011
25 FPL SunPower In construction. 2009 Microcrystalline PV/tracking system
Up to 25 Public Service Colorado
TBD In negotiations with bidders, Sept. 2008
2009-2012
21.5 Duke Energy SunEdison In regulatory approval process.
2009-2010
Up to 20 Duke Energy Carolinas
TBD In regulatory approval process.
Rooftop systems

89
100 CPS Energy TBD In RFP process TBD
125 APS TBD In RFP process TBD
10-30 Kauai Island Co-op
TBD TBD
Total
1,383.5 – 1,523.5 MW

Appendix B: CSP Projects Table The following table shows the large-scale US CSP projects either completed or announced as of July 2008.
US Projects
Name
Utility
State
Installed1Under
Contract2
Technology Operational
Date
Company
SEGS SCE California 354 MW Parabolic trough 1985 - 1991 FPL Energy Saguaro APS Arizona 1 MW Parabolic trough 2006 Acciona Nevada Solar One
Nev. Power Nevada 64 MW Parabolic trough 2007 Acciona
SES Solar One – Ph 1
SCE California 500 MW Dish/engine 2009 - 2012 SES
SES Solar Two – Ph 1
SDG&E California 300 MW Dish/engine 2009 - 2010 SES
SDG&E California 100 MW Parabolic trough TBD Bethel Energy Mojave Solar Park
PG&E California 553 MW Parabolic trough 2011 Solel
Solana APS Arizona 280 MW Parabolic trough 2011 Abengoa Solar PG&E California 500 MW Power tower 2011 - 2013 Bright Source Carri Energy Farm
PG&E California 177 MW Linear Fresnel 2010 Ausra
FPL Florida 300 MW Linear Fresnel 2011 Ausra Beacon LADWP California 250 MW Parabolic trough 2011 FPL Energy EPE New Mexico 66 MW Power tower 2011 eSolar SCE California 245 MW Power tower 2011 eSolar (TBA) California 107 MW Parabolic trough 2011 Martifer
Renewables Martin Next Generation Solar Energy Center
FPL
Florida
75 MW
Parabolic trough add-on to IGCC
2011
FPL Energy
SES Solar One – Ph 2
SCE California 350 MW 3 Dish/engine 2013 - 2014 SES

91
SES Solar Two – Ph 2/3
SDG&E California 600 MW 3 Dish/engine 2011 - 2013 SES
PG&E California 400 MW 3 Power tower TBD Bright Source Total 419 MW 4803 MW
1 Detailed information: http://www.nrel.gov/csp/troughnet/power_plant_data.html
2 Power purchase agreement signed or in negotiation following announcement 3 Contractual expansion option

Appendix C: Traditional Procurement Study Utility Questionnaire Respondent Tables and Comments
Abbreviation Key for the Utility and Industry Questionnaire Tables and Comments
Abbreviated Term
Explanation
IOU Investor Owned Utilities POU Publically Owned Utility AVg Average Stdev, σ Standard Deviation using Excel’s “STDEV” function CofV Coefficient of Variation Ct Count
Description of Utility Respondents
Total Utility Respondents
15 Classification of Respondents IOUs POUs Large Medium Small7 8 7 6 2
Utility Size Classifications Large: Greater than 750,000 customers Medium: Less than or equal to 750,000 customers and greater or equal to 100,000 customers Small: Less than 100,000 customers

93
Compilation of Utility Questionnaire Responses
2. With what generation technologies is your utility familiar? (yes/no) Fifteen utilities responded to this question.
Total Responses
15 IOU 7 POU 8 Large 7 Medium 6 Small 2
Yes % Yes % Yes % Yes % Yes % Yes % Wind 12 80% 5 71% 7 88% 5 71% 6 100% 1 50% Combustion turbine, natural gas
11 73% 7 100% 4 50% 6 86% 5 83% 0 0%
Combined cycle, natural gas
11 73% 7 100% 4 50% 6 86% 5 83% 0 0%
Hydro 10 67% 4 57% 6 75% 5 71% 4 67% 1 50% Pulverized Coal 10 67% 6 86% 4 50% 5 71% 5 83% 0 0% Geothermal 7 47% 2 29% 5 63% 4 57% 3 50% 0 0% Biomass 7 47% 5 71% 2 25% 3 43% 4 67% 0 0% Municipal solid waste 6 40% 3 43% 3 38% 2 29% 4 67% 0 0% Integrated gas combined cycle, coal
6 40% 4 57% 2 25% 3 43% 3 50% 0 0%
Nuclear1 2 13% 2 29% 0 0% 2 29% 0 0% 0 0% Landfill methane1 1 7% 0 0% 1 13% 0 0% 1 17% 0 0% Solar PV1 1 7% 1 14% 0 0% 1 14% 0 0% 0 0%
1 These technologies were added by respondents.

94
3. Please assess the relative value of the listed non-price solar attributes. (100 pt scale)
Total 15 IOU 7 POU 8 Large 7 Medium 6 Small 2
Avg StDev CofV Avg StDev CofV Avg StDev CofV Avg StDev CofV Avg StDev CofV Avg StDev CofV No emissions of carbon or pollutants
28.4 24.4 86% 18.6 12.1 65% 36.9 29.9 81% 18.6 14.1 76% 24.3 12.7 52% 75.0 35.4 47%
RECs 15.5 14.0 91% 17.9 19.1 107% 13.4 8.3 62% 19.3 18.4 95% 14.2 8.6 60% 6.0 8.5 141% Carbon offset value
11.9 12.5 105% 11.5 12.5 108% 12.3 13.3 109% 8.6 9.9 115% 17.6 15.4 87% 6.5 9.2 141%
Correlation b/t solar generation & peak hours of utility
9.7 8.6 88% 13.7 9.0 66% 6.3 6.9 111% 13.6 9.0 66% 6.8 7.7 113% 5.0 7.1 141%
Dispatchability (CSP w/storage)
9.3 14.9 159% 10.7 19.7 184% 8.1 10.3 127% 12.9 19.1 149% 7.5 11.7 156% 2.5 3.5 141%
Elimination of fuel price uncertainty
8.8 8.9 102% 10.0 10.0 99% 7.6 8.3 109% 12.1 9.5 78% 7.5 8.2 109% 0.5 0.7 141%
Fuel diversification
7.5 7.2 96% 9.4 7.3 78% 5.9 7.1 121% 8.6 7.5 87% 8.4 7.6 90% 1.0 1.4 141%
Potential for location close to load
3.2 4.9 155% 3.6 4.8 132% 2.8 5.3 191% 3.6 4.8 133% 3.4 6.1 180% 1.0 1.4 141%
Minimal water usage (PV)
3.1 5.4 177% 2.3 6.0 265% 3.8 5.2 138% 0.7 1.9 265% 6.0 7.6 127% 2.5 3.5 141%
Delay of transmission or distribution investment
1.7 4.1 243% 1.5 2.5 171% 1.9 5.3 283% 2.1 5.7 265% 1.7 2.7 155% 0.0 0.0 NA
Power factor correction
1.0 2.9 283% 1.5 4.0 265% 0.6 1.8 283% 0.7 1.9 265% 1.8 4.3 245% 0.0 0.0 NA
Local voltage support
0.7 1.8 264% 0.8 2.0 265% 0.6 1.8 283% 0.7 1.9 265% 0.9 2.1 245% 0.0 0.0 NA

95
4. Are the utility planners and power contract personnel as knowledgeable about the following large scale solar attributes as they are about coal, combined cycle or combustion turbine attributes? (yes or no)? Table tabulates the number of “yes” answers.
All 15.0
IOU 7.0 47%
POU 8.0 53% Large 7.0 47% Medium
6.0 40% Small 2.0 13%
AllCt
%A IOUCt
%C %I MunCt %C %M LgCt %C %L MedCt %C %M SmCt %C %S
Solar generating patterns
9.0 60%
4.0 44%
57%
5.0 56% 63% 5.0 56% 71% 4.0 44% 67% 0.0 0% 0%
Solar technologies
9.0 60%
3.0 33%
43%
6.0 67% 75% 4.0 44% 57% 5.0 56% 83% 0.0 0% 0%
Land & water use of solar technologies
8.0 53%
3.0 38%
43%
5.0 63% 63% 4.0 50% 57% 4.0 50% 67% 0.0 0% 0%
O&M costs of solar technologies
6.0 40%
1.0 17%
14%
5.0 83% 63% 2.0 33% 29% 3.0 50% 50% 1.0 17%
50%
Solar equipment suppliers
6.0 40%
2.0 33%
29%
4.0 67% 50% 2.0 33% 29% 3.0 50% 50% 1.0 17%
50%
Total life-cycle costs
6.0 40%
1.0 17%
14%
5.0 83% 63% 2.0 33% 29% 3.0 50% 50% 1.0 17%
50%
Supply chain depth
5.0 33%
1.0 20%
14%
4.0 80% 50% 2.0 40% 29% 2.0 40% 33% 1.0 20%
50%
EPC 4.0 27%
0.0 0% 0% 4.0 100% 50% 0.0 0% 0% 3.0 75% 50% 1.0 25%
50%
Additional Comments:
1. Since generation engineering & construction is not our core business, we are equally unaware of the details of solar and conventional generation engineering & construction.
2. We believe we have up to date info on solar as well as CTs, coal possibly not as much. Regardless, solar, like most technologies, continues to change and information updated.
3. This question is confusing. The answer is no, our planners are less knowledgeable about solar attributes. However, I've checked YES for all the reasons they are less knowledgeable
4. Really needed a middle ground on this series of questions like 'maybe or possibly'. It also would have been helpful to have a percentage figure with this question, like, what percentage of utility personnel are knowledgeable.

96
5. Are the utility's generation engineering & construction people as knowledgeable about the following large-scale solar attributes as they are about coal, combined cycle or combustion turbine attributes? Table tabulates “yes” responses. Responses
14.0 6.0 43% 8.0 57% 6.0 43% 6.0 43% 2.0 14%
All IOU POU Large Medium Small AllCt %A IOUCt %C %I MunCt %C %M LgCt %C %L MedCt %C %M SmCt %C %S Total life-cycle costs 3.0 21% 0.0 0% 0% 3.0 100% 38% 1.0 33% 17% 1.0 33% 17% 1.0 33% 50% Solar hourly generating patterns
4.0 29% 2.0 50% 33% 2.0 50% 25% 3.0 75% 50% 1.0 25% 17% 0.0 0% 0%
Sub-hour generating patterns
2.0 14% 0.0 0% 0% 2.0 100% 25% 1.0 50% 17% 1.0 50% 17% 0.0 0% 0%
Solar technologies 4.0 29% 0.0 0% 0% 4.0 100% 50% 1.0 25% 17% 2.0 50% 33% 1.0 25% 50% Land & water use of solar
4.0 29% 1.0 25% 17% 3.0 75% 38% 2.0 50% 33% 1.0 25% 17% 1.0 25% 50%
O&M costs of solar 3.0 21% 0.0 0% 0% 3.0 100% 38% 1.0 33% 17% 1.0 33% 17% 1.0 33% 50% EPC 3.0 21% 0.0 0% 0% 3.0 100% 38% 1.0 33% 17% 1.0 33% 17% 1.0 33% 50% Solar equipment suppliers
4.0 29% 1.0 25% 17% 3.0 75% 38% 2.0 50% 33% 1.0 25% 17% 1.0 25% 50%
Supply chain depth 4.0 29% 1.0 25% 17% 3.0 75% 38% 2.0 50% 33% 1.0 25% 17% 1.0 25% 50% Additional comments:
1. Since generation engineering & construction is not our core business, we are equally unaware of the details of solar and conventional generation engineering & construction.
2. To date, [we] have not built or owned any large-scale solar projects, thereby limiting amount of knowledge [our] generation engineering & construction personnel have gained in these areas.
3. Interested in owning solar, subject to qualifying for an extended ITC. 4. Generation engineers may possess in-depth knowledge of solar as well as coal and CTs, there is currently no need for this
knowledge as respondent has no coal or CTs and the solar respondent does have is in the form of demonstration units in the kW size range.
5. This question is confusing. The answer is no, our planners are less knowledgeable about solar attributes. However, I've checked YES for all the reasons they are less knowledgeable
6. Really needed a middle ground on this series of questions like 'maybe or possibly'. It also would have been helpful to have a percentage figure with this question, like, what percentage of utility personnel are knowledgeable.

97
Other: (description)
1. We would procure PPAs. 2. No plans to add large solar generation.
6. Where is large-scale solar generation planning done within the utility? Table tabulates “yes” answers.
15.0 7.0 47% 8.0 53% 7.0 47% 6.0 40% 2.0 13%
All IOU POU Large Medium Small
AllCt %A IOUCt %C %I MunCt %C %M LgCt %C %L MedCt %C %M SmCt %C %S Same work group that plans system generation
7.0 47% 4.0 57% 57% 3.0 43% 38% 3.0 43% 43% 3.0 43% 50% 1.0 14% 50%
In a special group that handles only solar generation
1.0 7% 0.0 0% 0% 1.0 100% 13% 1.0 100% 14% 0.0 0% 0% 0.0 0% 0%
In multiple work groups within the co.
7.0 47% 4.0 57% 57% 3.0 43% 38% 4.0 57% 57% 3.0 43% 50% 0.0 0% 0%
Planning for adding solar is not done
2.0 13% 0.0 0% 0% 2.0 100% 25% 0.0 0% 0% 1.0 50% 17% 1.0 50% 50%

98
7. If large-scale generation is an option, where in your generation planning process is large-scale solar analyzed and decided upon?
10 6 60% 4 40% 5 50% 4 40% 1 10%
All IOU POU Large Medium Small
AllCt %A IOUCt %C %I MunCt %C %M LgCt %C %L MedCt %C %M SmCt %C %S a. In a qualitative, ad hoc generation screening process
5 50% 2 40% 33% 3 60% 75% 2 40% 40% 2 40% 50% 1 20% 100%
b. In detailed, quantitative modeling like EGEAS or Strategist
6 60% 5 83% 83% 1 17% 25% 4 67% 80% 2 33% 50% 0 0% 0%

99
8. Please indicate those generation technologies with which your generation planning personnel are more familiar than they are with solar techs. Table tabulates “yes” responses.
15.0 7.0 47% 8.0 53% 7.0 47% 6.0 40% 2.0 13%
All IOU POU Large Medium Small
AllCt %A IOUCt %C %I MunCt %C %M LgCt %C %L MedCt %C %M SmCt %C %S Pulverized coal 7.0 47% 6.0 86% 86% 1.0 14% 13% 4.0 57% 57% 3.0 43% 50% 0.0 0% 0% Integrated gas combined cycle, coal
4.0 27% 3.0 75% 43% 1.0 25% 13% 3.0 75% 43% 1.0 25% 17% 0.0 0% 0%
Hydro 10.0 67% 4.0 40% 57% 6.0 60% 75% 6.0 60% 86% 2.0 20% 33% 2.0 20% 100% Combustion turbine, natural gas
9.0 60% 7.0 78% 100% 2.0 22% 25% 6.0 67% 86% 3.0 33% 50% 0.0 0% 0%
Combined cycle, natural gas
9.0 60% 7.0 78% 100% 2.0 22% 25% 6.0 67% 86% 3.0 33% 50% 0.0 0% 0%
Wind 10.0 67% 5.0 50% 71% 5.0 50% 63% 5.0 50% 71% 4.0 40% 67% 1.0 10% 50% Biomass 5.0 33% 4.0 80% 57% 1.0 20% 13% 3.0 60% 43% 2.0 40% 33% 0.0 0% 0% Municipal solid waste
4.0 27% 2.0 50% 29% 2.0 50% 25% 2.0 50% 29% 2.0 50% 33% 0.0 0% 0%
Geothermal 4.0 27% 1.0 25% 14% 3.0 75% 38% 2.0 50% 29% 2.0 50% 33% 0.0 0% 0% Nuclear1 2.0 13% 2.0 100% 29% 0.0 0% 0% 2.0 100% 29% 0.0 0% 0% 0.0 0% 0% Tidal1 1.0 7% 0.0 0% 0% 1.0 100% 13% 0.0 0% 0% 1.0 100% 17% 0.0 0% 0%
1 Other options added by respondents.

100
9. Does your company have concerns about fluctuating generation patterns of large-scale PV? If not, at what percent of your generation mix would it become a concern? (yes/no, and/or %) Yes Count % Yes/No 10 67%
Percentage: Four utilities indicated a percentage at which fluctuating generation patterns would become a concern: 20%, >10%, 5-10% and 0.1-0.15% Respondent Comments:
1. No. Large scale solar has not to date been proposed to respondent; therefore, knowledge about fluctuating generation related to solar is very limited. Hence, no basis currently exists from which to determine the percentage of generation mix before a concern would arise. However, the ability of other existing generation to respond to, and the magnitude of, the fluctuation would be critical in determining the appropriate percentage of solar in the company's generation mix.
2. Yes, concerned about the costs & operational feasibility of integrating intermittent renewable energy, including solar. Solar techs may be less variable than some renewable energies, still subject to weather variations. PV requires quick ramp rates of backup generators (clouds) & solar thermal capacity might not be available on all cloudy days.
3. We have concerns about PV ramp rates for both central station and large feeder penetration scenarios 4. No. Explicit analysis has not been done to date, but I would guess it would not be of much concern until it reached 5-10% 5. Yes. % of generation mix is a function of the solar resource characteristics in the relevant geographic area and the existing
mix of generators (i.e., gas or coal on margin). On one system, a peak load penetration rate of 0.1% from a single facility would become a concern; on another system, a peak load penetration rate of 0.15% from a single facility would become a concern.
10. What contractual risks does your company believe that solar developers should rightly bear that they most often attempt to place on your company? Respondent Answers:
1. Price escalation during project development and construction 2. My guess is that the risks would be reflected in the contractual price paid for the solar power. Our cost to provide 'shaping'
services would be subtracted from the price the solar power producers are paid. 3. Financing

101
4. Our RPS and PPA appropriately distributes risk between the utility and developers. Form PPA provides some flexibility for performance and delays but also reflects believe that, as an off-taker, the utility isn't in best position to manage development or operational risk. Project developers should assume most of risk-especially with permitting, transmission delays or costs, tech performance or weather events.
5. No experience with solar developers 6. No experience to date 7. 100%, this is because of our unique position as a non-load growth entity that facilitates PPA's between vendors and buyers 8. Cost escalation requests after contract execution or short-list announcement, commercial operation delays, claiming user-
induced outages as events of force majeure. 11. How does your utility address risk when acquiring "new" technology: e.g. through PPA's, partnering with other utilities or GOs, pilot projects, contract escape ramps, etc.? Respondent Comments:
1. All of the [listed methods] above. 2. Via pilot projects. All must have been operating for 1 full year at least 1/10th the size of any proposed project. We mitigate
risk through rigorous contract requirements (incl. energy & capacity guarantees & liquidated damages. 3. PPAs 4. For our large wind projects we use PPAs in conjunction with partnering with other utilities 5. We use PPA's and partnering with other utilities. 6. Industry involvement + PPA, with buyout option preferred 7. Risks are generally addressed through contractual agreements or recognized as a cost in the economic evaluation. 8. PPAs limit technology related risk via performance requirements. Can further limit risk by limiting procurement of 'new'
technologies to smaller PPAs. Also work actively with [removed] program to further address technical risk by supporting early stage testing and demonstration
9. All of the above. 10. Pilots 11. Performance termination rights, output guarantees, demonstration/pilot projects, transmission availability. 12. Pursue government grants; structure PPA's so that we only pay for energy delivered. 13. Pilot projects 14. We only procure solar on behalf of others at this time. In the future, it is possible that we would procure solar on a short term,
less than 5 year PPA basis. 15. Pilot projects and PPAs

102
12. If your utility has chosen or intends to choose a large scale solar option as a current or future generation addition through an RFP-PPA process, what reasons led to that decision? (100 pt scale)
Total Responses 8 All IOU 5 POU 3 Large
5 Medium
2 Small
1
Avg σ Cov Avg σ Cov σ Stdev Cov Avg σ Cov Avg σ Cov Avg σ Cov Availability of ITC 23.8 33.8 142% 26.0 42.2 162% 20.0 20.0 100% 28.0 41.5 148% 25.0 21.2 85% 0.0 NA NA Regulatory mandate requiring solar
15.0 28.3 189% 24.0 33.6 140% 0.0 0.0 0% 14.0 31.3 224% 25.0 35.4 141% 0.0 NA NA
Generation portfolio diversity
14.4 12.4 86% 10.0 12.2 122% 21.7 10.4 48% 13.0 14.0 107% 10.0 0.0 0% 30.0 NA NA
Total life-cycle costs
13.8 22.0 160% 4.0 8.9 224% 30.0 30.0 100% 4.0 8.9 224% 15.0 21.2 141% 60.0 NA NA
Excellent solar resource
12.5 10.4 83% 10.0 10.0 100% 16.7 11.5 69% 12.0 13.0 109% 15.0 7.1 47% 10.0 NA NA
Commitments & other agreements
11.3 24.7 220% 18.0 30.3 169% 0.0 0.0 0% 18.0 30.3 169% 0.0 0.0 0% 0.0 NA NA
Diversification of fuel sources
9.4 9.4 101% 8.0 8.4 105% 11.7 12.6 108% 11.0 11.4 104% 10.0 0.0 0% 0.0 NA NA
Dispatchability of CSP
2.5 7.1 283% 4.0 8.9 224% 0.0 0.0 0% 4.0 8.9 224% 0.0 0.0 0% 0.0 NA NA
Ease of obtaining Certificate of Public Convenience and Necessity or similar approval from regulators
0.0 0.0 0% 0.0 0.0 0% 0.0 0.0 0% 0.0 0.0 0% 0.0 0.0 0% 0.0 NA NA

103
13. What terms in your RFP or in you PPA negotiations have led to the most disagreement in RFP discussions or power purchase negotiations with solar developers? (100 pt scale)
Total Responses
5 IOU 3 POU 2 Large
4 Medium
0 Small
1
Avg σ Cov Avg σ Cov Avg σ Cov Avg σ Cov Avg σ Cov Avg σ Cov Pricing terms 28 22.5 80% 13.3 10.4 78% 50.0 14.1 28% 20.0 15.8 79% 60.0 Default terms 16 10.8 68% 23.3 2.9 12% 5.0 7.1 141% 20.0 7.1 35% 0.0 Penalties for not meeting performance guarantees
16 10.8 68% 23.3 2.9 12% 5.0 7.1 141% 20.0 7.1 35% 0.0
Performance guarantees
14 10.8 77% 20.0 8.7 43% 5.0 7.1 141% 17.5 8.7 49% 0.0
Force majeure terms 7 8.4 120% 10.0 10.0 100% 2.5 3.5 141% 8.8 8.5 98% 0.0 Credit provisions1 4 8.9 224% 6.7 11.5 173% 0.0 0.0 0% 5.0 10.0 200% 0.0 Step-in rights 4 8.9 224% 0.0 0.0 0% 10.0 14.1 141% 5.0 10.0 200% 0.0 Value of energy as function of time of delivery
4 8.9 224% 0.0 0.0 0% 10.0 14.1 141% 0.0 0.0 0% 20.0
In service date 3 4.5 149% 3.3 5.8 173% 2.5 3.5 141% 3.8 4.8 128% 0.0 Definitions of excess energy
2 4.5 224% 0.0 0.0 0% 5.0 7.1 141% 0.0 0.0 0% 10.0
Requirement to purchase excess energy
2 4.5 224% 0.0 0.0 0% 5.0 7.1 141% 0.0 0.0 0% 10.0
Length of contract 0 0.0 0% 0.0 0.0 0% 0.0 0.0 0% 0.0 0.0 0% 0.0 Price paid for excess energy
0 0.0 0% 0.0 0.0 0% 0.0 0.0 0% 0.0 0.0 0% 0.0
Who gets value of environmental benefits
0 0.0 0% 0.0 0.0 0% 0.0 0.0 0% 0.0 0.0 0% 0.0
1 Respondent addition Respondent Comments:
1. Have not done one yet.

104
2. N/A - no negotiations with solar developers to date. 3. Require a project development security and delivery term security in form PPA. Terms of these provisions are source of
significant discussion with developers. 4. N/A - We have not completed our RFP process, and consequently cannot answer this question yet. 5. No RFP negotiations to date.
14. Does your utility believe the following entities have relatively the same knowledge and expertise about their business as their counterparts in the fossil-fueled generation fields (e.g. coal developers or combined cycle generators)? (yes/no) Total Responses 14 IOU 7 POU 7 Large 7 Medium 5 Small 2 Yes No Yes No Yes No Yes No Yes No Yes No Solar project developers 3 11 0 7 3 4 1 6 2 3 0 2 EPC Contractors 4 10 1 6 3 4 2 5 2 3 0 2
15. What is the maximum length of a PPA contract your utility would consider for a large scale solar project? (in years)
1. 20 years 2. 30 years 3. 25 years 4. I'm guessing, but would say 20 years 5. 25 years 6. 30 7. N/A - would depend on terms and conditions, mandatory requirements and/or economics of the project 8. Standard form allows for terms of up to 20 years. Can evaluate and select for longer terms if value of project is
favorable. 9. 30 years 10. Don't know yet 11. N/A 12. 20 years 13. Not interested in PPA. We prefer to own generation assets. 14. 3-5 years at this time, could change 15. Depends if the PPA creates any capital lease issues. Generally no longer than 20 years.

105
Total 6 IOU 2 POU 4 Large 3 Medium
2 Small 1
Yes Yes Yes Yes Yes Yes The PPA transfers ownership of the property to the lessee by the end of the PPA term
6 2 4 3 2 1
The PPA contains a bargain purchase option
5 2 3 2 2 1
The PPA term is equal to 75 percent or more of the estimated economic life of the PPA'd property
2 2 0 1 1 0
The value at the beginning of PPA term of minimum PPA payments (excluding executory costs such as insurance, maintenance and taxes, including any profit thereon, equals or exceeds 90 % of the excess of the fair value of the PPA property
2 2 0 1 1 0
Debt liability accounting is not a solar issue of concern
0 0 0 0 0 0
16. When issuing an RFP or designing a PPA for solar or generation sources, does your utility factor in the following FASB issues regarding capital lease effects of the contract? (yes/no)

106
17. If a large scale solar option for future generation additions has not been selected through your RFP/PPA process, what has prevented the utility from selecting large-scale solar? (100 pt scale)
Total Responses
10 IOU 5 POU 5 Large 4 Medium 4 Small 2
Avg σ Cov Avg σ Cov Avg σ Cov Avg σ Cov Avg σ Cov Avg σ Cov Total cost over life of project
25.8 33.8 131% 6.7 14.9 224% 45.0 37.7 84% 23.3 29.1 125% 6.3 12.5 200% 70.0 42.4 61%
A solar project has not been bid
20.0 42.2 211% 40.0 54.8 137% 0.0 0.0 0% 25.0 50.0 200% 25.0 50.0 200% 0.0 0.0 0%
Developer/EPC uncertainty
10.0 17.5 175% 15.0 22.4 149% 5.0 11.2 224% 12.5 14.4 115% 12.5 25.0 200% 0.0 0.0 0%
Uncertainty of ITC 9.3 13.3 142% 11.7 16.2 139% 7.0 11.0 156% 10.8 15.7 145% 12.5 14.4 115% 0.0 0.0 0% Waiting for solar cost reductions
9.3 13.1 140% 16.7 15.6 94% 2.0 2.7 137% 15.8 15.9 100% 6.3 12.5 200% 2.5 3.5 141%
Poor solar resource 8.5 16.7 196% 0.0 0.0 0% 17.0 21.1 124% 0.0 0.0 0% 18.8 23.9 128% 5.0 7.1 141% Misfit with demand pattern (e.g. winter peaking)
7.5 12.1 161% 0.0 0.0 0% 15.0 13.7 91% 0.0 0.0 0% 12.5 14.4 115% 12.5 17.7 141%
Relative lack of technology understanding by utility planners and engineers
4.0 8.8 219% 5.0 11.2 224% 3.0 6.7 224% 6.3 12.5 200% 0.0 0.0 0% 7.5 10.6 141%
Technological uncertainty
3.0 7.9 263% 5.0 11.2 224% 1.0 2.2 224% 6.3 12.5 200% 0.0 0.0 0% 2.5 3.5 141%
Does not reduce power portfolio risk1
2.5 7.9 316% 0.0 0.0 0% 5.0 8.8 177% 0.0 0.0 0% 6.3 10.2 163% 0.0 0.0 0% 1 Respondent addition Respondent Comments:
1. Had a large scale solar project bid, the key concerns would be poor solar resource, cost and technology immaturity, uncertainty. 2. N/A. Utility respondent is not considering purchasing large scale solar at this time.

107
18. Has or would your utility considered participating in an aggregated purchase of PV or CSP with other electric utilities interested in driving the cost of these technologies down?
Respondent Comments: Not at the present time. Interested. …, but we are somewhat concerned about the complications of multiple parties. Depends on terms and conditions Consider a number of structures incl. aggregated purchase to drive cost down. A number of factors need consideration b/f we support such a structure specifically. Savings based on joint procurement of panels may not be lower than 3rd party provider. Probably would consider Yes, we would be interested in exploring this 19. If your company could change two practices of the solar industry in an RFP/PPA process to increase the solar industry's share of future electric generation expansion, what would they be and why? Reason Number 1:
1. We'd like to see them further along in the development process by the time they submit bids (land options, permitting, transmission evaluation, etc.)
2. Reduce the total system installed costs 3. For fixed tilt PV systems, analyze and negotiate the azimuth, tilt and price of PPA energy since all 3 together impact the value
of the project to both parties. 4. Ultimate large-scale facility ownership is important to our utility; have industry provide proposals to the utility with a facility
ownership business model 5. Solar developers need to continue to work on delivering higher value product via lower prices and optimization of plant and
tech to meet utility portfolio needs. 6. The act of quoting unrealistically low prices for power from their projects. What developers don't realize is that they basically
end up hurting themselves when they tell a state commission the cost is less than it is. Sets up unrealistic expectations from commissioners that translate into difficulty with regulatory approvals.
7. IOU access to federal tax credits, long-term stability of federal tax credits.
Total 15 IOU 7 POU 8 Large 7 Medium 6 Small 2 Yes No Maybe Yes No Maybe Yes No Maybe Yes No Maybe Yes No Maybe Yes No Maybe
12 2 1 5 1 1 7 1 0 6 1 0 5 0 1 1 1 0

108
Reason Number 2:
1. Ability to complete projects on time for the contracted price. 2. Large-scale facilities have multiple environmental constraints-water use, CEQA and/or CEC permitting impacts, visibility,
endangered species - that need an industry plan. 3. Utility respondent would like the solar companies to propose projects with high viability. Developers should submit bids for
projects with site control, bids which specify techs at least minimally deployed and bid prices that the developer can deliver on.
4. Would change sending unknowledgeable people to meet with utilities. Quite often we meet with people who clearly do not understand their own products and what they can deliver, let alone the utility industry and its needs. This gives solar developers less credibility.
5. Ability to reduce intermittency issues Other comments or questions you may have about any of the solar topics:
1. No response was provided to item 16 since PPA evaluation practices are considered confidential. 2. We intend to implement a program to encourage small scale, customer owned solar. However, we
currently do not have any plans to pursue any large scale solar projects. 3. Via pilot projects will have ~2MW of PV on our system by early 2009. Will have 5MW by 2012 and
8MW by end of 2014 (utility owned). Anything more is very dependent on equipment costs, efficiency improvements & ability to use ITC.

Appendix D: Traditional Procurement Study Solar Industry Questionnaire Respondent Tables and Comments 1. Please describe your company's main business55
Manufacturing (M)
Project Development (D)
Engineering, Procurement &
Construction (EPC) 7 6 8
Respondent Comments56:
1. A service company that provides alternative energy management solutions, electrical systems preventative maintenance and specialized electrical construction
2. Respondent manufactures solar modules with an advanced thin film semiconductor technology and provides comprehensive photovoltaic (PV) solutions that significantly reduce solar electricity costs. By enabling clean, renewable electricity at competitive prices, provides an economic and environmentally responsible alternative to peaking fossil-fuel electric generation.
3. Provide the solar energy gathering, storage and dispatch system for molten salt power tower CSP systems.
4. Manufacturer of solar modules. 5. Solar technology, product and manufacturing development. Project development, own &
operate. 6. Vertically integrated solar manufacturer and EPC contractor.
2. Will your company provide EPC services to a utility that wishes to own and operate its own solar facility? If not, why not?
No Yes ?
3 7 1
Of the seven “yes” responses, one was a developer and EPC entity (DEPC), two were EPC (EPC) entities, two were manufacturers, developers and EPC entities (MDEPC) and two were strictly manufacturers (M). Respondent Comments:
1. Respondent's model is to build, own and operate. Respondent will consider joint ventures where they are the EPC and operator.
2. Respondent currently provides engineering, procurement and construction services for utility projects in the United States.
3. Such services can be procured through Respondent, who has an exclusive license to market the design and equipment supply services in CSP systems using molten salt to utilities or other customers.
55 Note: Some company’s were assigned to more than one classification. Author assumes responsibility for classifications made. 56 Where necessary, comments were omitted because including them would identify the respondent.

110
4. Currently our product is targeted towards OEM applications and technology and device partnerships.
5. We are currently focused on selling PV module manufacturing lines, and would need to partner with our customers and EPC firms to provide a "turnkey" solar energy project for utility customers.
6. In situations where project has low/reasonable risks. 7. For the solar field component of the power plant by partnering with selected EPC
companies. 8. Delicate question. Cannot answer thoroughly. Although company is a project developer
to secure CSP projects, ultimate business objective of the group is to engineer and supply turn-key solar fields. We'll only offer a full solar field turn-key supply.
3. Please assess the relative value of the listed non-price solar attributes. (100 pt scale)
Avg >0 Cnt
Sdev CofV Rank Ord
Correlation between solar energy generation & peak hours of utility
26.1 10 19.9 76% 1 3
No emissions of criteria pollutants 16.8 9 15.8 94% 2 1 Elimination of future fuel price uncertainty 15.3 10 14.6 96% 3 6 Carbon offset value 7.7 6 10.7 139% 4 12 Hedge against carbon policy uncertainty 7.4 6 9.4 127% 5 15 Potential for locating close to load 7.1 7 8.4 118% 6 4 Dispatchability (CSP w/storage) 5.2 3 9.4 181% 7 14 Fuel diversification 3.9 6 6.0 153% 8 5 RECs 3.5 6 4.3 124% 9 11 Minimal water usage (PV) 2.5 3 5.8 234% 10 13 No Hg emissions 2.3 2 7.2 319% 11 2 Regional economic development (manufacturing & installation)1
2.1 1 7.2 346% 12 16
Ease of siting (20)1 1.7 1 5.8 346% 13 19 Local voltage support 1.2 3 2.9 247% 14 9 Minimal use of water CSP (10)1 0.8 1 2.9 346% 15 18 Delay of distribution investment 0.4 1 1.4 346% 16 8 Potential for improving grid stability (rotating mass) providing ancillary services1
0.3 1 1.2 346% 17 17
Delay of transmission investment 0.1 1 0.3 346% 18 7 Power factor correlation 0.0 0 0.0 19 10
1 Respondent additions.

111
4. In your experience, do the majority of utilities explicitly pay you for or have terms governing the following attributes in utility PPAs (yes/no)
Responding companies: 10 Yes % Rank
Energy 10 100% 1 Time of day energy 9 90% 2 Seasonal energy 8 80% 3 Has minimum amount of energy that must be delivered 8 80% 3 Has a performance penalty if minimum energy amount is not delivered 8 80% 3 All environmental attributes (RECs) 7 70% 6 Capacity 6 60% 7 Seasonal capacity 5 50% 8 O&M costs 5 50% 8 Have a limit on energy purchased, above which is excess energy 4 40% 10 Has a performance penalty if capacity amount is not delivered 4 40% 10 Power factor correlation 3 30% 12 Have the option to purchase excess, energy but at negotiated price 3 30% 12 Local voltage support 2 20% 14 Hedge benefits of solar projects (eg price stability) 2 20% 14 PPA separates payment for different environmental attributes 1 10% 16 Pay a reduced price for excess energy, but must purchase 1 10% 16 Deferral of distribution investment 0 0% 18 Deferral of transmission investment 0 0% 18 Others: (Respondent additions – none) 0 0% 18 Respondent Comments:
1. Do not currently sell manufacturing equipment directly to utilities, and we do not have prior contracts with utilities to answer the above questions
2. Dispatchable power that has a high degree of correlation with peak load (CSP w/storage) should be a very valuable offering b/c it enables utilities to defer deployment of capital for additional peaking resources and meet RE goals. Particularly true in the SW where load peak is growing at a much faster rate than the average load (and new peaking resources are required anyway). However, the mechanism for valuing the firm on-peak attribute as an on-peak resources is very opaque & seems overlooked by most state regulators.
3. Terms of contracts (PPAs) are confidential

112
5. For the US, assess the major impediments you perceive to the development of large scale solar facilities through utility RFPs or merchant development in unregulated states. (100 pt scale)
Cnt >0 Cnt Avg Sdev CofV
Total life cycle cost cannot compete with other resources
9 7 32.0 25.2 79%
Utilities undervalue non-cost solar attributes 9 6 16.8 15.2 90% Lack of knowledge of solar technologies by utilities
9 5 8.9 11.4 128%
Transmission interconnection cost uncertainty 9 4 8.3 11.7 141% Lack of adequate transmission capacity1 8 1 5.0 14.1 283% Transmission interconnection rules 9 5 4.4 4.6 105% Requires solar projects to accept more risk of energy delivery than other generation options
9 3 3.5 5.6 162%
Lack of solar resources in utility area 9 3 2.8 4.4 159% Contract price certainty1 9 1 2.8 8.3 300% Uncertain consequences of non-compliance with state RPS requirements1 (33)
9 1 2.5 7.4 300%
Uncertain federal policy (ITC limits new RFP's (33)1
9 1 2.5 7.4 300%
Uncertain state regulatory treatment of solar PV capacity investments (33)1
9 1 2.5 7.4 300%
Utility & state regulator mind-set of utilizing the power system to only serve internal utility/state needs and not considering developing a system to enable exports of resources from resource-rich areas w/i a state or utility system1 (20)
9 1 2.5 7.6 300%
RFP or regional transmission organization does not handle variability in solar generation well
9 2 2.0 4.0 200%
Preference to locating resources in service territory or state1 (10)
9 1 1.3 3.8 300%
Transmission line capacity or availability1 (10) 9 1 1.3 3.8 300% Requires solar projects to accept more risk of construction than other generation options
9 2 1.1 2.1 199%
Requires ability to provide full capacity during peak periods in any season
9 1 0.2 0.7 300%
Requires start/stop capability 9 1 0.2 0.7 300% Requires 24/7 potential for generation 9 1 0.1 0.3 300% 1 Respondent additions Respondent Comments:
1. Adequate long term policy is desperately needed in the form of laws (renewable portfolio standards) and financial incentives (grants, tax credits, asset depreciation, tax deductions, DOE research budget) -- Long term ITC is critical in still these early stages of getting critical mass for the concentrated solar power industry. For example, an analogy to the automobile and airline businesses is relevant to the additional capacity for transmission lines to get the solar electric power to market. Henry Ford and William Boeing were not required to build the roads or air traffic control/runways/airports that

113
enabled the growth of their respective industries as their capital needs were focused on building product. The government paid for this infrastructure. It required government support as well as regulations to enable these industries. The US government has funded the oil and coal industries, over the years, with billions of dollars and this continues today even though these are now very well established industries. The solar electric power industry must be afforded the same consideration for energy and national security as well as health and environmental reasons.
Utilities and regulators constantly focus on the "lowest cost of energy" when evaluating the best renewable projects with scant consideration for net cost of the resource being replaced by the renewable resource or the cost for make-up resources for other forms of renewables. The output of a solar thermal plant (even without storage) can be highly predicable which means fewer balancing resources are necessary to maintain system reliability for solar thermal than other renewables. These costs are rarely recognized in a transparent manner by utilities or regulators.
2. Key impediments are siting, permitting & transmission for development. Lack of solar technology knowledge by financial institutions
6. Please check any utility "surprises" that arose in PPA negotiations that were not described or apparent in the RFP and impacted your ability to develop the deal. (yes/no)
Total responses 8 Cnt Rank
Utility takes longer than indicated in RFP to process RFP responses 5 1 Utility takes longer than indicated in RFP to negotiate contract 5 1 Insisted upon price reduction 2 3 Required performance guarantees 2 3 Changed allocation of risk 1 5 Outside influences are delaying project go-forward decisions especially the lack of long term ITC in the US1
1 5
FERC qualified or Rule 21 qualified (type of qualification for 5MW solar facility) 1
1 5
Transmission upgrade unknowns1 1 5 Changed in-service date 0 9 Construction milestone penalties 0 9
1 Respondent additions 7. In your company's project development (bid planning, negotiations or actual construction) with utilities on solar projects, have you experienced any of the following difficulties? If so, please explain and indicate the approximate size of the project and interconnect voltage. (yes/no, size, voltage) Total responses 10
Yes
Actual interconnection costs differed significantly from original utility estimates. 3 Time to get interconnected with utility differed significantly from original utility estimates 5 Difficult to obtain transmission information for a project site or sites 2 The interconnection queuing process delayed interconnecting the project to the grid 5

114
significantly more than estimated Respondent Comments:
1. The existing transmission lines and substations upstream were not fully understood by the utility so we spent time while they analyzed their situation.
2. Note on interconnection queuing process: the recently drafted CAISO interconnection reform process may delay interconnecting future planned & new projects under development.
8. Have you ever submitted a bid to any of the following utility RFPs? (yes/no, etc.) Total responses 9
RFP Type Yes
All Source 0 Baseload 1 Intermediate 1 Peaking 0 Renewable Only 6 Solar Only 4 Shortlisted? 7 Awarded Project: Yes? 3 Awarded Project: Pending?
2
Reason for Rejection? Price, changing requirements 9. Who is the best contact for obtaining transmission information when both exist?
Yes
Utility 4 Regional Transmission Organization 3
10. For the majority of renewable or solar RFPs to which you have responded, are the following terms & conditions transparent and understandable in the RFP?
Number Responding 6 Yes No Rank
Length of contract 6 0 1 The ownership of environment attributes (RECs) 5 0 2 Conditions precedent terms 4 2 3 Default terms 4 2 3 Length of RFP evaluation period 4 2 3 Performance penalty terms 4 2 3 Performance requirements 4 2 3 Pricing terms 4 2 3

115
Length of PPA negotiation period 3 3 9 Collateral/security deposits1 1 5 10 Transmission paths that have capability for project1 1 5 10
1 Respondent additions 10 a. Elaborate on the two most important terms to a solar developer that are missing or easily misunderstood in a renewable or solar only RFP? (4 respondents)
1. Transmission requirements are critical for proper pricing on the front end. Sometimes luck is with the project, but not always - and large transmission upgrades can significantly change PPA structure.
2. The value of distributed central PV systems, including their ability to eliminate transmission and intermission issues with multi-site solutions is misunderstood. 2. Analysis of available alternative renewable energy costs are missing and price targets are compared to conventional electricity prices.
3. Interconnection and transmission requirements, 2. Time of use pricing 4. Price adjustment mechanism for significant and unavoidable changes in project
economics; and ability to adjust prices annually for inflation in operation costs (some RFPs)
11. For the majority of all large-scale resource RFPs to which you have responded or reviewed, are the following terms and conditions transparent and understandable in the RFP? Number of Companies Answering Question 2
Yes No
Length of contract 2 0 Conditions precedent terms 1 1 Default terms 1 1 Length of PPA negotiation period 1 1 Length of RFP evaluation period 1 1 Performance penalty terms 1 1 Performance requirements 1 1 Pricing terms 1 1 The ownership of environment attributes (RECs) 1 0 Daily energy delivery requirements 0 0 Operational characteristics (load following) 0 2 Transmission paths that have capability for project
0 2
11a. Elaborate on the two most important terms to a solar developer that are missing or easily misunderstood in an all source RFP? 2 responses
1. Need to be more widely publicized. 2. Transmission and interconnection requirements, and time of use pricing.
12. If your company could change two utility practices in its RFP or PPA processes to improve the solar industry's share of future electric generation expansion, what would

116
they be and why? Change 1 Five companies responded
1. Utilities are selecting low cost bids only and not low cost/best fit, thus there is a high contract failure rate.
2. Base price requirements for PV on its value versus other available renewables (as opposed to the cost of traditional generation).
3. Penalize utilities for failing to obtain fixed % from solar (adopt similar approach as NJ). 4. Stronger consideration given to opportunities to partially-repower existing fossil-fueled
capacity with CSP. 5. Provide land.
Change 2 Four companies responded
1. Utilities time-of-use (TOU) periods do not properly value the peaking value of solar. 2. Increase the standards for projects applications (strengthen requirements for quality of
project, bidders and site viability, and reject the ability to renegotiate prices in the future - This would eliminate non-serious bidders from the process and limit congestion of the approval queue).
3. Time of use pricing. 4. Support interconnection.
13. In the next 5 years, will you respond to RFPs for large-scale solar generation within the US, but outside of the southwestern US?
Nine of twelve companies responded.
1. No. Solar value is too low. 2. Yes, San Francisco 3. Yes. 4. Yes 5. Likely we will be involved directly or indirectly 6. Yes 7. Yes, if it make business sense. 8. Depends 9. Yes
14. What contractual risk does your company believe utilities should rightly bear that utilities most often attempt to place on your company?
Eight of twelve companies answered.
1. Plan for material price escalation beyond a negotiated point. 2. Performance: Solar is not a firm resource and adding performance requirements to the
PPA results in risk that needs to be priced into the PPA - which limits market opportunities.

117
3. Cost of transmission, solar helps their grid with the peak loads, so they should have some stake in the cost of expanding their grid.
4. On average, experience has proven risks to be fairly balanced. 5. Change in tax law – ITC. 6. Consequential damages for first-of-a-kind large-scale CSP systems. 7. Curtailment due to congestion. 8. Delays caused by interconnection process.
15. Are these risks identified in the RFP or are they usually discovered in PPA negotiations?
Eight of twelve companies answered.
1. Identified. 2. Discovered in PPA negotiations. 3. Discovered. 4. Neither. 5. PPA negotiations. 6. Usually identified up front. 7. During PPA or transmission interconnect agreement. 8. Discovered in negotiations.
16. How does your company handle the risk that a bid price cannot be met after the time it takes a utility to process a response to its RFP and negotiate a contract?
Seven of twelve companies answered.
1. Respondent will seek to renegotiate the price while taking on some of the price risk. 2. Since they have a long standing history in large scale commercial and industrial
construction, they use a methodology of hedging commodity pricing and other estimating methods proprietary to our firm.
3. On average, RFP evaluation and contract negotiations are completed in 24 weeks, which does not pose manageable risks.
4. Make sure bid has reasonable outs including expiration parameters. 5. Some form of escalation based on material pricing if possible. 6. We put in "off-ramps" that allow us to walk away if we can't agree to satisfactory terms
but risk some development deposit funds. 7. Qualifies the bid.