Embed Size (px)
Citation preview
UTILITY LOAD MANAGER
AMEU Convention
Dr Vic Lawrence
27 October 2010

BACKGROUND
• In 2001 Eskom planned for our current and future supply and
demand needs – Government was informed.
• In 2005 Eskom fast tracked the build program, when the IPP
strategy failed.
• In 2007 load shedding inevitable due to supply and demand
constraints.
• Supply and demand constraints will persist with current
network constraints

BACKGROUND
• Eskom reduced loads within their control – Mining and
Industry load reduction by 10%.
– Loads within Eskom’s control:
• Large Power Users (LPUs).
• 120, 000 residential customers (LSM 5 to 10).
• 3.5 million Prepaid customers.
• Residential load shedding was introduced through
municipalities.
• Eskom accelerated DSM, the National DSM programs.
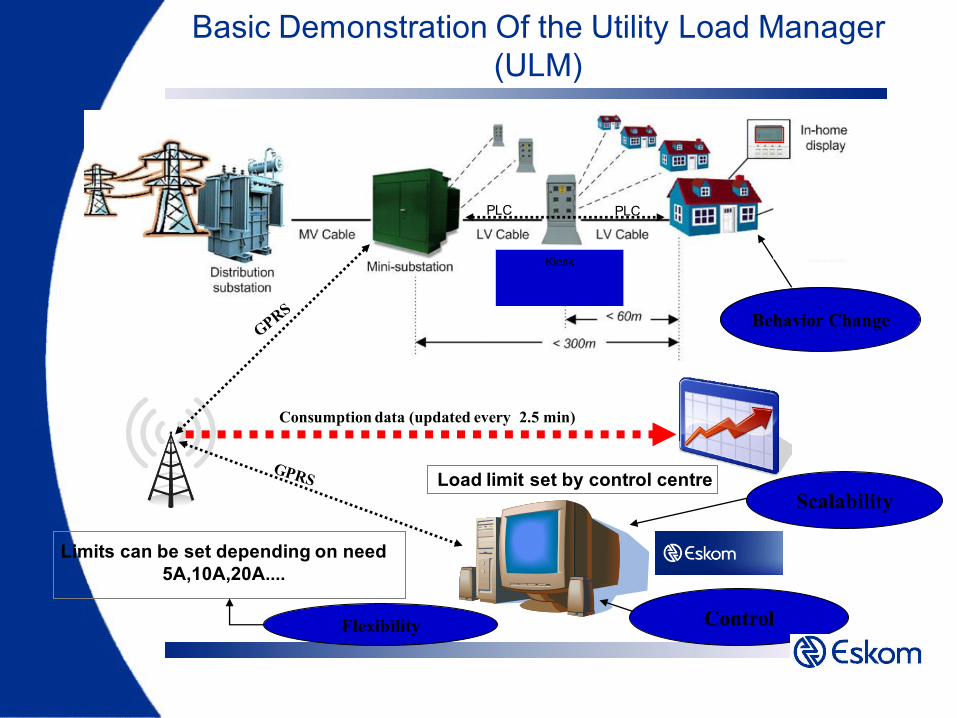
Basic Demonstration Of the Utility Load Manager
(ULM)
Consumption data (updated every 2.5 min)
PLC PLC
Kiosk
Limits can be set depending on need
5A,10A,20A....
Load limit set by control centre
Behavior Change
ControlFlexibility
Scalability

Limiting Threshold
5A = 1100W
Application Watts
Refrigerator with freezer 550
Computer 120
Lighting: energy saving lamp [X5 CFL’s] 55
M-net decoder 28
Television 70 cm colour 100
Video recorder 35
DVD Player 14
Home security and electric fence 100
Total Usage 1002
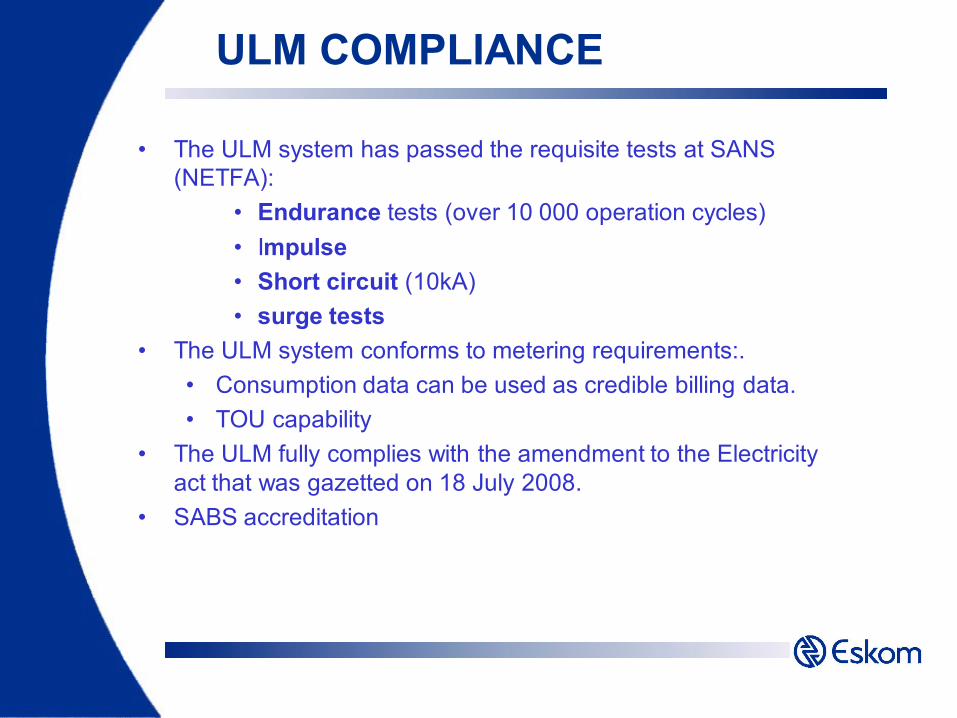
ULM COMPLIANCE
• The ULM system has passed the requisite tests at SANS
(NETFA):
• Endurance tests (over 10 000 operation cycles)
• Impulse
• Short circuit (10kA)
• surge tests
• The ULM system conforms to metering requirements:.
• Consumption data can be used as credible billing data.
• TOU capability
• The ULM fully complies with the amendment to the Electricity
act that was gazetted on 18 July 2008.
• SABS accreditation

Product Manufacture

Product test and assembly

Product Development and Testing

Installation of ULM

Final Field Installation
Original installation ULM installed

Final Field Installation

Final Field Installation

Final Field Installation

The graph provides a view of the load limiting console during a load limiting period. The information on
this console is updated every 2½ minutes. The console display includes the scheduled limits as well as a
graphical representation historically of the power that has been saved.
1
6
0
50
100
150
200
250
300
350
1 2 3 4 5 6 7 8 9 10 11 12 13 14 15 16 17 18 19 20 21 22 23 24 25 26 27 28 29 30 31 32 33 34 35 36 37 38 39 40 41 42 43 44 45 46 47 48
Actual
Base_Line
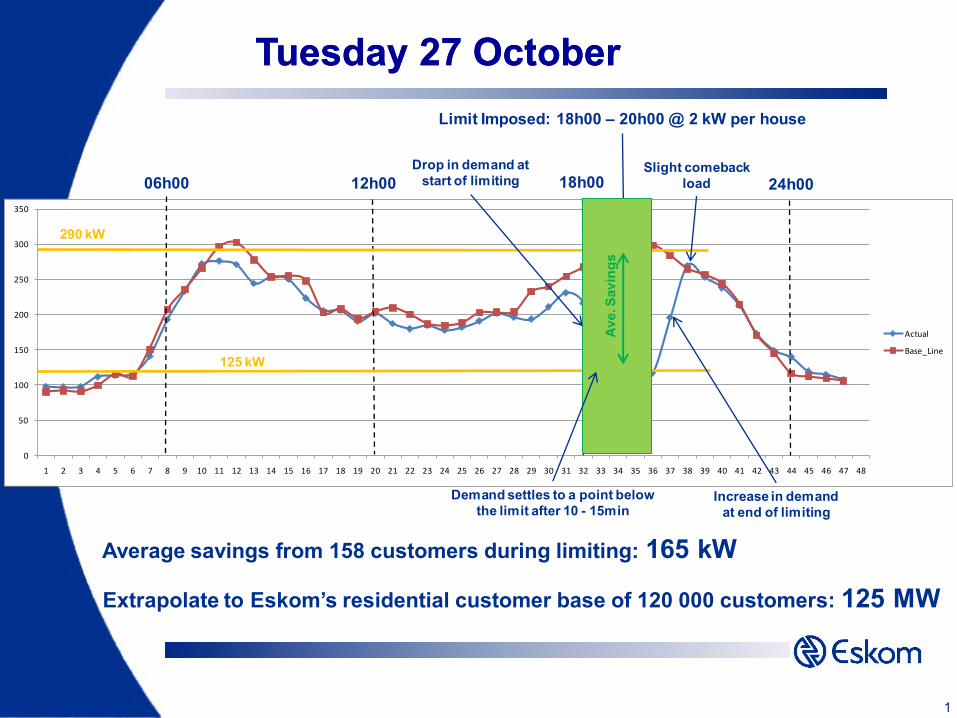
Tuesday 27 OctoberTuesday 27 October
18h0006h00 12h00 24h00
290 kW
Limit Imposed: 18h00 – 20h00 @ 2 kW per house
125 kW
Average savings from 158 customers during limiting: 165 kW
Extrapolate to Eskom’s residential customer base of 120 000 customers: 125 MWA
ve. S
av
ing
s
Demand settles to a point below
the limit after 10 - 15min
Drop in demand at
start of limitingSlight comeback
load
Increase in demand
at end of limiting

17
Thursday 28 OctoberThursday 28 October
0
50
100
150
200
250
300
350
1 2 3 4 5 6 7 8 9 10 11 12 13 14 15 16 17 18 19 20 21 22 23 24 25 26 27 28 29 30 31 32 33 34 35 36 37 38 39 40 41 42 43 44 45 46 47 48
Actual
Base_Line
18h0006h00 12h00 24h00
280 kW
Limit Imposed: 18h00 – 20h00 @ 3 kW per house step to 1.1 kW per house
115 kW
Average savings during limiting – Step 1: 165 kW (148 customers)
Extrapolate to Eskom customer base of 120 000 customers: 134 MW
Savin
gs 1
85 kW
250 kW
Savin
gs 2
Average savings during limiting – Step 2: 165 kW (148 Customers)
Extrapolate to Eskom customer base of 120 000 customers: 134 MW

18
Friday 28 OctoberFriday 28 October
0
50
100
150
200
250
300
350
1 2 3 4 5 6 7 8 9 10 11 12 13 14 15 16 17 18 19 20 21 22 23 24 25 26 27 28 29 30 31 32 33 34 35 36 37 38 39 40 41 42 43 44 45 46 47 48
Actual
Base_Line
06h00
200 kW
Limit Imposed: 10h00 – 13h00 @ 2 kW per house
65 kW
Average savings during limiting: 135 kW (139 Customers)
Extrapolate to Eskom customer base of 120 000 customers: 116 MW
Savin
gs
12h00 18h00 24h00

IMPACT AND BENEFIT
• No black-outs or load shedding
• Restore Customer confidence
• Revenue management and protection
• Direct control over local network and systems
• Buffer for Generation new Build
• 20 MW power reduction just from pilot
• 6750 MW available with National implementation (1.5 Power stations)
• Buffer for system Ops reserve margin 3-5 % - 18-20%
• Planned outages
• Less unplanned outages
IMPACT AND BENEFITIMPACT AND BENEFIT
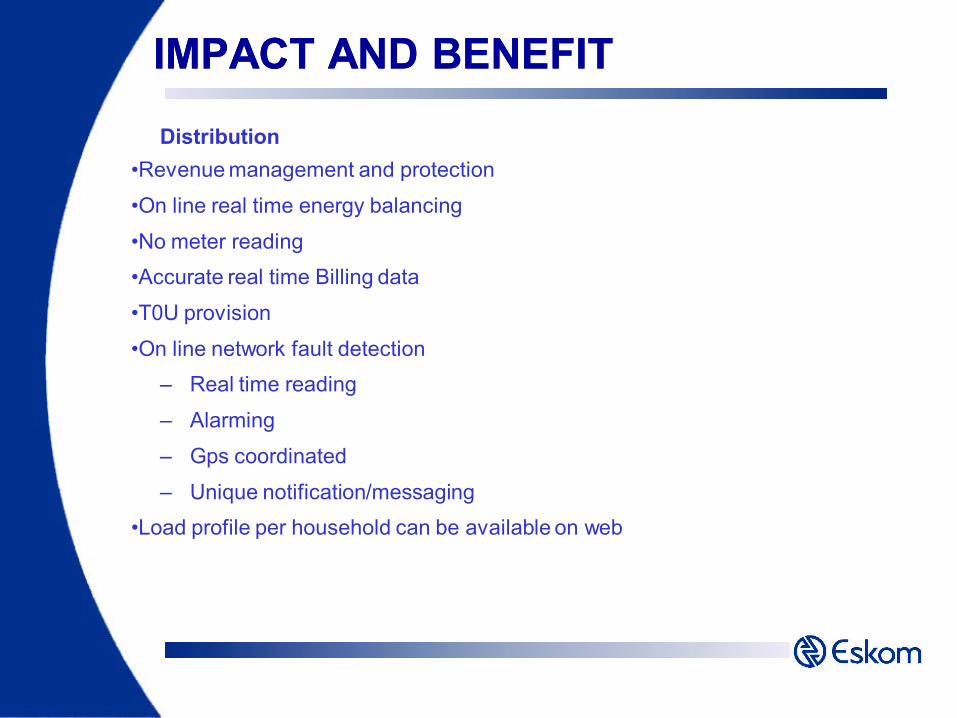
Distribution
•Revenue management and protection
•On line real time energy balancing
•No meter reading
•Accurate real time Billing data
•T0U provision
•On line network fault detection
– Real time reading
– Alarming
– Gps coordinated
– Unique notification/messaging
•Load profile per household can be available on web

Thank you
?


![AMEU newsletter - Oct 2019 · 2020. 8. 5. · AMEU NEWS November 2019 [2] The July 2019 meetings of the AMEU and SARPA KZN Branches took place on the 11th and 12th at the Riverside](https://img.dokumen.tips/doc/110x75/602ffb5c1edcf402f85adebf/ameu-newsletter-oct-2019-2020-8-5-ameu-news-november-2019-2-the-july-2019.jpg)