Embed Size (px)
Citation preview

SUBCOURSE EDITION EN0389 9
UTILITIES II

ARMY CORRESPONDENCE COURSE • ENGINEER SUBCOURSE 389-9
UTILITIES II
United States Army Engineer School • EDITION 9 (NID 906)

INTRODUCTION The material in this subcourse
broadly covers the principles involved, and the methods and equipment employed, in the design, construction, and operation of electric power and distribution systems, water supply distribution systems, and sewage collection and treatment systems. Large semipermanent installations in a theater of operations such as depots, base hospitals, replacement depots, and the like require fairly extensive, complex utilities systems. The design, construction, rehabilitation (where necessary) and operation of these systems are responsibilities of engineer units. While this course will not make you an expert, it will furnish sufficient basic information to enable you to function as an engineer staff officer or commander in the communications zone of a theater of operations. This subcourse
consists of four lessons and an examination as follows: Lesson 1. Electric Power Systems. 2. Electrical Distribution
Systems. 3. Water Distribution Systems. 4. Sewage Collection and
Disposal. Examination. Eight credit hours are allowed for
the subcourse. You will not be limited as to the
number of hours you may spend in the solution of this subcourse, any lesson, or the examination. Materials furnished: Figures 14, 16,
and 18, lesson 4.
* * * IMPORTANT NOTICE * * *
THE PASSING SCORE FOR ALL ACCP MATERIAL IS NOW 70%.
PLEASE DISREGARD ALL REFERENCES TO THE 75% REQUIREMENT.

LESSON 1
ELECTRIC POWER SYSTEMS
TEXT ASSIGNMENT --------------------Attached memorandum. MATERIALS REQUIRED -----------------None. LESSON OBJECTIVE -------------------To teach you the characteristics
and functions of electric power systems.
ATTACHED MEMORANDUM 1. INTRODUCTION A reasonably reliable and adequate
source of electric power is always necessary for the operation of military installations. The required standards of electric power systems generally increase proportionately from the combat areas to the larger, more permanent installations in the rear. Maximum use should be made of existing generating equipment and materials in order to save time and manpower. Where no existing power is available, portable military generators capable of producing from 150 watts to 300 kilowatts are used in such combinations that there will always be an adequate supply of power when any one of them fails. 2. DIRECT CURRENT (DC) SYSTEMS A direct current is a current which,
under the condition of a constant load, has a constant magnitude and flows in the same direction at all times (fig 1). Use of DC current for distribution systems is not widespread.
3. ALTERNATING CURRENT (AC) SYSTEMS Current in alternating current
systems first flows in one direction around the loop, then reverses and flows in the other direction at regular recurring intervals. Most power systems are of the alternating current type. To understand how this type of current is produced, a simple two-pole generator will be described. Basically, this generator consists of a north and south magnetic pole and a loop of wire fixed so it can rotate between the poles (fig 2).
a. Current induction. As the loop rotates between the poles a current is induced which flows in one direction when the first 180 degrees are being turned and in the opposite direction when the next 180 degrees are being turned. The induction of current occurs when the loop cuts the magnetic lines of force flowing from the north to the south pole. When the loop reaches the 90-degree point, the maximum number of lines are being cut and the induced current is at a maximum. When
1-1

Figure 1. Direct current.
Figure 2. Simple two-pole AC
generator. the loop reaches the 180-degree point, it is no longer cutting any lines and the current is zero. One complete revolution of the loop constitutes one cycle because the current has gone from zero to maximum value twice as shown in figure 2. b. Frequency. The number of cycles per second is expressed as frequency. The most common frequency in use in the United States is 60 cycles per second. A simple two-pole generator would have
to rotate at 3,600 revolutions per minute to produce a frequency of 60 cycles per second. A more common type of generator in use today is the multipole generator which produces alternating current at a much slower rpm. Figure 3 shows a
Figure 3. Schematic diagram of four-
pole AC generator.
1-2
four-pole generator where one mechanical revolution of the loop constitutes two cycles. To produce 60-cycle current, this generator rotates at 1800 rpm, half as fast as the two-pole type. 4. CONSTANT POTENTIAL SYSTEMS The most common type of system for
electrical distribution is the constant potential type where the voltage is kept as constant as possible and the current varies with variations in loads. This system is further subdivided into direct and alternating current of which (as previously stated) the direct current type is seldom used and will, therefore, not be discussed. The common alternating current distribution systems employ another variation of the current characteristics, known as three-phase current. Previously described were the two-pole and multipole generators which produced alternating current.
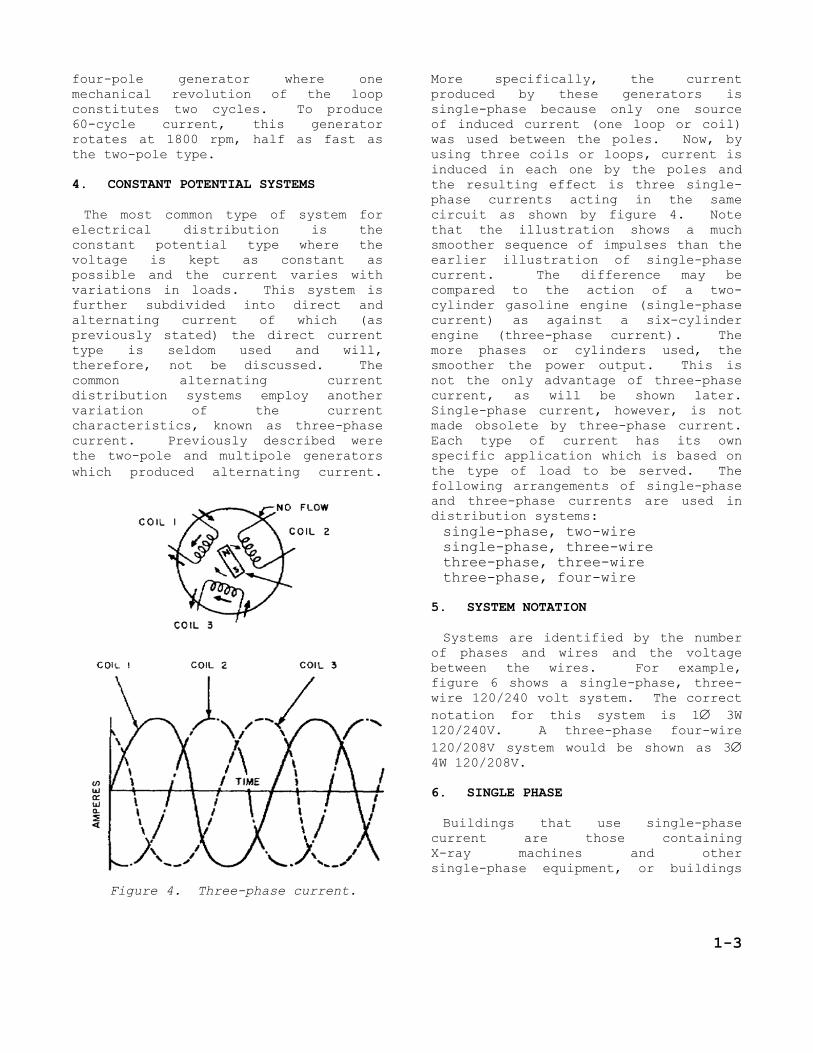
Figure 4. Three-phase current.
More specifically, the current produced by these generators is single-phase because only one source of induced current (one loop or coil) was used between the poles. Now, by using three coils or loops, current is induced in each one by the poles and the resulting effect is three single-phase currents acting in the same circuit as shown by figure 4. Note that the illustration shows a much smoother sequence of impulses than the earlier illustration of single-phase current. The difference may be compared to the action of a two-cylinder gasoline engine (single-phase current) as against a six-cylinder engine (three-phase current). The more phases or cylinders used, the smoother the power output. This is not the only advantage of three-phase current, as will be shown later. Single-phase current, however, is not made obsolete by three-phase current. Each type of current has its own specific application which is based on the type of load to be served. The following arrangements of single-phase and three-phase currents are used in distribution systems: single-phase, two-wire single-phase, three-wire three-phase, three-wire three-phase, four-wire
5. SYSTEM NOTATION Systems are identified by the number
of phases and wires and the voltage between the wires. For example, figure 6 shows a single-phase, three-wire 120/240 volt system. The correct notation for this system is 1∅ 3W 120/240V. A three-phase four-wire 120/208V system would be shown as 3∅ 4W 120/208V. 6. SINGLE PHASE Buildings that use single-phase
current are those containing X-ray machines and other single-phase equipment, or buildings
1-3

Figure 5. 1∅2W 120V system.
Figure 6. 1∅3W 120/240V system.
Figure 7. 3∅3W 120V system ∆-connection.
1-4

having only lighting loads. For lighting purposes, two-wire service is adequate but for heavier loads, three-wire service must be used. a. Two-wire systems (1∅ 2W). In the single-phase two-wire system (fig 5), one of the two wires from the generator is connected to the ground and is called the ground wire or the neutral. The other wire is called the hot wire. Normally, the voltage difference between these wires is 120 volts. Sometimes locally available 1∅ 2W generators will be designed for a different voltage. In such a case transformers can be used to step down the voltage to 120 volts. In this system the current in one wire is equal to the current in the other wire. Typical 1∅ 2W 120V loads are lights and most equipment requiring low power. b. Three-wire systems (1∅ 3W). In this system, there are two voltages available which provide the advantage of simultaneously obtaining a high voltage for heavy loads and a lower voltage for lighter loads. Figure 6 illustrates the three-wire single- phase system. Voltage between the hot wires is twice the voltage between the neutral and either hot wire. The current (normally measured in amps) in the neutral wire is equal to the difference between the currents in the hot wires, and current flows in the neutral in the same direction as the current in the hot wire carrying the smaller current. When the total watts of load connected between the neutral and one hot wire is equal to the watts of load connected between the neutral and the other hot wire, the loads are balanced. Under this condition, the currents in the hot wires are equal and none flows in the neutral. This condition is desirable in electric power systems. This system is called a single-phase system because there is no phase difference between any of the available voltages.
7.THREE PHASE As stated before, three-phase current
is, in effect, three single-phase currents interlocked in the same circuit. This system usually consists of four wires, although three wires are sometimes used. Each wire represents one phase. As the three-phase current is produced in the generator, one of two methods is used to connect each coil or phase for distribution to the various loads: The Y (Wye) or star connection The ∆ or delta connection
Normally the delta connection employs three wires and the wye, four.
a. Three-wire systems (3∅ 3W). Figure 7 shows a three-phase, three-wire system using a delta connection. All three wires are considered hot wires. Any 1∅ 2W 120 volt load may be connected between any two hot wires. A 3∅ 3W 120 volt load can be connected to all three-phase wires. It should be noticed that in a 3∅ 3W system only one magnitude of voltage (120 volts for the generator in figure 7) is available. Therefore only loads requiring that voltage can be fed directly by a 3∅ 3W generator. b. Four-wire systems (3∅ 4W). Figure 8 shows a three-phase four-wire system using a Y connection. There are two voltages simultaneously available from this system; phase-to-neutral voltage and phase-to-phase voltage. Note that the phase-to-phase voltage is equal to 1.73 times the phase-to-neutral voltage. As in the single-phase system, the loads between the neutral and the phase wires should be balanced to reduce the current in the neutral to a minimum. Any 1∅ 2W 120 volt load can be fed power by connecting it between any hot wire and the neutral. Any 1∅ 2W 208 volt load can be fed between any two hot wires. Any 3∅ 3W 208
1-5

volt load can be fed by connecting it to the three hot wires. And finally, any 3∅ 4W 120/208 volt load can be fed power by connecting it to all four wires. 8. COMPARISON OF SYSTEMS Three-phase four-wire systems require less wire by weight to transmit a specified load over a given distance (within the limits set for phase voltage, permissible line drop, and wattage lost) than do other types of systems. Using the single-phase two-wire system as a basis for comparison (representing 100 percent) a single-phase three-wire system requires only 37.5 percent as much wire by weight; the three-phase three-wire delta system, 75 percent; and the three-phase four-wire wye system, 33.3 percent.
9. GENERATORS So far, the layout and some of the
basic fundamentals of electric power and distribution systems have been discussed. To operate these systems properly and efficiently, an adequate amount of power must always be produced. The practical source of power for the military is the generator which converts mechanical energy into electrical energy. Hydroelectric and steam-turbine plants for developing large amounts of power are used in commercial power systems. The military engineer will only have to perform minor repairs for plants of this type if they happen to fall into friendly hands in a Theater of Operations. If possible, trained civilian personnel should be employed in the repair and operation of such plants. Supervisors
Figure 8. 3∅4W 120/208V system Y-connection.
1-6

and guards will be provided as circumstances require, depending on the danger of sabotage. If this is not possible, the operation must be assigned to the technically best-qualified personnel available from friendly forces. a. DC generators. The DC generator is comparatively simple in construction, operation, and maintenance, requiring little auxiliary equipment. Generator speed is not critical, it supplies its own field current, and voltage regulation can be designed into the machine. A basic disadvantage of DC power is the limited distance it can be transmitted. Since DC power is used at the voltage at which it is generated and utilization voltages are usually 120 or 240 volts, large currents are required to produce even moderate amounts of power. For this reason, direct current generators are used only for special purposes such as battery charging, communications, and searchlights, and will not be considered further in this course. b. AC generators. For military installations in the theater of operations (TO), portable generators will be used for the production of power. The military generators available are driven by either a gasoline or a diesel engine. Normally, gasoline engines drive those generators of 10 kilowatt (KW) capacity and under; diesel or gasoline engines drive those over 10 KW capacity. For electrical distribution, 60-cycle generators will be used. Those producing 400 cycles are used for radar equipment. The important characteristics of a generator are its kilowatt (KW) rating, the voltage and frequency at which it generates, and whether it is a single- or three-phase generator. The KW rating determines the horsepower of the prime mover. Frequency depends on speed of rotation and the number of poles of the generator. Voltage also depends on speed, but is varied within limits by
changing the strength of the magnetic field. The generator nameplate gives the characteristics of the machine. 10. GENERATOR SELECTION The primary objectives of generator
selection are to determine the size, number, and type of generators to be used in the distribution system. The type of generator to be used is determined by the type of service that must be supplied. If any facility within the installation requires a 3-phase 4-wire load, a 3∅ 4W generator must be used since no other generator will supply this type of power. Thus, even though only one building may require this service, a 3∅ 4W generator is needed. As explained previously, this generator may serve other loadings in the system, such as 1∅ 2W loads. If only 1∅ 2W and 1∅ 3W loads are present in the installation, a 1∅ 2W generator with a transformer will suffice. However, in TO construction, it is common practice to use a 3∅ 4W generator to feed 1∅ 3W loads. In such a case, efficiency of the load is sacrificed when possible to avoid the use of costly transformers. However, if the 1∅ 3W load is critical, that is, it requires precisely 1∅ 3W power for proper motor torque and/or speed, a transformer will be required. The capacity of generator required depends upon the size of loads to be serviced. Generator capacity should not be confused with generator size since the required capacity may be supplied by more than one generator of a given size.
a. Load estimation. In order to estimate the load, a map of the area to be served should be obtained. On it, the various structures which will be connected to the distribution system should be marked. All buildings should be identified (shops, PX, barracks). Next, the connected load must be determined for each structure served. Connected load for a given structure is the sum of the wattages of all lights
1-7

Table 1. Connected Loads for Military Structures
1-8

and electric devices and horsepower of all motors. The load is usually expressed in KVA (kilo-volt-amperes). For purposes of estimation, 1000 watts of lighting load or 1 horsepower of motor or power load equal 1 KVA. A second method of estimating the connected load is by use of a standard load expressed in watts per square foot for a particular type of building. Such standard loads may be found in appropriate TM's. Multiplying the floor area of a given type of building by its standard load will give the connected load for the building. Finally, the connected load may be determined by summing the power requirements of connected lights, appliances, or motors in a given building (analogous to counting outlets and showers in water supply). This may be done either from drawings of the individual buildings or from visual inspection of the apparatus in the buildings to be serviced. In all of these estimations, the connected load should be determined per building. To expedite the estimating of connected loads to the various types of buildings considered in this course, table 1 will be used for obtaining the lighting and power loads to each building. This table also gives the type of power required, single phase or three phase, and the wiring. The values given are in KVA. (1) Demand load. The demand load is the actual maximum demand in KVA
required to serve a given connected load. The demand factor is the ratio between the estimated maximum demand and the connected load for various types of structures. Naturally the demand load may never be greater than the total connected load, and is usually less because different pieces of apparatus are used at different times or because the peak loads of these various pieces do not occur simultaneously. An exception occurs when all of the using pieces are of the same type and used at the same time to full capacity, as in street lighting circuits and yard lighting. The demand factor for this exception is 1.00. However, a machine shop whose maximum demand may have been measured to be 31.4 KW could have a total connected load of: Thirty 60-watt lamps-------------1.8 KW Twenty 100-watt lamps------------2.0 KW Motors, connected, 30 hp--------30.0 KW Heaters--------------------------9.0 KW Welding equipment---------------20.0 KW Total connected load---------62.8 KW
Table 2. Demand Factors for Military Installations
1-9

To determine the demand load for a particular building the following equation is used: Demand load = connected load x demand
factor
In design problems the demand factor will have to be selected on the basis of the type of structures to be served. For this course, table 2 will be used to obtain demand factors. (2) Generator factor. As explained above, each facility within the installation will have its own maximum demand. In addition, the installation as a whole will have a maximum demand. It is improbable that all buildings in an installation would require their demand loads at the same time. Thus the demand load for the installation is usually less than the sum of individual facility demand loads. The ratio of the maximum demand of the whole group to the sum of the individual maximum demands is called the generator factor. The generator factor is usually expressed as a function of the total amounts of light and motor loads within the entire installation. If the total demand load within an installation is comprised solely of light loads, it may be said that a good possibility exists that all the individual demand loads may be required at the same time. In such an installation, for example, the early evening hours would be a period where all facilities might be in operation, such as messhall, barracks, theater. Thus, all lights might be required at the same time. Conversely, it is safe to assume that not all the motor loads, in an installation containing only such loads, would be required at precisely the same moment. Most motors are operated intermittently, so it is improbable that all would be in operation at the same time. Many intermediate cases, of course, exist where the power using facilities consist of some combination of lights and motors. Thus a full range of nerator factors exists for the range
of combinations of lights and motors. The required generator capacity may be found by the following equation:
ge
Generator capacity (KW) = generator factor x sum of individual demands in KVA Where: KVA = kilo-volt-amperes or 1,000 volt-amperes. Table 3 gives generator factors for use in this course.
Table 3. Generator Factors
b. Capacity. One factor to be considered in determining generator requirements is that there are always several possible generator combinations which will supply the required generator capacity, but some of these selections are inefficient. It is possible to select one large generator to supply the total required capacity. However, this selection becomes inefficient during periods such as the early morning hours, when the required power will be reduced considerably. Since the generator will run at a constant output, much more power would be supplied than is actually required. Another factor to be considered is that enough excess generator capacity should be provided (usually by a standby generator) to supply maximum demand when the largest generator is out of service because of maintenance or repair. In isolated areas where generators are placed at a single location, the standby generator is permanently connected to the
1-10

system. In areas with several generator locations, a standby generator is provided for each three or four generator locations. This generator is moved to the proper location when one generator is taken out of service. For interchangeability and to reduce the stock of repair parts, the same size generators should be used throughout the system. (1) Three of equal size. Three generators of equal size, each with a capacity just greater than two-thirds of the maximum demand of the load, may be used. This combination of generators provides slightly more than 100 percent more generating capacity than the load and allows for one machine to be out of operation without affecting service during the peakload periods. This combination is reasonably flexible and quite efficient. It allows for an increase in load of 33-1/3 percent without preventing the performance of major maintenance and repair work on one of the machines during the peakload periods. During light-load periods, the machines operate at approximately half-load, which lowers the efficiency somewhat. Overall efficiency of the plant is lower than for the combination described in (2) below and greater than that described in (3). This combination is preferred for loads expected to grow slowly in maximum demand. (2) Three of varying size. Three generators can be used, with one just larger than the maximum demand and the others about 60 and 40 percent of the size of the largest machine, respectively. This combination of generators provides 100 percent more generating capacity than the load and allows any one machine to be out of operation without affecting peakload performance. This combination allows efficient operation, since only one generator is required at a time and the proper generator can be chosen to meet the varying loads. Normally, each unit runs for approximately equal
periods each day. Extreme caution must be used if the 60 percent and 40 percent generators are used at the same time to meet a maximum (100 percent) demand. It requires highly skilled personnel to match the mechanical and electrical characteristics of two or more generators of different sizes applying a single load. This combination usually serves best to meet varied demands at different times of the day with only one of the generators supplying the demand at any one time. (3) Two of equal size. Two generators of equal size, each with a capacity just greater than the maximum demand of the load, may be used. This combination of generators provides 100 percent more generator capacity than the load and allows for one machine to be out of operation without affecting the service during peakload periods. This combination is rather inflexible and inefficient. Since the peakload occurs during a small portion of the day, the machines must operate at halfload or less most of the time. This combination may be advantageous when space is allotted for a third unit, providing a large increase of e load is expected to occur later. th
11. GENERATORS AVAILABLE Table 4 shows the family of
generators available for theater of operations installations. The 15 KW is perhaps the most widely used because of its versatility and its capability of transportation by a 2-1/2 ton truck.
12. GENERATOR FIELD PROBLEMS The following are examples of the
types of problems involving the use of generators which may be encountered in the field.
a. Example 1. The commanding officer of a unit has requested that his tent be equipped with an electric light. Your task
1-11

Table 4. Family of Engine-Generators
1-12

is to issue a directive for the installation of a generator which will economically provide the necessary power. Which of the generators of table 4 would you select and what sort of lighting would you recommend be used?
Solution: For such a small lighting load as this, the smallest generator available should be used, namely, the 0.15 KW, 60-cycle, 120-volt size. Its capacity is 150 watts which should satisfy the commander's needs by providing power for either of the following lighting arrangements:
(1) One 150 watt bulb. (2) Two 75 watt bulbs. In hooking up these lights, however, it should be emphasized that a series circuit will not do because then the lights would not develop their rated wattage and so would burn dimly. A parallel circuit must be used in setting up the lights. This provides a constant 120 volts across each lamp. b. Example 2. You are to provide power for a company operating away from your battalion. The demand load has been estimated as follows: Load 1 Quarters lighting 1 ∅ 4.0KW 120V 2 Dayroom 1 ∅ 0.6KW 120V 3 Messhall and kitchen 1 ∅ 4.0KW 120V 4 Orderly room 1 ∅ 0.4KW 120V 5 Supply room 1 ∅ 0.5KW 120V 6 Shop (power) 3 ∅ 4.0KW 208V 7 Shop (lighting) 1 ∅ 1.0KW 120V Total 14.5KW
What size generator or combination of generators would you use and how would you distribute the loads? (Neglect generator factor.)
Solution: To insure continuity of service and to permit repair of units, one of the following combinations should be selected:
(1) 3-10KW 3∅ 120/208V (2) 1-15KW 3∅ 120/208V 1-10KW 3∅ 120/208V 1-5KW 3∅ 120-208V (3) 2-15KW 3∅ 120-208V Combination (2) would be difficult to operate if the full load had to be supplied when the 15KW generator was down for repairs (par 10b(2)) while combination (3) would be rather inefficient (par 10b(3)). Combination (1) would probably be the best choice. 13. GENERATOR LOCATION It is common practice to locate
generators near points of large demand (laundries, bakeries, maintenance shops, etc.) in order to reduce the size and amount of wire required. Generator location may be selected by studying the map on which demands are plotted. In general, small demands, such as barracks may be served by generators at distances up to 1,500 feet in wire length and moderate demands, up to 1,000 feet. If tentative generator locations already selected are too far apart, they may be shifted. The final location should be near a road and on firm ground. A concrete foundation should be provided for semipermanent generator installations where size is 30KW or larger. As a safety measure, the generator site should not be placed near storage areas of flammable products such
1-13

as petroleum and paint. The high noise level of generators may be another factor in their location. 14. SUBSTATIONS The use of substations is required
when high-voltage systems are employed. The purpose of the substation is to change the alternating current received from the generating plant to the voltage, frequency, and type of current required by the distribution system. There are three main types of substations.
a. Transformer substation. In a transformer substation, the high voltage from the generating plant is stepped down to a lower voltage which can be used by the distribution system. There is no change in frequency and the current of the lower voltage is still alternating current. This is the most common type of substation and is usually what is meant when speaking of a substation. b. Frequency-changer substation. In the frequency-changer substation,
the frequency is changed, usually from 25 to 60 cycles or vice versa. c. Converter substation. In the converter substation, current is changed from alternating to direct current. 15. TRANSFORMERS A transformer is the apparatus used
to make changes in voltage, either up or down. The voltages required for long distance transmission are greater than those that can be generated and a transformer is used to step up the voltage. The voltage required to operate motors and lights is less than that required for distribution and a transformer must be used to step down the voltage. A transformer receives electrical energy from one circuit and transfers it to another circuit by magnetic action. The circuit from which energy is received is called the primary circuit, the receiving circuit is the secondary circuit. Usually the primary and secondary circuits are at different voltages. An elementary transformer consists of a primary and a secondary coil surrounding an iron core. Alternating
Figure 9. Transformer taps on primary.
1-14

current in the primary coil produces an alternating magnetic field in the iron core. A voltage is induced in the secondary coil by the alternating field. a. Substation transformers. Substation transformers should be of the outdoor type and of adequate self-cooled rating. b. Distribution transformers. Utilization voltage for most military electrical equipment is 120, 208, or 240 volts. However, since it is not practical to transmit appreciable quantities of electrical energy farther than 1,000 to 1,500 feet at these low voltages, higher distribution voltages are used.
Distribution transformers are used to reduce high primary voltages to lower usable secondary voltages. c. Taps. Many transformers have extra taps on the primary winding so that full secondary voltage can be maintained even though the primary voltage is reduced. Figure 9 shows a 2,400/120-volt transformer (20:1) with two extra taps on the primary winding. In the transformer, one tap, the 95 percent tap, gives a 19:1 ratio, while the 90 percent tap gives an 18:1 ratio. If the primary voltage is 5 percent below 2,400 volts, the transformer is connected to the 95 percent tap, thus keeping the secondary voltage at 120 volts.
EXERCISES First requirement. Each of the
following multiple-choice exercises has four choices with only ONE best answer. Select the choice you believe is best. Then turn to the answer sheet and mark an X through the letter representing that choice. Exercises 1 through 8 provide an opportunity for you to show that you understand the basic types of electric power systems. 1. Direct current, under the condition of constant load, flows in the same direction at all times. Which of the following is also a characteristic of direct current?
a. is economical for use in 3∅ 3W systems
b. has a constant magnitude c. has a variable frequency d. is necessary in the operation of
transformers
2. You are assigned the project of classifying the electrical systems of a captured enemy installation. How would you classify the system in figure 10?
a. 1∅ 2W 120V b. 1∅ 3W 120/240V c. 3∅ 2W 120V d. 3∅ 3W 120/240V
3. In a single-phase two-wire system what is the relationship between the amounts of current carried in each of the two wires?
a. currents are equal b. relationship depends on the size
of the load c. currents differ by a factor of
1.73 d. relationship depends on the
magnitude of the voltage 4. What type of system has no phase difference between any of the available voltages?
a. single-phase (1∅) b. three-phase (3∅) c. three-wire (3W) d. four-wire (4W)
5. You are attempting to balance the loads in a single-phase three-wire system. What would you
1-15

Figure 10. For use with exercise 2.
measure to check whether or not the loads are balanced?
a. current in either hot wire b. voltage between the hot wires c. current in the neutral wire d. voltage between either hot wire
and the neutral
6. You are laying out a 3∅ 3W system for an installation. You wish to check the system after it is connected, and begin by measuring all available voltages. If the system is operating properly, what should be the relationships among the voltages you measure?
a. add up to the generator voltage b. differ by a factor of 1.73 c. depends on the connected loads d. should all be equal
7. As utilities officer, you have assumed responsibility for an installation, with no information as to the type and condition of the utilities. In an inspection of a bank of generators supplying a
portion of the installation, you find that they are labeled as three-phase, 220-volt, 60-cycle type. Their coils are connected in “Y” and four wires carry the power. You check the voltage between any two of wires A, B, and C and find it to be 220V. The system being in good condition, what should be the voltage between any one of the three wires (A, B, or C) and the fourth wire D?
a. 110 c. 127 b. 115 d. 225
8. You are designing an electrical system, and find that you can separate the loads to be served into four categories: 1∅ 2W 120V; 1∅ 2W 208V; 3∅ 3W 208V; 3∅ 4W 120/208V. What type of system do you design in order to be able to serve all the required loads?
a. 1∅ 2W 208V b. 1∅ 3W 120/240V
1-16

c. 3∅ 3W 208V d. 3∅ 4W 120/208V Second requirement. Solve multiple-
choice exercises 9 and 10 to show what you have learned about generators.
9. DC generators are seldom used since the voltage cannot be increased or decreased by means of a transformer and the transmission distance of DC power is limited. Why, then, might you need a DC generator in a TO?
a. short distance transmission of emergency power
b. production of 400 cycle current for radar equipment
c. backup for AC generators d. power for a communications
network
10. The important characteristics of a generator are its capacity or kilowatt (KW) rating, the voltage and frequency at which it operates, and whether it is single or three phase. Which of these characteristics determines the size of the generator's driving motor?
a. capacity b. voltage c. frequency d. number of phases Third requirement. Multiple-choice
exercises 11 through 13 deal with load estimation for electric distribution systems.
11. You are assigned the project of determining the load requirements for a section of a proposed installation. Among the buildings which must be served is a 2,500 man capacity laundry. What would you expect the demand load of this laundry to be?
a. 29.1 KVA c. 36.1 KVA b. 32.5 KVA d. 39.2 KVA
12. The demand factor is used to determine the amount of power that must actually be supplied to a particular building. What then is the generator factor used for?
a. it is the same as the demand factor
b. determining the amount of power that must actually be supplied to a group of buildings
c. taking into account that all connected loads in a building are not used simultaneously
d. situations where the demand factor cannot be determined
13. While computing the load requirements for a section of your installation, you group four buildings together and determine the power that must be supplied to them. These buildings are: (1) a 50-man, 20' x 100' barracks; (2) a recreation hall 20' x 100'; (3) a 15-ton 401 x 52' ice plant; (4) a 60' x 140' machine shop. What is the load you must be able to furnish these buildings (the required generator capacity)?
a. 104.2 KVA c. 114.6 KVA b. 107.8 KVA d. 129.8 KVA Fourth requirement. Multiple-choice
exercises 14 through 17 enable you to show that you understand the principles of determining generator selection, availability, and location. 14. The following generators are available to you: three 100KW; three 45KW; two 60KW; one 30KW; one 15KW. You have determined the required generator capacity for a portion of your installation to be 148KW. Which of the following generator combinations would you choose?
a. 2-60KW; 1-30KW b. 2-100KW c. 3-45KW d. 3-100KW
1-17

Figure 11. For use with exercise 17.
15. The use of three generators of varying size to feed a single load offers several advantages. Why, then, must extreme caution be exercised in using this combination of generators?
a. two or more generators of different sizes feeding a single load require a skilled operator
b. this system requires loads that vary only slightly if at all
c. the efficiency of this type of generating system is usually low
d. excess generating capacity cannot be achieved by this method
16. Which of the following statements describes single-phase 60-cycle generators available for TO installations ?
a. they are available in 2, 3, and 4 wire models
1-18

b. they range in size from 150 watts to 30 kilowatts
c. they produce either 50-cycle or 60-cycle current
d. they are driven by gasoline engines
17. After a thorough study of figure 11, which of the sites A, B, C, or D do you decide is the best location for a generator to supply all the buildings shown?
a. A c. C b. B d. D Fifth requirement. Multiple-choice
exercises 18 through 20 are designed to enable you to show what you have learned about substations and transformers.
18. Many European countries use 25-cycle current in their power systems, while in the United States 60 cycles is standard. Assume that for a proposed overseas installation there is a local power plant nearby producing a sufficient amount of 25-cycle current. Since your equipment is rated for 60 cycles, what must you install?
a. transformer substation b. converter substation c. frequency-changer substation d. voltage-regulator substation
19. Why are distribution transformers connected to the primary feeders of a system?
a. reduce voltage to a usable value b. regulate current flow to the
installation c. reduce amperage to the smaller
distribution lines d. insure constant voltage in the
primary
20. In a transformer the circuit from which energy is received is called the primary circuit, while the receiving circuit is the secondary. Why do transformers often have taps on the primary winding?
a. insure constant voltage in the primary
b. maintain full secondary voltage c. insure that safe voltage levels
are being used d. regulate current flow from one
circuit to another
1-19

LESSON 2
ELECTRICAL DISTRIBUTION SYSTEMS TEXT ASSIGNMENT --------------------Attached memorandum. MATERIALS REQUIRED -----------------None. LESSON OBJECTIVE -------------------To teach you how to design simple
electrical distribution systems for theaters of operations.
ATTACHED MEMORANDUM 1. INTRODUCTION An electric power system
fundamentally consists of an electrical source connected by wires to an electrical load. The number of loads is then increased to as many buildings, shops, and warehouses as must be supplied. In a low voltage system, the generator may be of the small portable type and the distances to the loads may be as high as 1,500 feet. The design of these low-voltage systems is based on the magnitude and location of the loads. Existing electric power systems will not be as simple as that explained above, especially when transmission of power is made over long distances for relatively high power loads. Figure 1 shows a typical high-voltage electric power system. This type of system serves a large number of loads or services that are usually located at a great distance from the generating plant; that is, up to 50 or 75 miles. The generating plant must produce enough power (kilowatts) to supply the entire load plus the power lost through wire resistance in
transmission. Also, the plant must produce enough voltage to transmit the power from the plant to the services. To simplify, the longer the transmission distance, the higher the required voltage. For example, to transmit power over a 75-mile distance, the generating plant should produce 88,000 volts. For a 10-mile distance, only about 13,000 volts are required. Now, it is obvious that the services cannot utilize electric power at such high voltages. Remember that common household voltages range from 120 to 240 volts. Here is where the other components of the system come into use. That part of the system beyond the stepdown transformer substation is designated as the distribution system.
2. DISTRIBUTION SYSTEM LAYOUT There are two general methods
of arranging a distribution system; that is, the layout of the wires to the various facilities
2-1

Figure 1. Typical high-voltage power system.
2-2
NOTE:
WIRE SHOWN REPRESENTS TOTAL NUMBER OF WIRES
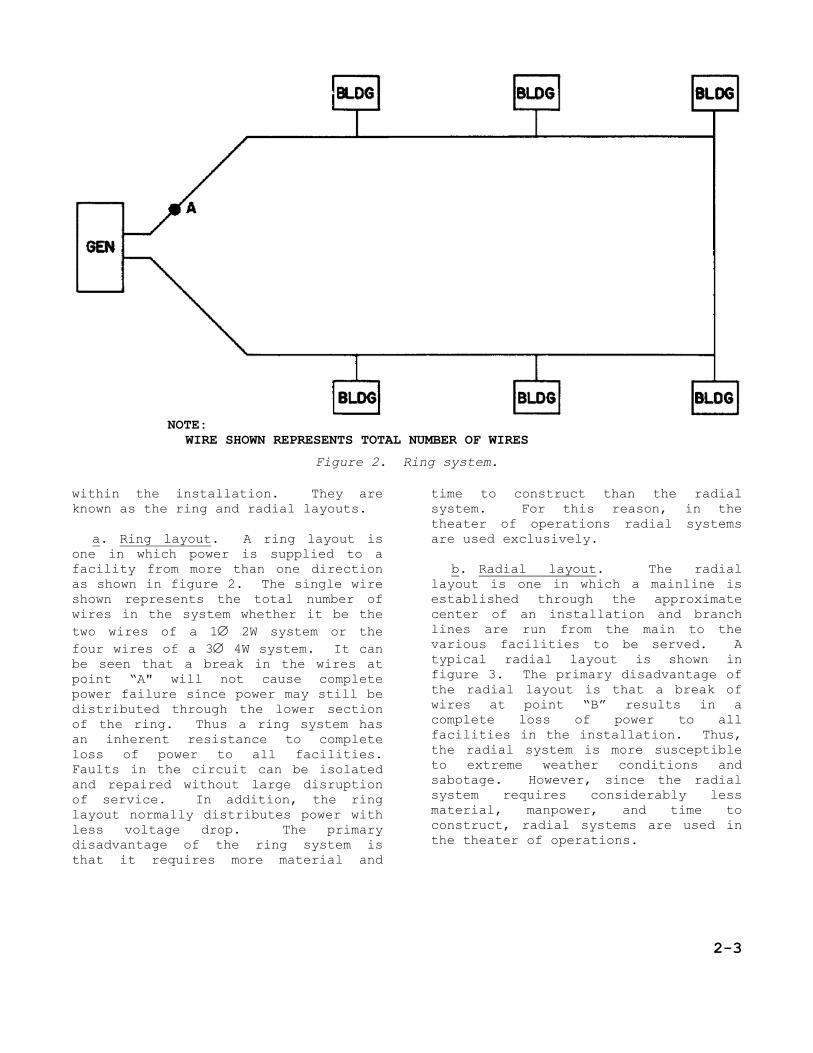
Figure 2. Ring system. within the installation. They are known as the ring and radial layouts. a. Ring layout. A ring layout is one in which power is supplied to a facility from more than one direction as shown in figure 2. The single wire shown represents the total number of wires in the system whether it be the two wires of a 1∅ 2W system or the four wires of a 3∅ 4W system. It can be seen that a break in the wires at point “A" will not cause complete power failure since power may still be distributed through the lower section of the ring. Thus a ring system has an inherent resistance to complete loss of power to all facilities. Faults in the circuit can be isolated and repaired without large disruption of service. In addition, the ring layout normally distributes power with less voltage drop. The primary disadvantage of the ring system is that it requires more material and
time to construct than the radial system. For this reason, in the theater of operations radial systems are used exclusively. b. Radial layout. The radial layout is one in which a mainline is established through the approximate center of an installation and branch lines are run from the main to the various facilities to be served. A typical radial layout is shown in figure 3. The primary disadvantage of the radial layout is that a break of wires at point “B” results in a complete loss of power to all facilities in the installation. Thus, the radial system is more susceptible to extreme weather conditions and sabotage. However, since the radial system requires considerably less material, manpower, and time to construct, radial systems are used in the theater of operations.
2-3

NOTE:
WIRE SHOWN REPRESENTS TOTAL NUMBER OF WIRES
Figure 3. Radial system. c. Wiring layout plan. After the required generators have been selected and located, a plan is drawn showing the proposed arrangement of the wiring. The plan should show the generator site; the location of poles; all branches and sections of wires; and all the structures to be served. The poles should be spaced approximately 150 feet apart. In some cases, wires under 240 volts will be strung from building to building. In general, the feeder wires will radiate from the generator towards various areas of structures for distances of up to 1,500 feet in small systems generating up to 240 volts. If any buildings are more than 1,500 feet from the generator, attempts should be made to move the generator, if possible, so that all structures to be served are within the 1500 foot limit. At some convenient pole, branch wires ig 4) are usually connected to the
feeder. Sometimes a service wire to one or more structures may also be connected to the feeder. The branch or service wires will usually be of a smaller size because of the smaller demand requirements of the few buildings which they serve. The layout plan should also show the length of each section of feeder wire and the distances between points where power is taken off. The total demand load at each point where power is taken off from the feeder is calculated and shown.
(f
3. DISTRIBUTION SYSTEM BALANCING In lesson 1 the types and
functions of generators were discussed. It was seen that loads may be connected between a
2-4

Figure 4. Distribution system layout plan.
2-5

power carrying conductor (hot wire) and the neutral (ground) wire or among several power carrying wires. a. Phase loading. When a load is connected between a hot wire and a neutral wire the power is assumed to be supplied completely by the hot wire. Likewise, a load connected between two or more hot wires is distributed equally among the hot wires. Many loads may be connected among various hot wires in a given distribution system. For example, in an installation fed by a 3∅ 4W generator, single phase loads may be attached to the different phases throughout the system. However, no matter how many loadings are supplied, or in what arrangement they may be, the generator responds to the total load on each of its phases and attempts to supply the required power to satisfy the particular load in each phase. b. Phase balance. It is imperative that the power in each phase just as it leaves the generator be balanced; that is, each phase receive the same amount of power from the generator. This will only come about as a result of having equal total loadings on each of the phases, and the layout must be designed to achieve this. Unbalanced loading has the following three bad effects: (1) Output. It will be impossible to get full output out of a lightly loaded phase without overloading the others. (2) Voltage regulation. System voltage regulation becomes poor since unbalancing causes high voltage on the lightly loaded phase and low voltage on the others. (3) Damage. Prolonged unbalance will damage generating equipment. c. System balance. In practice it is highly improbable that it will be possible to balance the various loadings in an actual installation so
that each phase receives exactly the same load. In practically all TO installations some difference in loading will exist among the different phases, However, the loadings on the generator must be balanced as much as possible, and at the very least, within 10 percent, for the reasons stated in b above. Thus the total power delivered by the generator in the maximum loaded phase must be less than or equal to 1.1 times the power delivered in the minimum loaded phase. Although this amount of unbalance is within acceptable limits, it is still considered a relatively high degree of unbalance. The more generator unbalance in a system, the greater the chances of causing the bad effects mentioned earlier. An attempt should always be made to balance the generator within 1 percent, so that the power delivered in the maximum loaded phase is less than or equal to 1.01 times the power delivered in the minimum loaded phase. Accomplishment of this objective is often a tedious trial and error procedure, but it is not impossible, and it becomes less difficult as the size of the installation increases. A determined effort should always be made to achieve this degree of generator balance. 4. BALANCING SINGLE-PHASE SYSTEMS A 1∅ 2W system is the basic load
carrying circuit and cannot be unbalanced since there are only two wires, which can only be connected to one load group. The 1∅ 3W 120/240V system, however, contains two hot wires and a neutral which means that two single phase 120V load groups and/or one single phase 240V load group may be served. When designing such a system, the two single phase 120V load groups should be of approximately equal size.
5. BALANCING THREE-PHASE SYSTEMS A 3∅ 3W 208V system contains three hot
wires, meaning that three single-phase
2-6

208V groups or one three-phase 208V group may be served. To balance this system, the three single-phase load groups should be of equal size. A 3∅ 4W 120/208V system contains three hot wires and a neutral, meaning that three single-phase 120V loads, three single-phase 208V loads, and a three-phase 208V load may be served. The
three single-phase 120V loads and the three single-phase 208V loads should be balanced. a. Example. Returning to the example of lesson 1, balance the loadings on the generator. The following loads were given:
b. Solution. The loads should be distributed so that each phase carries an approximately equal load and so that removal of any one load will still leave approximately equal loads on each phase. One possible method of distribution is shown in figure 5. This results in a distribution as follows:
The ideal situation would be for each phase to carry an exactly equal load but this is almost never achieved in practice. Here the loadings on the generator are
balanced to 4.2% . This is within the required 10 percent.
2-7

Figure 5. Load distribution.
6. PHASE BALANCE Although a generator is balanced, an
inspection of the phases at any point in the distribution system may reveal that the phases are out of balance. In a 3∅ 4W system, three hot wires and a neutral leave the generator with the three hot wires carrying the same power. At one pole, power may be delivered to one of the 1∅ 2W loads in the installation by feeding the facility with a branch consisting of one phase and the neutral. Therefore, between this pole and the next, the three phases will not be balanced. Variations of this situation may occur. Such phase or pole to pole unbalances are not uncommon due to the various loads applied to the system. Unlike the generator balancing case, this situation may be allowed to exist without any harmful effects to the system.
7. WIRE SIZE AND VOLTAGE DROP DETERMINATION
The size of wire for a given section
of a system is selected on the basis the amount of electrical load that of
it must carry and on the allowable voltage drop. Keep in mind that the larger the wire size, the greater its capacity and the less resistance it will have, hence, less voltage drop. Economy, however, should be considered in size determination. Table 1 shows the KVA and current carrying capacities for wires ranging from a No. 8 to a 4/0.
a. Types of conductors. Conductors used in overhead distribution systems at Army posts are usually copper, although they may be steel, aluminum, or combinations of these metals. (1) Copper. Copper has high conductivity and is easily spliced. Hard-drawn or medium-hard-drawn copper is desirable for distribution conductors because of its strength. Since annealing reduces the wire's tensile strength from 50,000 pounds per square inch to 35,000 pounds, soldered splices should not be used on hard-drawn copper wire because the hot solder anneals the joints. Splicing sleeves are normally used when making joints.
2-8

Table 1. KVA Load-Carrying Capacity of Wire1
(2) Steel. Steel wire used as a conductor permits long spans because of its high tensile strength. Steel has about 10 to 15 percent as much conductivity size for size as copper, but the short life and low conductivity of steel wire is overcome to some extent by the use of copper-clad steel made by welding a copper coating to the steel wire. (3) Weatherproofing. Triple-braid weatherproofing is preferred to double braid. Improved types of weatherproofing include plastic covering, and layers of impregnated unspun cotton or impregnated rubber filler. Before these newer type coverings are used, approval should be obtained from the higher command having jurisdiction. (4) Primary distribution. For primary distribution below 5,000 volts, either bare or weatherproof conductors may be used. The ordinary
weatherproof covering is not to be considered as insulation, although it does prevent breakdowns on the lower primary voltages caused by conductors swinging together. For all primary distribution over 5,000 volts, bare conductors are ordinarily used. (5) Secondary distribution. Weatherproof wires are used for secondary distribution. The weatherproof covering is an effective insulation for secondary voltages, permitting rack-type distribution and closely spaced secondary conductors. No wire smaller than a No. 8 is to be used for secondary distribution or for any external transmission of power. b. Voltage drop. As stated previously, a wire size is selected on the basis of the allowable voltage drop and the load to be carried. The voltage drop is perhaps the more important criterion in that it causes
2-9

lights to burn dimly, reduces efficiency, and may damage motors when excessive. As defined, voltage drop is the difference in voltage between the input and output ends of a transmission line. It is caused by the resistance of the wire and is also known as "line loss." The percentage of line loss or voltage drop may be expressed as either a percentage of the voltage required at the receiving end or as a percentage of the voltage impressed or generated by the source to the line. For example, figure 6 shows the voltage at the motor to be 220 volts. The generator is producing 231 volts. Therefore, the line loss of voltage drop is 11 volts. The voltage drop expressed as a percentage of the voltage at the receiving end is
or 5 percent; expressed as a
percentage of the generated voltage,
it is or 4.76 percent.
In civilian practice, the percent voltage drop is usually taken as a percentage of the voltage required at the receiving apparatus. In military practice, the percent voltage drop is taken as a percentage of the voltage at the generator. For typical TO installations, the voltage drop is usually kept within a 5 percent limit from the generator to the last or farthest load. Figures 7, 8, and 9 will be used in this course for computing voltage drops and wire sizes. These figures are nomographs which correlate the several factors involved. Their use is discussed in the following examples.
(1) Example 1. The maximum allowable voltage drop for a circuit is known to be 3 percent. The demand load is 20 KVA and the length of the circuit is 450 feet. The circuit is 3∅ 4W 127/220 volt type. Using figure 9, determine the smallest permissible wire size and the resulting voltage drop. Solution: Figure 9 is used because it is based on the proposed 3∅ 4W 127/220 volt circuit. To determine the required wire size enter the demand load of 20 KVA on the upper horizontal scale and follow vertically downward to the intersection with the diagonal line representing 3 percent voltage drop pertaining to the upper KVA scale. Project from this point of intersection a horizontal line to the right until intersection is made with the vertical line representing 450 feet as read from the bottom horizontal scale. This second point of intersection falls between the curves for wire sizes No. 2 and No. 1/0. In such a case, select the larger wire--the No. 1/0. To determine the actual voltage drop using the 1/0 wire, enter 450 feet on the bottom scale; follow upwards to the curve representing 1/0 wire; follow horizontally to the vertical line representing 20 KVA as read from the upper horizontal scale. At this point, the voltage drop is read as 2.4 percent. From table 1 it can be seen that a 1/0 wire is capable of carrying the 20 KVA load and from the above procedure, the voltage drop is under the 3 percent specification.
Figure 6. Line voltage drop.
2-10

Figure 7. Voltage drop and wire size chart for
single phase, two-wire, 120-volt system.
2-11

Figure 8. Voltage drop and wire size chart for single-phase, three-wire, 120/240 volt system.
2-12

Figure 9. Voltage drop and wire size chart for three-phase, four-wire, 127/220 volt system.
2-13

(2) Example 2. When the demand load, the length of wire, and the size of wire are known, the voltage drop can be determined as a check of the system's adequacy. Assuming a 1∅ 2W 120V system is being used having a certain section supplying a 5 KVA load with a No. 2 wire, what is the voltage drop in its 250 foot length? Solution: Using figure 7 enter 250 feet at the bottom right horizontal scale; proceed vertically to the No. 2 curve; proceed horizontally to the vertical line representing 5 KVA as read from the lower left horizontal scale. At this point, the voltage drop is read as 3.3 percent using the lower voltage drop figures. This voltage drop may, or may not, be within specifications. If it is not, then a larger size of wire must be used which will lower the drop to the predetermined specification. 8. POLE SELECTION As previously stated, TO electric
distribution systems are of the radial type; lines radiate from the generators towards the loads, branching and rebranching until all areas are served. Lines are normally overhead, supported by poles or strung from building to building. As a general rule, lines carrying over 240 volts are supported on poles while those carrying 120 to 240 volts maybe supported on masts or insulators attached to buildings. Service wires should be kept at least 3 feet from windows and 8 inches above flat roofs. Since theater of operations electrical distribution systems are exclusively overhead distribution systems, wooden poles similar to those used in civilian construction are used to carry the conductors. Unlike civilian construction, crossarms are not used in the theater of operations Wince the size of the system does not warrant them. Conductors are hung on the pole, one above the other.
a. Poles. The poles used in a distribution system should consist of
a good grade of timber which will last. Good pressure treated Texas southern pine, for example, can be expected to last 35 to 50 years. On the other hand, untreated local timber such as soft pine may last only a couple of years and may have a useful life of only one season under unfavorable conditions. However, the fact that a pole is in good condition is not proof that it can satisfactorily support the line. Poles must withstand column loadings as well as transverse loads from wind and turns in the line. b. Height and class. Table 2 shows the required heights and classes of poles for various types of loadings in military installations. The smaller a class number, the sturdier will be the pole. The class of a given pole depends on its length, diameter, and the material from which it is made. Tables correlating class with dimensions for various pole materials can be found in appropriate TM's. The height is governed by restrictions both above and below the proposed conductors. Near airfields, poles must be kept low, yet high enough to provide adequate clearance over streets and roads. Corner poles, transformer poles, and the like are usually one or more classes heavier and sometimes 5 feet higher than line poles. Table 3 gives the required classes for transformer poles. c. Vertical wire spacing. Vertical wire spacing is the clear distance between wires. 6-inch minimum spacing is required for spans up to and including 200 feet while 12-inch minimum spacing is required for spans over 200 feet. A clear space is always left at the top of an electrical pole. This distance is equal to the wire spacing, that is, 6 inches for 200 foot spans and less, and 12 inches for spans greater than 200 feet. d. Setting poles. Poles should be set deep enough to develop their full bending
2-14

Table 2. Height and Class of Poles
Table 3. Pole Size for Transformers
Table 4. Depth for Setting Poles in Soil or Rock
2-15

Figure 10. National Electric Safety Code (NESC) minimum clearances.
2-16

strength at the ground line. Table 4 gives the recommended setting depths in soil and in rock. The actual setting or installation of the poles is done by one of three methods: by hand, with a crane, or by using a nearby pole as a gin pole. e. Clearances. Minimum clearances of conductors over ground, rails, and other objects are given in figure 10. Special consideration must be given to railroad yards and material handling areas. Allow a minimum horizontal clearance of 11 inches from the outside face of a curb or roadbed to the face of the pole to prevent damage by vehicles. The clearances shown may
be decreased in theater of operations construction where safety factors are reduced. The engineer officer must use sound judgment in establishing minimum clearances for a given project, taking into
Figure 11. Illustration of sag.
Table 5. Line Wire Sag in Inches
Table 6. Service Drop Wire Sag in Inches
2-17

Figure 12. Sag for one-half ultimate strength of bare hard-drawn copper
conductors. account materials available, military necessity, urgency of the project, and other factors. f. Sag. Sag is the maximum departure of a wire in a given span from the straight line between the two points of support (fig 11). Check sags carefully. Lift wires free of the arm to permit the sags to equalize when installing conductors. The common tendency is to pull small copper conductors too tight and to leave too much sag in large conductors. When the small wires are pulled too tight, they are likely to break in cold weather or during ice storms. If they do not break, they may stretch, reducing the cross section of the wire. Tables 5 and 6 give the amount of sag to be used ordinarily for line conductors in distribution systems. Sags given are such that the conductors will not be overstressed under conditions of ice d wind. an
(1) Service drop wires. Table 6 gives the recommended sag for service drop wires. Service drops should not be pulled tighter than indicated by the table, except to obtain necessary clearances; sags must never be less than half those shown. (2) Long spans. Tables 5 and 6 have a maximum span given of 150 feet. This length is normally used for TO installations. However, for high-tension transmission lines much longer spans will be employed. For determining sags for spans over 150 feet, use figure 12 which gives the corresponding sags at a fixed mean temperature of 60oF. The sags given by this figure allow the conductors to be stressed to one-half of their ultimate tensile strength. (3) Excessive sag. Excessive sag may often be found on existing overhead installations, but the cause for the excess should
2-18

Figure 13. Building layout.
2-19

Figure 14. Load estimate sheet.
be determined before any readjustment is attempted. Common causes include heavy ice loads, broken guys, broken anchors, twisted arms, and fallen or leaning poles. If all possible causes are corrected, pulling slack out of wires may not be necessary. g. Sag determination. The following procedure is used to determine the proper amount of sag for a given section or service drop.
(1) Determine length of section or service drop. (2) Check size and type of conductor. (3) Estimate prevailing temperature in degrees Fahrenheit. (4) Locate correct amount of sag in table 5 or 6 or figure 12, whichever is applicable.
2-20

Figure 15. Wiring layout.
2-21

Figure 16. Sections of the feeder line.
Figure 17. Wire size tabulation.
h. Example of pole size determination. In order to connect an installation to an existing 20,000-volt high tension line, a new line must be run 3,500 feet across generally level soil. No. 2/0 hard-drawn bare copper wire will be used, making seven 500-foot spans. Assuming the high-tension conductors are the only ones to be strung, what is the required height and length of pole? Solution: From table 2 the class of pole is a No. 5 with a minimum height of 30 feet. From figure 12 the sag under the above conditions will be approximately 14 feet. From figure 10, using the specifications for an area accessible to pedestrians only, the required clearance is 17 feet. From the above requirements the height of pole above the ground should be 14 + 17 = 31 feet. From table 4 the pole should be set a distance of 5.5 feet
into the soil. This establishes the total required length of the pole at 36.5 feet. 9. SYSTEM DESIGN Perhaps the best way to illustrate
the application of all the steps involved in the design of an electrical distribution system is by means of an example.
Situation: As S3 of a construction group, you have been directed to furnish adequate electric power to that portion of a new installation for which other utilities have been installed and completed. The building layout is shown in figure 13. No outside source of electricity exists. Figure 14 shows the connected lighting and power loads, the total demand, and the type of service for each building shown in the layout. From this data, the design of the system follows.
2-22

a. Load estimation. Figure 14 is an estimate of the electrical load for this portion of the installation. The connected lighting and power loads were given as shown. A demand factor was applied and the total demand computed for each structure. A three-phase, four-wire, 127/220V system will be used. The sum of all the individual demands is 85.45 KVA. b. Generator selection and location. The total demand load has been estimated as 85.45 KVA. Applying a generator factor of 0.85, the required generator capacity will be: 85.45 x 0.85 = 72.6 KVA. Depending on availability, the following generator combinations can be employed: Three 60 KW generators One 60 KW; one 45KW; and one 15 KW generator Two 100 KW generators Four 30 KW generators The generators should be located close to buildings 1 and 2 which constitute the largest demand loads. c. Wiring layout. Buildings should be grouped in order to facilitate the determination of the feeder and branch lines. For example, buildings 3, 4, and 5 can be grouped and served by one branch line. Figure 15 shows one method of laying out the feeder line and is branches. Supporting poles are spaced 150 feet apart. Branch loads are shown for each line. d. Wire-size determinations. The maximum allowable voltage drop for the system is 5 percent. Beginning with the feeder line, the system is designed in sections. That is, the section from the generator to building No. 1 may require a certain size of wire while the section of line to building No. 2 may require a much larger wire. Figure 16 is a diagram of the feeder showing the various
sections into which it will be divided for the purpose of determining its wire sizes. (1) Section GA. This section carries such a large load for such a short distance that the voltage drop will not be the controlling factor. Rather, the current and the load will determine the wire size. From table 1 a No. 8 wire can carry up to 29 KVA without exceeding the current carrying capacity of the wire. Use a No. 8 wire for section GA. (2) Section GO. Again the current and the load control the required size. From table 1 a No. 2 wire can carry up to 69 KVA without exceeding the current carrying capacity of the wire. Use a No. 2 wire for section GO. (3) Section GB. This section of wire is carrying the bulk of the load to the right of the generator, or 12.10 KVA. The section is 150 feet long. From the curves of figure 9 the appropriate wire size should be a No. 4, assuming that to point B you have allowed, say, a 1 percent voltage drop. (Keep in mind that you are allowed a 5 percent total drop to the end of the
Figure 18. Branch line design.
2-23

system (par 7b) or to the end of the branch line off point C.) By allowing, roughly, a fourth or a fifth of the total voltage drop for this particular section, you should have enough drop left for the later sections. Using a No. 4 wire, the actual voltage drop resulting is approximately 1.1 percent. The results of these computations should be tabulated as shown in figure 17. (4) Section BC. The load carried by this section is the sum of the loads beyond point B or 6.82 KVA. The distance is 300 feet. Allow up to 2 percent voltage drop in this section. From figure 9 a No. 6 wire may be used, which actually drops the voltage by 1.8 percent. The cumulative voltage drop to this point is now 1.1 + 1.8 = 2.9 percent. (5) Section CD. The load is 4.57 KVA; the length is 150 feet. Since the cumulative voltage drop to point C is 2.9 percent, you are still 2.1 percent under the specified maximum. Actually, this is quite a bit of allowance for this last section and, consequently, a very small economical wire could be selected. However, a No. 8 is the smallest allowable size. Hence, using this for section CD will result in an additional 1.0 percent voltage drop making the cumulative drop to point D 1.1 +1.8 + 1.0 = 3.9 percent. Figure 17 shows the complete tabulation for the feeder line. As shown, the wire sizes selected have created a total voltage drop of 3.9 percent to point D. Therefore, there is an allowable 1.1 percent drop for each group of buildings being served by the branch lines off point D. The next usual step is to determine the size of wire for the branch circuits at the end of the feeder line. These last branches are critical because they will have the largest accumulated voltage drop. (6) Branch line design. Figure 18 shows the group of buildings (16 through 22) for which wire size will be determined next. Design of these branches varies slightly from that for the feeder in that the equivalent distance of the branch must be computed. The equivalent distance is the ratio of total KVAX ft to total KVA and is computed as follows:
Since you had a 3.9 percent cumulative voltage drop to point D, there is an allowable 1.1 percent remaining for this particular branch. Figure 9 is now used by entering on it a load of 1.65 KVA, a distance of 232.2 feet, and a 1.1 percent voltage drop. Using a No. 8 wire, the voltage drop induced in the branch line will be approximately 0.5 percent. Hence the total voltage drop from the generator to ilding 19 is 3.9 + 0.5 = 4.4 percent, which is within specifications. bu
2-24

EXERCISES First requirement. Multiple-choice
exercises 1 through 4 provide an opportunity for you to show that you understand the basic principles of distribution system layout and balancing.
1. If a break in the wires of a radial distribution system can result in the loss of power to a portion of the system, thereby making it more susceptible to extreme weather conditions and sabotage, why are radial systems preferred in TO construction over other systems without these disadvantages?
a. require less material and time to construct
b. have lower power losses than other systems
c. are more easily adapted to a wide variety of loads
d. are the easiest system to repair
2. I when you develop your wiring layout plan you find that some of the loads are more than 1500 feet from the generator, what initial action should you attempt?
a. select a larger generator to counteract the greater line loss
b. install a transformer between the generator and these loads
c. increase the wire size to minimize the effect of distance
d. move the generator location to decrease the distance
3. You are attempting to balance the loads on the generator in a three-phase system and find tem to be distributed as follows: phase 1, 34.9KW; phase 2, 38.3KW; phase 3, 36.1KW. TO requirements state that
the loads must be balanced with 10 percent, and should be balanced within 1 percent if possible. To what degree is this system balanced?
a. 1% c. 9.7% b. 5% d. 10.3%
4. You have been experiencing difficulty with your generator, and conclude that it is due to unbalanced loading. Your 3∅ 4W generator is supplying the following loads:
1. 1∅ 2W 1.2 KVA 2. 1∅ 2W 2.4 KVA 3. 1∅ 2W 3.6 KVA 4. 3∅ 4W 10 KVA 5. 1∅ 2W 2.4 KVA 6. 1∅ 2W 1.2 KVA Total = 20.8 KVA
Which of the following combinations of loads on phases 1, 2, and 3 respectively result in a balanced system?
a. L1, 1/3 L4, L5; L2, 1/3 L4, L6; L3, 1/3 L4
b. L1, 1/3 L4, L6; L2, 1/3 L4, L5; L3, 1/3 L4
c. L1, L2, L3; L5, L6; L4 d. 1/3 L3, L1, L4; L2, 1/3 L3, L5;
1/3 L3, L6 Second requirement. Solve multiple-
choice exercises 5 through 8 to show what you have learned about wire size and voltage drop determination.
5. You plan to connect 3∅ 4W 127/220V service directly from your
2-25

generator to a laundry 50 feet away. If the total demand load of the laundry is 41 KVA, what size wire will you specify?
a. 2 c. 6 b. 4 d. 8
6. Why is weatherproof covering specified for secondary distribution in TO construction?
a. is safer b. permits closer spacing of wires c. simplifies splicing of wires d. increases the strength of wires
7. If in a given distribution system a 5 percent voltage drop will occur in transmitting power to the farthest load in the system, how much voltage must be impressed by the generators in order to have 208 volts available to the user?
a. 219 c. 308 b. 232 d. 327
8. If a 10 3W 120/240V system is being used to supply a 6 KVA load with a number 8 wire, what is the percent voltage drop in its 250 foot length?
a. 2.0 c. 3.2 b. 2.5 d. 4.0 Third requirement. Multiple-choice
exercises 9 through 13 deal with pole selection.
9. If line poles are spaced at 250-foot intervals, what is the required vertical wire spacing in inches?
a. 6 c. 12 b. 9 d. 18
10. In repairing a damaged 12-mile gap in a power line, you find that some of the poles will be located in rocky terrain while some
will be in soil. Using a 40-foot pole height, you specify that the poles are to be set into rock and soil respectively what depths?
a. 4.0 and 5.5 c. 4.5 and 6.0 b. 4.0 and 6.0 d. 4.5 and 6.5
11. You are designing poles to be set 150 feet apart for a prevailing temperature of 60 F. For a primary feeder line on your installation, what is the minimum distance above the ground that you can attach wires to the poles for an area that involves crossing public streets and driveways to resident garages?
a. 18’7” c. 28’3” b. 22’2” d. 30’8”
12. In problem 11, what would be the minimum height for attaching wires to poles if the line had to cross a railroad track?
a. 18’7” c. 28’0” b. 20’2” d. 30’2”
13. What is the minimum allowable stringing sag in feet at 60°F for a 4/0 (0000) hard-drawn bare copper wire using wood poles and a 450 foot pole spacing? (Tension in the wires must not exceed one-half the wires’ ultimate strength.)
a. 4 c. 8 b. 6 d. 12 Fourth requirement. Multiple-choice
exercises 14 through 18 will cover wire size determinations for the system in the following situation: Situation. As utilities officer of a
TO installation you have been directed to furnish electric power to the portion of the installation shown in figure 19. The generator and feeder line locations have been determined as shown in figure 20. The following data will apply:
2-26

Figure 19. Building layout for exercises 14 thorough 20.
2-27

Figure 20. Distribution layout for exercises 14 through 20.
2-28

a. Maximum allowable voltage drop is 6 percent. b. Smallest permissible wire size is No. 8. c. To help determine distances, the poles supporting the feeder are spaced at 150 feet. d. Various groups of buildings have been designated I, II, III, IV, and V (fig 20) to facilitate the feeder design. e. The demand load for each group and the remaining buildings has been computed as follows:
Group I - 6.50 KVA Group II - 2.00 KVA Group III - 2.50 KVA Group IV - 4.00 KVA Group V - 2.00 KVA Building 5 - NCO Club - 3.00 KVA Building 11 - Chapel - 1.40 KVA Building 12 - Boiler room - 4.18 KVA Building 13 - Laundry, 2500 man -
41.00 KVA
f. 3∅ 4W 127/220V service will be provided throughout.
14. Your assistant has submitted a design for section CI of the feeder line (fig 20), using the following data: Length - 300 feet Load - sum of demands for groups
III, IV, and V Voltage drop - 12 volts Voltage at generator - 220 volts After examining his procedure which of the following conclusions do you reach?
a. he used an excessive voltage drop
b. on the basis of the data used, his design seems to be adequate
c. his design is not adequate as he did not apply all the available data
d. he did not apply the correct load
15. Using the loads given in the situation, what size wire will be required for section AC of the feeder if the voltage drop for this particular section is allowed to be 2 percent?
a. 2 c. 1/0 b. 4 d. 2/0
Figure 21. For use with exercise 18.
2-29

Figure 22. For use with exercise 19.
16. Allowing a 1 percent voltage drop for section CI of the feeder, what size wire will be required?
a. 2 c. 6 b. 4 d. 1/0
17. Section IL of the feeder is the longest, being 450 feet in length. Allowing 1.7 percent voltage drop for this section, what will be the required size wire?
a. 4 c. 8 b. 6 d. 2/0
18. Figure 21 shows the tabulation for the sizes of wire employed for that part of the feeder line running from the generator to point N. Assuming the sizes listed are to be installed, what will be the cumulative percent voltage drop to point N? (Loads are those given in the situation.)
a. 4.2 c. 5.6 b. 4.8 d. 6.6
Fifth requirement. Solve multiple-choice exercises 19 and 20 based on the following situation to show that you understand the principles of branch line design. Situation. Figure 22 is a detail of
group V for which you are to design the branch line. The line will be laid out as shown. The cumulative voltage drop to point N has been computed as 4.95 percent. The demand loads for these buildings are as follows: Building Demand KVA 23 .117 24 .204 25 .117 26 1.062 27 .117
19. What is the equivalent distance from the branch line in feet for this group of buildings?
2-30

a. 197 c. 328 b. 248 d. 393
20. Assuming the equivalent distance to be 308 feet and the demand load for section V to be
1.65 KVA, what wire size will you specify for this branch? (Use data provided in situation of both Fourth and Fifth Requirements.)
a. 2 c. 6 b. 4 d. 8
2-31

LESSON 3
WATER DISTRIBUTION SYSTEMS TEXT ASSIGNMENT --------------------Attached memorandum. MATERIALS REQUIRED -----------------None. LESSON OBJECTIVE -------------------To teach you how to design simple
water distribution systems for theaters of operations.
ATTACHED MEMORANDUM 1. INTRODUCTION The construction and/or operation of
water supply systems in the theater of operations, practically from the front line back, is a function of engineer units. The particular aspect to be considered in this lesson is the design and construction of water distribution systems for TO installations. Only small systems will be designed because of time limitations; however, the principles involved for these small systems can be applied to the design or evaluation of any system. 2. DEVELOPMENT OF COMMON WATER
SOURCES a. Scope. Development of a water source includes all work which increases the quantity and improves the quality of the water, or makes it more readily available for treatment and distribution. The development of surface water sources, springs, sea water sources, and rainwater sources is considered in this lesson. b. Improvements. In developing
a source, dams, floats, galleries, and similar improvements may be used to increase the quantity and quality of the water. Some of the more common improvements are discussed in succeeding paragraphs. c. Precautions. Elaborate developments should be avoided as simplicity brings more rapid results. A temporary water source should not be converted into a permanent one until the area has been reconnoitered for a source requiring less development. All intake hoses or pipes should be equipped with an intake strainer regardless of the clearness of the water source. Suction strainers should be protected from floating debris which may damage, clog, or pollute them. Proper anchorage of suction lines and strainers prevents loss of prime, punctured or kinked lines, and damage to strainer. Figures 1, 2, 6, and 9 show several of the common methods of suction inlet anchorage. d. Intake point. Water at the intake point should be as clear and deep as possible.
3-1

Figure 1. Direct intake with hose on bottom of water source.
Figure 2. Surface intake with hose buried in gravel-filled pit.
3-2

Figure 3. Use of bucket on end of surface intake.
Figure 4. Improvised dam for impounding small streams.
3-3

Figure 5. Baffle dam for protecting inlet strainer.
Figure 6. Float-type surface intake.
3-4

Figure 7. Gravel-filled gallery intake.
Figure 8. Spring inlet.
3-5

The strainer on the suction hose is placed at least 4 inches below the water level. This precaution reduces the possibility of the strainer becoming clogged with floating debris, or the loss of prime owing to air entering the suction line. 3. INLAND SURFACE WATER SOURCES a. Advantages. For normal field water supply, surface water is the most accessible and most easily developed water source. This source also lends itself readily to the purification equipment common to most engineer units. Various methods of constructing intake points for inland surface water sources are discussed in b through g below. b. Rocks and stakes. If the stream is not too swift and the water is deep enough, an expedient intake may be prepared by placing the intake strainer on a rock. This will prevent clogging of the strainer by the streambed and provide enough water overhead to prevent the suction of air into the intake pipe. If the water source is a small stream or shallow lake the intake pipe can be secured to a post or pile as shown in figure 1. c. Pits. When a stream is so shallow that the intake screen is not covered by at least 4 inches of water, a pit should be dug and the screen laid on a rock or board placed at the bottom of the pit. Pits dug in streams with clay or silt bottoms should be lined with gravel to prevent dirt from entering the purification equipment (fig 2). The screen is surrounded by gravel which prevents collapse of the sides of the pit and shields the screen from damage by large floating objects. The gravel also acts as a coarse strainer for the water. A similar method may be provided by enclosing the intake screen in a bucket or other container as shown in figure 3. d. Dams. The level of the water in small streams can be raised to cover
the intake strainer by building a dam as shown in figure 4. In swiftly flowing streams, a wing or baffle dam can be constructed to protect the intake screen without impounding the water (fig 5). e. Floats. Floats made of logs, lumber, sealed cans, or empty fuel drums can be used to support the intake strainer in deep water. They are especially useful in large streams where the quality of the water varies across its width or where the water is not deep enough near the banks to cover the intake strainer. The intake point can be covered by an adequate depth of water by anchoring or stationing the float at the deep part of the stream. The intake hose should be secured to the top of the float, allowing enough slack for movement of the float. If support lines are used to secure the float to the banks, the position of the float can be altered to correspond to changes in depth by manipulation of the lines. The chief advantage of a float intake is the ease with which the screen can be adjusted. Figures 6 and 9 illustrate two types of improvised floats. f. Galleries. Water from muddy streams can be improved in quality by digging intake galleries along the bank. A trench is dug along the bank deep enough so that water from the stream percolates into it to intercept ground water flowing toward the stream. The trench is filled with gravel to prevent the sides from collapsing. The intake strainer is placed in the gravel below the water line (fig 7). The amount of work required to produce the gallery is justified by a reduction in the amount of chemicals needed to coagulate the water, the elimination of the necessity of frequently backwashing the filter, and the higher quality of water obtained. g. Drive points. Many times it is advantageous to utilize shallow ground water
3-6

sources or percolated waters adjacent to a turbid surface water. Well points are issued in 2-inch diameter, 54-inch lengths. A drive cap is placed over the thread and the well point is driven into the ground with a sledge. Successive sections of pipe, each 5 feet long, are added and driven until the screen is well within the water bearing media. Several well points may be connected in parallel to supply sufficient water to the raw water pump. In developing drive point sources, it must be remembered that the pumps issued with field equipment only have about 15 feet of practical suction lift. Pumping water from well points deeper than a maximum of 20 feet is mechanically impractical. 4. SPRINGS a. Development. Springs yielding 20 gallons per minute or more of water can be used as a source of field water supply if properly developed. A common method of development is to enlarge the outlet of the spring and reduce loss of water by damming it and conducting it to storage. To reduce possible pollution, springs should be cleared of all debris, undergrowth, top soil, loose rocks, and sand. b. Collection. Water which flows from rocks under the force of gravity and collects in depressions can be collected in boxes or basins of wood, tile, or concrete. The collecting box should be large enough to impound most of the flow, and should be placed below the ground level so that only the top is slightly above the surface. The box should be covered tightly to prevent contamination and lessen evaporation. The inlet should be designed to exclude surface drainage and prevent pollution. This requires fencing off the area and providing proper drainage. Figure 8 shows a spring inlet which has been protected in this manner. The screen on the overflow pipe prevents the entrance of insects and small animals.
(1) Steep slopes. The flow of water from a spring located on a steep slope of loose earth can be collected by constructing deep, narrow ditches leading from the spring to the point of collection, or by constructing pipeline tunnels from the spring to the collecting point. Large diameter pipe is desirable for this purpose. The water from the tunnels can be trapped by constructing a dam at the point of collection. (2) Digging. Digging is a more positive and more economical method of developing a spring than blasting. The use of explosives in developing the yield from springs should proceed with great caution because blasting in unconsolidated rocks may shift the sand or gravel in such a way as to divert the spring to a different point. 5. SEA WATER SOURCES a. Characteristics. Sea water, as a source, is vastly different in its characteristics, as well as in the methods of purification, from other surface water sources. The chemical characteristics of sea water are such that normal coagulation and filtration are ineffective as treatment processes. The only economical process yet devised to successfully desalt and soften sea water is distillation. Distillation equipment is not normally found in engineer units, but may be requisitioned from engineer depots on a need basis. Relatively high cost and low quantity of distillate production are further limiting factors. Therefore, sea water should be used only when surface or ground sources are unavailable or inadequate to meet demands. b. Development. In developing sea water sources, consideration must be given to such factors as surf action, salt water corrosion, suspended sand and silt in the water, living organisms, surface oil along beaches, and the rise and
3-7

fall of the water level with tide. Distillation equipment located on sheltered bays, harbors, lagoons, or estuaries can be supplied by intakes constructed in the same way as fresh-water surface intakes. On small islands where there is insufficient surface and ground water, and on or near open beaches, intakes for distillation equipment can be constructed as follows: (1) Salt water wells. Beach wells should, If possible, be used in preference to offshore intakes. Wells can be dug to tap fresh or salty ground water. This eliminates the problems caused by tides, surf, and shallow water close to shore. Such wells have an added advantage in that they can be constructed back of the shoreline under natural overhead concealment. Driven and jetted wells may also be used effectively at beach locations. (2) Offshore intakes. Offshore intakes are sometimes required because of lack of time, men, or equipment or because of coral conditions which prohibit well construction. Intakes of either the rigid pipe or float type
may be used but should be located in deep water beyond the surf. They must be positioned vertically and be off the bottom but still beneath the water surface at low tide. In this way foreign materials in the water which might cause excessive wear on distillation equipment will be largely excluded. The rigid pipe type intake can be paced on timber supports and anchored securely in position by piling or riprap. Floats securely anchored can support the intake screen in much the same manner as in surface waters (fig 9). A rubber suction hose can be used to connect the rigid pipe on the sea bottom to the pipe supported beneath the float. 6. RAINWATER a. Quantity. In regions such as tropical islands where there is abundant rainfall and rapid surface runoff, rainwater is the primary source for the inhabitants, however, the quantity of water available may not be sufficient to supply the needs of both the civilian population and the military. Rainwater as a source may be sufficient for small units for limited operations, but
Figure 9. Float type sea water intake.
3-8
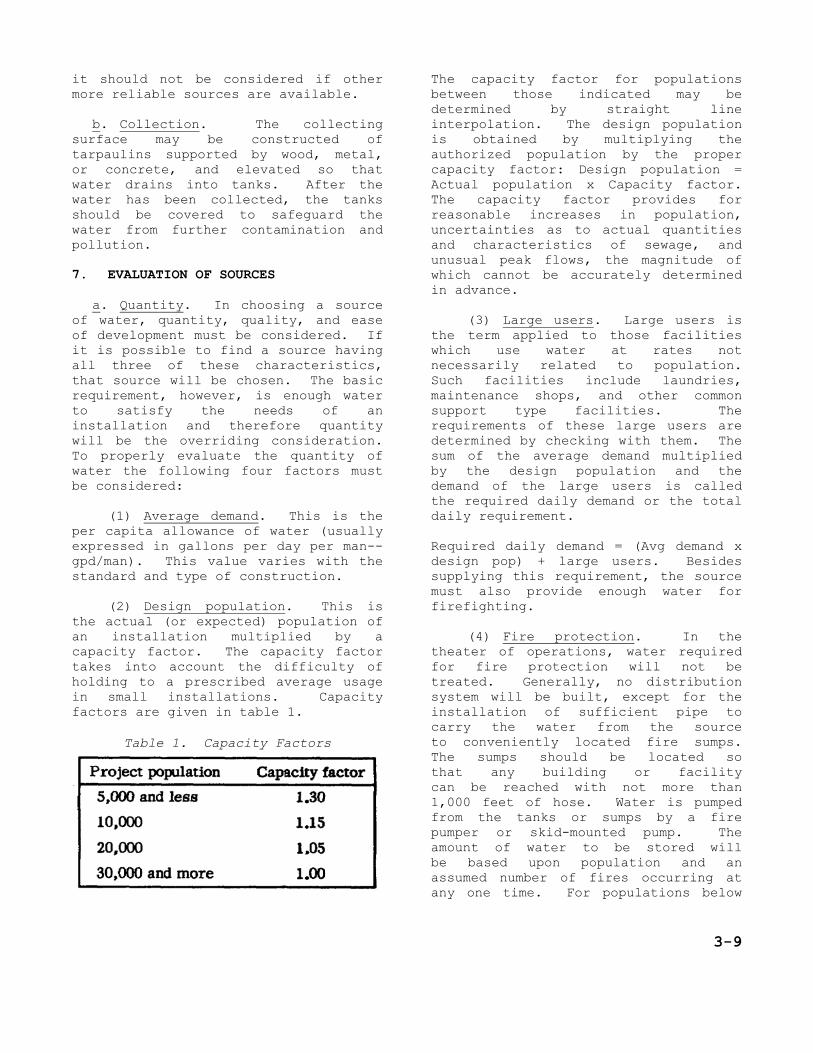
it should not be considered if other more reliable sources are available. b. Collection. The collecting surface may be constructed of tarpaulins supported by wood, metal, or concrete, and elevated so that water drains into tanks. After the water has been collected, the tanks should be covered to safeguard the water from further contamination and pollution. 7. EVALUATION OF SOURCES a. Quantity. In choosing a source of water, quantity, quality, and ease of development must be considered. If it is possible to find a source having all three of these characteristics, that source will be chosen. The basic requirement, however, is enough water to satisfy the needs of an installation and therefore quantity will be the overriding consideration. To properly evaluate the quantity of water the following four factors must be considered: (1) Average demand. This is the per capita allowance of water (usually expressed in gallons per day per man--gpd/man). This value varies with the standard and type of construction. (2) Design population. This is the actual (or expected) population of an installation multiplied by a capacity factor. The capacity factor takes into account the difficulty of holding to a prescribed average usage in small installations. Capacity factors are given in table 1.
Table 1. Capacity Factors
The capacity factor for populations between those indicated may be determined by straight line interpolation. The design population is obtained by multiplying the authorized population by the proper capacity factor: Design population = Actual population x Capacity factor. The capacity factor provides for reasonable increases in population, uncertainties as to actual quantities and characteristics of sewage, and unusual peak flows, the magnitude of which cannot be accurately determined in advance. (3) Large users. Large users is the term applied to those facilities which use water at rates not necessarily related to population. Such facilities include laundries, maintenance shops, and other common support type facilities. The requirements of these large users are determined by checking with them. The sum of the average demand multiplied by the design population and the demand of the large users is called the required daily demand or the total daily requirement. Required daily demand = (Avg demand x design pop) + large users. Besides supplying this requirement, the source must also provide enough water for firefighting. (4) Fire protection. In the theater of operations, water required for fire protection will not be treated. Generally, no distribution system will be built, except for the installation of sufficient pipe to carry the water from the source to conveniently located fire sumps. The sumps should be located so that any building or facility can be reached with not more than 1,000 feet of hose. Water is pumped from the tanks or sumps by a fire pumper or skid-mounted pump. The amount of water to be stored will be based upon population and an assumed number of fires occurring at any one time. For populations below
3-9

6,000, the demand will be based upon the assumption that one fire is occurring at any one time. For a population less than 500, 150 to 250 gallons per minute (gpm) for 2 hours will be adequate; for a population between 500 and 999, 500 gpm for 2 hours; and for a population between 1,000 and 5,999, 1,000 gpm for 4 hours. For a population of 6,000 and over, 1,000 gpm is required for each of two fires, occurring simultaneously, and having a duration of 4 hours. The source, therefore, must be large enough to supply the total daily demand plus the fire protection water necessary for the installation.
b. Quality and ease of development. With the possible exception of wells and municipal supplies, special treatment of the water will probably be necessary to insure portability. Several factors preclude the consideration of some sources. It is not practical, for instance, to purify water containing large quantities of acid mine waste or water excessively polluted with manufacturing wastes or sewage. Having two or more sources capable of giving enough water, the choice of a source can depend on the quality and ease of development of a source. Table 2 gives a tabular evaluation of the five types of sources.
Table 2. Evaluation of Water Sources
8. TREATMENT After the source, the next component
of a water supply system is a treatment plant. The essential characteristics of water for human consumption are that it be free of poisons and free of disease-producing bacteria.
a. Responsibilities for treatment. (1) Engineer units. Engineer units are responsible for making available a supply of approved water for all purposes to all Army units. They are responsible for the design, ocurement, installation, operation,
and maintenance of water supply equipment. They work closely with the Army Medical Service to make certain that water is safe to use.
pr
(2) Army Medical Service. The Army Medical Service determines whether or no water is safe and makes recommendations to the proper authorities. Personnel of the Medical Service inspect water points and sources, test water, and work closely with engineer personnel to make certain that water is treated properly. In addition, the Medical Service studies and makes
3-10

recommendations on the design and selection of water-purification equipment. (3) Chemical units. Chemical units have responsibilities with respect to water supply systems which have been contaminated by toxic agents. b. Treatment processes. Four steps are generally used in the treatment of any water. These are sedimentation, coagulation, filtration, and disinfection. Both of the last two steps, filtration and disinfection, are necessary for the complete treatment of water. The filtering media, however, will rapidly become clogged if the first two, sedimentation and coagulation, do not precede filtration. Thus, all four of these steps are necessary in practice for the complete treatment of water. Either filtration or disinfection, however, without the other steps, will improve water found in natural sources. (1) Sedimentation. Sedimentation is no more than allowing water to stand so that particles heavier than the water itself will settle out. (2) Coagulation. Coagulation takes place when a coagulant (usually alum) reacts with alkalines in the water to form a jelly-like mass. This jelly-like mass, called floc, collects the smaller, lighter particles and the entire mass settles out. Coagulation is normally considered a separate treatment step. (3) Filtration. Filtration through sand, diatomaceous earth, or other filter elements removes additional impurities and some pathogenic organisms. Activated carbon or charcoal used as a filter element will remove undesirable tastes and odors from water. (4) Disinfection. This step in the treatment process is probably the
most important. A chemical agent is added to the water to kill pathogenic bacteria. The chemical is usually chlorine, but iodine may be used. 9. STORAGE The first two parts of a water supply
system are a source and a treatment plant. The third is a storage facility. The storage requirement is simply one half of the total daily requirement.
The total daily requirement is divided by two to reduce the amount of construction effort for the storage facility while still allowing for enough to meet the peak demands without continual operation of pumping and treatment facilities. Once the total storage requirement is found, the water should be stored at two different locations to reduce vulnerability and to allow for repair and cleaning of the tanks without interrupting service. Thus storage is usually best accomplished by using two tanks, each of whose capacity is one quarter of the total daily requirement. 10. DISTRIBUTION SYSTEM The last part of a water supply
system is the distribution system. It can be classified in two ways by the type of energy used to distribute the water, and by the arrangement of the pipes.
a. Classification by energy used. (1) Gravity. An all-gravity system needs a source above the storage facility so that the water from the treatment plant may flow by gravity to storage. The storage facility must again be elevated enough above the users so that gravity may be used again to distribute the water. The
3-11

treatment plant may have pumps in it only to move the water through the plant. This type of system will be rare because of the very favorable elevation relationship required between source, storage, and user. (2) Direct pumping. Direct pumping systems have no elevated storage, so the water must be pumped to the ground storage reservoir and pumped from the reservoir to the user. Since the user may need water at any time, continuous pumping is necessary. (3) Combination of gravity and pumping. A combination of the two systems mentioned above is probably the most common system. This, generally, will utilize low-lift pumps to move water from a source through the treatment plant, and high-lift
pumps to move the water to elevated storage tanks from which the water moves by gravity through the distribution system. Because the water moves through the distribution lines due to gravity, continuous pumping to storage is not necessary. A combination system may have a layout similar to that shown in figure 10. b. Classification by pipe arrangement. The network for distribution should be arranged with large primary mains feeding smaller secondary pipes. Branches or feeders carry water from mains to service connections where service pipes carry water from the branch to the building. (1) Loop system. The loop system is one in which the ends of all the supply
Figure 10. Layout of a combination water system.
3-12

Figure 11. Loop system.
Figure 12. Dead end system.
lines are connected so the water will continuously flow while it is being drawn from any point on the loop. This system is less vulnerable to breakdowns since valves may be located to reroute the flow of water and isolate relatively small trouble areas (fig 11). (2) Dead end system. The dead end system is one in which there are direct lines from the mains to the outlet without the interconnected lines as in the loop system. Because less construction effort and materials are required, the dead end system is the type most often used in TO construction (fig 12). Since the loop system is so seldom used in TO construction, its design is not
covered in this course. However, the design for a dead end system may be used as an expedient for designing a loop system, although this will result in an overdesigned system. 11. FLUID FUNDAMENTALS a. Pressure. Pressure is defined as the force per unit area.
Its units are usually pounds per square inch, but they could be any force unit per area. b. Atmospheric pressure. Atmospheric pressure varies slightly from time to time depending on weather and elevation
3-13

above or below sea level. Except in computations requiring extreme accuracy it is assumed to be 14.7 pounds per square inch (psi). Any time a pressure value is given, some datum value is stated or implied. In water distribution, atmospheric pressure is used as a datum so that all pressure values given are the value above or below atmospheric pressure. Any pressure value given with atmospheric pressure as a base is called a gage pressure. All references to pressure in this course are to gage pressure. c. Head. A pressure exists at the service connection (outside water connection at the building) in a gravity water distribution system because the storage tank is elevated above the building. The higher the tank above the building the greater the pressure will be. Thus it can be seen that there is a relationship between difference in elevation and pressure. From a above, pressure is defined as the force per unit area. For water under static conditions (no flow) this force is the weight of the water and the resultant pressure is due to this weight acting on an area. Since 1 cubic foot of water weighs 62.4 pounds (density = 62.4 pounds per cubic foot) the pressure exerted by a
1-foot cube of water is P =
or 62.4 pounds per square foot. Converting to pounds per square inch
gives psi. Next consider a
right circular cylinder of cross sectional area “A” (square feet) and height “h” (feet), and a fluid of specific weight (weight per unit volume) “w” (pounds per cubic foot). The pressure on the base can be
expressed as pounds per square
foot. Converting this to psi gives P
= psi. For water, P = h =
0.433h, which of course agrees with the pressure computation for the 1-foot cube above. For fluids other
than water, the pressure becomes P = 0.433ah where “a” is the specific gravity of the fluid (ratio of its weight to the weight of an equal volume of water). Since the only fluid considered in this course is water (specific gravity of 1), the equations become:
Thus a column of water 20 feet high exerts a pressure at the base of (20 x 0.433) = 8.66 psi. Similarly a pressure of 20 psi is equivalent to 20 x 2.31 = 46.2 feet of water. This amount of pressure is available only if the water is not flowing, since if the water flows some head will be lost due to friction. The design problem then becomes the choosing of a pipe large enough so that after the friction losses are removed the pressure left will be enough to service the building. 12. DISTRIBUTION SYSTEM DESIGN There are generally five steps in the
design of a distribution system:
a. Locate the lines. b. Check for excess pressure. c. Determine peak demand. d. Calculate allowable headloss. e. Determine pipe size and actual headloss. The last step might be considered to be two separate steps but they are done at the same time and so will be considered as one step. 13. LOCATION OF LINES Topographic maps of the physical location
of the supply lines and the buildings
3-14

assure the designer there will be no point along the line where the hydraulic gradient will fall below the required head at the outlet. In the theater of operations, construction lines are normally located adjacent to roadways with a minimum number of crossings so that repair of the lines will not affect traffic. 14. CHECK FOR EXCESS PRESSURE For standard pipe, the maximum
pressure allowed anywhere in the line is 100 psi. A check must be made at low points in a water line to insure that the pressure does not exceed 100 psi. If the pressure does exceed 100 psi, stronger pipe must be used or a different layout determined. The pressure at any point in the system can be found by the following expression:
Pressure = 0.433 (E1Tk - El of point). E1Tk is the elevation of the storage tank. El of point is the elevation of the point in question. For the pressure to be greater than 100 psi, the difference in elevation must be as follows: 100 = 0.433 (E1Tk - El of point).
Therefore, any pace where the line is more than 231 feet below the tank, the pressure, discounting friction losses, will exceed 100 psi. This type of static pressure check must be made for every system to insure that the static pressure in the line does not exceed the safe working pressure of the pipe. 15. PEAK DEMAND a. The source size and storage size were computed using the average demand. The design of the distribution system, however, is based on the peak demand to insure that
adequate pressure will be available even when a facility is drawing its maximum flow (peak demand). At military installations there are essentially three times each day when the peak demand will be approached. These times are in the morning when the troops arise and breakfast is prepared, at midday when troops have returned to the barracks for the noon meal, and in the late afternoon, at the end of the duty day. Unless the population exceeds 1,000 men, the flow rates in the mains and branches are found by summing the peak demands of the facilities serviced by the line under consideration. If the population exceeds 1,000 men and there are large users, this simple addition of peak demands may be too high since the peak demands may not occur at the same time. In such a case, savings in construction requirements can be made by determining when the peaks occur and using an adjusted peak demand based on engineering judgment and experience. b. The peak demand of a facility depends on the number of outlets and showers (fig 13). (Any water fixture other than a shower is considered an outlet.) If there are no showers in the facility, only the left column in figure 13 need be used. The peak demand, in this case, is found on the right side of the column opposite the number of outlets found on the left side. If there are both showers and outlets, the peak demand is found by connecting the number of outlets on the left column and the number of showers on the right column with a straight line. The peak demand is read at the intersection of the straight line and the center column. 16. ALLOWABLE HEADLOSS a. Definition. As the name implies, allowable headloss is the maximum amount of head which may be lost to friction between the storage tank and the facility under consideration. Thus, pipe sizes must
3-15

Figure 13. Nomograph for total peak water demands.
3-16

be chosen so that the total headloss in the mains, branches, and hose connection feeding a facility is less than the allowable. To calculate the allowable headloss the elevation of the storage tank, the elevation of the service connection, and the amount of pressure (required head) desired at the service connection must be known. These elevations can be determined from existing drawings or a survey can be run to establish them. They will be expressed in feet above a common datum. For a storage tank, the floor elevation is used, so that when the tank is close to empty the design pressures will be still available. The amount of pressure or required head will be specified in the job directive for a water system, or, if not specified, will be 20 psi for theater of operations construction. This pressure of 20 psi at the service connection will allow a working pressure of at least 5 psi at outlets within the facility being served. b. Calculation. Allowable headloss can be found by use of the following expression: Allowable Hf = ElTk -(ElSc + Hreq) where Hf is the headless. ElTk is the elevation of the tank in feet. E1Sc is the elevation of the service connection of the facility in feet. Hreq is the required head at the service connection. The required head is the required pressure at the service converted into feet of head of water. It can be found by use of the following relationship: Hreq = Preq x 2.31 The allowable headloss must be calculated for each facility rather than be determined for a point on the main or branches.
17. PIPE SIZE AND ACTUAL HEADLOSS The last step in the water
distribution system design is the choosing of pipe sizes. They must be chosen so that the allowable headlosses are not exceeded by the friction losses in the pipe and fittings. If the length of the system exceeds 1,000 feet, the effect of fittings becomes negligible. If the line is not that long, the headloss in the fittings must be considered. Fittings are considered by use of figures which give a conversion from a particular fitting to a length of pipe which has the same resistance as that fitting. The pipe is then considered to be longer than it actually is, and this extra length exactly makes up for losses in the fittings. These figures will not be considered further in this course. The first step in pipe selection is the choice of pipe sizes for mains, which must be assumed. Normally three or four sizes will be tried for each section of main and a combination of sizes will be selected so that main headlosses will be low enough to allow additional losses in the runs from points on the mains to the service connections. The actual headlosses can be determined in three ways: (1) the equation of continuity and the Hazen-Williams formula, (2) figure 14, (3) figure 15.
a. Equations. The actual headloss in a pipe can be calculated quite accurately by the use of the equation of continuity and the Hazen-Williams formula. Their use is beyond the scope of this course. b. Headloss by figure 14. Figure 14 is a nomograph from which the headloss per 1,000 feet of pipe may be read. Figure 14 applies only for a coefficient of friction (c) of 100, the value normally used for design. The value of c runs from 60 for old, tuberculated pipe to 140 for new cast iron pipe. The left column is the flow rate, the second column the nominal pipe diameter,
3-17

Figure 14. Nomograph for determining pipe flow, friction loss, and velocity.
3-18

Figure 15. Nomograph for calculating pipe size, discharge, and head loss.
3-19

and the third column the headloss per 1,000 feet of pipe. Knowing any two of these, the third can be found by drawing a straight line through the two knowns. As an example, assume 100gpm is flowing through a 1,000 foot long pipe of 4-inch diameter. Draw a line passing through 100 gpm on the left column and 4 inches on the second column. Extending the line, a headloss of about 12-1/4 feet per 1,000 feet of pipe is obtained. This compares very well with values obtained by calculation. c. Headloss by use of figure 15. Figure 15 gives the headloss per 1,000 feet of pipe for any C from 70 to 160. The left column is the coefficient of friction, the second column is headloss per 1,000 feet of pipe, the third column is a pivot line, the fourth column gives the pipe diameter, and the right column gives the flow rate. The chart is used by drawing two straight lines intersecting at the pivot line. One of the lines intersects the two columns to the left of the pivot line, while the other intersects the two columns to the right. The same example will be used. 100 gpm flows in a 1,000 foot long pipe of 4 inch diameter. The coefficient of friction is 100. The values of the two right columns are known, so a straight line is drawn through 100 gpm and 4-inch diameter pipe. This line is extended to intersect the pivot line. The second line must pass through this point, so the second line is drawn through the intersection point on the pivot line and through C = 100 on the left column. The headloss per 1,000 feet of pipe can be read at the intersection of the second line with the headloss column. A value of 12-1/4 is obtained. This is shown by the solid line on the figure. A second example of the use of this nomograph is given with the figure. The headloss in the mains can be found by use of any one of the above methods. After having determined the actual headlosses in the various sections of e mains, the actual headloss, from
storage to a point on the main where a branch is connected, is subtracted from the allowable headloss to the service connection at the end of the branch. This will give the allowable headloss in the branch. Then, entering the nomograph with this headloss and the peak demand (flow) at the service connection, the diameter of pipe required can be obtained. As stated before, the nomograph gives headloss per 1,000 feet of pipe, so conversions between the actual length of pipe and these values must be made. If the pipe size obtained is one which is not available, use the next larger size which is available. Then, entering the nomograph with the flow rate and the selected pipe size, find the actual headloss per 1,000 feet. Convert this loss to the loss for the length of the branch. The headloss in the branch, plus the headloss in mains to the point where the branch connects to the main, will give the cumulative headloss from storage to the service connection. This cumulative headloss must not exceed the allowable headloss.
th
18. SYSTEM DESIGN PROBLEM To illustrate the application of the
design steps explained above, a sample water distribution system will be designed for the following situation: A QM depot in a theater of operations must have a water distribution system. Preliminary studies indicate the following:
a. A troop strength of 50 officers and 700 EM. b. Average water demand: 25 gpd/man. c. Laundry water requirements: 47,000 gpd. d. Sketch of system layout is shown in figure 16. Numbers underlined are lengths of lines, numbers in parentheses ( ) are service
3-20
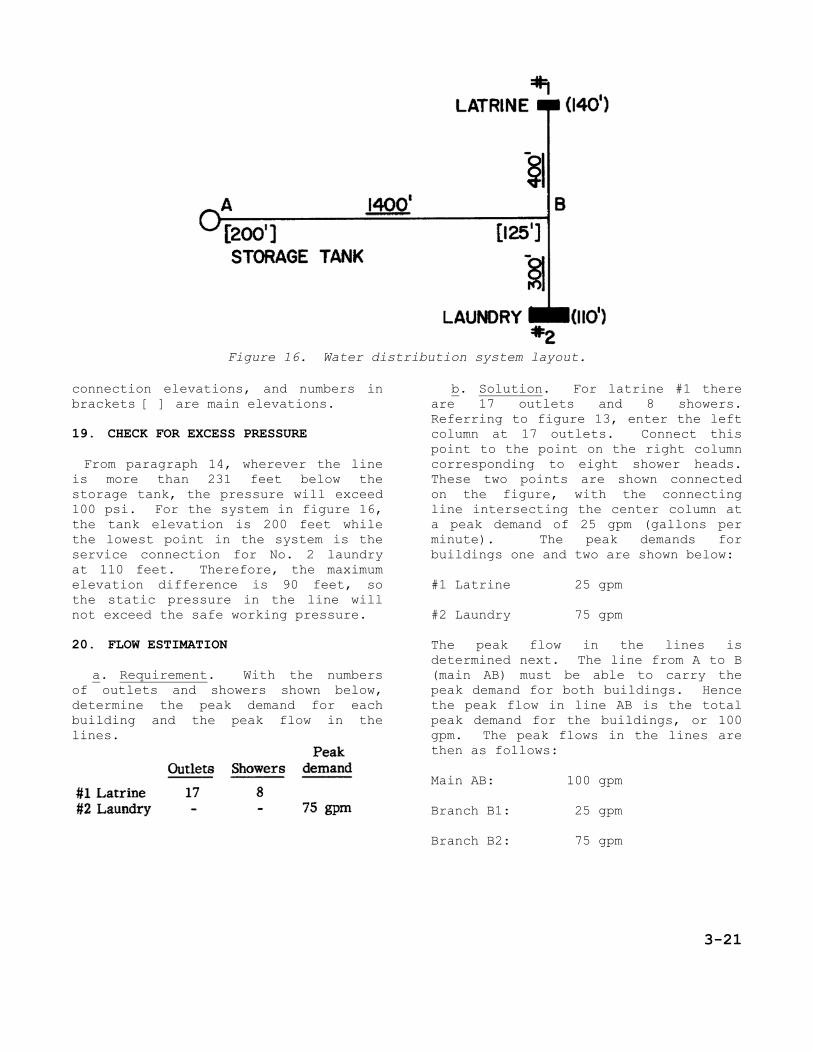
Figure 16. Water distribution system layout.
connection elevations, and numbers in brackets [ ] are main elevations. 19. CHECK FOR EXCESS PRESSURE From paragraph 14, wherever the line
is more than 231 feet below the storage tank, the pressure will exceed 100 psi. For the system in figure 16, the tank elevation is 200 feet while the lowest point in the system is the service connection for No. 2 laundry at 110 feet. Therefore, the maximum elevation difference is 90 feet, so the static pressure in the line will not exceed the safe working pressure. 20. FLOW ESTIMATION a. Requirement. With the numbers of outlets and showers shown below, determine the peak demand for each building and the peak flow in the lines.
b. Solution. For latrine #1 there are 17 outlets and 8 showers. Referring to figure 13, enter the left column at 17 outlets. Connect this point to the point on the right column corresponding to eight shower heads. These two points are shown connected on the figure, with the connecting line intersecting the center column at a peak demand of 25 gpm (gallons per minute). The peak demands for buildings one and two are shown below: #1 Latrine 25 gpm #2 Laundry 75 gpm The peak flow in the lines is determined next. The line from A to B (main AB) must be able to carry the peak demand for both buildings. Hence the peak flow in line AB is the total peak demand for the buildings, or 100 gpm. The peak flows in the lines are then as follows: Main AB: 100 gpm Branch B1: 25 gpm Branch B2: 75 gpm
3-21

21. SAMPLE PROBLEM - ALLOWABLE HEADLOSS
a. Requirement. Determine the allowable headloss Hf in the lines Al and A2 to provide at least 20 psi at the latrine service connection and at least 30 psi at the laundry service connection. b. Solution. In paragraph 16b the allowable headloss was given as Allowable Hf = E1Tk - (E1Sc + Hreq) where the required head is equal to the required pressure in psi times 2.31, for water. The allowable headloss to each building is then calculated as follows: Hf Al = 200-[140' + (2.31 x 20 psi)] = 13.8' Hf A2= 200–[110'+ (2.31 x 30 psi)] = 20.7' The allowable headloss is determined for the service connection only, and not points on the main. 22. SAMPLE PROBLEM - PIPE SIZE AND
ACTUAL HEADLOSS a. Requirement. Select the pipe sizes and determine the actual headloss for the system. Assume that C = 100, and that pipe is available in 2-, 3-, 4-, 6-, 8-, 10-, and 12-inch diameter sizes. b. Solution. First the section of main from A to B will be considered. The flow is 100 gpm; the length 1,400 feet. From paragraph 17, the pipe size for the mains must be assumed. Two, three, four, and six-inch pipe will be tried. On figure 14, 100 gpm in the left column is connected to 4 inches in the second column. The line is extended to intersect the third column as shown on the figure. From the intersection of this line and column three, the headloss per 1,000 feet of pipe is read as 12.5 feet. Since the length of this section is 1,400 feet, the actual headless HfAB is 3-22
feet. In the same manner, the head loss is determined for the 2-, 3-, and 6-inch diameter pipes. (1) Main AB. Flow = 100 gpm, length = 1,400 feet.
The 2- and 3-inch pipes can be eliminated at this point, as the headlosses produced at peak flow exceed the maximum allowable from point A to any point in the system. The 4-inch pipe can be eliminated as the headloss from A to B is greater than the maximum allowed from A to building one. (2) Branch B1. The actual headloss to point B is now known for the size of pipe under consideration. The pipe size for the branch line B1 can now be found. The total allowable headloss from point A to building 1 was computed as 13.8 feet. The actual headloss from A to B was found to be 2.4 feet if 6-inch pipe is used. This leaves 13.8 - 2.4 = 11.4 feet as the maximum that can be lost from point B to building No. 1 if 6-inch pipe is used on the main AB. The length of the branch B1 is 400 feet. If 11.4 feet is the largest allowable loss for 400

feet, then feet is the
largest allowable loss per 1,000 feet of pipe. From figure 14, a flow of 25 gpm and a headloss of 28.5 feet per 1,000 feet require a minimum diameter of 1.9 inches. The next larger size available is 2-inch pipe. In the same manner, the pipe size could be determined for the branch B1 if other pipe sizes were used or considered on the main AB.
28.5, 2-inch diameter pipe required
on branch B1. (3) Branch B2. Flow = 75 gpm, length = 300 feet, allowable Hf = 20.7 feet.
From figure 14, 3-inch pipe is required. At this point, the final sizes for AB, B1, and B2 have been selected. If a choice of two or more sizes existed for main AB at this point, it would be resolved as follows: Since AB is considerably longer than either B1 or B2, the smaller of the possible sizes would be used on AB as this would require considerably less pipe by weight.
23. STORAGE a. Requirement. Determine the potable water storage requirement for the QM depot. b. Solution. From paragraph 9, Storage requirement = 1/2 (Avg Demand x design pop + Large users). Design population = Actual population x capacity factor. Here, actual population = 50 officers + 700 EM = 750 total. From table 1, for 5,000 people or less, the capacity factor is 1.30. Therefore: Design population = 750 (1.30) = 975 Storage requirement 1/2 [(975 x 25) + 47,000] = 35,688 gallons. The water would probably be stored in two tanks of approximately equal size. Naturally an actual distribution system would be far more complex than the one used in this example. If there were more sections of main beyond point B, the headloss from A to B would have to be added to the headloss from point B to any other point in the system. With this exception, the same design steps would be applied that were applied in designing this water distribution system.
EXERCISES First requirement. Multiple-choice
exercises 1 through 6 are designed to test your knowledge of common water sources.
1. The intake point for a water supply system should be as clear and deep as possible. To prevent
air from being drawn into the suction line, at what minimum depth in inches should the auction hose be located below the water level?
a. 2 c. 4 b. 3 d. 5
3-23

2. After being assigned the project of installing a water point for your battalion you find that the only source of water in your area is a stream which is muddy. What type of intake point will you install?
a. pit c. float b. dam d. gallery
3. Springs, if properly developed, can often be used as a source of field water supply. What minimum yield, in gallons per minute, should a spring produce to warrant consideration?
a. 10 c. 30 b. 20 d. 40
4. When surface or ground water sources are unavailable or inadequate to meet demands, sea water must occasionally be used. What treatment process will be required to desalt and soften the water?
a. coagulation b. distillation c. filtration d. sedimentation
5. Even in tropical regions, where rain water is the primary source of inhabitants, why should it not be considered as a military source if other sources are available?
a. insufficient quantity b. difficult collection c. expensive treatment d. variable quality
6. Which of the characteristics of a water supply source is considered the most important when choosing a source location for a water supply point?
a. quantity of water b. ease of development c. quality of water d. atomic vulnerability
Second requirement. Multiple-choice exercises 7 and 8 cover the treatment and storage of water.
7. Of the four steps generally used in the treatment of water, which two are absolutely necessary?
a. sedimentation, coagulation b. sedimentation, filtration c. filtration, disinfection d. coagulation, disinfection
8. What potable water storage capacity in gallons will be required for 10,000 men using 25 gallons per day per man if there are no large users?
a. 78,700 c. 115,800 b. 95,450 d. 143,750 Third requirement. Solve multiple-
choice exercises 9 and 10 to show what you have learned about system classification and fluid fundamentals.
9. Why is the dead end type water distribution system preferred in TO construction over the loop type, when the loop type has several more advantages ?
a. ease of construction b. reliability c. ease of maintenance d. sanitation
10. If a fluid has a density of 85.0 pounds per cubic foot, what height column, in feet, would be required to exert a pressure of 14.7 pounds per square inch at the base?
a. 20 c. 30 b. 25 d. 35 Fourth requirement. In multiple-
choice exercises 11 through 20 you are to apply what you have learned about water distribution system design.
3-24
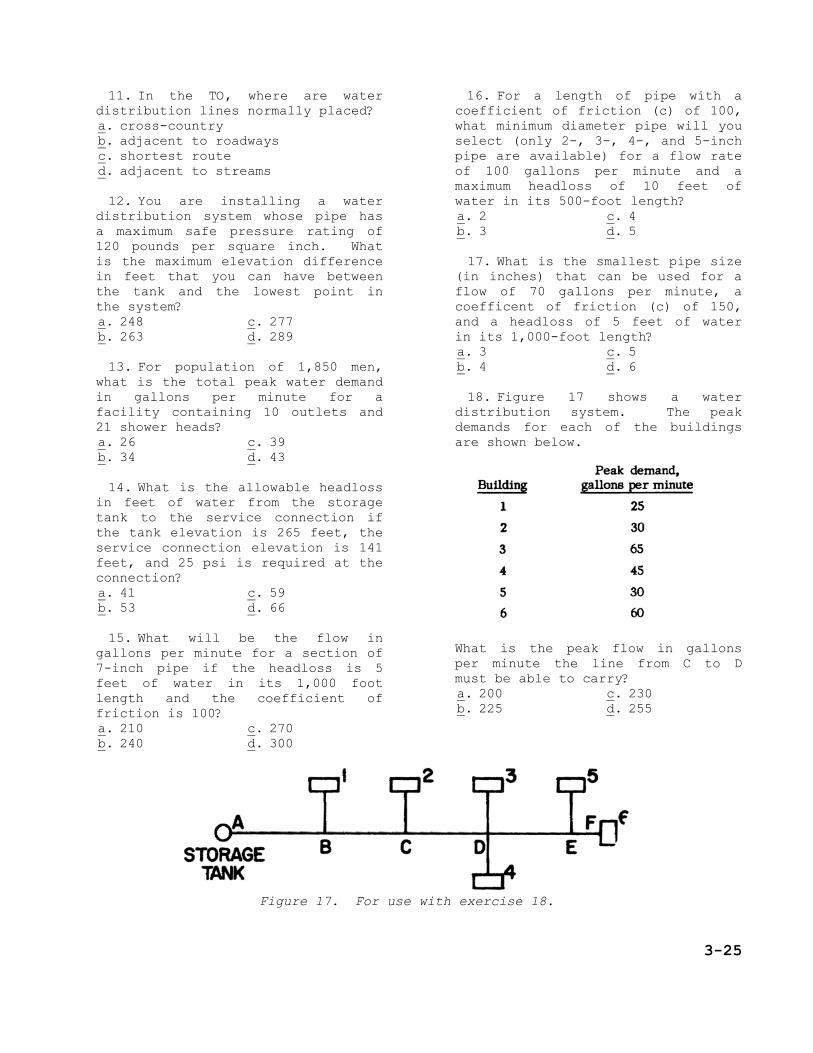
11. In the TO, where are water distribution lines normally placed?
a. cross-country b. adjacent to roadways c. shortest route d. adjacent to streams
12. You are installing a water distribution system whose pipe has a maximum safe pressure rating of 120 pounds per square inch. What is the maximum elevation difference in feet that you can have between the tank and the lowest point in the system?
a. 248 c. 277 b. 263 d. 289
13. For population of 1,850 men, what is the total peak water demand in gallons per minute for a facility containing 10 outlets and 21 shower heads?
a. 26 c. 39 b. 34 d. 43
14. What is the allowable headloss in feet of water from the storage tank to the service connection if the tank elevation is 265 feet, the service connection elevation is 141 feet, and 25 psi is required at the connection?
a. 41 c. 59 b. 53 d. 66
15. What will be the flow in gallons per minute for a section of 7-inch pipe if the headloss is 5 feet of water in its 1,000 foot length and the coefficient of friction is 100?
a. 210 c. 270 b. 240 d. 300
16. For a length of pipe with a coefficient of friction (c) of 100, what minimum diameter pipe will you select (only 2-, 3-, 4-, and 5-inch pipe are available) for a flow rate of 100 gallons per minute and a maximum headloss of 10 feet of water in its 500-foot length?
a. 2 c. 4 b. 3 d. 5
17. What is the smallest pipe size (in inches) that can be used for a flow of 70 gallons per minute, a coefficent of friction (c) of 150, and a headloss of 5 feet of water in its 1,000-foot length?
a. 3 c. 5 b. 4 d. 6
18. Figure 17 shows a water distribution system. The peak demands for each of the buildings are shown below.
What is the peak flow in gallons per minute the line from C to D must be able to carry?
a. 200 c. 230 b. 225 d. 255
Figure 17. For use with exercise 18.
3-25

19. A section of main in a water distribution system you are designing is 1,200 feet long and must carry a peak flow of 200 gallons per minute. Among the sizes you try is 6-inch pipe. What will be the headloss in feet of water for this 6-inch section of main? (Assume C = 100)
a. 6.8 c. 7.8 b. 7.2 d. 8.2
20. You are designing a water distribution system, and need to decide on the pipe size required
for a branch. The peak demand for the building served by the branch is 70 gallons per minute, its length is 350 feet, and the allowable headloss between the storage tank and the service connection is 25 feet of water. The headloss in the main between the storage tank and the branch line is 11 feet of water. What pipe size (in inches) will you specify? (Assume C = 100)
a. 3 c. 5 b. 4 d. 6
3-26

LESSON 4
SEWAGE COLLECTION AND DISPOSAL TEXT ASSIGNMENT --------------------Attached memorandum. MATERIALS REQUIRED -----------------Figures 14, 16, and 18. LESSON OBJECTIVE -------------------To teach you how to design sewage
systems in the theater of operations.
ATTACHED MEMORANDUM 1. INTRODUCTION This lesson covers design and
maintenance of sewage systems and treatment facilities. In a theater of operations, engineer units are responsible for waste disposal when waterborne sewage-disposal systems are practical and authorized. Decision as to whether waterborne sewage collection is practical depends on the theater construction policy, type of installation, and anticipated period of use. In the absence of sewer facilities, initiation and enforcement of suitable sanitary measures are the responsibility of unit commanders. Medical units are responsible for investigating, reporting and making recommendations on all matters affecting the health of Army personnel. 2. TYPES OF SEWAGE a. Sewage is simply the liquid conveyed by a sewer. It may consist of any one or a mixture of sanitary sewage, industrial waste, storm sewage, or infiltration. Sanitary sewage (also called domestic sewage) is that sewage which originates in the
sanitary conveniences of houses, barracks, shops, and the like. Industrial sewage is the waste from an industrial process such as dyeing, brewing, or papermaking. Storm sewage is the water and particles carried due to rainfall. Infiltration is the ground water and particles which leak into a sewer through joints or breaks. In TO construction, generally only infiltration and sanitary sewage are allowed in the sewage system. Unpolluted waste water, such as that used for cooling and air conditioning, should not be discharged into sanitary sewers, and wastes from hydraulic gasoline dispensing systems, wash racks, garages, and shop floor drains also should be excluded. Waste from laundries, however, is usually discharged into the TO sewer system. Other types of industrial waste may be discharged into the system, depending upon their effect on sewer pipe material and sewage treatment processes. b. Storm water runoff from ground surface, pavements, and roofs should not be permitted to enter a sanitary sewer except
4-1

under rare conditions, even in cases where the pumping or treatment of sewage is not involved. It is difficult to obtain flow conditions in combined sewers that would be adequate during dry weather to prevent the deposit of sewage solids in the sewer and subsequent septic action, while in wet weather a considerably larger pipe would be required for combined sewers than for sanitary sewers alone, requiring greater installation costs. 3. CHARACTERISTICS OF SEWAGE a. Physical characteristics. Sewage is composed of 99.8 to 99.9 percent used water. Thus only 0.1 to 0.2 percent of sewage is solid matter. Of this solid matter, 40 to 70 percent is organic matter which will putrefy and cause offensive odors. The rest is inorganic matter which is usually odorless. b. Chemical characteristics. Sewage contains substances of animal, vegetable, and mineral origin. The first two are called organic matter and are composed largely of the elements carbon, oxygen, hydrogen, and nitrogen. c. Biological characteristics. Biological organisms may be helpful, harmful, or neutral. The harmful ones are those which are pathogenic, or disease-producing. The diseases carried in sewage are those normally called 'waterborne diseases' such as typhoid fever, cholera, and dysentery. Fortunately, pathogenic organisms decrease rapidly in sewage where the favorable conditions and abundant food supply provided by the human body have been removed. The ingestion by predatory protozoa, lack of suitable food in treated sewage, and disinfection by chemicals and the sun's rays also help to remove the pathogenic bacteria. The helpful organisms are those used in the treatment of sewage. Neutral organisms are neither disease
producing nor useful in treatment of sewage. 4. STRENGTH OF SEWAGE The final products of sewage
decomposition are compounds formed by oxidation of the original raw sewage components. Thus the amount of oxygen used in the decomposition of a sample of sewage may be taken as a measure of the amount of decomposable organic matter present in the sewage, and therefore of its strength or polluting power.
a. BOD. The biochemical oxygen demand (BOD) is a measure of the polluting power or strength of sewage. BOD is the amount of oxygen required for the biological decomposition of dissolved organic solids to occur under aerobic (dissolved oxygen always present) conditions. The BOD of military sewage is usually taken as 0.20 pounds of oxygen per person per day. b. Determination. As with any biologically activated process, BOD varies with time and temperature. The standard BOD value is given as oxygen demand per unit (parts per million or occasionally, pounds per person) in 5 days at 20 degrees centigrade. This is not meant to say that the biochemical oxygen demand is satisfied in 5 days, but only that a longer test period becomes impractical. 5. TREATMENT In the TO the purpose of sewage
treatment is to eliminate to the extent necessary the disease producing bacteria and to stabilize the sewage to the extent required by the sewage disposal method. Thus the purpose of sewage treatment in the TO is not to purify the sewage, but rather to treat the sewage so that the disposal media's stabilizing ability will no be exceeded. The Medical Corns is responsible
4-2

for determining the amount and type of treatment which is required. 6. PRIMARY TREATMENT Primary treatment is the separation
of the suspended solids from the liquid and the treatment of these solids.
a. Screening. A bar screen (fig 1) is used to screen larger particles such as rags, rocks, and sticks from the sewage. Bar screens are usually required before pumping stations and treatment plants. The bar screen is constructed of bars installed longitudinally in a channel 1 to 1/2 inches apart (clear measurement), and should have a slope of about 1:2. One-inch screens collect 1 to 3 cubic feet of screenings per million gallons
of sewage. The screens should also be constructed with an overflow chamber to prevent stoppages. b. Settling tanks. Plain settling tanks (fig 2) permit settling of the suspended solids by detaining the sewage in the tank long enough and at low enough velocity to permit sedimentation. The settled solids are removed and put in a facility for decomposition. A settling tank does not treat the solids but only separates them from the liquid. c. Digestion tanks. Raw sludge from settling tanks may be discharged into sludge digestion tanks for septic decomposition. The solids, when first deposited in the tank, form a thin, low density sludge. As decomposition progresses, digested
Figure 1. Bar screen.
4-3

Figure 2. Settling tank.
material settles to the bottom. As the depth of sludge increases, the solids in the bottom compact. Thus the sludge in the tank varies greatly in fluidity from top to bottom. The rate at which digestion and the resulting changes in fluidity take place depends on temperature and alkalinity. (1) Capacities. Separate sludge digestion tanks should provide 3 cubic feet per capita in plants that do not return the sludge from final settling tanks either to the plain settling tank or directly to the sludge digestion tank and 4.5 cubic feet per
capita for plants that return the sludge. In tropical climates or in installations having sludge-heating facilities, tank capacity may be reduced to two-thirds of the above volumes. Sludge tanks are preferably 15 to 25 feet deep, but practical considerations may limit the depth to 10 to 15 feet. (2) Design. The simplest type of digestion tank is an uncovered earth basin which receives the settled sludge from the settling tank by gravity flow. Digested sludge is drawn off at the bottom, which
4-4

Figure 3. Imhoff tank.
4-5

should be cone or hopper shaped to facilitate the outflow of sludge. Concrete lined tanks are preferred, although brick or stone masonry, gunite, sheet-metal, or wood tanks may be used. In firm ground such as clay, an unlined pit from which the sludge and liquid are removed by pumping may be feasible. The scum and hard mat that forms on the surface should be broken up and forced down into the sludge. d. Imhoff tanks. An Imhoff tank is a combined sedimentation or settling tank and digestion tank (fig 3). It consists of an upper compartment for settling out solids from slowly flowing sewage and a lower compartment for septic digestion of the sludge. The upper compartment forms a channel with an approximately 8-inch slot in the bottom. Sides of the slot have a 1 horizontal to 1-1/2 vertical slope and are overlapped to prevent gases formed by digesting sludge from escaping into the upper or “flowing-through” compartment. With an average flow, solids settle in the upper compartment in 2 to 2-1/2 hours, pass downward through the slot, and settle to the bottom of the lower compartment where they are digested. Accumulated solids are removed periodically through a sludge drawoff pipe having its inlet about 1 foot above the tank bottom. Design of the upper or “flowing-through” compartment is based on the retention period. The lower or digestion compartment is designed to hold 3 cubic feet per capita below a plane 18 inches beneath the bottom of the slot. If sludge from secondary settling is returned to this compartment for digestion, the capacity of the compartment must be increased to 4-1/2 cubic feet per capita. e. Sludge drying beds.
(1) Lagoons. Sludge from Imhoff and digestion tanks can be disposed of in lagoons or can be dried on natural or artificial beds. Sludge
lagoons should be about 6 feet deep and large enough to provide a 6-month storage capacity, equal to about 4 cubic feet per capita. The sludge is removed from the lagoons by hand or by mechanical loading equipment and buried. Lagoons are discussed more fully in paragraph 8a.
(2) Drying beds without drains. Natural sludge drying beds without underdrains are constructed by building earth dikes. They should provide 3 to 4-1/2 square feet of surface per capita, depending on climate and permeability of the soil. Liquid sludge from the digestion tank is applied about 12 inches deep. When dried, it contains about 65 percent moisture and forms a cake about 4 inches thick. This cake is removed with a fork or shovel and can be used as humus. (3) Drying beds with drains. Underdrain sludge drying beds (fig 4) consist of a surface layer of sand 6 to 12 inches thick, a 6- to 12-inch layer of gravel below the sand, and underdrains below the gravel layer. The underdrains should be 4- to 6-inch open joint or perforated pipe spaced 10 to 20 feet apart and should be laid in a V-shaped trench and surrounded with coarse gravel. The required area of a sludge bed is 1 to 1-1/2 square feet per capita with a maximum length of about 100 feet. The bed is subdivided into sections by wood or masonry curbs spaced midway between the drainpipes. Characteristics and handling of sludge are the same as for natural beds. Drying requires 2 to 4 weeks, depending on humidity and rainfall. Sand removed with the sludge must be replaced when the thickness of the sand layer is reduced to 4 inches. f. Septic tanks and cesspools. For small numbers of people, suspended sewage solids can be removed and digested in a septic tank or cesspool. Although they become more inefficient as the numbers
4-6

Figure 4. Sludge drying bed with drain.
of people increase, a septic tank may serve the sanitary sewage needs of up to about 100 people, and a cesspool about 50. The difference between the septic tank (fig 5) and the cesspool (fig 6) is that the septic tank is watertight while the cesspool allows its water to leak out. (1) Operation. As the sewage enters, the heavier solids settle to the bottom of the tank, forming a blanket of sludge. The lighter solids, including fats and grease, rise to the surface and form a layer of scum. A considerable portion of the sludge is liquefied through this process by decomposition. During this process, gas is liberated from the sludge, carrying part of the solids to the surface where they accumulate with the scum. Ordinarily, they undergo further digestion and a portion settles again to the sludge blanket on
the bottom. This action is retarded if there is much grease in the scum layer. It is also retarded by the formation of gas in the sludge blanket. (2) Size. The septic tank capacity should be about two-thirds of the average daily flow. This will give a nominal 16-hour retention time. For required capacities of less than 500 gallons, cesspools of the computed size should be substituted for septic tanks. Septic tanks are usually rectangular in shape, the length being two to three times the width. Depth varies from 4 to 12 feet. 7. SECONDARY TREATMENT Secondary treatment is the treatment
of the effluent (liquid) from the primary treatment facility.
4-7

Figure 5. Septic tank.
Figure 6. Cesspool.
4-8

Figure 7. Dosing tank.
a. Dosing tank. Most of the methods of secondary treatment use aerobic bacteria. Because of this, some of the secondary treatment processes must have the liquid applied in doses or intermittently. This will allow oxygen to get to the bacteria between doses. A dosing tank with an automatic siphon is usually built as a part of the primary facility to do this. It discharges the effluent from the primary treatment facility at intervals and provides the hydraulic head. The size of the dosing tank is 80 percent of the treatment facility it is to serve. The action of the dosing siphon is as follows (fig 7): As liquid rises in the dosing tank, air trapped in the dome covering the outlet siphon is compressed and forced downward through the shorter leg. Further rise in liquid level forces the air around the bend, allowing it to escape through the longer leg. Water rushing into the dome to replace this air starts siphon operation, which continues until the liquid level drops below the bottom rim of the dome, breaking the siphon action and stopping the flow. Adjustment in
flushing head is made by changing the length of the nipple on the air vent or overflow pipe. b. Trickling filter. Trickling filters, often called sprinkling filters, are beds of crushed rock, crushed slag, or gravel. Primarily treated sewage is applied through rotary distributors or stationary sprays to the surface (fig 8). The sewage then trickles in a thin film over the stones to a system of underdrains. These beds are not actually filters in the usual sense, but accomplish their function in the treatment of sewage mainly through the action of oxidizing bacteria of the aerobic type. There are different theories regarding the chemistry of this action, but whatever the chemistry may be, the effect is that dissolved and suspended organic matter in the sewage is absorbed by bacterial growth on the stones and converted to more stable compounds. Some of these compounds coagulate and settle in the final settling tank. Others are soluble and pass on with the final effluent sewage. The two main
4-9

types of trickling filters are standard or low rate, and high rate. The application of sewage at higher rates and the recirculation of a portion of the effluent constitute the principal difference between the operation of a high rate filter and that of a standard rate filter. (1) Design procedure. The size of the filter bed is determined on the basis of about 0.35 cubic yard
of stone per capita. Desirable hydraulic head between the lowest liquid level in the dosing chamber and the center of the rotary distributor arm is 10 to 12 inches. If sprinkler nozzles are used, head should be sufficient to discharge the maximum flow at the low water level in the dosing tank. This usually requires a 6- to 10-foot head from the high water level in the dosing tank to the
Figure 8. Trickling filter.
4-10

sprinkler nozzle outlet. Crushed stone is the best filter material, but gravel, coke, clinker, broken brick, or slag can be used. To permit maximum voids for passage of sewage and air for ventilation, filter material should be reasonably uniform in size. 1-1/2- to 2-1/2-inch stone is best. The filter layer should be 5 to 8 feet deep. Underdrains may be either whole or half tile laid with open joints, or a grillage of 2- by 4-inch timber laid on edge. The underdrain system must be constructed so all parts of the filter bed are ventilated. (2) Operation. Settled sewage must be distributed evenly over the filter surface. Rotary distributors are generally used. The force of the spray leaving the distributor causes it to rotate, spreading the flow evenly over the surface of the bed. Recovery periods should about equal discharge periods. c. Final settling tank. The effluent from trickling filters should be passed through final settling tanks to remove the bacterial gel which forms on the filter stone and peels off into the effluent. Sludge obtained from final settling tanks is about one-half the volume obtained from primary settling tanks. It can be run directly to drying beds or preferably returned to the digestion tank. Final settling tanks should be large enough to provide a 2- to 2-1/2-hour detention period at the average rate of flow. The sludge should be removed daily to prevent septic action. The slope of the hopper bottom is 1 to 1 or steeper. Water depth of final settling tanks (measured at the side) should not be more than 10 feet. Other details of construction are the same as for plain settling tanks. d. Sand filter. Sand filters are more truly filters in the usual sense than trickling filters. They are beds of specially selected sand about 3 feet thick. The sewage is applied uniformly over the entire surface to a
depth of 3 to 5 inches. As it trickles through the sand, fine suspended solids are filtered out and dissolved organic matter is removed through the action of bacteria living in a gelatinous growth on the surface of the sand. This type of filter usually produces as high a degree of treatment as can be obtained by biological processes, but is often uneconomical for large installations because of the maintenance required. (1) Design. The design can be based on 60,000 gallons of effluent per acre of sand surface per day. The sand is uniformly graded .01- to .05-inch sand. The sand beds are usually 2 to 4 feet deep. The siphons and distribution system should be designed for a dosing rate of 0.1 gallon per minute per square foot of sand surface. Splash plates are required at the discharge to the sand to prevent erosion. Joint tile or perforated pipe drains surrounded by gravel are spaced on 12-foot centers. (2) Operation. As the settled sewage seeps through the sand, most of the fine suspended matter stays on the surface or adheres to the grains near the surface. For this reason, the top layer of sand must be scraped off occasionally. The dissolved organic matter in the liquid is oxidized by the action of the aerobic bacteria in the bed. At least 16 hours are needed between dosings to allow the sewage to percolate through the bed and to permit air to fill the voids in the sand. For continued operations, the filter should be divided into three or more sections. e. Oxidation pond. An oxidation pond (fig 9) is a relatively large, shallow pond, either natural or artificial, into which settled sewage is discharged for natural purification under the influence of sunlight and air. These ponds should be located one-half mile or more from the nearest housing to prevent objectionable odors from reaching it. The ponds are not practical where the temperature is below
4-11
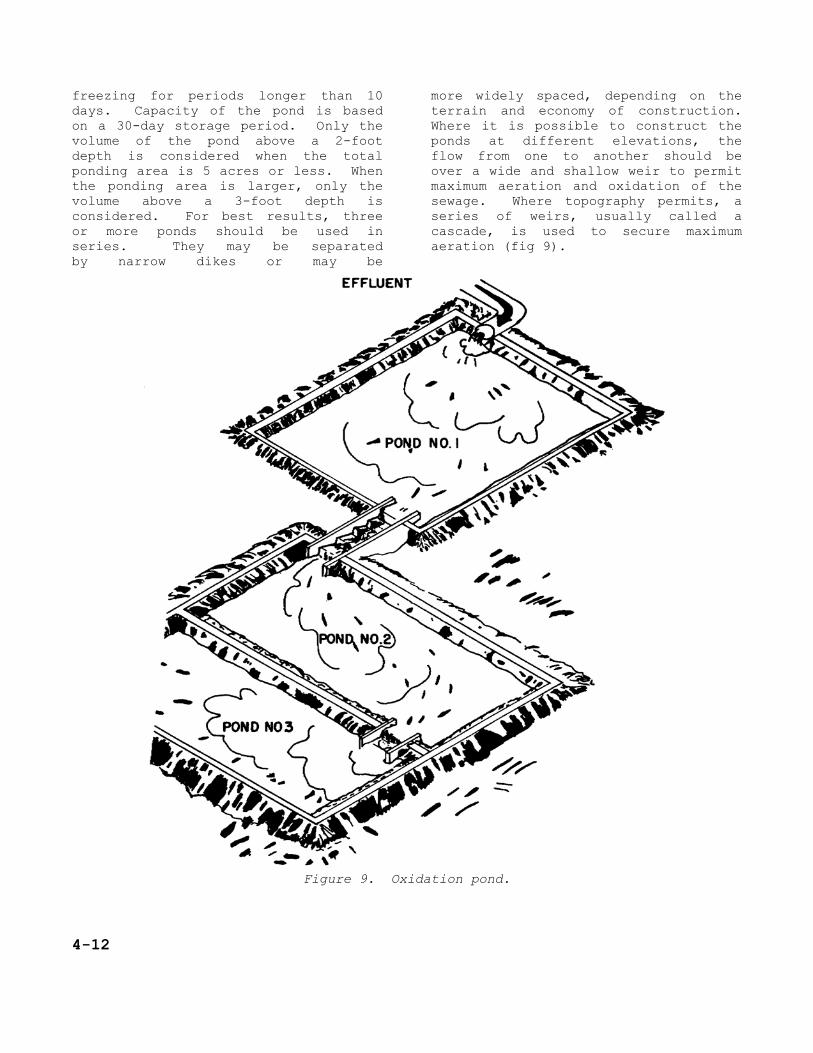
freezing for periods longer than 10 days. Capacity of the pond is based on a 30-day storage period. Only the volume of the pond above a 2-foot depth is considered when the total ponding area is 5 acres or less. When the ponding area is larger, only the volume above a 3-foot depth is considered. For best results, three or more ponds should be used in series. They may be separated by narrow dikes or may be
more widely spaced, depending on the terrain and economy of construction. Where it is possible to construct the ponds at different elevations, the flow from one to another should be over a wide and shallow weir to permit maximum aeration and oxidation of the sewage. Where topography permits, a series of weirs, usually called a cascade, is used to secure maximum aeration (fig 9).
Figure 9. Oxidation pond.
4-12

f. Activated-sludge process. The activated-sludge process works by diffusing air into a tank of primary effluent. Large numbers of aerobic bacteria can live in the effluent and decompose the organic matter, creating large amounts of sludge which settle to the bottom. Because of the large amount of aerobic bacteria present, it is called activated sludge. Some of this activated sludge is introduced into the incoming primary effluent to keep the process self-sustaining. The activated-sludge process has not proved to be as efficient in treating sewage at Army plants as in municipal plants where the contributing population is less subject to sudden and wide fluctuation. However, where local conditions are such that trickling filters would not be practical, consideration may be given to the use of this process. Because of the considerable amount of construction effort, specialized equipment, and constant supervision which is necessary, this process will not be covered further in this course. g. Chemical treatment. Disinfectants, such as liquid chlorine or calcium hypochlorite, may be added to sewage in emergencies to safeguard health and prevent odor and fly nuisances. They are sometimes used during periods of low stream flow when there is not enough stream water for proper dilution. They also may be used when a part of a plant is bypassed during cleaning or a breakdown. Since chlorine kills bacteria it will greatly decrease the decomposition rate of the sewage therefore delaying the BOD. It sometimes is used to delay the demand for oxygen until the sewage reaches a body of water large enough to provide the oxygen required. It is effective also in killing disease-producing organisms if the contact period and the chlorine concentration are sufficient and if all particles are finely enough divided to permit chlorine contact. Should conditions
be such that there is a possibility of contaminating a water supply with raw sewage, provisions should be provided for chlorinating at a rate of 200 pounds per million gallons at the 4-hour peak rate of sewage flow. (The 4-hour peak rate is considered to be 175 percent of the average daily rate of flow.) In other cases where chlorination is required, provisions should be made for chlorination at a rate of 125 pounds per million gallons at the 4-hour peak rate of sewage flow. Chlorine can be applied by mechanical chlorinators or by an improvised drum chlorinator. 8. COMPLETE TREATMENT Most of the treatment processes
mentioned above require a considerable amount of engineer effort to construct. A simply designed, easy to construct facility for complete (both primary and secondary) treatment of sewage is available. This facility is a lagoon and is very much like an oxidation pond. The lagoon system is the recommended means under most circumstances for providing adequate sewage disposal by military engineers under theater of operations conditions.
a. Lagoons. In its simplest form, the lagoon is a relatively large, shallow pond, either natural or artificial, into which raw sewage is discharged for natural stabilization under the influence of sunlight and air. The size of the lagoon depends on the amount of BOD which can be handled per acre of lagoon. This value has been quoted from 15 pounds per acre to 80 pounds per acre. It has become generally accepted that a figure of 40 pounds per acre is sufficiently accurate. Military sources assume a BOD loading of 0.2 pounds per capita per day. Based on this figure and the requirement of 1 acre per 40 pounds of BOD, a figure of 1 acre for every 200 persons should be used in the design of lagoons.
4-13

(1) Construction. The secondary treatment by lagoons is accomplished naturally if three conditions can be met: (1) depths in lagoons must be kept from 2 to 5 feet for optimum results; (2) normal sunlight and winds must be kept available on the pond surface by keeping heavy timber or brush removed to a distance of 300 feet from the water's edge; and (3) influent and effluent piping must be located to minimize short circuiting within the lagoon. (2) Operation. The successful secondary treatment afforded by lagoons is based on two phenomena. If ample dissolved oxygen is available, bacteria will aerobically attack the organic matter in the sewage and rapidly convert it to more stable forms, liberating nutrients, particularly carbon dioxide. Secondly, algae and other multicell plants grow very rapidly in shallow ponds if suitable nutrients, particularly carbon dioxide and sunlight, are available. The algae, with aid of light by a photosynthesis process, utilize the carbon dioxide and liberate oxygen thus maintaining aerobic conditions for the bacteria. Under normal operating conditions the sewage lagoon combines the above two principles to the degree that the discharged effluent will compare favorably in suspended solid and biochemical oxygen demand reduction with the most efficient conventional sewage treatment system. The use of sewage lagoons by small civilian communities in the United States seeking an efficient and economical means of sewage treatment has grown considerably in recent years. Lagoons are not recommended for military units operating under arctic conditions, because if the surface of the pond is frozen too long it prevents efficient algae photosynthesis. b. Effluent disposal. Once the treatment process has been carried out to the degree necessary, the effluent must be disposed. The three basic
methods of disposing of the effluent are dilution, evaporation, and irrigation. (1) Dilution. Dilution is the process of adding liquid waste to a body of water. At the present time, it is the most common method of disposal. (2) Evaporation. In the evaporation method, which is sometimes used, large surface areas of sewage are exposed to the air. Since the effluent is 99.8 percent water, it easily evaporates. The process is limited to arid climates since climate variations (rain, cold, and so on) do not permit the process to take place. The evaporation process also usually takes place to a limited extent in a lagoon or oxidation pond, although this is not the primary disposal method in these systems. (3) Irrigation. The third method of disposing of the effluent is by irrigation, that is, the spreading of the polluted water onto or through soil. As in the dilution method, irrigation allows some purification although this is not its primary function. The irrigation may be either surface or subsurface. 9. SEWAGE COLLECTION SYSTEMS a. Grease traps. The presence of grease in sewage is the cause of one of the most serious difficulties in sewage treatment. Where sewage is discharged into a stream without treatment, grease film on the surface of the water retards reoxygenation. Therefore, it is necessary to remove as much of the grease as feasible. In order to prevent the deposit of grease on the walls of the sewer, and also to preserve the salvage value of the grease, removal at the source is advisable. At installations this is usually done by grease traps (fig 10). b. Cover. Pipe cover should be at least 2 feet over the crown of the pipe to protect
4-14

Figure 10. Grease trap.
the pipe from the superimposed live loads of ordinary traffic, and 4 feet for heavy trucks (fig 11). Where frost penetrates to considerably greater depths than this and lasts for an appreciable time, greater depths below the frost line should be provided. Depths of excavation will be determined by equipment capabilities.
Figure 11. Pipe cover.
c. Building connections. Building connections should be planned to eliminate as many bends as practical to provide convenience in rodding when required. Generally, connections of building sewers to other sewers should be made directly to the pipe with commercially manufactured fittings rather than through manholes. Manholes may be used, however, if no extra expense would be incurred, and they should be used if the connection is more than 150 feet from the nearest cleanout. Where the cleanout inside
the building would not be adequate for complete rodding, outside cleanouts, or manholes if cleanouts are not feasible, should be provided. For most TO installations 4-inch diameter sewers on a 1-percent slope will provide adequate capacity. The minimum slope required can be found by using the design procedure given below. Except where frost or load conditions prevail, 1 foot of cover will be sufficient for building connections. d. Manholes. Manholes are required at the end of laterals and at each change of direction, slope, or pipe size except for building connections. The distance between manholes should not exceed 400 feet in sewers of less than 18 inches in diameter. For sewers of 18-inch pipe or larger and for outlets from sewage treatment plants, a spacing of 600 feet may be used provided that the velocity is sufficient to prevent sedimentation. The crown of the outlet pipe from a manhole should be on line with or below the crown of the inlet pipe. Where conditions are such as to produce unusual turbulence in the manhole and especially where the outlet pipe is to be
4-15

Figure 12. Sewerage system worksheet.
4-16

a smaller size than the inlet pipe due to a more favorable slope, it maybe necessary to lower the invert to the pipe to provide for entry head or increased velocity head or both. With this exception, the practice of lowering the invert of the outlet pipe to theoretically compensate for entry head and similar losses in the manhole is of questionable value from a practical point of view. Where the invert of the inlet pipe would be more than 18 inches above the manhole floor a drop connection should be provided. e. Drop manholes. The only difference between the standard and drop manhole is the difference of elevation above the bottom of the manhole of the inverts of the entrance and exit pipes. The drop manhole is utilized to reduce velocities, clear obstacles, and reduce construction effort for ditching along laterals and common sewers. f. Lampholes. If the only reason for placing a manhole is that is 400 or 600 feet from the last one, and if the velocity is at least 3 feet per second, then lampholes may be substituted at every other manhole location. Lampholes are only large enough to permit lowering a lamp to give light for sewer inspection. g. Pump stations. Pumping should be avoided in the design of a collection system unless analysis of the initial and operating costs conclusively indicate it would be more practical than gravity flow, with due consideration given to the situation which might result from pump failure. 10. SEWER DESIGN The steps in designing a sewer system
are as follows:
a. Determine sewer layout. b. Locate manholes. c. Determine flow rates.
d. Determine slope. e. Choose pipe size. f. Check actual velocity. g. Determine invert elevations. In order to simplify this process a worksheet such as the one in figure 12 should be used. A profile of the sewer system should be drawn as the design proceeds. These steps will be discussed in turn. 11. SEWER LAYOUT DETERMINATION The development of final sewer plans
must await the final site plan, the completion of field surveys, and to some extent, the establishment of floor grades. However, the development of economical site plans often requires concurrent preliminary planning of the sewer system.
a. Location. The location of lateral and branch sewers will depend not only upon topography but upon the type and layout of the housing to be served. Normally, the most practical location would be along one side of the street. In other cases they may be located behind the buildings midway between streets. In closely built-up areas and particularly where the street is very wide or already paved, it may be advantageous and economical to construct laterals on each side of the street. Main, trunk, and outfall sewers should follow the most feasible route to the point of disposal. All sewers should be located outside of roadways as much as practicable so that the number of roadway crossings is reduced to a minimum. A sewer from one building should not be constructed under another building or remain in service where a building is subsequently constructed over it if any other practical location for the sewer is available. Where no other location is suitable, necessary measures should be taken to assure accessibility for future excavation and complete
4-17

freedom of the sewer from superimposed building loads. b. Safety precautions. The following safety precautions must be strictly observed in the sewer layout. No physical connections shall exist between sewer and water supply systems. Sewers and water lines shall be at least 5 feet apart horizontally. Where conditions require a sewer to cross above g water line, the sewer should be constructed of cast iron, steel, or other pressure pipe for 10 feet each side of the crossing and preferably without a joint in the sewer pipe coming immediately above the water pipe. At crossings of force mains or inverted siphons and water lines, the sewer in all cases shall be at least 2 feet below the water line. 12. MANHOLE LOCATION The second step is to locate manholes
at the ends of laterals, changes in pipe direction, intersections of sewers, and 400 or 600 feet from the nearest manhole. Thus the only manhole location criteria which cannot be exactly considered yet are change in pipe size and slope. However, a change in pipe size or slope can usually be made to occur at manholes already located. Thus, almost invariably, changes will not be necessary in manhole location. Manholes must be located before the rest of the design can be accomplished since the design method involves finding the pipe size and slope from manhole to manhole. Once the layout is determined and the manhole locations chosen, each lateral, branch, and main can be designed. It is probably easiest to start with the smallest sewers and work up to the mains. 13. FLOW RATE DETERMINATION a. Flow rate. The flow rate between manholes will be the sum of the flow into the upper manhole, sewage from any house connections
between manholes, and infiltration into the sewer. It is assumed that this total flow will exist through the whole section of sewer between the manholes. Of course this is not true if a house connection exists somewhere along the line. Referring to figure 13, the flow between manhole 2 and the place where the house connection meets the sewer is 125 gallons per minute plus some amount of infiltration which shall be neglected. The flow in the sewer from the connection to manhole 3 is 200 gallons per minute. Thus in designing the sewer from manhole 2 to manhole 3, 200 gallons per minute would be assumed to flow in the whole section. If the flow in the house connection is small compared to the flow in the sewer, the effect will be small and thus can be neglected. If the flow in the house connection is large compared to the flow in the sewer, a change in pipe size or slope will be necessary and therefore a manhole must be used where the sewer and house connection meet. Placing a manhole there removes the problem. Finally, if the flow is neither negligibly small nor so large that a manhole is necessary, the sewer should be designed for both flow rates. If one pipe size at a given slope will give an acceptable velocity for both flow rates then that design is acceptable for the complete sewer section. If one pipe size at the same slope will not give an acceptable velocity for both flow rates, then either the pipe size or the slope must be changed at the house connection to the sewer and a manhole placed there. b. Quantity of flow. The peak sewage flow from a TO facility will be assumed to be 70 percent of the peak water demand for that facility. The peak flows from all facilities will be assumed to occur at the same time. Thus, the peak flow in a sewer will be the summation of the peak flows from all sewers and house connections tributary to it. Besides this flow, there will be some increase in flow due to infiltration. If nothing is known of the area, a
4-18

Figure 13. Section of collection systems.
figure of 2 gallons per minute per 1,000 feet of sewer may be assumed for infiltration. Of course if any information on infiltration in the area is available from other sources (such as sewer systems already in operation nearby) then that value should be used. 14. SLOPE DETERMINATION Since the easiest excavation is along
the natural ground slope, the sewer system is most easily placed along the slope of the ground. This slope is usually used as a first estimate for a pipe slope. If this slope is unacceptable (usually because it is obviously too small or too great, or because it does not give an acceptable velocity) a new slope must be tried. It is often at this point that drop manholes should be considered. 15. PIPE SIZE Once a slope is chosen, the pipe size
necessary can be determined by use of formulas or charts. The formulas that are most commonly used for sewer design are Kutter's formula and the Manning formula. The form of the Manning formula is somewhat simpler, but the results less accurate for pipe sizes smaller than 12 inches. Figure 14 is a pipe-flow chart based on Kutter's formula. It should be understood that this chart is for pipes running full. The left and
right hand sides of the chart are flow rates. MGD stands for million gallons per day, gpm is gallons per minute, and cfs is cubic feet per second. Along the top and bottom of the chart is slope in feet per hundred which is also percent. Inside the chart are lines moving up and to the right. These lines are different pipe sizes and range in size from 4-inch to 48-inch diameter. The lines perpendicular to the pipe size lines are velocity lines and range from 1 foot per second (fps) to 12 feet per second. The pipe chosen must handle at least as great a flow at the chosen slope as the actual flow found in 13b. To find a pipe size which will do this, enter the chart on the left or right side at the actual flow rate. Draw a horizontal line until the chosen slope is intersected. The pipe size below this point of intersection is too small. The pipe above this point must be used. As an example, find a pipe size to handle an actual flow of 300 gallons per minute at 1-percent slope. Enter the chart at 300 gallons per minute on the right and move horizontally to the left until the 1-percent slope line is intersected. The point of intersection is above the 6-inch diameter pipe and below the 8-inch pipe. Therefore, 6-inch pipe cannot handle 300 gallons per minute at a 1-percent slope and 8-inch diameter pipe must be used.
Figure 14. Pipe flow chart (issued as separate item).
4-19

The minimum sizes which may be used for TO construction are 4-inch diameter pipe for a house connection and 6-inch diameter pipe for any other sewer.
16. ACTUAL VELOCITY
The acceptable limits for the sewage velocity are 2 feet per second to 10 feet per second. Velocities lower than this will tend to deposit solids in the sewer and velocities higher will scour out the invert of the sewer. Occasionally a choice is forced upon the designer of using a lower velocity than 2 feet per second or of putting in an automatic lift station. If it can be shown that the costs incurred in keeping the sewer clean, and perhaps replacing it, are cheaper over the design life of the system than the procurement and maintenance cost of the lift station or other special facility, then the actual velocity may be decreased to 1.5 feet per second at peak flow. There are five steps to finding actual velocity.
a. Full flow. The full capacity of the sewer is found by entering the chart at the given slope and moving all the way up to the chosen pipe size. Moving horizontally to the right from this point the full capacity can be read. Continuing the example started above, the chart is entered at the 1-percent slope line. Moving up to the 8-inch line and reading to the right, a full flow of 500 gallons per minute is obtained.
b. Velocity at full flow. The velocity at full capacity is found by entering the chart at the design slope. Move up vertically until the design pipe size is intersected. (This point of intersection is the same point found in a above.) Through this point draw a line parallel to the velocity lines. Knowing the velocity value of the line above and below, an estimate of the velocity value of the new line can be made. This is the velocity at full flow. For the example above, the chart is entered at
1 percent. At the intersection of the 1-percent line and the 8-inch diameter line, a line is drawn parallel to the velocity lines. The new line lies between the line of 3 feet per second and 3.5 feet per second. Its value is 3.2 feet per second.
c. Discharge ratio. The discharge ratio is the ratio of the actual discharge (flow) (QA) to the full discharge (Qc). Thus the discharge ratio is found by dividing the actual flow by the full flow. For the example started above the actual flow is 300 gallons per minute and the full flow is 500 gallons per minute.
Therefore the discharge ratio is
d. Velocity ratio. The velocity ratio is the ratio of the actual velocity (Va) to the velocity at full flow (Vc). Since Va is not known yet this cannot be found by division. The velocity ratio is found by use of figure 15. The chart is used by entering along the top or bottom at the value of the discharge ratio. Move vertically along the discharge ratio value until the discharge curve is intersected. From this point move horizontally to the right until the velocity curve is intersected. At this point move vertically up or down and read the velocity ratio at the top or the bottom of the chart. Continuing the example, the chart is entered along the bottom at the value of discharge ratio 0.6. Moving up to the discharge curve, across to the velocity curve, and down to the bottom, a value of 1.045 is read. Thus the velocity ratio is 1.045. The only case where this method of using figure 15 gives an incorrect answer is when the discharge ratio is 1.0. However, when this is the case the actual velocity must be equal to the full flow velocity because the pipe is flowing full. Since the velocities must be equal, the velocity ratio is 1.
e. Actual velocity. The velocity ratio is the actual velocity divided by the full
4-20

Figure 15. Proportionate flow chart.
flow velocity. Therefore the actual velocity can be determined by multiplying the velocity ratio by the full velocity. Continuing the example, the full flow velocity was found to be 3.2 feet per second and the velocity ratio 1.045. Therefore the actual velocity will be (3.2 x 1.045) = 3.34 feet per second. The actual velocity must be between 2 and 10 feet per second. If lampholes are to be used, then the velocity must be at least 3 feet per second. f. Invert elevations. Invert elevations can be determined once the slope is known. The elevation of the
invert at the lower manhole is the elevation of the invert of the upper manhole less the product of the slope multiplied by the length of the sewer between manholes. The invert elevations of the upper manhole will be known for each section except the first. The invert at the first manhole will usually be made as close to the ground level as possible while still maintaining adequate cover. 17. SAMPLE DESIGN PROBLEM Figure 16 shows a plan view
and profile of an area for which a sewage collection
Figure 16. For use with sample design (issued as separate item).
4-21

Figure 17. Sanitary system data sheet.
4-22

system will be designed. The first sewers to be designed will be the house connections using figure 14. a. Building A to manhole (MH) 8. The values are tabulated in row 1 of the data sheet (fig 17). The ground slope of 2 feet in 75 is used as a first try. With a 4-inch house sewer (the minimum size allowable) a full flow of 127 gallons per minute is obtained. This is less than the actual flow and therefore is unacceptable. The two choices now available are to increase the slope and keep the 4-inch pipe size, or increase the pipe diameter. To get a 200 gallons per minute full flow in a 4-inch sewer the slope must be 6.8 percent. This means a 5.1-foot drop over the 75 feet. This would put the invert at manhole 8 about 5-1/2 feet (3.1 slope difference + 2 cover + about 1/2-foot pipe width) below ground. The sewer would start this low and probably go lower, necessitating much excavation. Thus the better choice is to go to a 6-inch house sewer which will allow a much smaller slope. The design with a 6-inch sewer is shown in row 2, figure 17. The invert elevation at the building had to be chosen. It was made to be 2-1/2 feet below the ground elevation. This will allow 2 feet of cover over the 1/2-foot pipe. Thus the invert is 302 - 2.5 = 299.5 feet. The invert elevation at manhole 8 is then 299.5 less than the 2-foot drop in the pipe or 297.5 feet. b. Connections to MH 7-1. For the line from building B to MH 7-1, the ground slope of 1 foot in 40 is tried
as the pipe slope. This gives an acceptable velocity in a 4-inch pipe. The invert elevation is chosen 2.4 feet below the ground at building B. This gives 2 feet of cover over the 4-inch (approximately .4 feet) sewer. The design is tabulated in row 3, figure 17. For the line from building C, the ground slope of 1 foot in 30 was used. Its design parallels that of building B and is tabulated in row 4. c. Connections to MH 7. The design of the lateral between MH 8 and MH 7 is shown in row 5. Note that in this length of pipe infiltration can no longer be ignored. A figure of 4 gallons per minute per 1,000 feet has been used. The ground slope of 1 percent is used and the minimum sewer size of 6 inches is tried. The actual velocity is 2.83 feet per second. The invert of the outflow sewer at manhole 8 must be at least 2.5 feet below ground level or at or below the invert of the incoming sewer, whichever is lower. Therefore, 297.5 is used. The invert of the sewer at manhole 7 is 4 feet lower or 293.5 feet. The sewer is sketched on the solution drawing, figure 18. The only difference between the method used in the design of the lateral from MH 7-1 to MH 7 and any of the previous ones is a slope of 4.55 percent instead of the ground slope of 4.5 percent. This slight increase is due to going from 4-inch to 6-inch pipe at manhole 7-1. An elevation of 302.6 less a ground drop of 9 feet cannot be used because this would not provide 2.5 feet of ground above the invert at the end of the lateral. The data is shown in row 6.
Figure 18. Sample design solution (issued as separate item). d. Main from MH 7 to MH 4. It can be seen from the profile that the sewer between MH 7 and MH 6 cannot be placed at the same slope as the ground starting at the elevation of the inlet invert at MH 7. If this were done there would not be sufficient cover in the center. Two solutions are
available. One would be to start as above but increase the slope so that sufficient cover can be had. This will necessitate deep excavation. As an example, the dotted line in the solution could be followed. Another solution is available, however. That is to drop the outlet of manhole 7 and
4-23

then use a smaller slope. This elevates the end of the sewer above that obtained by the first method. Since in this case the second method necessitates less excavation, it will be used. The best way to determine the amount of drop to be used is to work backwards using the profile and charts. The first step is to draw in a tentative invert. This invert should be drawn so that it gives minimum cover at the lower manhole and at the greatest slope consistent with cover requirements between manholes. The second step is to find the minimum slope which will give a full flow equal to the actual flow and a velocity greater than 2 feet per second. In this case a flow of 329 gallons per minute in an 8-inch pipe, a slope of 0.45 percent is necessary and a velocity of 2.25 is obtained from figure 14. Whichever slope is greater should be used. In this case the first condition gives a greater slope. The design is tabulated in rows 7 and 8. In row 7 a 6-inch pipe was tried and the minimum slope that could be used was 1.67. This is too small for 6-inch pipe. With 6-inch pipe, the minimum slope to get a flow of 329 gallons per minute was 2.2 percent. This might be acceptable for this section but certainly is not for the rest of the sewer. Note that the slope of the ground is about 1 percent from MH 7 to the lagoon. Since 6-inch pipe will need at least 2.2 percent slope to handle the flow, the 6-inch pipe would have to go deeper and deeper. Eight-inch pipe can handle the flow with a slope of less than 1/2 percent and thus can follow roughly the ground slope. For this reason a change to 8-inch pipe was made at manhole 7. The design from MH 6 to MH 5 is straight forward and is tabulated in row 9, figure 17. The design from MH 5 to MH 4 is also straight forward and is tabulated in row 10. Notice that a lamphole can be used instead of manhole 5 as all the conditions for a lamphole are fulfilled. e. MH 4 to MH 3. The ground slope from MH 4 to MH 3 is used in row 11
and is too small. The slope must be about doubled to obtain acceptable values, so the change in invert elevations of manholes 4 and 3 is 2 feet. This design is tabulated in row 12. The sewer at manhole 3 is 1 foot lower than is needed for cover considerations. f. MH 3 to MH 2. The ground drops 2 feet in 400 between MH 3 and 2 MH which is close to the minimum slope and so is used to design this section. It is tabulated in row 13. All along this section the sewer is 1 foot lower than is needed for cover, but this foot cannot be gained back because the slope of the sewer would then be too shallow. g. MH 2 to MH 1. Between MH 2 and MH 1 the ground drops 5 feet in 400. This is a much greater slope than is needed by the sewer, so instead of dropping the sewer 5 feet, it is dropped only 4 feet. This gives back the foot of elevation lost between manholes 4 and 3. The drop may not be less than 4 feet because then the sewer would be above minimum depth for cover. This sewer is therefore designed with a 4 foot drop in 400 feet (1 percent slope) and is tabulated in row 14. h. MH 1 to the lagoon. The line from MH 1 to the lagoon is tabulated in row 15. i. Building D to MH 7 and MH 6. This house connection could have been designed as soon as the main between manholes 7 and 6 was designed. The elevation of the connection with the main can now be computed. It will be the elevation of the outlet invert at manhole 7 less the slope of the main multiplied by the distance to the connection: Connection elevation =290.3-(1.67%x200’) =290.3-(.0167x200) =290.3-3.3 =287.0 feet
4-24

This can be entered in the lower invert elevation column in row 16. The upper invert elevation must be at least 2 feet 4 inches below the building elevation. Invert at Bldg D = 300 - 2.33 =
297.67
To have easier numbers to work with 297.6 will be used. This is entered in the upper invert elevation column. Using the invert elevation gives a slope of 10.4 percent. The results are tabulated in row 16.
EXERCISES First requirement. Multiple-choice
exercises 1 through 3 deal with the characteristics of sewage.
1. Which type of sewage is a sewage collection system primarily designed for in the TO?
a. sanitary c. storm b. industrial d. infiltration
2. What percentage of sewage is normally solid matter?
a. 0.2 c. 1.4 b. 0.8 d. 2.1
3. Biochemical oxygen demand (BOD) is a measure of what, when applied to sewage?
a. composition c. strength b. volume d. type Second requirement. Multiple-choice exercises 4 through 7 provide an opportunity for you to show that you understand sewage treatment.
4. An Imhoff tank replaces what two separate sewage treatment system components?
a. bar screen and drying bed b. drying bed and digestion tank c. bar screen and settling tank d. settling and digestion tanks
5. Sludge from Imhoff and digestion tanks can be dried in lagoons. The lagoons should have how many months' storage capacity?
a. 4 c. 8 b. 6 d. 12
6. Trickling filters, used for secondary treatment of sewage, should have a 5- to 8-foot deep layer of uniformly crushed stone for best results. The amount of stone is determined by assuming a requirement of how many cubic yards per capita?
a. 0.15 c. 0.30 b. 0.23 d. 0.35
7. In the complete treatment of sewage, what is the most common method of effluent disposal?
a. dilution c. irrigation b. evaporation d. drying Third requirement. Solve multiple-choice exercises 8 and 9 to test your understanding of sewage collection systems.
8. What minimum depth of cover in feet is normally required over sewer pipes to protect them against heavy truck traffic?
a. 2 c. 4 b. 3 d. 5
9. Manholes are required at the end of laterals and at each change of direction, slope, or pipe size. For sewers of less than 18-inches diameter, what maximum distance between manholes in feet is specified if none of the above conditions occur?
a. 200 c. 400 b. 300 d. 500
4-25


Fourth requirement. Multiple-choice exercises 10 through 20 enable you to show that you understand the principles of sewage collection system design.
10. No physical connections shall exist between sewer and water supply systems. What minimum horizontal distance in feet is required between sewers and water lines?
a. 2 c. 4 b. 3 d. 5
11. The second step in sewage collection system design is to locate manholes. What is the only manhole location criterion that cannot be exactly considered at this point?
a. change in pipe size or slope b. location of laterals c. changes in pipe direction d. intersections of sewers
12. What is the maximum flow rate between manholes in gallons per minute if the flow into the upper manhole is 125 gallons per minute, 40 gallons per minute enter the line from a house connection, and infiltration occurs at the rate of 10 gallons per minute per 1,000 feet of pipe? Assume the distance between manholes to be 400 feet.
a. 153 c. 182 b. 169 d. 196
13. In the absence of other information, the peak sewage flow from a TO facility can be assumed to be what percentage of the peak water demand?
a. 65 c. 75 b. 70 d. 80
14. Why is the natural ground slope usually used as a first estimate for a pipe slope?
a. facilitate excavation b. control velocity c. regulate drainage d. prevent infiltration
15. What pipe size in inches is required to handle 400 gallons per minute at 1.5-percent slope?
a. 6 c. 10 b. 8 d. 12
16. For a flow of 1,000 gallons per minute and a slope of 1 percent, a pipe size of 12 inches is required. What is the velocity in feet per second for this pipe size and slope at full capacity?
a. 3.2 c. 4.1 b. 3.6 d. 4.4
17. For a flow of 500 gallons per minute at a 2-percent slope, a pipe size of 8 inches is required (fig 14). What will be the discharge ratio?
a. 0.623 c. 0.714 b. 0.690 d. 0.805
18. For a discharge ratio of 0.34 and a full flow velocity of 5 feet per second, what is the actual velocity in feet per second?
a. 3.5 c. 4.5 b. 4.0 d. 5.0
19. You are designing a sewer line to connect a house with the main sewer. The ground slope of 1.6 feet in 80 feet is tried initially. What will be the minimum pipe size in inches you can use for a maximum flow of 180 gallons per minute?
a. 6 c. 10 b. 8 d. 12
20. You are designing a sewage collection system, and need the elevation of a connection of a house line with the main. If the next manhole upstream has an outlet invert elevation of 390 feet and the pipe slopes down at 2 percent, what is the invert elevation in feet of the connection if it is 300 feet downstream from the manhole?
a. 365 c. 378 b. 372 d. 384
4-26
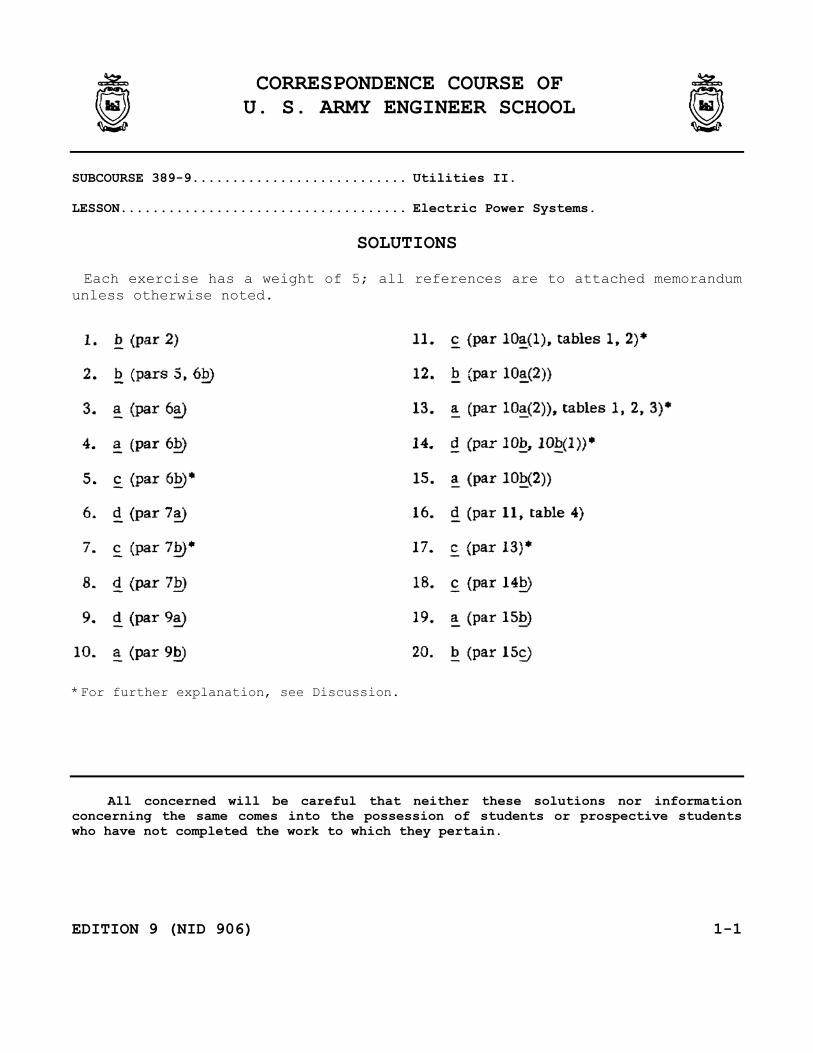
CORRESPONDENCE COURSE OF
U. S. ARMY ENGINEER SCHOOL
SUBCOURSE 389-9........................... Utilities II. LESSON.................................... Electric Power Systems.
SOLUTIONS Each exercise has a weight of 5; all references are to attached memorandum unless otherwise noted.
*For further explanation, see Discussion. All concerned will be careful that neither these solutions nor information concerning the same comes into the possession of students or prospective students who have not completed the work to which they pertain. EDITION 9 (NID 906) 1-1
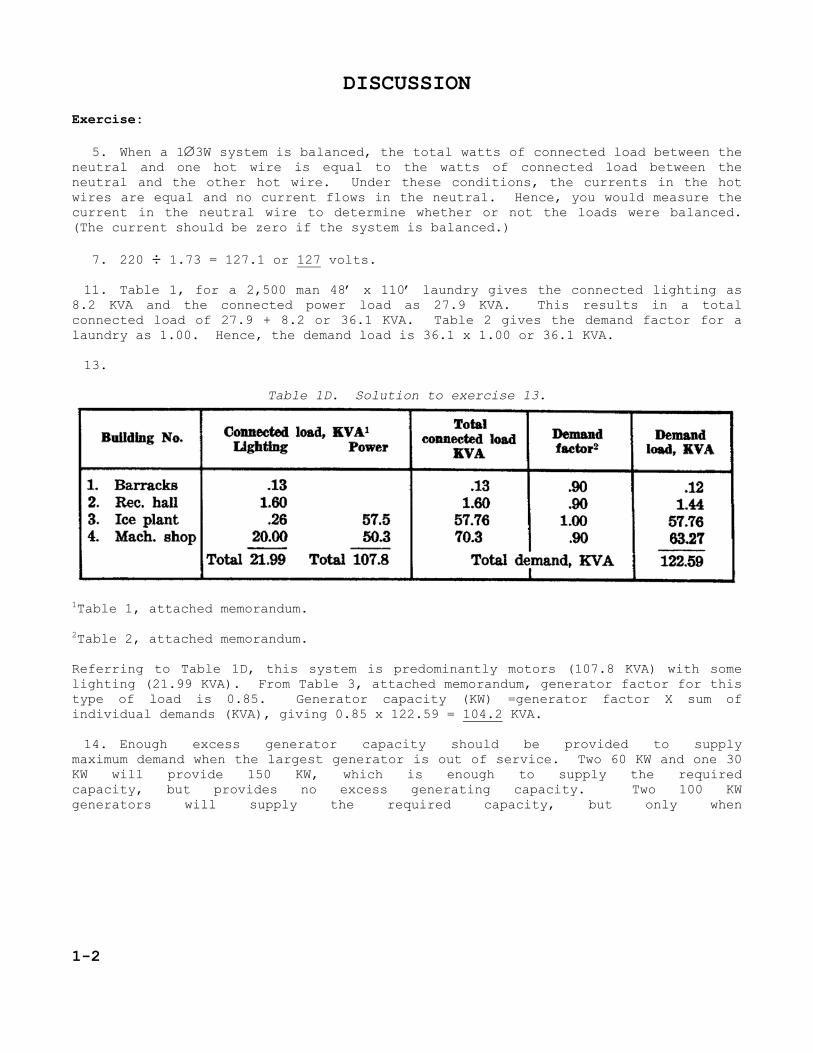
DISCUSSION Exercise: 5. When a 1∅3W system is balanced, the total watts of connected load between the neutral and one hot wire is equal to the watts of connected load between the neutral and the other hot wire. Under these conditions, the currents in the hot wires are equal and no current flows in the neutral. Hence, you would measure the current in the neutral wire to determine whether or not the loads were balanced. (The current should be zero if the system is balanced.) 7. 220 ÷ 1.73 = 127.1 or 127 volts. 11. Table 1, for a 2,500 man 48’ x 110’ laundry gives the connected lighting as 8.2 KVA and the connected power load as 27.9 KVA. This results in a total connected load of 27.9 + 8.2 or 36.1 KVA. Table 2 gives the demand factor for a laundry as 1.00. Hence, the demand load is 36.1 x 1.00 or 36.1 KVA. 13.
Table 1D. Solution to exercise 13.
1Table 1, attached memorandum. 2Table 2, attached memorandum. Referring to Table 1D, this system is predominantly motors (107.8 KVA) with some lighting (21.99 KVA). From Table 3, attached memorandum, generator factor for this type of load is 0.85. Generator capacity (KW) =generator factor X sum of individual demands (KVA), giving 0.85 x 122.59 = 104.2 KVA. 14. Enough excess generator capacity should be provided to supply maximum demand when the largest generator is out of service. Two 60 KW and one 30 KW will provide 150 KW, which is enough to supply the required capacity, but provides no excess generating capacity. Two 100 KW generators will supply the required capacity, but only when 1-2

both generators are operating. Three 45 KW generators have a capacity of 135 KW, less than the required generator capacity. Three 100 KW generators will not only provide the required capacity, but will do it when the largest generator is out of service. Hence, choose three 100 KW generators. 17. Location A is too far from the heavier loads (machine shop) to keep wire size and amount to reasonable values. Locations B, C, and D are satisfactory from the standpoint of being near the heaviest demand load, but location B would result in a noise nuisance to the chapel while location D is near a storage area for flammable products. Hence, locate the generator at location C.
1-3

CORRESPONDENCE COURSE OF
U. S. ARMY ENGINEER SCHOOL
SUBCOURSE 389-9........................... Utilities II. LESSON 2.................................. Electrical Distribution Systems.
SOLUTIONS Each exercise has a weight of 5; all references are to attached memorandum unless otherwise noted.
*For further explanation, see Discussion sheet.
2-1

DISCUSSION Exercise: 3. 4. The KVA connected to each phase should be of equal value. To accomplish this, connect the loads as follows: Load 1 to phase 1 as L1 Load 2 to phase 2 as L2 Load 3 to phase 3 as L3 Load 4 to all three phases as L4 Load 5 t phase 1 as L5 Load 6 to phase 2 as L6 Figure ID shows the loads connected to the system.
Figure 1D. For use with the solution to exercise 4.
2-2
5. Since the distance from the generators to the laundry is only 50 feet, the voltage drop in this distance will be negligible, and the load-carrying capacity of the wires becomes the deciding factor. Referring to table 1, for a 3∅4W 127/220V system, a No. 4 wire will carry 57- KVA which is well in excess of the required 41. A No. 6 wire, however, can carry only 38 KVA which is below the required capacity. Hence, a No. 4 wire is required. 7. In military practice the percent voltage drop is taken as a percentage of the
voltage at the generator, or . If we let X =
the voltage at the generator, then X -208 is the voltage drop, and the above relationship yields the following:
8. Refer to figure 8, attached memorandum. Enter 250 feet at the bottom right horizontal scale; proceed vertically to the No. 8 curve; proceed horizontally from this point to the vertical line representing a load of 6 KVA (on the bottom left horizontal scale). At this point the voltage drop is read as 3.2 percent using the lower voltage drop figures. 11. From table 5, attached memorandum, the sag for 150 foot spans at 60°F is 26 inches or 2'2". From figure 10, attached memorandum, the required clearance for primary feeder lines is 20 feet if they must cross public streets and driveways to resident garages. The wires must therefore be attached 20' + 2'2" or 22’2" above the ground. 12. From figure 10, attached memorandum, the required clearance for primary feeder lines is 28 feet over railroad tracks. This, plus the 2'2" sag found in problem 11, gives a required mounting height of 28' + 22" or 30'2" for the wires. 13. Using figure 12, attached memorandum, enter 450 feet on the right vertical scale, and proceed horizontally to the curve for 4/0 (0000) wire size. At this point proceed vertically downward to the bottom horizontal scale and read the minimum allowable sag to be 8 feet. 14. Your assistant has allowed an excessive voltage drop for this particular
section of feeder, . This leaves only 6.0 - 5.5 = 0.5% allowable drop
for sections AC, IL, and LN. In effect, he has used up most of his allowable voltage drop on section CI and thus left very little for the subsequent sections of the feeder. Remember the 6 percent is the total drop allowed from the generator to the farthest load. 15. Demand load on section AC is computed as follows:
Group I 6.50 KVA
II 2.00 KVA
III 2.50 KVA
IV 4.00 KVA
V 2.00 KVA
Building 5 3.00 KVA
Total demand 20.00 KVA
2-3
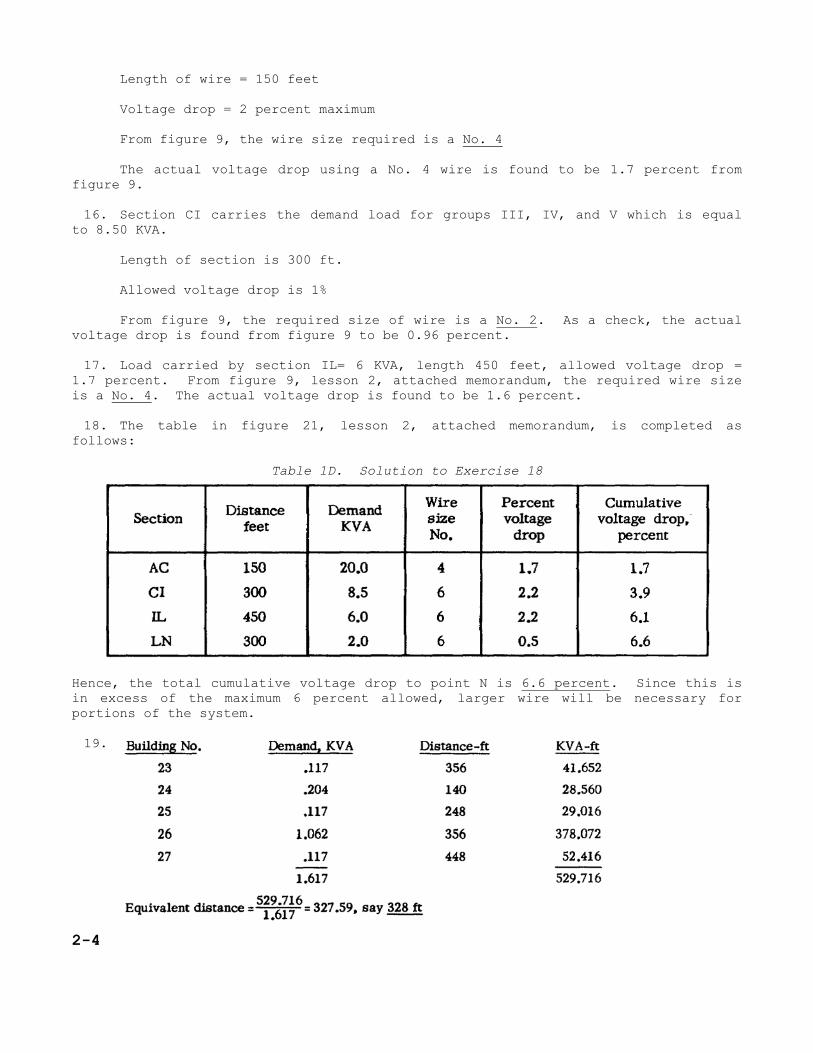
Length of wire = 150 feet Voltage drop = 2 percent maximum From figure 9, the wire size required is a No. 4 The actual voltage drop using a No. 4 wire is found to be 1.7 percent from figure 9. 16. Section CI carries the demand load for groups III, IV, and V which is equal to 8.50 KVA. Length of section is 300 ft. Allowed voltage drop is 1% From figure 9, the required size of wire is a No. 2. As a check, the actual voltage drop is found from figure 9 to be 0.96 percent. 17. Load carried by section IL= 6 KVA, length 450 feet, allowed voltage drop = 1.7 percent. From figure 9, lesson 2, attached memorandum, the required wire size is a No. 4. The actual voltage drop is found to be 1.6 percent. 18. The table in figure 21, lesson 2, attached memorandum, is completed as follows:
Table 1D. Solution to Exercise 18
Hence, the total cumulative voltage drop to point N is 6.6 percent. Since this is in excess of the maximum 6 percent allowed, larger wire will be necessary for portions of the system. 19. 2-4

20. As stated n the fifth requirement, the cumulative voltage drop to point N has been computed as 4.95 percent. This leaves 6.00 - 4.95 = 1.05 percent voltage drop allowed for group V. From figure 9, attached memorandum, a 1.05 percent voltage drop, a 1.65 KVA demand load, and a 308-foot equivalent distance require a wire size somewhat smaller than No. 8. However, a No. 8 wire is the smallest size allowed for use in this project. The actual voltage drop for this branch will be 0.7 percent.
2-5

CORRESPONDENCE COURSE OF
U. S. ARMY ENGINEER SCHOOL
SUBCOURSE 389-9........................... Utilities II. LESSON 3.................................. Distribution Systems.
SOLUTIONS Each exercise has a weight of 5; all references are to attached memorandum unless otherwise noted.
*For further explanation, see Discussion.
3-1

DISCUSSION Exercise: 8. From paragraph 9, the storage requirement is 1/2 total daily requirement = 1/2 (Avg demand x design population + large users). There are no large users. The average demand is given as 25 gpd/man. The design population is the actual (or expected) population times the capacity factor from table 1. For a population of 10,000, the appropriate capacity factor is 1.15. Hence, the design population is 1.15 (10,000) = 11,500, and the required storage capacity is 1/2 (25 x 11,500) = 143,750 gallons. 10. Pressure is defined as force per unit area, or . A 1-foot cube of the
liquid in question weighs 85 pounds, and hence exerts a pressure on the base of 85
pounds per square foot, pounds per square inch. Therefore, a 1-foot high
column of the liquid exerts a pressure of .59 pounds per square inch at the base or
1 pound per square inch feet of the liquid. Therefore, 14.7 pounds of the
liquid require a height of 1.69 x 14.7 = 24.8, say 25 feet. Alternate solution: From paragraph 11c, for fluids other than water, pressure is given as P = 0.433 ah where a is the specific gravity of the fluid (ratio of its weight to the weight of an equal volume of water). For the liquid in question,
. From above, then, , say 25 feet.
12. The maximum pressure allowed in the pipe is 120 psi. For water, 1 psi = 2.31 feet of water. Therefore, 120 psi is 120 x 2.31= 277.2, say 277 feet of water. Therefore, 277 is the maximum elevation difference permitted. 13. Referring to figure 13, connect 10 outlets on the left column with 21 shower heads on the right. This line intersects the center column at a value of 34 gpm. 14. Referring to paragraph 16b, Allowable, Hf = E1Tk - (ESc + Hreq) where Hreq = Preq x 2.31. Therefore, Hreq = 25 x 2.31 = 57.75, say 58 feet. Allowable Hf = 265 - (141 + 58) = 265 - 199 = 66 feet 3-2

15. Connect a headloss of 5 feet per 1,000 feet of pipe with 7-inch diameter pipe in columns three and two respectively of figure 14, attached memorandum. The intersection of this line with column one gives a flow of 270 gpm. 16. If the maximum allowable headloss is 10 feet of water in 500 feet of pipe,
the maximum allowable headloss per 1,000 feet of pipe is feet of water
per 1,000 feet. Connect 100 gpm n the left column of figure 14 with 20 feet per 1,000 feet in the third column. This line intersects the second column at a value of 3.6 inches. Hence, a 3.6-inch diameter is the minimum that will allow the required flow while keeping the headloss below 10 feet of water. Therefore, 4-inch diameter pipe is required, the next larger size. 17. Since the coefficient of friction is other than 100, figure 15 must be used. Connect the point in the left column corresponding to a flow coefficient of 150 to a 5-foot per 1,000 foot headloss in the second column, and extend this line until it intersects the pivot line. Connect this point on the pivot line with a discharge of 70 gpm, and read the minimum required pipe diameter as 3.6 inches. Therefore, 4-inch pipe is required. 18. As shown by figure 17, the main from C to D must be able to furnish the peak demand for buildings 3, 4, 5, and 6. Hence, it must be able to carry 65 + 45 + 30 + 60= 200 gpm. 19. For a flow of 200 gpm and a pipe size of 6 inches, figure 14 gives the headloss as 6 feet per 1,000 feet of pipe. Since the section in question is 1,200
feet long, the actual headloss is feet. 20. The total headloss allowed is 25 feet. However, 11 feet have already been used up in the main. Hence you have 25 - 11 = 14 feet left for the branch line.
The branch is 350 feet long, so the headloss in the branch is feet per
1,000 feet. From figure 14, for a loss of 40 feet per 1,000 feet and a flow of 70 gpm, the required diameter is 2.7 inches, so specify 3-inch pipe.
3-3

CORRESPONDENCE COURSE OF
U. S. ARMY ENGINEER SCHOOL
SUBCOURSE 389-9........................... Utilities II. LESSON 4.................................. Sewage Collection and Disposal.
SOLUTIONS Each exercise has a weight of 5; all references are to attached memorandum unless otherwise noted.
*For further explanation, see Discussion.
4-1

DISCUSSION Exercise: 12. The maximum flow rate between the manholes will occur between the house connection and the downstream manhole. This would consist of the 125 gpm from the
upper manhole, the 40 gpm from the house connection, and gpm due to
infiltration. Hence, the maximum flow would be 125 + 40 + 4 = 169 gpm. 15. Enter figure 14 at 400 gpm on the right vertical scale, and move horizontally to the left until the 1.5 percent slope line is intersected. This point of intersection is above the 6-inch diameter pipe size, so 6-inch pipe will not handle the required flow at this slope. 8-inch diameter pipe will be required. 16. The velocity at full capacity is found by entering figure 14 at the design slope of 1 percent along the bottom horizontal axis, and moving up vertically until the design pipe size of 12 inches is intersected. At this point the velocity is read as 4.4 fps. 17. The discharge ratio is the ratio of the actual discharge (Qa) to the discharge at full flow (Qc). The actual flow is given as 500 gpm. Entering figure 14, attached memorandum, at a slope of 2.0 percent and proceeding vertically upward until the curve for 8-inch pipe is intersected, a full flow of 700 gpm is read.
Therefore, the discharge ratio is . 18. Enter figure 15, attached memorandum, at a value of 0.34 (the discharge ratio) along the bottom horizontal scale. Proceed vertically to the discharge curve, horizontally from this point to the velocity curve, then proceed vertically downward from this point and read the velocity ratio (0.9) along the bottom horizontal axis. The actual velocity is then the velocity ratio times the full flow velocity or 0.9 x 5 = 4.5 fps. 19. The percent slope is percent. Referring to figure 14, a slope of
2.0 percent and a flow of 180 gpm intersect between the 4" and 6" rectangles. Hence, 6-inch pipe is required. 20. The house connection is 300 feet downstream from the manhole. Since the slope is 2 percent, the connection is .02 x300 feet or 6 feet lower than the manhole outlet invert. Hence, the elevation of the connection is 390 - 6 = 384 feet. 4-2

(Continued on next page)


(Continued on next page)

(Continued on next page)


(Continued on next page)
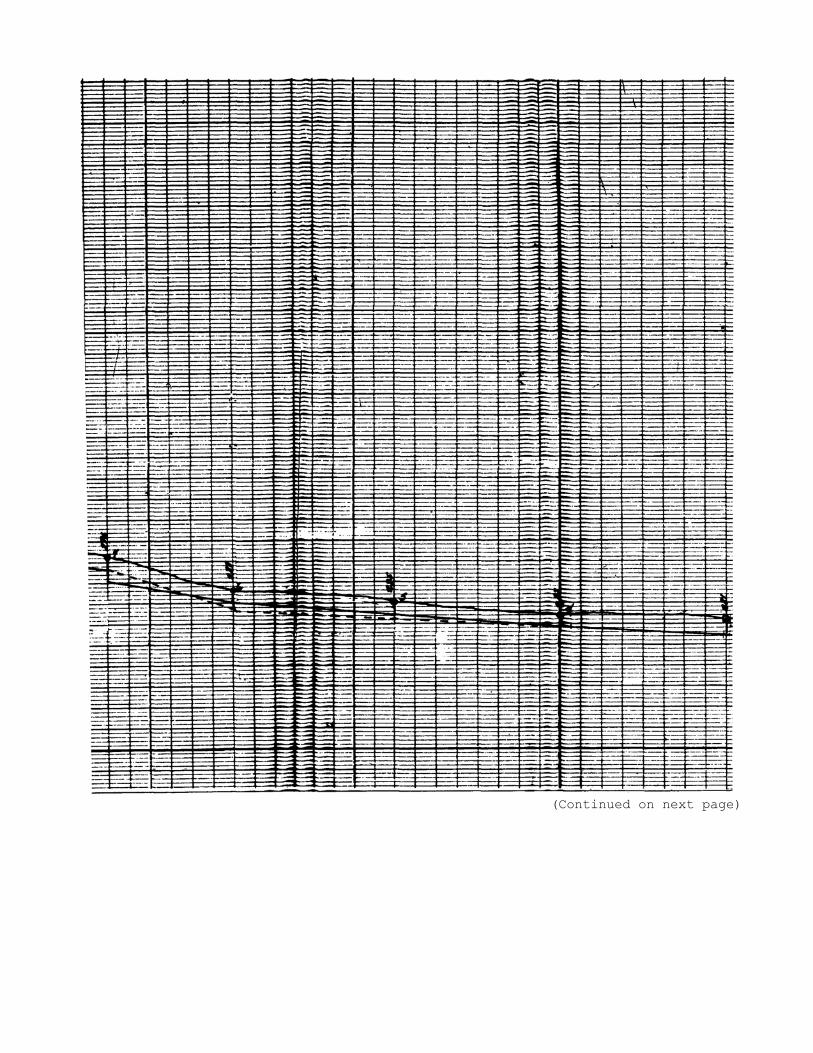
(Continued on next page)