Embed Size (px)
Citation preview

Statistical Bulletin No. 36, June 2007 - Page �
IntroductionSobering up centres (SUCs) are support services that provide a practical, harm reduction approach to the issue of public intoxication. They provide overnight care to per-sons who are intoxicated, who are not in need of hospital care and whose behaviour can be managed effectively and safely by sobering up centre staff. This is a very cost effective service, which may otherwise result in more expensive hospital based treatment for intoxication man-agement (Table 2, page 2).
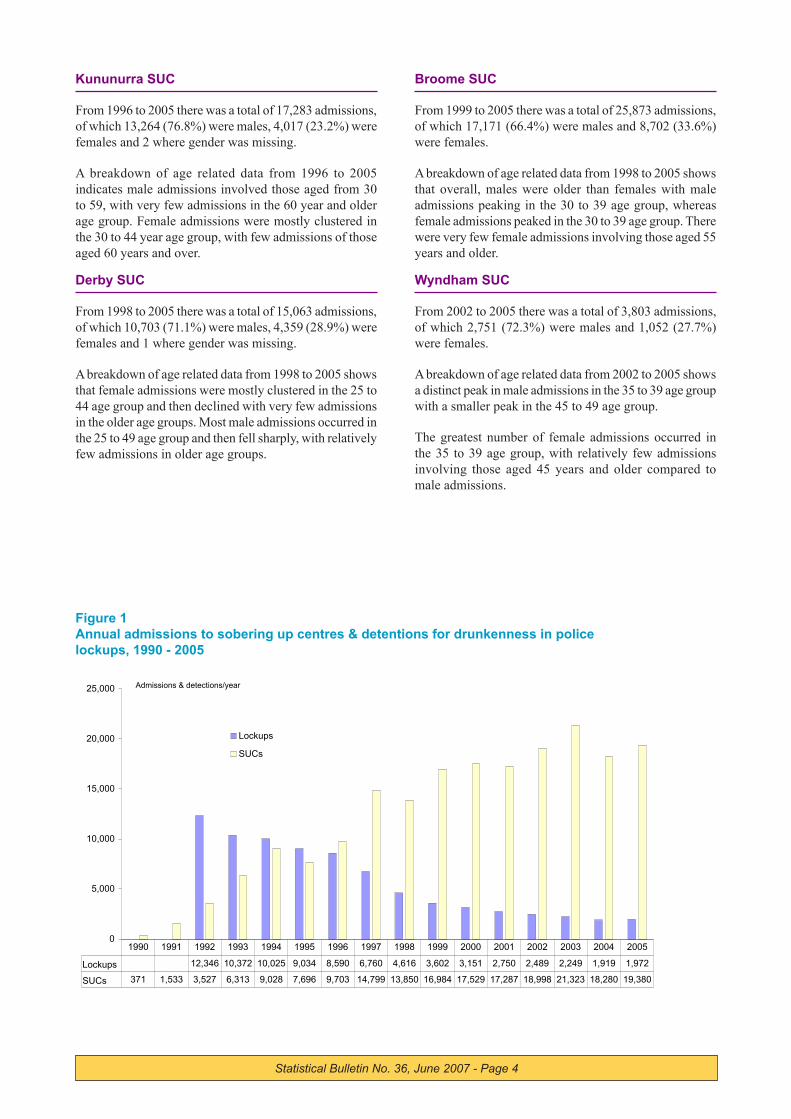
Admissions to SUCsAnnual admissions to SUCs increased 13 fold, from a total of 1,533 in 1991 (the first full year of operation) to a total of 19,380 in 2005 (Table 2, page 5; Figure 1, page 4).
Gender
From 1990 to 2005 there was a total of 196,601 admissions to SUCs, of which 134,313 (68.3%) were males, 62,249 (31.7%) were females and 39 (<0.1%) where gender was missing (Table 2, page 5).
Indigenous status
In 2005 of the 18,280 admissions to SUCs, 17,760 (97.2%) were indigenous and 520 (2.8%) were non indigenous. In non metropolitan health regions (HRs) almost all episodes involved indigenous persons, such as Goldfields and South East Coastal (99.2%), Kimberley (99.6%), Midwest and Murchison (94.1%) and Pilbara and Gascoyne (98.7%) HRs (Table 3, page 5).
There has also been a growth in the proportion of indig-enous persons attending the Perth SUC, increasing from 51.4% of admissions in 1999 to 84.2% of admissions in 2004.
Regional trends
An overview of trends in annual admissions to each SUC is provided in the appendix of data tables. Out of the 19,380 admissions in the year 2005, a total of 3,219 (16.6%) were
Utilisation of Sobering Up Centres, 1990 - 2005
Drug and Alcohol OfficeGovernment of Western Australia
in the metropolitan area and 16,161 (83.4%) were in non metropolitan areas of the State.
With respect to the non metropolitan regions, two SUCs - Broome and Kununurra accounted for four out of ten (42.9%) of all admissions. The next two most frequent number of admissions in 2005 were at the Derby and Port Hedland SUCs, which together accounted for a further 20.4% of non metropolitan admissions.
Age structure
There were notable differences between a number of the HRs in the age and gender structure of the populations attending SUCs, such as:
at the Wiluna SUC most admissions were clustered in a younger age group of males in the 20 to 24 age group;at the Fitzroy Crossing and Halls Creek SUCs most admissions involved those in the 25 to 39 age group with a greater number of males than females;at the Broome SUC most admissions involved males in the 30 to 39 age goup;at the Perth SUC most admissions involved the 35 to 49 age group with a much greater proportion of males than females; andat the Roebourne SUC most admissions involved males in the 40 to 59 age group.
Detentions in Police Lock UpsFrom 1990 to 2005 there was a total of 79,875 detentions of intoxicated persons in police lock ups in the various catch-ment areas served by operating SUCs, of which 59,026 (73.9%) were males, 20,033 (25.1%) were females and 816 (1.0%) where gender was missing (Table 2, page 5).
The impact of SUCs on the detention of intoxicated per-sons is demonstrated in Figure 1 (page 4), which shows a sharp decline in detentions from 1992 up to the present.
From 1992 (the first full year of complete police data) to 2005 the number of detentions of intoxicated persons in
•
•
•
•
•
Version: June 2007
Statistical Bulletin No. 36, June 2007 - Page 2
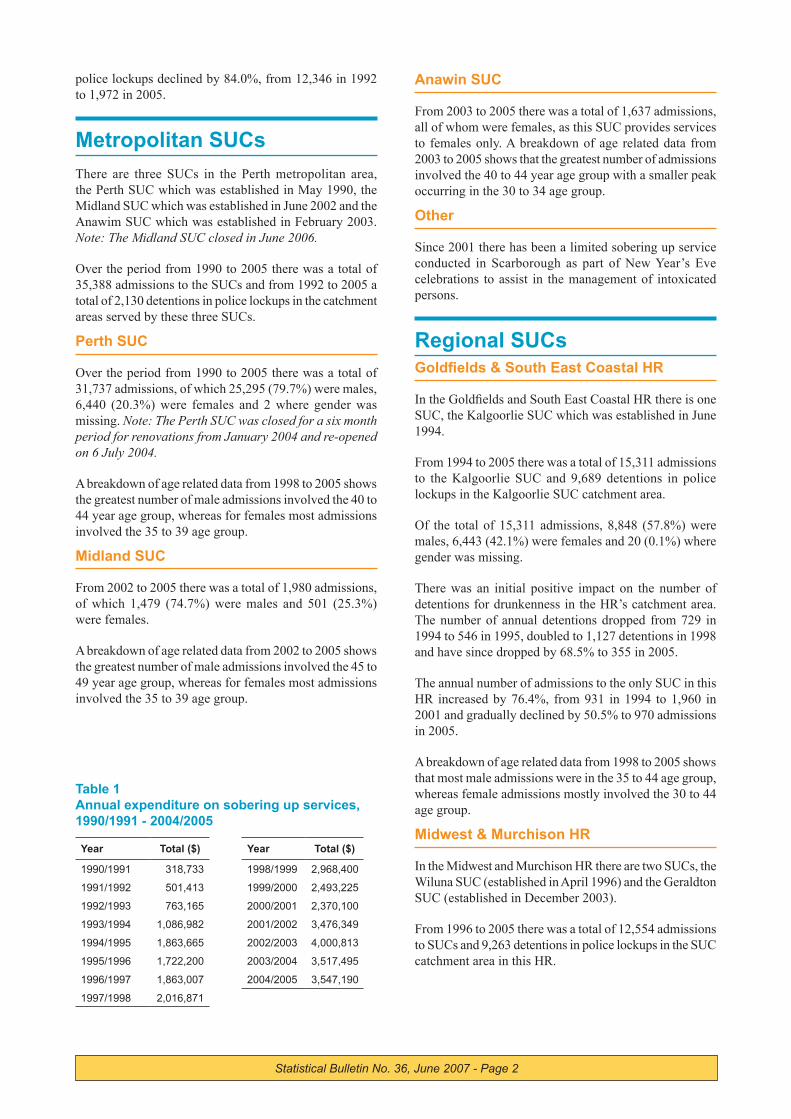
police lockups declined by 84.0%, from 12,346 in 1992 to 1,972 in 2005.
Metropolitan SUCsThere are three SUCs in the Perth metropolitan area, the Perth SUC which was established in May 1990, the Midland SUC which was established in June 2002 and the Anawim SUC which was established in February 2003. Note: The Midland SUC closed in June 2006.
Over the period from 1990 to 2005 there was a total of 35,388 admissions to the SUCs and from 1992 to 2005 a total of 2,130 detentions in police lockups in the catchment areas served by these three SUCs.
Perth SUC
Over the period from 1990 to 2005 there was a total of 31,737 admissions, of which 25,295 (79.7%) were males, 6,440 (20.3%) were females and 2 where gender was missing. Note: The Perth SUC was closed for a six month period for renovations from January 2004 and re-opened on 6 July 2004.
A breakdown of age related data from 1998 to 2005 shows the greatest number of male admissions involved the 40 to 44 year age group, whereas for females most admissions involved the 35 to 39 age group.
Midland SUC
From 2002 to 2005 there was a total of 1,980 admissions, of which 1,479 (74.7%) were males and 501 (25.3%) were females.
A breakdown of age related data from 2002 to 2005 shows the greatest number of male admissions involved the 45 to 49 year age group, whereas for females most admissions involved the 35 to 39 age group.
Anawin SUC
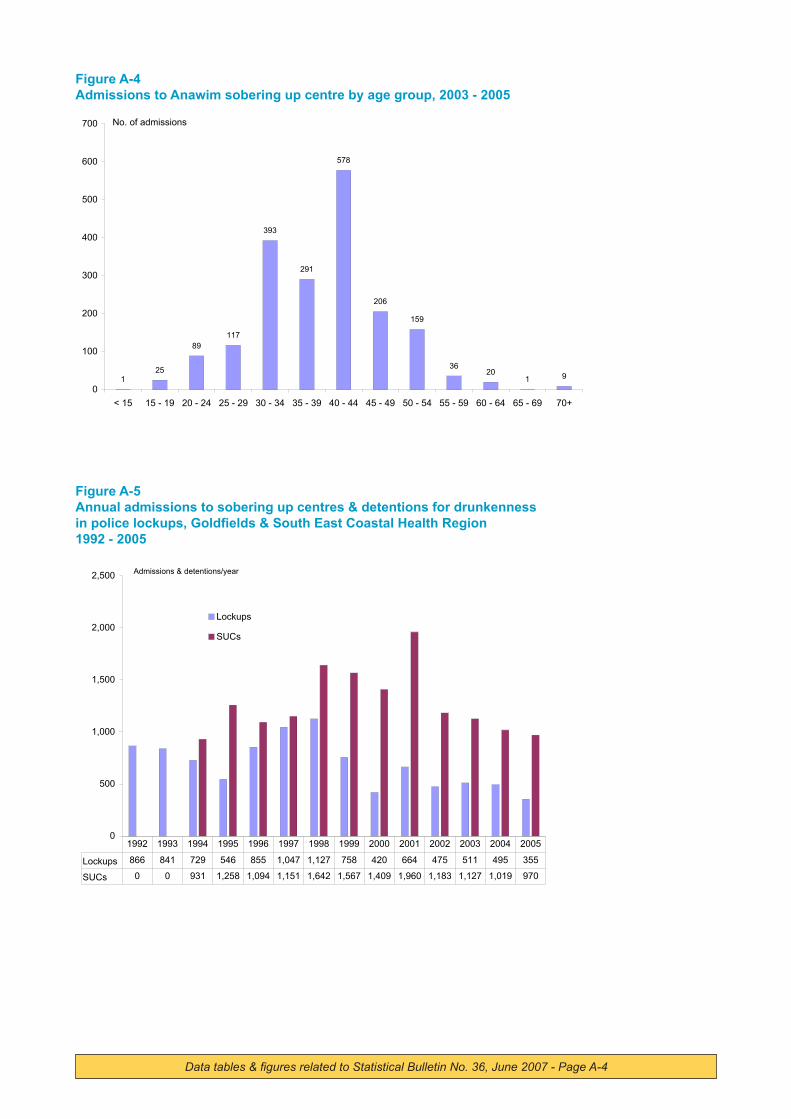
From 2003 to 2005 there was a total of 1,637 admissions, all of whom were females, as this SUC provides services to females only. A breakdown of age related data from 2003 to 2005 shows that the greatest number of admissions involved the 40 to 44 year age group with a smaller peak occurring in the 30 to 34 age group.
Other
Since 2001 there has been a limited sobering up service conducted in Scarborough as part of New Year’s Eve celebrations to assist in the management of intoxicated persons.
Regional SUCsGoldfields & South East Coastal HR
In the Goldfields and South East Coastal HR there is one SUC, the Kalgoorlie SUC which was established in June 1994.
From 1994 to 2005 there was a total of 15,311 admissions to the Kalgoorlie SUC and 9,689 detentions in police lockups in the Kalgoorlie SUC catchment area.
Of the total of 15,311 admissions, 8,848 (57.8%) were males, 6,443 (42.1%) were females and 20 (0.1%) where gender was missing.
There was an initial positive impact on the number of detentions for drunkenness in the HR’s catchment area. The number of annual detentions dropped from 729 in 1994 to 546 in 1995, doubled to 1,127 detentions in 1998 and have since dropped by 68.5% to 355 in 2005.
The annual number of admissions to the only SUC in this HR increased by 76.4%, from 931 in 1994 to 1,960 in 2001 and gradually declined by 50.5% to 970 admissions in 2005.
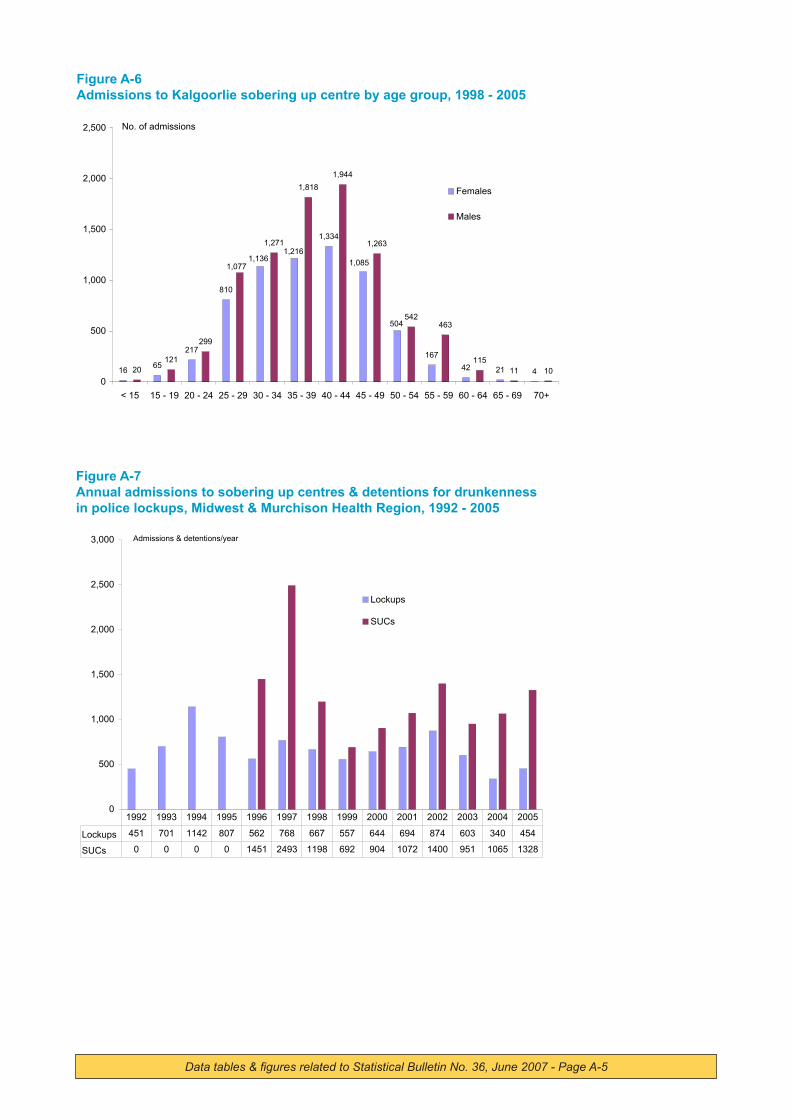
A breakdown of age related data from 1998 to 2005 shows that most male admissions were in the 35 to 44 age group, whereas female admissions mostly involved the 30 to 44 age group.
Midwest & Murchison HR
In the Midwest and Murchison HR there are two SUCs, the Wiluna SUC (established in April 1996) and the Geraldton SUC (established in December 2003).
From 1996 to 2005 there was a total of 12,554 admissions to SUCs and 9,263 detentions in police lockups in the SUC catchment area in this HR.
Year Total ($) Year Total ($)
1990/1991 318,733 1998/1999 2,968,400
1991/1992 501,413 1999/2000 2,493,225
1992/1993 763,165 2000/2001 2,370,100
1993/1994 1,086,982 2001/2002 3,476,349
1994/1995 1,863,665 2002/2003 4,000,813
1995/1996 1,722,200 2003/2004 3,517,495
1996/1997 1,863,007 2004/2005 3,547,190
1997/1998 2,016,871
Table 1Annual expenditure on sobering up services, 1990/1991 - 2004/2005
Statistical Bulletin No. 36, June 2007 - Page 3
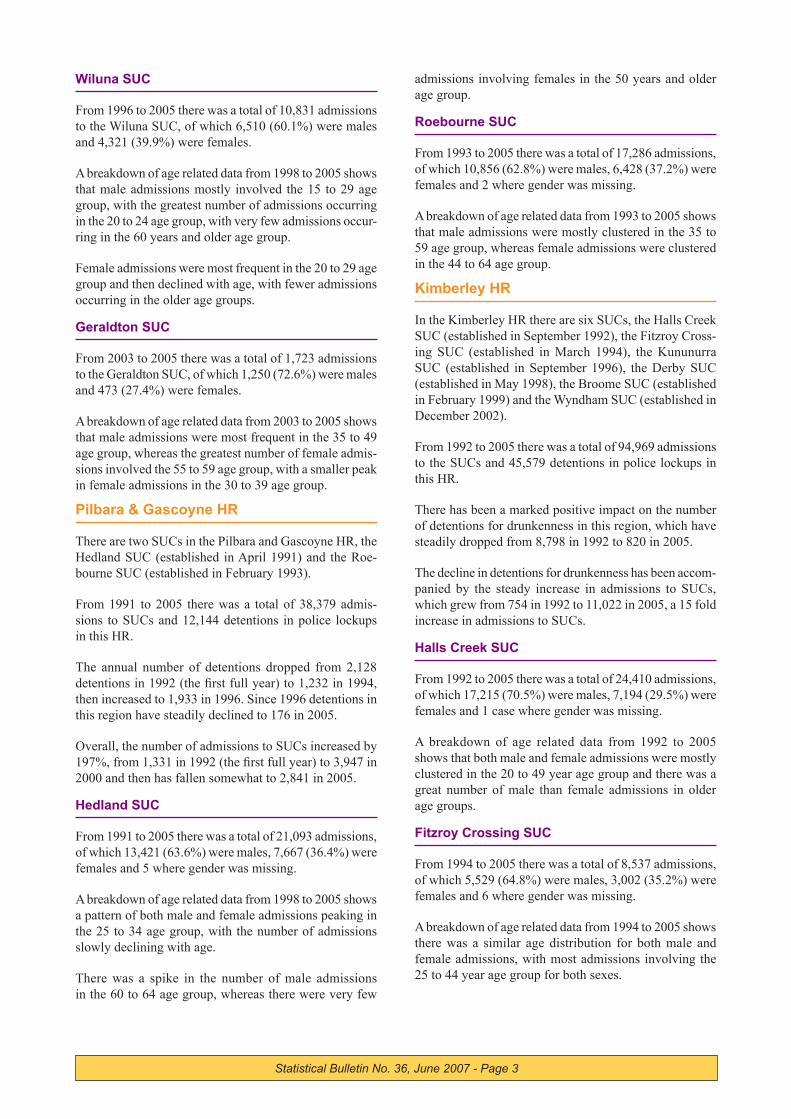
Wiluna SUC
From 1996 to 2005 there was a total of 10,831 admissions to the Wiluna SUC, of which 6,510 (60.1%) were males and 4,321 (39.9%) were females.
A breakdown of age related data from 1998 to 2005 shows that male admissions mostly involved the 15 to 29 age group, with the greatest number of admissions occurring in the 20 to 24 age group, with very few admissions occur-ring in the 60 years and older age group.
Female admissions were most frequent in the 20 to 29 age group and then declined with age, with fewer admissions occurring in the older age groups.
Geraldton SUC
From 2003 to 2005 there was a total of 1,723 admissions to the Geraldton SUC, of which 1,250 (72.6%) were males and 473 (27.4%) were females.
A breakdown of age related data from 2003 to 2005 shows that male admissions were most frequent in the 35 to 49 age group, whereas the greatest number of female admis-sions involved the 55 to 59 age group, with a smaller peak in female admissions in the 30 to 39 age group.
Pilbara & Gascoyne HR
There are two SUCs in the Pilbara and Gascoyne HR, the Hedland SUC (established in April 1991) and the Roe-bourne SUC (established in February 1993).
From 1991 to 2005 there was a total of 38,379 admis-sions to SUCs and 12,144 detentions in police lockups in this HR.
The annual number of detentions dropped from 2,128 detentions in 1992 (the first full year) to 1,232 in 1994, then increased to 1,933 in 1996. Since 1996 detentions in this region have steadily declined to 176 in 2005.
Overall, the number of admissions to SUCs increased by 197%, from 1,331 in 1992 (the first full year) to 3,947 in 2000 and then has fallen somewhat to 2,841 in 2005.
Hedland SUC
From 1991 to 2005 there was a total of 21,093 admissions, of which 13,421 (63.6%) were males, 7,667 (36.4%) were females and 5 where gender was missing.
A breakdown of age related data from 1998 to 2005 shows a pattern of both male and female admissions peaking in the 25 to 34 age group, with the number of admissions slowly declining with age.
There was a spike in the number of male admissions in the 60 to 64 age group, whereas there were very few
admissions involving females in the 50 years and older age group.
Roebourne SUC
From 1993 to 2005 there was a total of 17,286 admissions, of which 10,856 (62.8%) were males, 6,428 (37.2%) were females and 2 where gender was missing.
A breakdown of age related data from 1993 to 2005 shows that male admissions were mostly clustered in the 35 to 59 age group, whereas female admissions were clustered in the 44 to 64 age group.
Kimberley HR
In the Kimberley HR there are six SUCs, the Halls Creek SUC (established in September 1992), the Fitzroy Cross-ing SUC (established in March 1994), the Kununurra SUC (established in September 1996), the Derby SUC (established in May 1998), the Broome SUC (established in February 1999) and the Wyndham SUC (established in December 2002).
From 1992 to 2005 there was a total of 94,969 admissions to the SUCs and 45,579 detentions in police lockups in this HR.
There has been a marked positive impact on the number of detentions for drunkenness in this region, which have steadily dropped from 8,798 in 1992 to 820 in 2005.
The decline in detentions for drunkenness has been accom-panied by the steady increase in admissions to SUCs, which grew from 754 in 1992 to 11,022 in 2005, a 15 fold increase in admissions to SUCs.
Halls Creek SUC
From 1992 to 2005 there was a total of 24,410 admissions, of which 17,215 (70.5%) were males, 7,194 (29.5%) were females and 1 case where gender was missing.
A breakdown of age related data from 1992 to 2005 shows that both male and female admissions were mostly clustered in the 20 to 49 year age group and there was a great number of male than female admissions in older age groups.
Fitzroy Crossing SUC
From 1994 to 2005 there was a total of 8,537 admissions, of which 5,529 (64.8%) were males, 3,002 (35.2%) were females and 6 where gender was missing.
A breakdown of age related data from 1994 to 2005 shows there was a similar age distribution for both male and female admissions, with most admissions involving the 25 to 44 year age group for both sexes.
Statistical Bulletin No. 36, June 2007 - Page �
Kununurra SUC
From 1996 to 2005 there was a total of 17,283 admissions, of which 13,264 (76.8%) were males, 4,017 (23.2%) were females and 2 where gender was missing.
A breakdown of age related data from 1996 to 2005 indicates male admissions involved those aged from 30 to 59, with very few admissions in the 60 year and older age group. Female admissions were mostly clustered in the 30 to 44 year age group, with few admissions of those aged 60 years and over.
Derby SUC
From 1998 to 2005 there was a total of 15,063 admissions, of which 10,703 (71.1%) were males, 4,359 (28.9%) were females and 1 where gender was missing.
A breakdown of age related data from 1998 to 2005 shows that female admissions were mostly clustered in the 25 to 44 age group and then declined with very few admissions in the older age groups. Most male admissions occurred in the 25 to 49 age group and then fell sharply, with relatively few admissions in older age groups.
Broome SUC
From 1999 to 2005 there was a total of 25,873 admissions, of which 17,171 (66.4%) were males and 8,702 (33.6%) were females.
A breakdown of age related data from 1998 to 2005 shows that overall, males were older than females with male admissions peaking in the 30 to 39 age group, whereas female admissions peaked in the 30 to 39 age group. There were very few female admissions involving those aged 55 years and older.
Wyndham SUC
From 2002 to 2005 there was a total of 3,803 admissions, of which 2,751 (72.3%) were males and 1,052 (27.7%) were females.
A breakdown of age related data from 2002 to 2005 shows a distinct peak in male admissions in the 35 to 39 age group with a smaller peak in the 45 to 49 age group.
The greatest number of female admissions occurred in the 35 to 39 age group, with relatively few admissions involving those aged 45 years and older compared to male admissions.
0
5,000
10,000
15,000
20,000
25,000
Lockups
SUCs
Lockups 12,346 10,372 10,025 9,034 8,590 6,760 4,616 3,602 3,151 2,750 2,489 2,249 1,919 1,972
SUCs 371 1,533 3,527 6,313 9,028 7,696 9,703 14,799 13,850 16,984 17,529 17,287 18,998 21,323 18,280 19,380
1990 1991 1992 1993 1994 1995 1996 1997 1998 1999 2000 2001 2002 2003 2004 2005
Admissions & detections/year
Figure 1Annual admissions to sobering up centres & detentions for drunkenness in police lockups, 1990 - 2005

Statistical Bulletin No. 36, June 2007 - Page �
Table 2Annual admissions to sobering up centres & detentions for drunkenness in police lockups by gender, 1990 - 2005
Sobering up centres Police lockupsMales Females Unknown Total Males Females Unknown Total
1990 315 56 - 371 - - - -
1991 1,286 247 - 1,533 - - - -
1992 2,621 906 - 3,527 9,000 3,346 - 12,346
1993 4,724 1,589 - 6,313 7,789 2,583 - 10,372
1994 6,500 2,527 1 9,028 7,266 2,759 - 10,025
1995 5,616 2,071 9 7,696 6,470 2,458 106 9,034
1996 6,641 3,057 5 9,703 6,356 2,006 228 8,590
1997 10,022 4,764 13 14,799 5,035 1,578 147 6,760
1998 9,512 4,338 - 13,850 3,538 966 112 4,616
1999 11,223 5,760 1 16,984 2,764 771 67 3,602
2000 11,432 6,096 1 17,529 2,443 667 41 3,151
2001 11,326 5,960 1 17,287 2,060 652 38 2,750
2002 11,972 7,023 3 18,998 1,821 641 27 2,489
2003 13,792 7,531 - 21,323 1,654 581 14 2,249
2004 14,631 3,648 1 18,280 1,389 515 15 1,919
2005 12,700 6,676 4 19,380 1,441 510 21 1,972
Total 134,313 62,249 39 196,601 59,026 20,033 816 79,875

Statistical Bulletin No. 36, June 2007 - Page 6

1990 1991 1992 1993 1994 1995 1996 1997
MetroPerth 371 1,108 1,442 1,516 1,784 1,649 1,712 2,776
Midland - - - - - - - -
Anawim - - - - - - - -
Other - - - - - - - -
Sub total 371 1,108 1,442 1,516 1,784 1,649 1,712 2,776
Midwest & MurchisonWiluna - - - - - - 1,451 2,493
Geraldton - - - - - - - -
Sub total - - - - - - 1,451 2,493
Goldfields & SE CoastalKalgoorlie - - - - 931 1,258 1,094 1,151
Sub total - - - - 931 1,258 1,094 1,151
KimberleyHalls Creek - - 754 2,105 2,248 1,971 1,873 2,432
Fitzroy Crossing - - - - 1,225 556 412 856
Kununurra - - - - - - 517 2,356
Broome - - - - - - - -
Derby - - - - - - - -
Wyndham - - - - - - - -
Sub total - - 754 2,105 3,473 2,527 2,802 5,644
Pilbara & GascoyneHedland - 425 1,331 2,237 2,053 1,402 1,251 1,180
Roebourne - - - 455 787 860 1,393 1,555
Sub total - 425 1,331 2,692 2,840 2,262 2,644 2,735
Total State 371 1,533 3,527 6,313 9,028 7,696 9,703 14,799
Data tables & figures related to Statistical Bulletin No. 36, June 2007 - Page A-�
Table A-1Annual admissions to sobering up centres, WA, 1990 - 1997
Utilisation of Sobering Up Centres, 1990 - 2005 Data Tables & Figures
Data tables & figures related to Statistical Bulletin No. 36, June 2007 - Page A-2
1998 1999 2000 2001 2002 2003 2004 2005
MetroPerth 2,881 2,775 2,548 2,455 2,910 2,587 892 2331
Midland - - - - 168 557 894 361
Anawim - - - - - 523 588 526
Other - - - 12 16 3 2 1
Sub total 2,881 2,775 2,548 2,467 3,094 3,670 2,376 3,219
Midwest & MurchisonWiluna 1,198 692 904 1,072 1,400 928 298 395
Geraldton - - - - - 23 767 933
Sub total 1,198 692 904 1,072 1,400 951 1,065 1,328
Goldfields & SE CoastalKalgoorlie 1,642 1,567 1,409 1,960 1,183 1,127 1,019 970
Sub total 1,642 1,567 1,409 1,960 1,183 1,127 1,019 970
KimberleyHalls Creek 1,927 1,614 1,536 1,801 1,459 1,913 1,560 1,217
Fitzroy Crossing 736 973 645 752 810 640 695 237
Kununurra 1,421 1,564 1,669 1,121 1,366 2,088 2,096 3,085
Broome - 2,477 3,086 2,965 4,511 4,951 4,030 3,853
Derby 1,006 2,141 1,785 2,047 2,229 2,348 1,748 1,759
Wyndham - - - - 138 1,531 1,263 871
Sub total 5,090 8,769 8,721 8,686 10,513 13,471 11,392 11,022
Pilbara & GascoyneHedland 1,566 1,466 1,902 1,447 1,209 899 1,184 1,541
Roebourne 1,473 1,715 2,045 1,655 1,599 1,205 1,244 1,300
Sub total 3,039 3,181 3,947 3,102 2,808 2,104 2,428 2,841
Total State 13,850 16,984 17,529 17,287 18,998 21,319 18,280 19,380
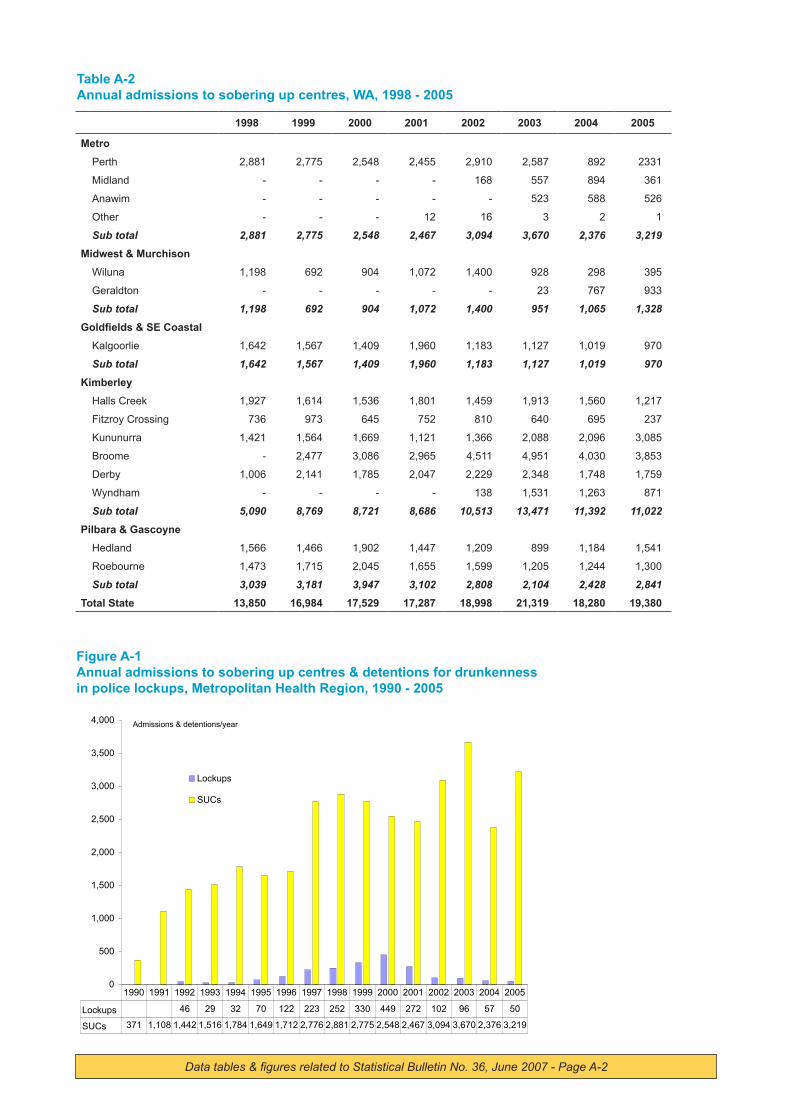
Table A-2Annual admissions to sobering up centres, WA, 1998 - 2005
Figure A-1Annual admissions to sobering up centres & detentions for drunkenness in police lockups, Metropolitan Health Region, 1990 - 2005
0
500
1,000
1,500
2,000
2,500
3,000
3,500
4,000
Lockups
SUCs
Lockups 46 29 32 70 122 223 252 330 449 272 102 96 57 50
SUCs 371 1,108 1,442 1,516 1,784 1,649 1,712 2,776 2,881 2,775 2,548 2,467 3,094 3,670 2,376 3,219
1990 1991 1992 1993 1994 1995 1996 1997 1998 1999 2000 2001 2002 2003 2004 2005
Admissions & detentions/year

Data tables & figures related to Statistical Bulletin No. 36, June 2007 - Page A-3
Figure A-2Admissions to Perth sobering up centre by age group, 1998 - 2005
5 120
508693
1,004
1,436 1,423
794570
25677 10 914
429
1,823
2,852
3,548
4,327
5,077
4,063
2,162
1,391
619312
112
0
1,000
2,000
3,000
4,000
5,000
6,000
< 15 15 - 19 20 - 24 25 - 29 30 - 34 35 - 39 40 - 44 45 - 49 50 - 54 55 - 59 60 - 64 65 - 69 70+
Females
Males
No. of admissions
Figure A-3Admissions to Midland sobering up centre by age group, 2002 - 2005
1128 32
51
135
71
3919 23
117
10
33
79
123
214232
399
196
101
69
8
42
0
50
100
150
200
250
300
350
400
450
15 - 19 20 - 24 25 - 29 30 - 34 35 - 39 40 - 44 45 - 49 50 - 54 55 - 59 60 - 64 65 - 69 70+
Females
Males
No. of admissions
Data tables & figures related to Statistical Bulletin No. 36, June 2007 - Page A-�
Figure A-4Admissions to Anawim sobering up centre by age group, 2003 - 2005
125
89117
393
291
578
206
159
3620
1 9
0
100
200
300
400
500
600
700
< 15 15 - 19 20 - 24 25 - 29 30 - 34 35 - 39 40 - 44 45 - 49 50 - 54 55 - 59 60 - 64 65 - 69 70+
No. of admissions
Figure A-5Annual admissions to sobering up centres & detentions for drunkenness in police lockups, Goldfields & South East Coastal Health Region 1992 - 2005
0
500
1,000
1,500
2,000
2,500
Lockups
SUCs
Lockups 866 841 729 546 855 1,047 1,127 758 420 664 475 511 495 355
SUCs 0 0 931 1,258 1,094 1,151 1,642 1,567 1,409 1,960 1,183 1,127 1,019 970
1992 1993 1994 1995 1996 1997 1998 1999 2000 2001 2002 2003 2004 2005
Admissions & detentions/year
Data tables & figures related to Statistical Bulletin No. 36, June 2007 - Page A-�
Figure A-6Admissions to Kalgoorlie sobering up centre by age group, 1998 - 2005
16 65
217
810
1,334
16742 21 420
121
299
1,271
1,8181,944
1,263
542463
11511 10
504
1,0851,216
1,1361,077
0
500
1,000
1,500
2,000
2,500
< 15 15 - 19 20 - 24 25 - 29 30 - 34 35 - 39 40 - 44 45 - 49 50 - 54 55 - 59 60 - 64 65 - 69 70+
Females
Males
No. of admissions
Figure A-7Annual admissions to sobering up centres & detentions for drunkenness in police lockups, Midwest & Murchison Health Region, 1992 - 2005
0
500
1,000
1,500
2,000
2,500
3,000
Lockups
SUCs
Lockups 451 701 1142 807 562 768 667 557 644 694 874 603 340 454
SUCs 0 0 0 0 1451 2493 1198 692 904 1072 1400 951 1065 1328
1992 1993 1994 1995 1996 1997 1998 1999 2000 2001 2002 2003 2004 2005
Admissions & detentions/year

Data tables & figures related to Statistical Bulletin No. 36, June 2007 - Page A-6
Figure A-8Admissions to Wiluna sobering up centre by age group, 1996 - 2005
11
300
736
924
410 379
14257
13958 68
20
914
1,863
1,082
539
408
504 530 543
290
181
48116
386
1,043
0
200
400
600
800
1,000
1,200
1,400
1,600
1,800
2,000
< 15 15 - 19 20 - 24 25 - 29 30 - 34 35 - 39 40 - 44 45 - 49 50 - 54 55 - 59 60 - 64 65 - 69 70+
Females
Males
No. of admissions
Figure A-9Admissions to Geraldton sobering up centre by age group, 2003 - 2005
2 819 21
117 124
84
5642
202
31
2
5670
156147
351
317
365
106
72
256 3
0
50
100
150
200
250
300
350
400
< 15 15 - 19 20 - 24 25 - 29 30 - 34 35 - 39 40 - 44 45 - 49 50 - 54 55 - 59 60 - 64 65 - 69 70+
Females
Males
No. of admissions

Data tables & figures related to Statistical Bulletin No. 36, June 2007 - Page A-7
Figure A-10Annual admissions to sobering up centres & detentions for drunkenness in police lockups, Pilbara & Gascoyne Health Region, 1991 - 2005
0
500
1,000
1,500
2,000
2,500
3,000
3,500
4,000
4,500
Lockups
SUCs
Lockups 0 2,128 1,313 1,232 1,791 1,933 1,040 568 548 576 238 194 248 159 176
SUCs 425 1,331 2,692 2,840 2,262 2,644 2,735 3,039 3,181 3,947 3,102 2,808 2,104 2,428 2,841
1991 1992 1993 1994 1995 1996 1997 1998 1999 2000 2001 2002 2003 2004 2005
Admissions & detentions/year
Figure A-11Admissions to Hedland sobering up centre by age group, 1991 - 2005
12
600
346
195 17780
1017
523
1,964 1,927
1,6331,567
1,361
1,197
818
1,006
675
54
456
1,206
1,630
1,265
1,016
1,3351,256
0
500
1,000
1,500
2,000
2,500
< 15 15 - 19 20 - 24 25 - 29 30 - 34 35 - 39 40 - 44 45 - 49 50 - 54 55 - 59 60 - 64 65 - 69 70+
Females
Males
6
No. of admissions

Data tables & figures related to Statistical Bulletin No. 36, June 2007 - Page A-�
Figure A-12Admissions to Roebourne sobering up centre by age group, 1993 - 2005
2 19113
291237
491
958
811
212
3 43
190274
932
1,442
1,710
1,989 1,959
1,710
677
247
62
220
1,207
1,074
1,358
0
500
1,000
1,500
2,000
2,500
< 15 15 - 19 20 - 24 25 - 29 30 - 34 35 - 39 40 - 44 45 - 49 50 - 54 55 - 59 60 - 64 65 - 69 70+
Females
Males
No. of admissions
Figure A-13Annual admissions to sobering up centres & detentions for drunkenness in police lockups, Kimberley Health Region, 1992 - 2005
0
2,000
4,000
6,000
8,000
10,000
12,000
14,000
16,000
Lockups
SUCs
Lockups 8,798 7,438 6,851 5,792 5,063 3,586 1,915 1,337 966 789 763 695 766 820
SUCs 754 2,105 3,473 2,527 2,802 5,644 5,090 8,769 8,721 8,686 10,51313,47111,39211,022
1992 1993 1994 1995 1996 1997 1998 1999 2000 2001 2002 2003 2004 2005
Admissions & detentions/year

Data tables & figures related to Statistical Bulletin No. 36, June 2007 - Page A-�
Figure A-14Admissions to Halls Creek sobering up centre by age group, 1992 - 2005
12
248
886803
490
23196 127
240
14
2,179
2,824
2,665
2,429
1,946
1,475
1,053
685 710
393 431
843
1,073
1,307
1,052
815
0
500
1,000
1,500
2,000
2,500
3,000
< 15 15 - 19 20 - 24 25 - 29 30 - 34 35 - 39 40 - 44 45 - 49 50 - 54 55 - 59 60 - 64 65 - 69 70+
Females
Males
No. of admissions
Figure A-15Admissions to Fitzroy Crossing sobering up centre by age group, 1994 - 2005
338
595
279
153192 197
10763
714
547
746
821
899
632
368 376
288
172 186
67
220
602
488
203
0
100
200
300
400
500
600
700
800
900
1,000
< 15 15 - 19 20 - 24 25 - 29 30 - 34 35 - 39 40 - 44 45 - 49 50 - 54 55 - 59 60 - 64 65 - 69 70+
Females
Males
No. of admissions

Data tables & figures related to Statistical Bulletin No. 36, June 2007 - Page A-�0
Figure A-16Admissions to Kununurra sobering up centre by age group, 1996 - 2005
2 61
454
712
973
586
180 207100
7 147 63
371
1,029
1,885
2,768
2,073
2,562
1,670
1,982
627
18592
290
1,101
0
500
1,000
1,500
2,000
2,500
3,000
< 15 15 - 19 20 - 24 25 - 29 30 - 34 35 - 39 40 - 44 45 - 49 50 - 54 55 - 59 60 - 64 65 - 69 70+
Females
Males
No. of admissions
Figure A-17Admissions to Derby sobering up centre by age group, 1998 - 2005
497
324
485
311 270
1041 1013
310
978
1,6831,784
1,966
1,834
1,628
703
481
210
39109
874848
697
843
0
500
1,000
1,500
2,000
2,500
< 15 15 - 19 20 - 24 25 - 29 30 - 34 35 - 39 40 - 44 45 - 49 50 - 54 55 - 59 60 - 64 65 - 69 70+
Females
Males
No. of admissions

Data tables & figures related to Statistical Bulletin No. 36, June 2007 - Page A-��
Figure A-18Admissions to Broome sobering up centre by age group, 1999 - 2005
7 62180
37 25 1110222
820
3,733
4,423
2,597
1,968 2,006
1,199
297 263 337
1,1421,382
2,237
660
2,187
1,231 1,297
2,142
0
500
1,000
1,500
2,000
2,500
3,000
3,500
4,000
4,500
5,000
< 15 15 - 19 20 - 24 25 - 29 30 - 34 35 - 39 40 - 44 45 - 49 50 - 54 55 - 59 60 - 64 65 - 69 70+
Females
Males
No. of admissions
Figure A-19Admissions to Wyndham sobering up centre by age group, 2002 - 2005
10
130159
5783 71
25 10 5222
148
359
963
423
516
316
151
74
317
323
158
241
305
0
100
200
300
400
500
600
700
800
900
1,000
< 15 15 - 19 20 - 24 25 - 29 30 - 34 35 - 39 40 - 44 45 - 49 50 - 54 55 - 59 60 - 64 65 - 69 70+
Females
Males
No. of admissions
Data tables & figures related to Statistical Bulletin No. 36, June 2007 - Page A-�2
BackgroundThe Detention of Drunken Persons Act 1989 was enacted on 27 April 1990 and decriminalised public drunkenness in Western Australia (WA). The impetus for the decrimi-nalisation of public drunkenness and the establishment of sobering up centres (SUCs) arose from recommendations contained in the report of the Royal Commission into Aboriginal Deaths in Custody.
The management, development and funding of SUCs presently rests with the Drug and Alcohol Office. (Initial responsibility for establishing SUCs was with the WA Alcohol and Drug Authority, now known as the Drug and Alcohol Office. Responsibility was transferred to the Health Department of WA in July 1997, shifted to the WA Drug Abuse Strategy Office in July 1998 and then assigned to the Drug and Alcohol Office in December 2001.)
Sobering up services generally operate five nights per week, apart from the Perth SUC, which operates seven nights per week. These services involve the provision of a substantial meal, clean bedding and sleepwear and laundering of clothes. The short stay aims to break the negative cycle of alcohol induced harm by providing care to intoxicated persons most at risk to themselves, their families and their community.
The expansion of SUCs throughout WA provides a more appropriate option to manage public intoxication. The positive impact of SUCs on the management of intoxicated persons rather than being detained in police lockups has been demonstrated at the regional level as well as for the whole state. The gains from the expansion in SUCs include:
reductions in police time and resources previously involved in detaining and monitoring intoxicated people in lock ups;reduced use of court time and resources;reduced levels of domestic violence and other problems associated with alcohol abuse; andreduced burden on hospitals because of fewer hospitali-sations for alcohol related illnesses and accidents.
Experience has shown that over a period of time the opening of a SUC usually encourages the community to develop additional services to address alcohol related problems. These include outreach programs, community patrols, homeless support programs, alcohol and other drug education programs and community support for initiatives to restrict alcohol availability.
•
••
•
Development & expansion
The first SUC was opened in the Perth inner metropolitan area in 1990. Since then SUCs have opened progressively in identified high priority localities throughout the State, as follows:
Perth (May 1990); Port Hedland (April 1991); Halls Creek (September 1992); Roebourne (February 1993); Fitzroy Crossing (March 1994); Kalgoorlie (June 1994); Wiluna (April 1996); Kununurra (September 1996); Derby (May 1998); Broome (February 1999); Midland (June 2002); Wyndham (December 2002); Anawim (February 2003); and Geraldton (December 2003).
This publication updates the data on the utilisation of sobering up centres previously published in:
Statistical Bulletin No. 5 (June 1999);Statistical Bulletin No. 11 (April 2001); and Statistical Bulletin No. 20 (June 2004).
Cost effectiveness
The annual cost of sobering up services has gradu-ally increased as the number of SUCs has expanded from, $318,733 in 1990/1991 to $3,547,190 million in 2004/2005.
This data shows that SUCs are a very cost effective service as they avoid costs that would otherwise be incurred if people had been detained or admitted to a hospital.
In the year 2005 there were 14 SUCs which had a total cost of $3,547,190, which represents an annual average cost of $253,370 per centre and an average of $183 per admission (using the 2004/2005 financial year data).
••••••••••••••
•••
This publication is available online athttp://www.dao.health.wa.gov.au