Embed Size (px)
Citation preview

UTI Market Outlook Report
February 2020

2
Disclaimers: The information on this document is provided for information purposes only. It does not constitute any offer, recommendation or solicitationto any person to enter into any transaction or adopt any hedging, trading or investment strategy, nor does it constitute any prediction of likely future
movements in rates or prices or any representation that any such future movements will not exceed those shown in any illustration. Users of thisdocument should seek advice regarding the appropriateness of investing in any securities, financial instruments or investment strategies referred to onthis document and should understand that statements regarding future prospects may not be realized. The recipient of this material is solely responsiblefor any action taken based on this material. Opinions, projections and estimates are subject to change without notice.
UTI AMC Ltd is not an investment adviser, and is not purporting to provide you with investment, legal or tax advice. UTI AMC Ltd or UTI Mutual Fund(acting through UTI Trustee Company Pvt. Ltd) accepts no liability and will not be liable for any loss or damage arising directly or indirectly (includingspecial, incidental or consequential loss or damage) from your use of this document, howsoever arising, and including any loss, damage or expensearising from, but not limited to, any defect, error, imperfection, fault, mistake or inaccuracy with this document, its contents or associated services, or dueto any unavailability of the document or any part thereof or any contents or associated services.
The information presented here is not an offer for sale within the United States of any security of UTI Asset Management Company Limited (the"Company"). Securities of the Company, including, but not limited to, its shares, may not be offered or sold in the United States absent registration underU.S. securities laws or unless exempt from registration under such laws.

Market Outlook Flow
Macro Economic View
Fixed Income Outlook
Equity Outlook

IMF projects 2019 global growth at 3.2% (10 bps lower than
Apr projection)
United States growth projection for 2019 raised by 30bps to
2.6% & 2020 retained at 1.9%
India’s GDP projection lowered by 30bps for 2019 & 2020 to
7% & 7.2% respectively
IMF 2020 world GDP growth at 3.5%
- Risks to global growth remain to the downside
Global Macros Growth: Global Growth slowdown
Source: The International Monetary Fund, based on latest IMFdata available till Jan 31, 2020
IMF Growth Projections
3.63.2
3.5
2.21.9 1.7
6.4 6.2 6.2
0.0
1.0
2.0
3.0
4.0
5.0
6.0
7.0
2018 2019 2020
World output Advanced economies Emerging & developing Asia
4
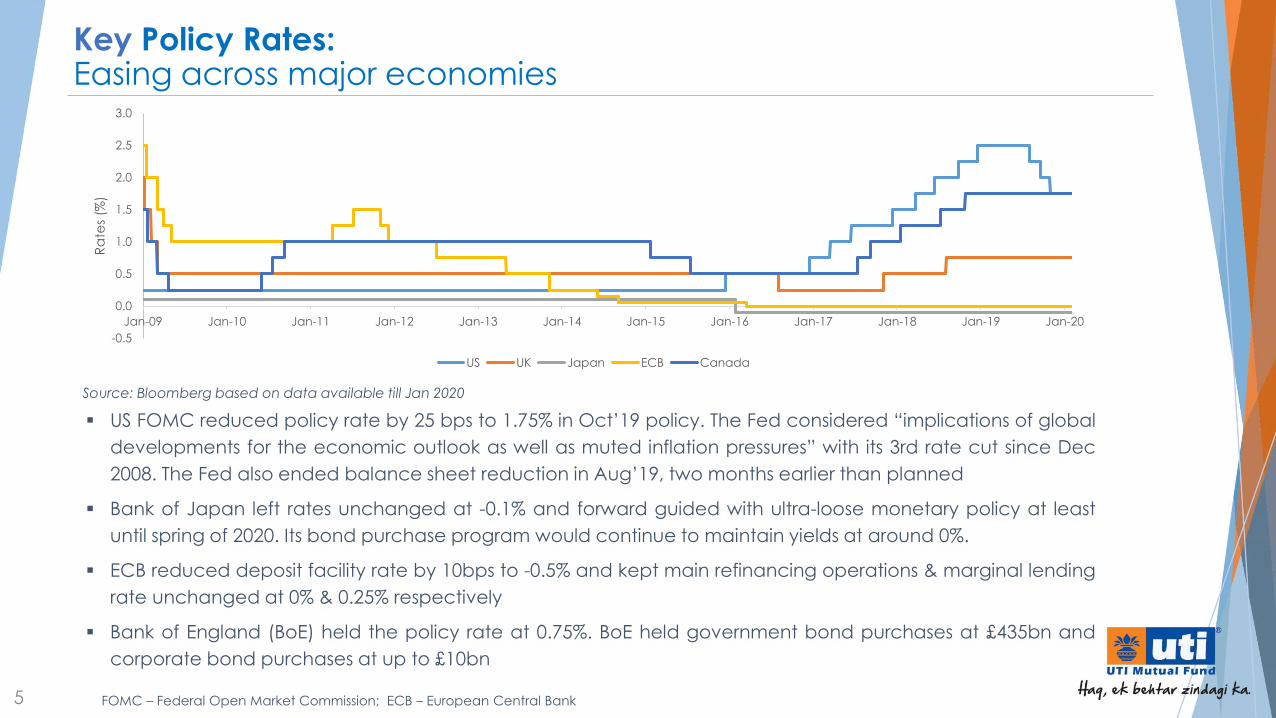
Key Policy Rates:Easing across major economies
US FOMC reduced policy rate by 25 bps to 1.75% in Oct’19 policy. The Fed considered “implications of global
developments for the economic outlook as well as muted inflation pressures” with its 3rd rate cut since Dec
2008. The Fed also ended balance sheet reduction in Aug’19, two months earlier than planned
Bank of Japan left rates unchanged at -0.1% and forward guided with ultra-loose monetary policy at least
until spring of 2020. Its bond purchase program would continue to maintain yields at around 0%.
ECB reduced deposit facility rate by 10bps to -0.5% and kept main refinancing operations & marginal lending
rate unchanged at 0% & 0.25% respectively
Bank of England (BoE) held the policy rate at 0.75%. BoE held government bond purchases at £435bn and
corporate bond purchases at up to £10bn
Source: Bloomberg based on data available till Jan 2020
5 FOMC – Federal Open Market Commission; ECB – European Central Bank
-0.5
0.0
0.5
1.0
1.5
2.0
2.5
3.0
Jan-09 Jan-10 Jan-11 Jan-12 Jan-13 Jan-14 Jan-15 Jan-16 Jan-17 Jan-18 Jan-19 Jan-20
Ra
tes
(%)
US UK Japan ECB Canada

Domestic Macro Growth:
Growth stalled, IIP contracts
Q2FY20 GDP at 4.5% hits a six-year low and IIP at -3.8% for Oct 2019 for third consecutive month
India's GDP growth hit a six-year low of 4.5% in Q2 2019, dragged mainly by deceleration in manufacturingoutput and subdued farm sector activity
The gross value added (GVA) growth in the manufacturing sector contracted by 1% in the Q2 of this fiscalfrom 6.9% expansion a year ago
Index of Industrial Production (IIP) contracted by 3.8% in Nov 2019 for third consecutive time against 4.3% inSep 2019 signalling a persistent slowdown
Negative growth in all the three sectors of manufacturing, mining and electricity pulled down IIP
IIP growth (YoY %)
Source: CSO based on data available till Dec 2019
Real GDP (YoY %)
Source: CSO based on data available till Dec 2019
6
-4.0%
0.0%
4.0%
8.0%
12.0%
Jun
-12
Sep
-12
Dec
-12
Mar
-13
Jun
-13
Sep
-13
Dec
-13
Mar
-14
Jun
-14
Sep
-14
Dec
-14
Mar
-15
Jun
-15
Sep
-15
Dec
-15
Mar
-16
Jun
-16
Sep
-16
Dec
-16
Mar
-17
Jun
-17
Sep
-17
Dec
-17
Mar
-18
Jun
-18
Sep
-18
Dec
-18
Mar
-19
Jun
-19
Sep
-19
GVA Agriculture Industry Services
YoY
%
3.3 3.3 4.0
3.3
4.6 4.4 3.8
0.6
-
1.0
2.0
3.0
4.0
5.0
FY 1
2-1
3
FY 1
3-1
4
FY 1
4-1
5
FY 1
5-1
6
FY 1
6-1
7
FY 1
7-1
8
FY 1
8-1
9
FYTD
19
-20
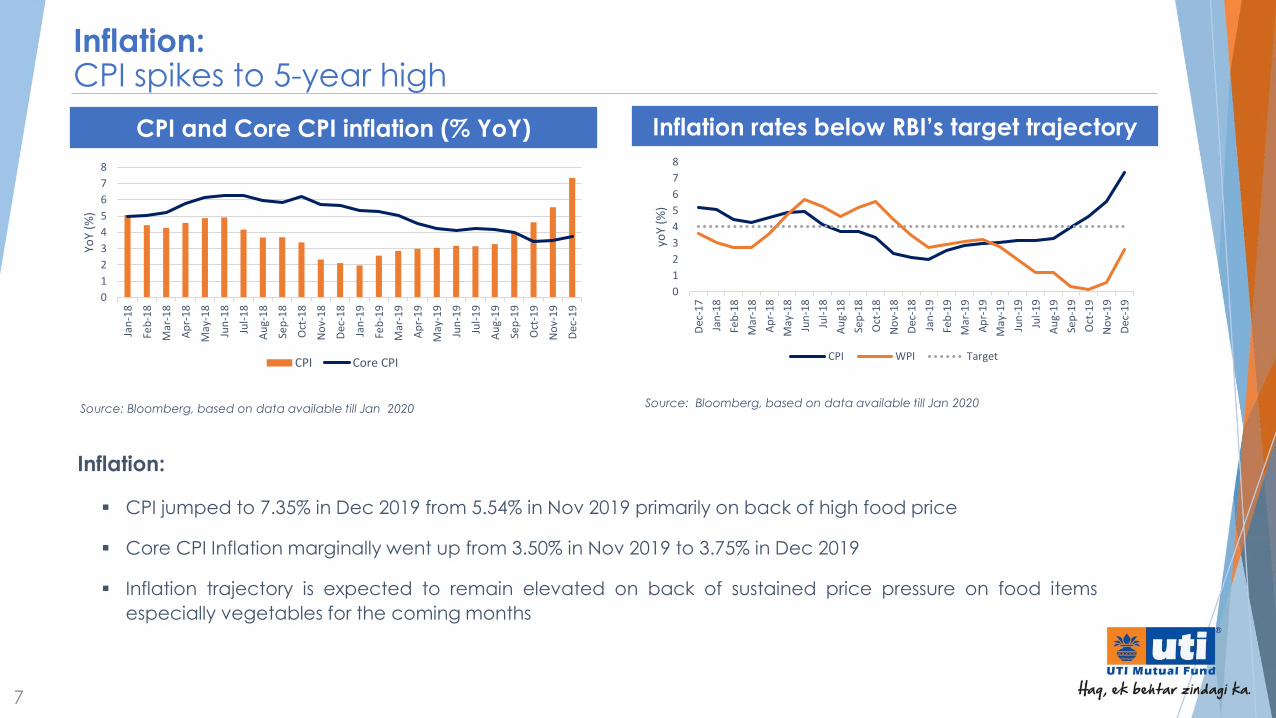
Inflation:CPI spikes to 5-year high
Inflation:
CPI jumped to 7.35% in Dec 2019 from 5.54% in Nov 2019 primarily on back of high food price
Core CPI Inflation marginally went up from 3.50% in Nov 2019 to 3.75% in Dec 2019
Inflation trajectory is expected to remain elevated on back of sustained price pressure on food items
especially vegetables for the coming months
Source: Bloomberg, based on data available till Jan 2020
CPI and Core CPI inflation (% YoY)
Source: Bloomberg, based on data available till Jan 2020
Inflation rates below RBI’s target trajectory
7
0
1
2
3
4
5
6
7
8
Jan
-18
Feb
-18
Mar
-18
Ap
r-1
8
May
-18
Jun
-18
Jul-
18
Au
g-1
8
Sep
-18
Oct
-18
No
v-1
8
Dec
-18
Jan
-19
Feb
-19
Mar
-19
Ap
r-1
9
May
-19
Jun
-19
Jul-
19
Au
g-1
9
Sep
-19
Oct
-19
No
v-1
9
Dec
-19
YoY
(%)
CPI Core CPI
0
1
2
3
4
5
6
7
8
Dec
-17
Jan
-18
Feb
-18
Mar
-18
Ap
r-1
8
May
-18
Jun
-18
Jul-
18
Au
g-1
8
Sep
-18
Oct
-18
No
v-1
8
Dec
-18
Jan
-19
Feb
-19
Mar
-19
Ap
r-1
9
May
-19
Jun
-19
Jul-
19
Au
g-1
9
Sep
-19
Oct
-19
No
v-1
9
Dec
-19
yoY
(%)
CPI WPI Target
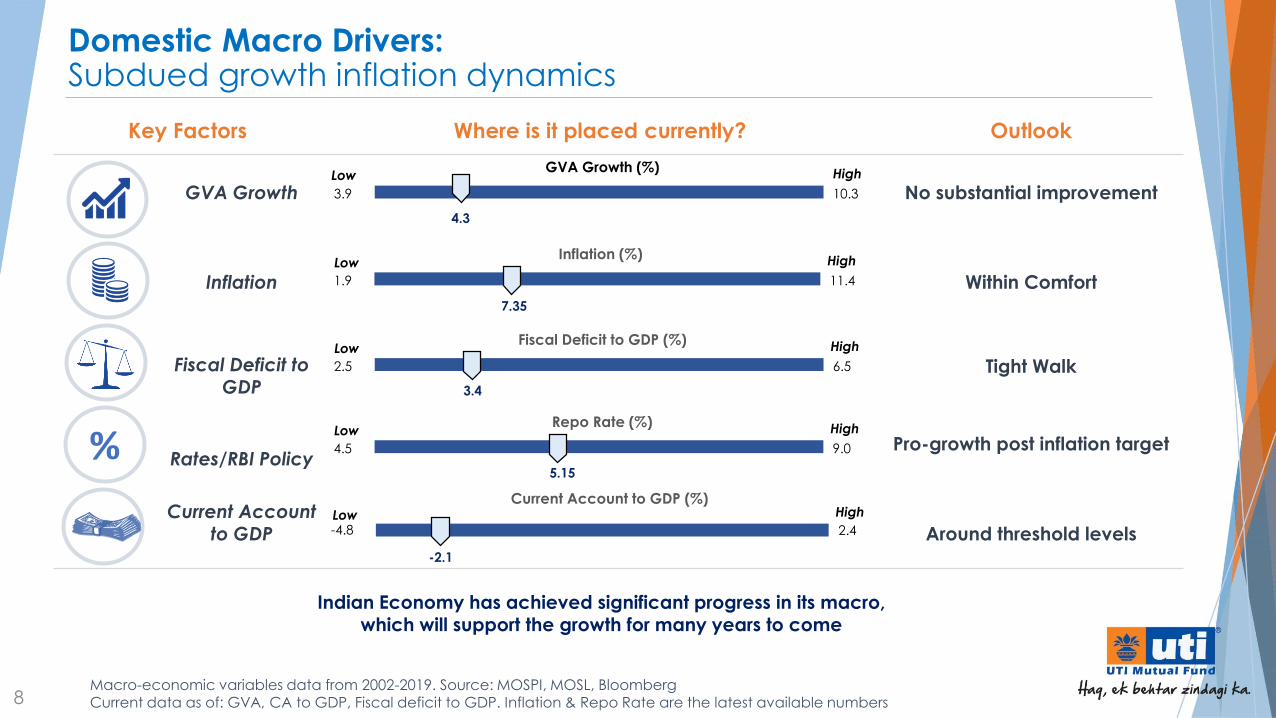
Domestic Macro Drivers:Subdued growth inflation dynamics
Key Factors Where is it placed currently? Outlook
GVA Growth No substantial improvement
Inflation Within Comfort
Fiscal Deficit to GDP
Tight Walk
Rates/RBI PolicyPro-growth post inflation target
Current Account to GDP Around threshold levels
Indian Economy has achieved significant progress in its macro,which will support the growth for many years to come
GVA Growth (%)
4.3
3.9 10.3
Low High
Inflation (%)
7.35
1.9 11.4
Low High
Fiscal Deficit to GDP (%)
3.4
2.5 6.5
Low High
Current Account to GDP (%)
-2.1
-4.8 2.4Low High
Repo Rate (%)
5.15
4.5 9.0
Low High
Macro-economic variables data from 2002-2019. Source: MOSPI, MOSL, Bloomberg Current data as of: GVA, CA to GDP, Fiscal deficit to GDP. Inflation & Repo Rate are the latest available numbers
%
8
Fixed Income Outlook

Indian 10 Year G-Sec:
Hardening of yields
Source: Bloomberg & RBI
The 10 year benchmark G-Sec, the 6.45 2029 GS yields inched up through the month and closed at6.60% (Jan 31, 2020) vis-à-vis 6.56% (Dec 31, 2019)
Factors impacting yields
- Geopolitical tensions between U.S. and Iran
- Uptick in CPI on back of higher food inflation
- Switch/Conversion auction of government securities by RBI
- Fall in crude oil prices on concerns that coronavirus outbreak in China may impact commodity’sdemand outlook
10
5.0
5.5
6.0
6.5
7.0
7.5
8.0
8.5
5.0
5.5
6.0
6.5
7.0
7.5
8.0
8.5
Jan-15 Jun-15 Nov-15 Apr-16 Sep-16 Feb-17 Jul-17 Dec-17 May-18 Oct-18 Mar-19 Aug-19 Jan-20
10
Yr
Gse
c (%
)
Re
po
(%
)
Repo Rate (LHS) 10 year G-sec Yield (RHS)
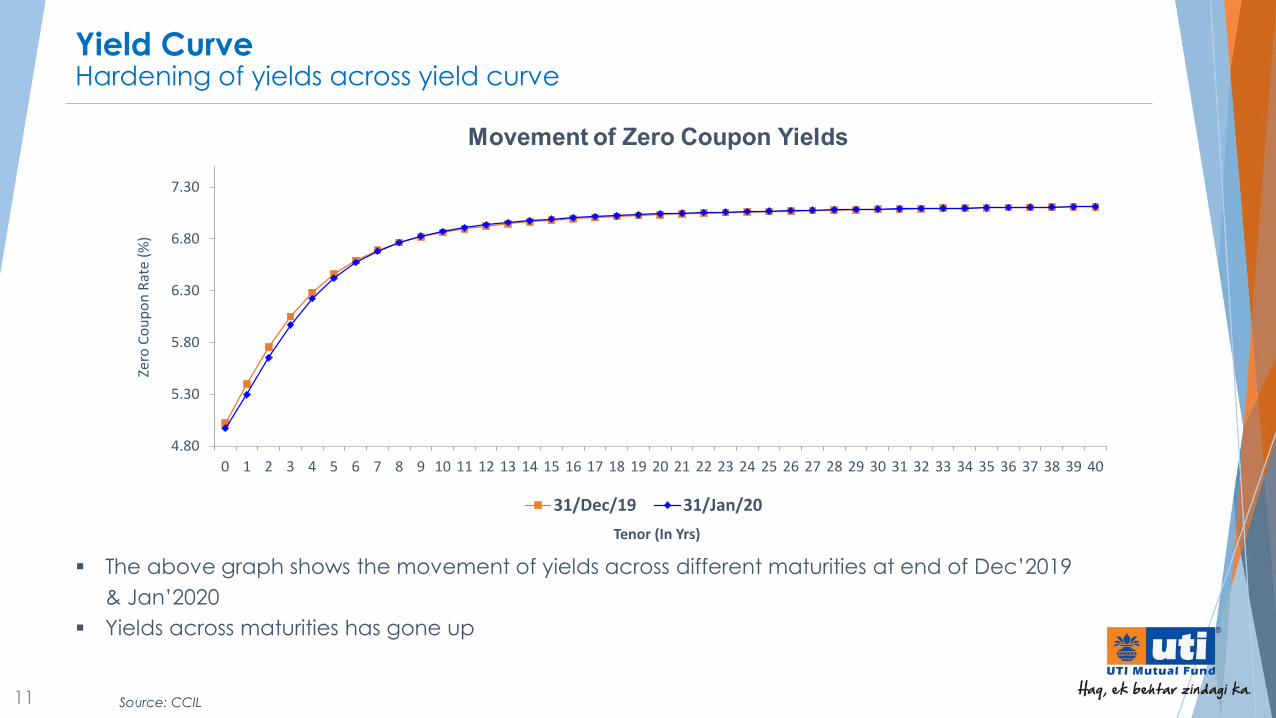
Yield Curve Hardening of yields across yield curve
Source: CCIL
The above graph shows the movement of yields across different maturities at end of Dec’2019
& Jan’2020
Yields across maturities has gone up
11
4.80
5.30
5.80
6.30
6.80
7.30
0 1 2 3 4 5 6 7 8 9 10 11 12 13 14 15 16 17 18 19 20 21 22 23 24 25 26 27 28 29 30 31 32 33 34 35 36 37 38 39 40
Zero
Co
up
on
Rat
e (%
)
Tenor (In Yrs)
31/Dec/19 31/Jan/20

12
Domestic Debt Market IndicatorsHardening of yields seen across instruments
Source: Bloomberg, Data as on last day of the above mentioned months
5.11
6.15
6.88
5.19
6.20
6.85
5.27
6.26
6.90
4.00
4.50
5.00
5.50
6.00
6.50
7.00
7.50
Tbill AAA AA
1 Year Rates (%)
Nov-19 Dec-19 Jan-20
5.86
6.65
7.41
6.24
6.95
7.62
6.21
6.83
7.51
5.00
5.50
6.00
6.50
7.00
7.50
8.00
8.50
9.00
G-sec AAA AA
3 Year Rates (%)
Nov-19 Dec-19 Jan-20
6.19
7.14
7.80
6.47
7.17
7.80
6.59
7.15
7.79
5.00
6.00
7.00
8.00
G-sec AAA AA
5 Year Rates (%)
Nov-19 Dec-19 Jan-20
6.47
7.74
8.36
6.56
7.63
8.28
6.60
7.83
8.47
6.00
6.50
7.00
7.50
8.00
8.50
9.00
G-sec AAA AA
10 Year Rates (%)
Nov-19 Dec-19 Jan-20

YTD Data till January 2020Data Source: ICRA MFI Explorer
BnUSD
13
Fund Flows:FPI/ FII Inflow and Debt MF Inflow trend
10.4 7.9 6.4
-8.2
25.0
6.7
-6.2
23.3
-6.8
3.6
-2.0
43.6
55.0
82.876.5
98.5
65.5
46.6
59.5
46.9
74.5
5.5
-20
0
20
40
60
80
100
120
FII/FPI flows Debt MF flows
14
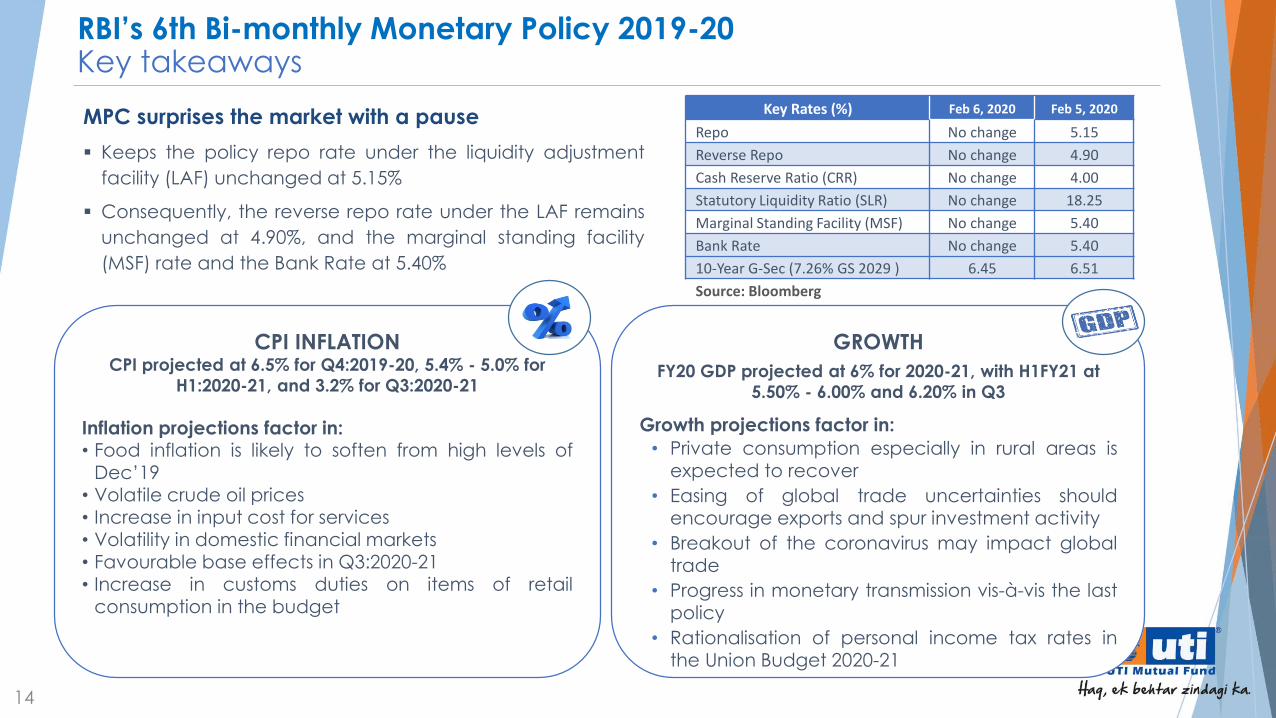
MPC surprises the market with a pause
Keeps the policy repo rate under the liquidity adjustment
facility (LAF) unchanged at 5.15%
Consequently, the reverse repo rate under the LAF remains
unchanged at 4.90%, and the marginal standing facility
(MSF) rate and the Bank Rate at 5.40%
Key Rates (%) Feb 6, 2020 Feb 5, 2020
Repo No change 5.15
Reverse Repo No change 4.90
Cash Reserve Ratio (CRR) No change 4.00
Statutory Liquidity Ratio (SLR) No change 18.25
Marginal Standing Facility (MSF) No change 5.40
Bank Rate No change 5.40
10-Year G-Sec (7.26% GS 2029 ) 6.45 6.51
Source: Bloomberg
CPI INFLATIONCPI projected at 6.5% for Q4:2019-20, 5.4% - 5.0% for
H1:2020-21, and 3.2% for Q3:2020-21
Inflation projections factor in: • Food inflation is likely to soften from high levels of
Dec’19• Volatile crude oil prices• Increase in input cost for services• Volatility in domestic financial markets• Favourable base effects in Q3:2020-21• Increase in customs duties on items of retail
consumption in the budget
GROWTH
FY20 GDP projected at 6% for 2020-21, with H1FY21 at
5.50% - 6.00% and 6.20% in Q3
Growth projections factor in:
• Private consumption especially in rural areas isexpected to recover
• Easing of global trade uncertainties shouldencourage exports and spur investment activity
• Breakout of the coronavirus may impact globaltrade
• Progress in monetary transmission vis-à-vis the lastpolicy
• Rationalisation of personal income tax rates inthe Union Budget 2020-21
RBI’s 6th Bi-monthly Monetary Policy 2019-20Key takeaways

In such a scenario, funds having a combination of income accrual and low to short term
duration would provide a good investment opportunity for the investors
Fixed Income:Current Market Outlook
15
The debt market reacted positively post policy announcement especially on the shorter end of yield curvewith 3 & 5-year g-sec segment saw a rally of 15 to 18 bps, while the 10-year G-Sec benchmark saw a rally of 6bps closing at 6.45%
Going forward, the markets will closely track the growth-inflation dynamics and would look forward to openingup of monetary policy space in the second half of the fiscal as inflation is expected to soften in H2 FY20-21. The10-year benchmark is expected to trade in the range of 6.20% to 6.60% for rest of the calendar year. On theglobal front markets will monitor the impact of corona virus on global growth, movement in crude oil prices,geo-political situation, currency movement, etc
An accommodative stance from RBI with ample and cheap liquidity in the system is expected to support theshorter end of the yield and hence funds with a focus on income accrual and low to shorter duration (up to 3years) are expected to remain attractive for investors
MPC maintained a status quo on rates. RBI announced a slew of developmental & regulatory measures whichincluded providing a revised liquidity management framework, incentivizing credit flow to sectors affected by aslowing economy and introducing long term repo operations for improving the monetary transmission
Measures announced by RBI is likely to provide ample liquidity in the system while kick starting the credit flowtowards the productive sectors of the economy. This is expected to have a multiplier effect and bolster growth.

Equity Outlook
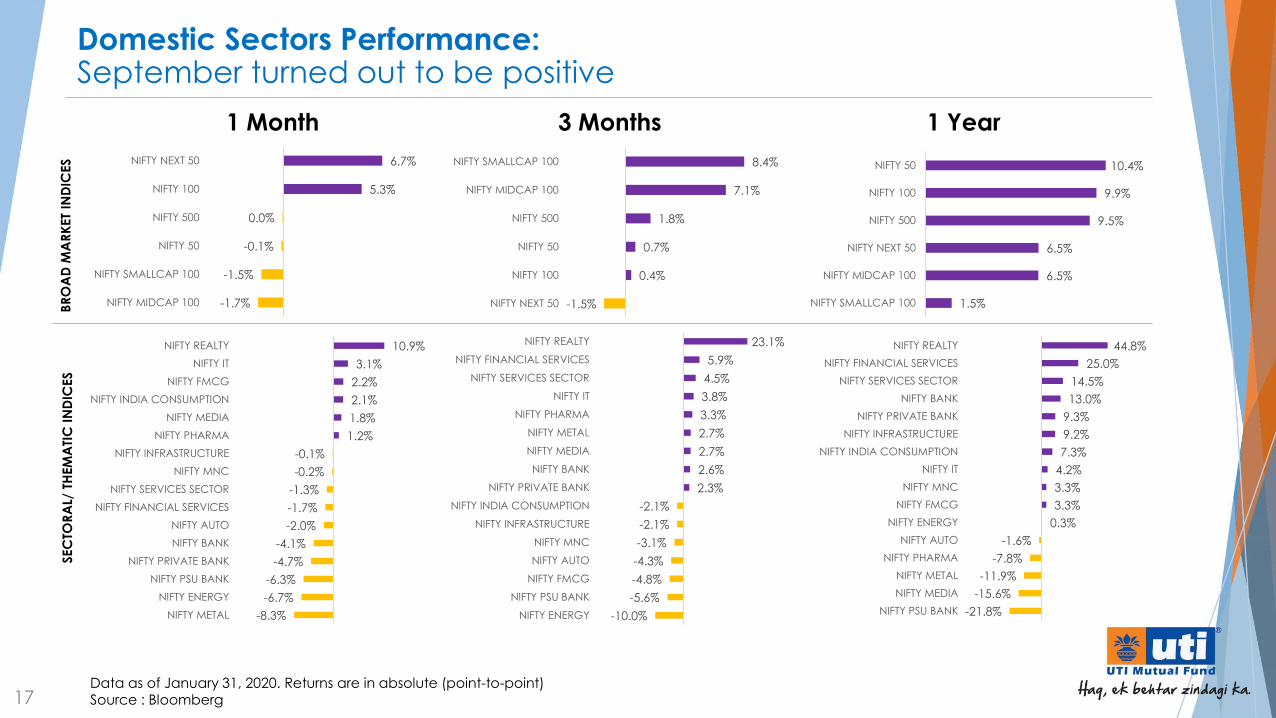
Data as of January 31, 2020. Returns are in absolute (point-to-point)Source : Bloomberg
Domestic Sectors Performance:September turned out to be positive
17
3 Months 1 Year1 Month
-1.5%
0.4%
0.7%
1.8%
7.1%
8.4%
NIFTY NEXT 50
NIFTY 100
NIFTY 50
NIFTY 500
NIFTY MIDCAP 100
NIFTY SMALLCAP 100
1.5%
6.5%
6.5%
9.5%
9.9%
10.4%
NIFTY SMALLCAP 100
NIFTY MIDCAP 100
NIFTY NEXT 50
NIFTY 500
NIFTY 100
NIFTY 50
-10.0%
-5.6%
-4.8%
-4.3%
-3.1%
-2.1%
-2.1%
2.3%
2.6%
2.7%
2.7%
3.3%
3.8%
4.5%
5.9%
23.1%
NIFTY ENERGY
NIFTY PSU BANK
NIFTY FMCG
NIFTY AUTO
NIFTY MNC
NIFTY INFRASTRUCTURE
NIFTY INDIA CONSUMPTION
NIFTY PRIVATE BANK
NIFTY BANK
NIFTY MEDIA
NIFTY METAL
NIFTY PHARMA
NIFTY IT
NIFTY SERVICES SECTOR
NIFTY FINANCIAL SERVICES
NIFTY REALTY
-21.8%
-15.6%
-11.9%
-7.8%
-1.6%
0.3%
3.3%
3.3%
4.2%
7.3%
9.2%
9.3%
13.0%
14.5%
25.0%
44.8%
NIFTY PSU BANK
NIFTY MEDIA
NIFTY METAL
NIFTY PHARMA
NIFTY AUTO
NIFTY ENERGY
NIFTY FMCG
NIFTY MNC
NIFTY IT
NIFTY INDIA CONSUMPTION
NIFTY INFRASTRUCTURE
NIFTY PRIVATE BANK
NIFTY BANK
NIFTY SERVICES SECTOR
NIFTY FINANCIAL SERVICES
NIFTY REALTY
BR
OA
D M
AR
KET
IND
ICES
-1.7%
-1.5%
-0.1%
0.0%
5.3%
6.7%
NIFTY MIDCAP 100
NIFTY SMALLCAP 100
NIFTY 50
NIFTY 500
NIFTY 100
NIFTY NEXT 50
SEC
TOR
AL/
TH
EM
ATI
C I
ND
ICES
-8.3%
-6.7%
-6.3%
-4.7%
-4.1%
-2.0%
-1.7%
-1.3%
-0.2%
-0.1%
1.2%
1.8%
2.1%
2.2%
3.1%
10.9%
NIFTY METAL
NIFTY ENERGY
NIFTY PSU BANK
NIFTY PRIVATE BANK
NIFTY BANK
NIFTY AUTO
NIFTY FINANCIAL SERVICES
NIFTY SERVICES SECTOR
NIFTY MNC
NIFTY INFRASTRUCTURE
NIFTY PHARMA
NIFTY MEDIA
NIFTY INDIA CONSUMPTION
NIFTY FMCG
NIFTY IT
NIFTY REALTY
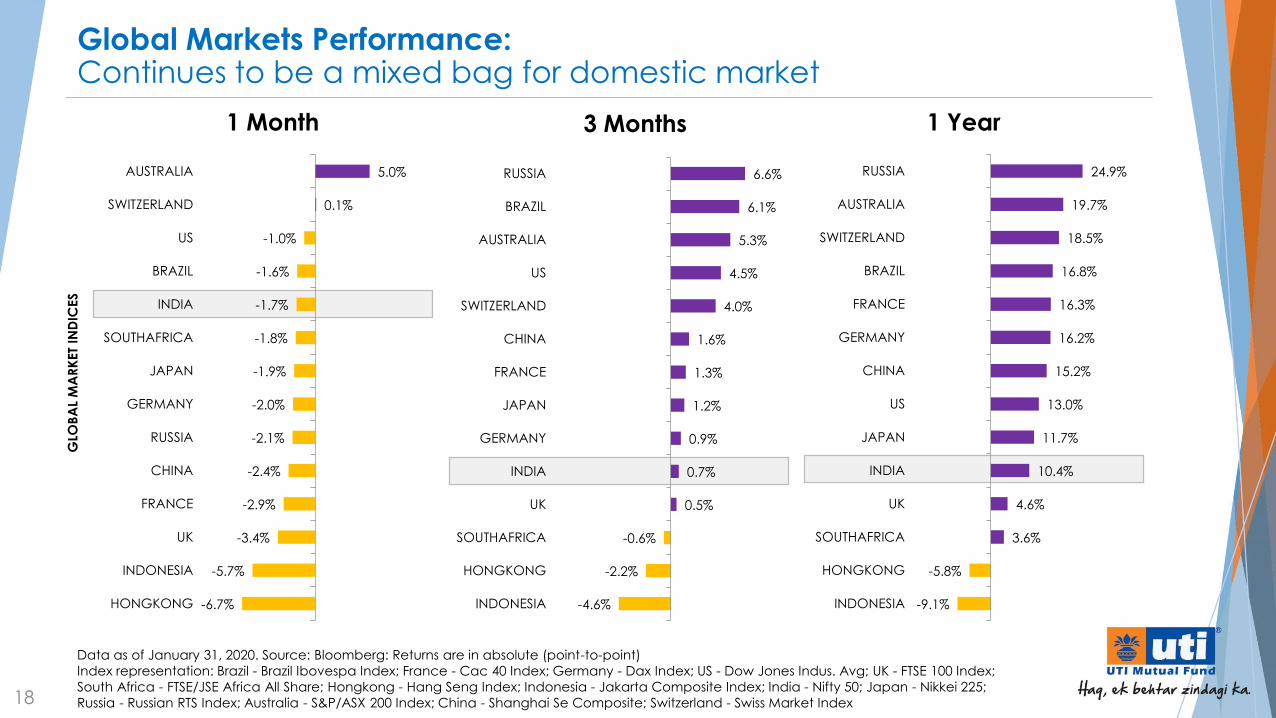
Data as of January 31, 2020. Source: Bloomberg: Returns are in absolute (point-to-point)
Index representation: Brazil - Brazil Ibovespa Index; France - Cac 40 Index; Germany - Dax Index; US - Dow Jones Indus. Avg; UK - FTSE 100 Index;
South Africa - FTSE/JSE Africa All Share; Hongkong - Hang Seng Index; Indonesia - Jakarta Composite Index; India - Nifty 50; Japan - Nikkei 225;
Russia - Russian RTS Index; Australia - S&P/ASX 200 Index; China - Shanghai Se Composite; Switzerland - Swiss Market Index
Global Markets Performance:Continues to be a mixed bag for domestic market
18
3 Months 1 Year1 Month
GLO
BA
L M
AR
KET
IND
ICES
-6.7%
-5.7%
-3.4%
-2.9%
-2.4%
-2.1%
-2.0%
-1.9%
-1.8%
-1.7%
-1.6%
-1.0%
0.1%
5.0%
HONGKONG
INDONESIA
UK
FRANCE
CHINA
RUSSIA
GERMANY
JAPAN
SOUTHAFRICA
INDIA
BRAZIL
US
SWITZERLAND
AUSTRALIA
-4.6%
-2.2%
-0.6%
0.5%
0.7%
0.9%
1.2%
1.3%
1.6%
4.0%
4.5%
5.3%
6.1%
6.6%
INDONESIA
HONGKONG
SOUTHAFRICA
UK
INDIA
GERMANY
JAPAN
FRANCE
CHINA
SWITZERLAND
US
AUSTRALIA
BRAZIL
RUSSIA
-9.1%
-5.8%
3.6%
4.6%
10.4%
11.7%
13.0%
15.2%
16.2%
16.3%
16.8%
18.5%
19.7%
24.9%
INDONESIA
HONGKONG
SOUTHAFRICA
UK
INDIA
JAPAN
US
CHINA
GERMANY
FRANCE
BRAZIL
SWITZERLAND
AUSTRALIA
RUSSIA

Equity Mutual Fund Inflows include Arbitrage Funds, Equity Mutual Fund Inflows in CY 2020 as of Jan-20Data Source: AMFI. Mutual Funds (Equity & ELSS Schemes)FII (Foreign Institutional Investors)
Fund Flows:FPI/ FII Inflow and Equity MF Inflow trend
BnUSD
19
29.3
-0.5
24.5
19.8
16.2
3.3 2.9
8.0
-4.6
14.2
1.4
-3.1
1.6
-2.9-1.8
8.0
13.6
7.8
22.8
19.9
10.1
1.1
-15
-10
-5
0
5
10
15
20
25
30
FPI/ FII Inflow Equity MF Inflow

Source: Bloomberg. Data as of January 09, 2020The vertical axis is on a logarithmic scale Nifty 50, EPS: Earnings per share.CAGR: Compound annual growth rate
Earnings Trend:Forecast suggest Acceleration
20
78 92
131 161
172 225
268
240
251 314
341
356
399
400
389
413
454
486
551 694
Ma
r-92
Ma
r-93
Ma
r-94
Ma
r-95
Ma
r-96
Ma
r-97
Ma
r-98
Ma
r-99
Ma
r-00
Ma
r-01
Ma
r-02
Ma
r-03
Ma
r-04
Ma
r-05
Ma
r-06
Ma
r-07
Ma
r-08
Ma
r-09
Ma
r-10
Ma
r-11
Ma
r-12
Ma
r-13
Ma
r-14
Ma
r-15
Ma
r-16
Ma
r-17
Ma
r-18
Ma
r-19
Ma
r-20
E
Ma
r-21
E
Nifty
50
EP
S
13% 26%7%
S&P BSE Sensex EPS Trend Nifty 50 EPS Trend

Source: Bloomberg. Data as of February 07, 2020
Continued downgrades even after recent tax cuts
21
Nifty
50
EP
STrend in Consensus Nifty 50 EPS
533
500
550
600
650
700
750
800
850
900
Apr-17 Aug-17 Dec-17 Apr-18 Aug-18 Dec-18 Apr-19 Aug-19 Dec-19
FY19 FY20 FY21
551
694
Feb-20
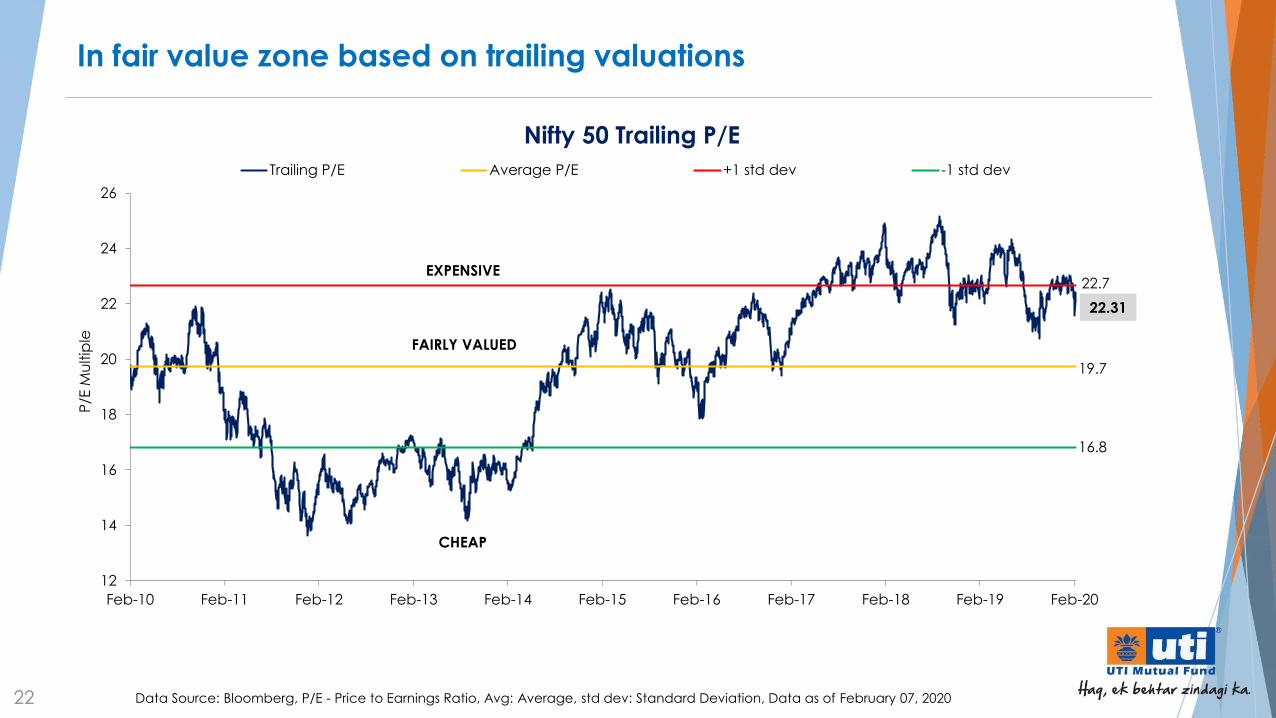
In fair value zone based on trailing valuations
22 Data Source: Bloomberg, P/E - Price to Earnings Ratio, Avg: Average, std dev: Standard Deviation, Data as of February 07, 2020
P/E
Mu
ltip
le
FAIRLY VALUED
EXPENSIVE
CHEAP
Nifty 50 Trailing P/E
12
14
16
18
20
22
24
26
Feb-10 Feb-11 Feb-12 Feb-13 Feb-14 Feb-15 Feb-16 Feb-17 Feb-18 Feb-19 Feb-20
Trailing P/E Average P/E +1 std dev -1 std dev
22.7
19.7
16.8
22.31

23 Data Source: Bloomberg, P/E - Price to Earnings Ratio, Avg: Average, std dev: Standard Deviation, Data as of February 07, 2020
P/E
Mu
ltip
le FAIRLY VALUED
EXPENSIVE
CHEAP
Nifty 50 Forward P/E
Sep-19 rally has moved Nifty forward P/E into expensive zone
10
12
14
16
18
20
Feb-10 Feb-11 Feb-12 Feb-13 Feb-14 Feb-15 Feb-16 Feb-17 Feb-18 Feb-19 Feb-20
Forward P/E Average P/E +1 std dev -1 std dev
17.4
15.6
13.7
17.97

P/B in fair value zone; awaiting mean reversion in RoE
24 Data Source: Bloomberg, P/B - Price to Book Ratio, Avg: Average, std dev: Standard Deviation, Data as of January 09, 2020
Nifty 50 Trailing P/B Nifty 50 Return on Equity (RoE)
CHEAP
12.42
Ro
E
1.5
2.0
2.5
3.0
3.5
4.0
Feb-10 Feb-12 Feb-14 Feb-16 Feb-18 Feb-20
Trailing P/B Average P/B +1 std dev -1 std dev
P/B
Mu
ltip
le
FAIRLY VALUED
EXPENSIVE
3.0
2.7
2.4
2.87
10
11
12
13
14
15
16
17
18
19
20
Feb-10 Feb-12 Feb-14 Feb-16 Feb-18 Feb-20
Return on Equity

Equities are in the attractive zone relative to gilts
25 Data Source: Yield difference is difference of Nifty Yield (1/Forward P/E) and 10 year G-sec yield. Data as of February 07, 2020
Nifty 50 Yield vs 10 Year G-Sec Yield
(5)
(4)
(3)
(2)
(1)
-
1
2
3
4
5
6
Feb-06 Feb-07 Feb-08 Feb-09 Feb-10 Feb-11 Feb-12 Feb-13 Feb-14 Feb-15 Feb-16 Feb-17 Feb-18 Feb-19 Feb-20
Yield Difference Avg. Yield Differnce
Current Yield difference is -0.87%
10 Year Average Yield difference is -1.00%
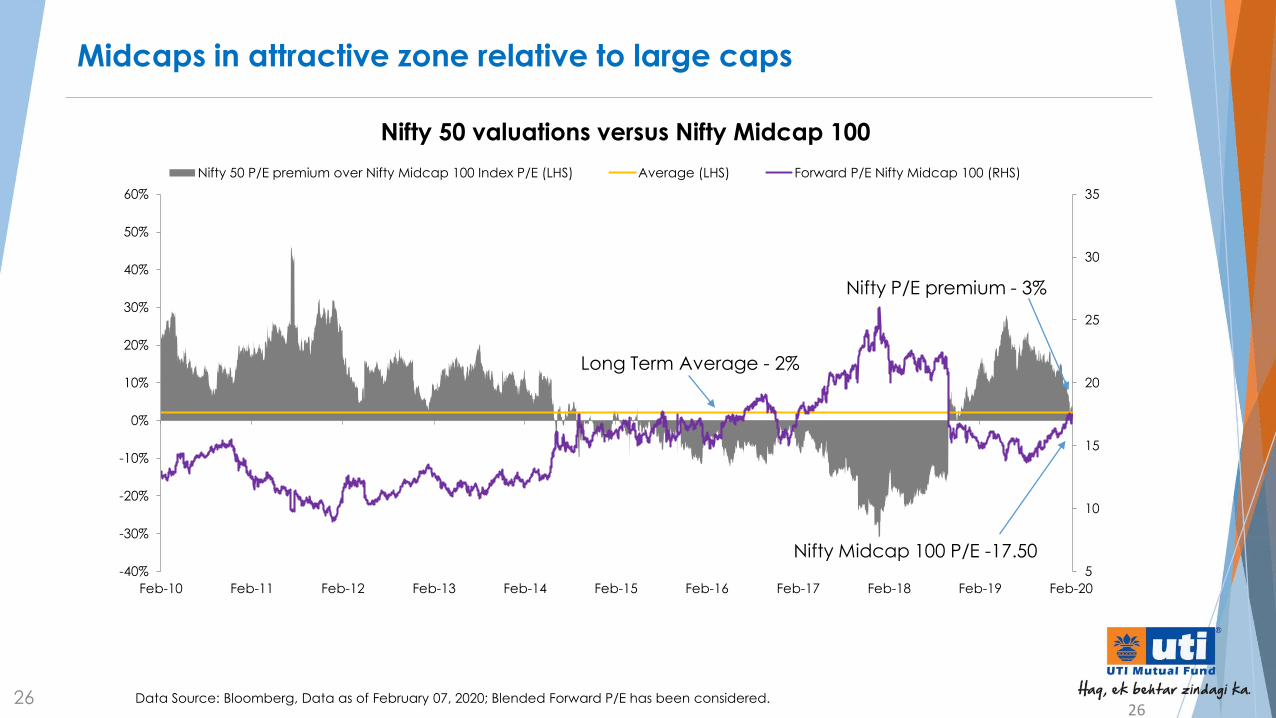
2626 Data Source: Bloomberg, Data as of February 07, 2020; Blended Forward P/E has been considered.
Midcaps in attractive zone relative to large caps
Nifty 50 valuations versus Nifty Midcap 100
5
10
15
20
25
30
35
-40%
-30%
-20%
-10%
0%
10%
20%
30%
40%
50%
60%
Feb-10 Feb-11 Feb-12 Feb-13 Feb-14 Feb-15 Feb-16 Feb-17 Feb-18 Feb-19 Feb-20
Nifty 50 P/E premium over Nifty Midcap 100 Index P/E (LHS) Average (LHS) Forward P/E Nifty Midcap 100 (RHS)
Nifty P/E premium - 3%
Nifty Midcap 100 P/E -17.50
Long Term Average - 2%
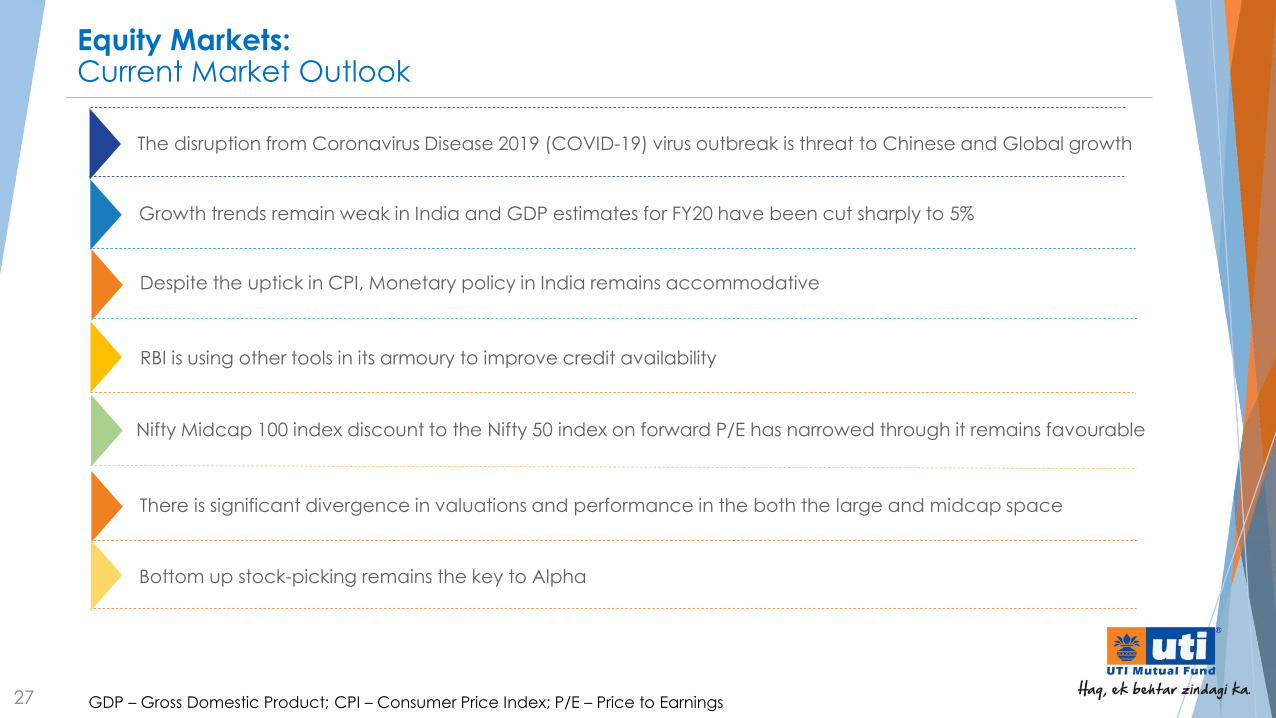
Equity Markets:Current Market Outlook
27 GDP – Gross Domestic Product; CPI – Consumer Price Index; P/E – Price to Earnings
The disruption from Coronavirus Disease 2019 (COVID-19) virus outbreak is threat to Chinese and Global growth
Nifty Midcap 100 index discount to the Nifty 50 index on forward P/E has narrowed through it remains favourable
Despite the uptick in CPI, Monetary policy in India remains accommodative
Growth trends remain weak in India and GDP estimates for FY20 have been cut sharply to 5%
RBI is using other tools in its armoury to improve credit availability
There is significant divergence in valuations and performance in the both the large and midcap space
Bottom up stock-picking remains the key to Alpha

Product Positioning

Eq
uity
& I
nd
ex Diversified Funds
Liq
uid
& D
eb
tH
yb
rid
&So
lutio
ns
Thematic Fund
Sector
Index & ETFs
Large Cap
UTI Mastershare Unit Scheme
Multi Cap
UTI Equity Fund
Large & Mid Cap
UTI Core Equity Fund
Mid Cap
UTI Mid Cap Fund
Infrastructure
UTI Infrastructure Fund
MNC
UTI MNC Fund
Lifestyle
UTI India Consumer Fund
Banking & Financial
UTI B&FS Fund
Healthcare
UTI Healthcare Fund
Transportation & Logistics
UTI T&L Fund
Index – Nifty 50
UTI Nifty Index (Fund & ETF)
Index – Nifty Next 50
UTI Nifty Next 50 (Fund & ETF)
Index – S&P BSE Sensex
UTI Sensex ETF
Index- S&P BSE Sensex Next 50
UTI S&P BSE Sensex Next 50ETF
Dividend Yield
UTI Dividend Yield Fund
Value
UTI Value Opportunities Fund
Accrual
Duration
Credit
Hybrid
Solutions
Product Bouquet: An Overview
Liquid
UTI Liquid Cash Plan
Overnight
UTI Overnight Fund
Money Market
UTI Money Market Fund
Ultra Short Term
UTI Ultra Short Term Fund
Floater Fund
UTI Floater Fund
Banking & PSU Debt
UTI Banking & PSU Debt Fund
Short Term
UTI Short Term Income Fund
Corporate Bond
UTI Corporate Bond Fund
Dynamic Bond
UTI Dynamic Bond Fund
Medium to Long Term
UTI Bond Fund
Gilt
UTI Gilt Fund
Low Duration
UTI Treasury Advantage Fund
Credit Risk
UTI Credit Risk Fund
Medium Term
UTI Medium Term Fund
Conservative Hybrid
UTI Regular Savings Fund
Aggressive Hybrid
UTI Hybrid Equity Fund
Multi Asset Fund
UTI Multi Asset Fund
Arbitrage
UTI Arbitrage Fund
Equity Savings
UTI Equity Savings Fund
Children’s Fund
UTI CCF (Savings & Investment)
Retirement
UTI Retirement Benefit PF UTI ULIP
ELSS
UTI LTEF (Tax Saving)
Gold ETF
UTI Gold ETF
29

Equity – Products
UTI MastershareUnit Scheme
UTI Core Equity Fund
UTI Equity Fund
UTI Value Opportunities Fund
UTI Mid Cap Fund
Market Capitalisation
Large Cap Mid Cap Small Cap Scheme Characteristics
Min. 80% in Large Cap Stocks
Min. 35% in Large & Mid Cap each
Investing across the Market Caps
Following Value investment Strategy
Min. 65% in Mid Cap Stocks
30

Fixed Income – Product Positioning : Duration vis-a-vis Credit Quality
1 day 3 to 4 yrs0 to 3 mths
3 to 6 mths
6 to 12 mths
1 to 3 years
4 to 7 yrs 7+ yrs
CREDIT ORIENTEDAAA/AA+: <=35%
AA/AA-/A : 65% >=
MODERATE QUALITYAAA/AA+: 50% to 70%
AA/ AA-/ A : 30% to 50%
HIGH QUALITYAAA/ AA+ : 80% >= AA/ AA-/ A: <= 20%
HIGHEST QUALITYAAA/AA+ : 95% >=,AA/ AA-/ A : <= 5%
DURATION BUCKET
CREDITQUALITY
UTI
OVERNIGHT
FUND
UTI LIQUID
CASH PLAN
UTI ULTRA
SHORT
TERM FUND
UTI
FLOATER
FUND
UTI TREASURY
ADVTG FUND
UTI MONEY
MKT FUND
UTI B&PSUD
FUND
UTI SHORT TERM
INCOME FUNDUTI BOND
FUND
UTI CREDIT
RISK FUND
UTI GILT FUND
UTI DYNAMIC
BOND FUND
UTI MEDIUM
TERM FUND
31
UTI CORPORATE
BOND FUND

Hybrid - bucketing by Scheme Characteristics
UTI CCF – Savings Plan
UTI RBPF
UTI Regular Savings Fund
Debt : 60% to 100%
Equity : 0% to 40%
Debt : 75% to 90%
Equity : 10% to 25%
Debt : 60% to 100%
Equity : 0% to 40%
UTI Hybrid Equity Fund Equity : 65% to 80%
Debt : 20% to 35%
UTI Arbitrage Fund Equity : 65% to 100%
Derivatives : 65% to 100%
UTI Multi-Asset Fund*Equity : 65% to 100%
Debt : 10%to 25%
Gold : 10% to 25%
UTI CCF – Investment PlanEquity : 70% to 100%
Debt : 0% to 30%
Arbitrage
Multi Asset
Hybrid Aggressive
Solution Children
Solution Retirement
Hybrid Conservative
Solution Children
UTI ULIP@ Dynamic Allocation Debt : 60% to 100%
Equity : 0% to 40%
3
4
1
6
7
8
9
*of which Cash future arbitrage opportunities 20% to 75%, Net long equity position 20% to 50%@ subject to SEBI approval
UTI Equity Savings Fund Equity : 65% to 90%*
Debt : 10% to 35% Equity Savings5
32
2

Name of the Scheme This product is suitable for investors who are seeking* Riskometer
UTI Mastershare Unit Scheme
(Large Cap Fund- An open ended equity scheme
predominantly investing in large cap stocks)
• Long term capital appreciation
• Investment predominantly in equity instruments of large cap
companies
UTI Core Equity Fund
(Large & Mid Cap Fund- An open ended equity scheme
investing in both large cap and mid cap stocks)
• Long term capital appreciation
• Investment predominantly in equity instruments of both large cap
and mid cap companies
UTI Mid Cap Fund
(Mid Cap Fund- An open ended equity scheme
predominantly investing in mid cap stocks)
• Long term capital appreciation
• Investment predominantly in mid cap companies
UTI Value Opportunities Fund
(An open ended equity scheme following a value
investment strategy)
• Long term capital appreciation
• Investment in equity instruments following a value investment
strategy across the market capitalization spectrum
UTI Equity Fund
(Multi Cap Fund- An open ended equity scheme investing
across large cap, mid cap, small cap stocks)
• Long term capital appreciation
• Investment in equity instruments of companies with good growth
prospects across the market capitalization spectrum
UTI Dividend Yield Fund
(An open ended equity scheme predominantly investing in
dividend yielding stocks)
• Long term capital appreciation
• Investment predominantly in dividend yielding equity and equity
related securities
UTI Infrastructure Fund
(An open ended equity scheme following the
Infrastructure theme)
• Long term capital appreciation
• Investment predominantly in equity and equity related securities of
companies forming part of the infrastructure sector
UTI MNC Fund
(An open ended equity following the theme of investing
predominantly in equity and equity related securities of
Multi-National Companies)
• Long term capital appreciation
• Investment predominantly in equity and equity related securities of
Multi-National companies
UTI India Consumer Fund
(An open ended equity scheme following the theme of
changing consumer aspirations, changing lifestyle and
growth of consumption)
• Long term capital growth
• Investment in equity instruments of companies that are expected to
benefit from of the changing consumer aspirations, changing
lifestyle and growth of consumption
Product Label
*Investors should consult their financial advisers if in doubt about whether the product is suitable for them.
33
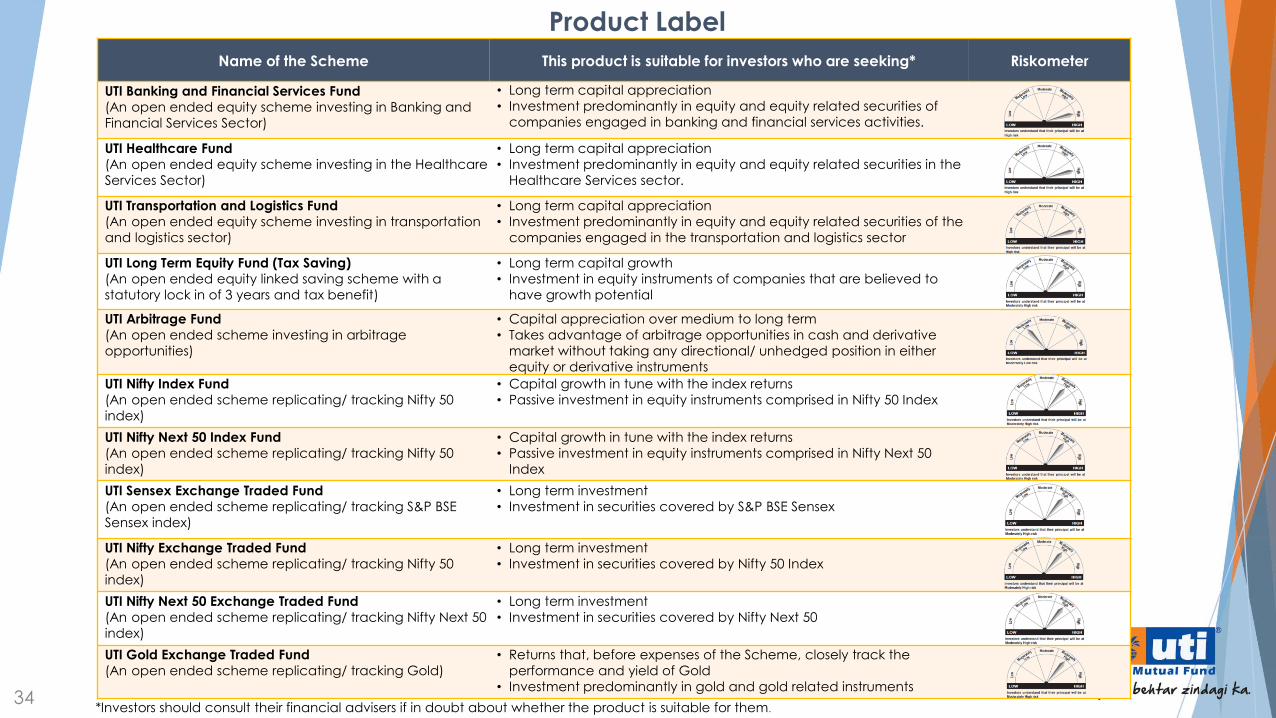
Name of the Scheme This product is suitable for investors who are seeking* Riskometer
UTI Banking and Financial Services Fund
(An open ended equity scheme investing in Banking and
Financial Services Sector)
• Long term capital appreciation
• Investment predominantly in equity and equity related securities of
companies engaged in banking and financial services activities.
UTI Healthcare Fund
(An open ended equity scheme investing in the Healthcare
Services Sector)
• Long term capital appreciation
• Investment predominantly in equity and equity related securities in the
Healthcare Services sector.
UTI Transportation and Logistics Fund
(An open ended equity scheme investing in transportation
and logistics sector)
• Long term capital appreciation
• Investment predominantly in equity and equity related securities of the
companies engaged in the transportation and logistics sector
UTI Long Term Equity Fund (Tax Saving)
(An open ended equity linked saving scheme with a
statutory lock in of 3 years and tax benefit)
• Long term capital growth
• Investment in equity instruments of companies that are believed to
have growth potential
UTI Arbitrage Fund
(An open ended scheme investing in arbitrage
opportunities)
• Capital appreciation over medium to long term
• Takes advantage of arbitrage opportunities in cash and derivative
market without taking any directional/ unhedged position in either
equity or derivative instruments
UTI Nifty Index Fund
(An open ended scheme replicating/ tracking Nifty 50
index)
• Capital growth in tune with the index returns
• Passive investment in equity instruments comprised in Nifty 50 Index
UTI Nifty Next 50 Index Fund
(An open ended scheme replicating/ tracking Nifty 50
index)
• Capital growth in tune with the index returns
• Passive investment in equity instruments comprised in Nifty Next 50
Index
UTI Sensex Exchange Traded Fund
(An open ended scheme replicating/ tracking S&P BSE
Sensex index)
• Long term investment
• Investment in securities covered by S&P BSE Sensex
UTI Nifty Exchange Traded Fund
(An open ended scheme replicating/ tracking Nifty 50
index)
• Long term investment
• Investment in securities covered by Nifty 50 Index
UTI Nifty Next 50 Exchange Traded Fund
(An open ended scheme replicating/ tracking Nifty Next 50
index)
• Long term investment
• Investment in securities covered by Nifty Next 50
UTI Gold Exchange Traded Fund
(An open ended scheme replicating/ tracking Gold)
• Returns that, before expenses of the Scheme, closely track the
performance and yield of Gold
• Investment predominantly in gold and gold related instruments
Product Label
*Investors should consult their financial advisers if in doubt about whether the product is suitable for them.34

Name of the Scheme This product is suitable for investors who are seeking* Riskometer
UTI Overnight Fund
(An open ended debt scheme investing in overnight securities)
• Reasonable income over one day with capital preservation
• Investment in overnight securities
UTI Liquid Cash Plan
(An open ended liquid scheme)• Steady and reasonable income over short-term with capital
preservation.
• Investment in money market securities & high quality debt
UTI Ultra Short Term Fund
(An open ended ultra-short term debt scheme investing in instruments such
that the Macaulay duration of the portfolio is between 3 months and 6
months)
• Reasonable income with low volatility over short term
• Investment in debt & money market instruments
UTI Treasury Advantage Fund
(An open ended low duration debt scheme investing in instruments such that
the Macaulay duration of the portfolios is between 6 months and 12 months)
• Reasonable income consistent with high liquidity over short term
• Investment in Debt & Money Market instruments
UTI Money Market Fund
(An open ended debt scheme investing in money market
instruments)
• Reasonable income with high level of liquidity over short-term
• Investment in money market securities
UTI Corporate Bond Fund
(An open ended debt scheme predominantly investing in AA+ and
above rated corporate bonds)
• Optimal returns over the medium to long term
• To invest predominantly in AA+ and above rated corporate debt
UTI Short Term Income Fund
(An Open ended Short Term Debt Scheme investing in instruments such that
the Macaulay duration of portfolio is between 1 year and 3 years)
• Reasonable income with low risk and high level of liquidity over
short-term
• Investment in Debt & Money Market instrument
UTI Medium Term Fund
(An open ended medium term debt scheme investing in instruments such
that the Macaulay duration of the portfolio is between 3 years and 4 years)
• Reasonable income over the medium to long term
• Investment in Debt & Money Market Instruments
UTI Bond Fund
(An open ended medium term debt scheme investing in instruments such
that the Macaulay duration of the portfolio is between 4 years and 7 years)
• Optimal returns with adequate liquidity over medium to long term
• Investment in Debt & money market instruments
UTI Dynamic Bond Fund
(An open ended dynamic debt scheme investing across duration)
• Optimal returns with adequate liquidity over medium to long term
• Investment in Debt & Money Market Instruments
UTI Credit Risk Fund
(An open ended debt scheme predominantly investing in AA and below
rated corporate bonds (excluding AA+ rated corporate bonds))
• Reasonable income and capital appreciation over medium to
long term
• Investment in debt and money market instruments
Product Label
*Investors should consult their financial advisers if in doubt about whether the product is suitable for them.35
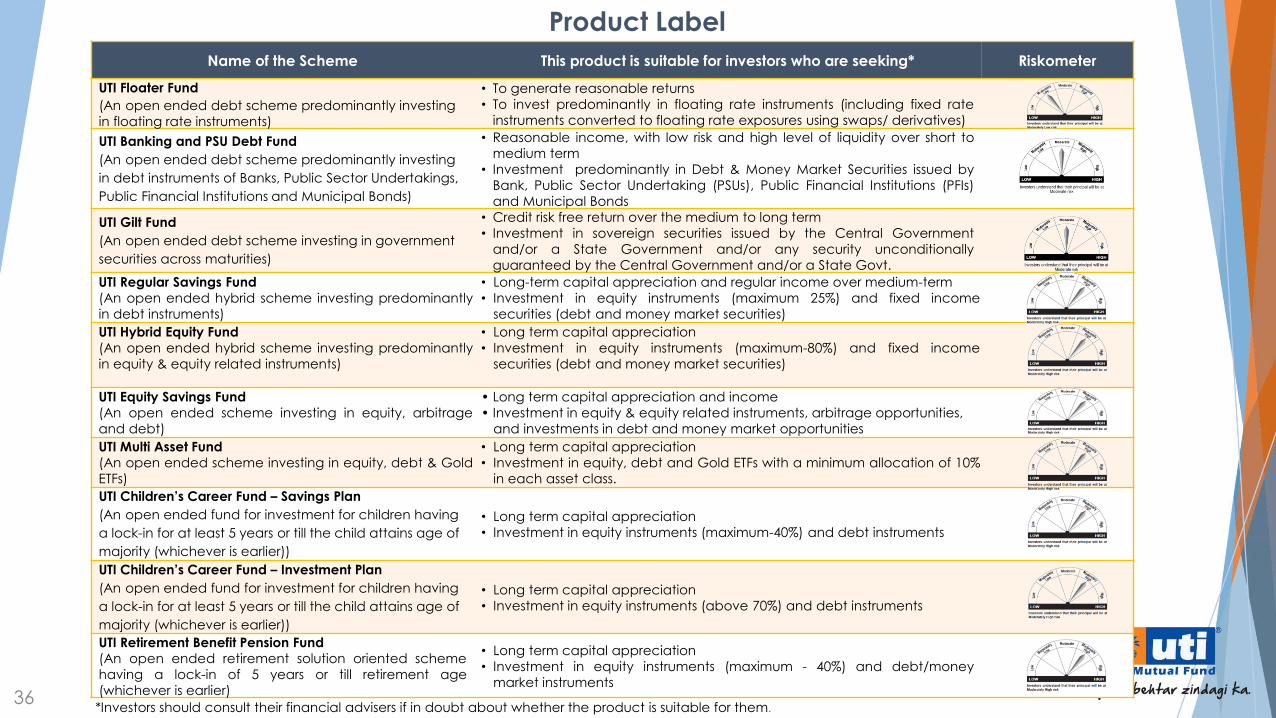
Name of the Scheme This product is suitable for investors who are seeking* Riskometer
UTI Floater Fund
(An open ended debt scheme predominantly investing
in floating rate instruments)
• To generate reasonable returns
• To invest predominantly in floating rate instruments (including fixed rate
instruments converted to floating rate exposures using swaps/ derivatives)
UTI Banking and PSU Debt Fund
(An open ended debt scheme predominantly investing
in debt instruments of Banks, Public Sector Undertakings,
Public Financial Institutions and Municipal Bonds)
• Reasonable income, with low risk and high level of liquidity over short to
medium term
• Investment predominantly in Debt & Money Market Securities issued by
Bank, Public Sector Undertaking (PSUs), Public Financial Institutions (PFIs)
and Municipal Bonds
UTI Gilt Fund
(An open ended debt scheme investing in government
securities across maturities)
• Credit risk free return over the medium to long term
• Investment in sovereign securities issued by the Central Government
and/or a State Government and/or any security unconditionally
guaranteed by the Central Government and/or a State Govt.
UTI Regular Savings Fund
(An open ended hybrid scheme investing predominantly
in debt instruments)
• Long-term capital appreciation and regular income over medium-term
• Investment in equity instruments (maximum 25%) and fixed income
securities (debt and money market securities)
UTI Hybrid Equity Fund
(An open ended hybrid scheme investing predominantly
in equity & equity related instruments)
• Long term capital appreciation
• Investment in equity instruments (maximum-80%) and fixed income
securities (debt and money market securities)
UTI Equity Savings Fund
(An open ended scheme investing in equity, arbitrage
and debt)
• Long term capital appreciation and income
• Investment in equity & equity related instruments, arbitrage opportunities,
and investments in debt and money market opportunities
UTI Multi Asset Fund
(An open ended scheme investing in equity, debt & Gold
ETFs)
• Long term capital appreciation
• Investment in equity, debt and Gold ETFs with a minimum allocation of 10%
in each asset class.
UTI Children’s Career Fund – Savings Plan
(An open ended fund for investment for children having
a lock-in for at least 5 years or till the child attains age of
majority (whichever is earlier))
• Long term capital appreciation
• Investment in equity instruments (maximum-40%) and debt instruments
UTI Children’s Career Fund – Investment Plan
(An open ended fund for investment for children having
a lock-in for at least 5 years or till the child attains age of
majority (whichever is earlier))
• Long term capital appreciation
• Investment in equity instruments (above 70%) and debt instruments
UTI Retirement Benefit Pension Fund
(An open ended retirement solution oriented scheme
having a lock-in of 5 years or till retirement age
(whichever is earlier)
• Long term capital appreciation
• Investment in equity instruments (maximum - 40%) and debt/money
market instruments
*Investors should consult their financial advisers if in doubt about whether the product is suitable for them.
Product Label
36

AMFI: Association of Mutual Funds of India
Avg. Average
Bn: Billion
BoJ: Bank of Japan
BoP: Balance of Payments
CAD: Current Account Deficit
CAGR: Compounded Annualized Growth Rate
CP: Commercial Papers
CPI(IW): CPI Industrial Workers
CPI: Consumer Price Index
CPOS: Capital Protection Oriented Scheme
CSO: Central Statistical Office
Dual Adv. FTF: Dual Advantage Fixed Term Fund
EBITDA: Earning Before Interest, Tax, Depreciation, Amortization
ECB: External Commercial Borrowing
ELSS: Equity Linked Savings Scheme
EPS: Earnings Per Share
FD: Fiscal Deficit
FMPs: Fixed Maturity Plans
Forex: Foreign exchange
FTIF: Fixed Term Income Fund
FY: Financial Year
GDP: Gross Domestic Product
GVA: Gross Value Added
Abbreviations
GST: Goods & Services Tax
IIP: Index of Industrial Production
INR: Indian Rupee
MF: Mutual Fund
MOSPI: Ministry of Statistics and Programme Implementation
P/E: Price to Earning Multiple
RBI: Reserve Bank of India
SEBI: Securities & Exchange Board of India
US Fed/Fed: US Federal Reserve
USD: US Dollar
vs: Versus
WPI: Wholesale Price Index
YoY: Year on Year
37

Thank You
REGISTERED OFFICE: UTI Tower, ‘Gn’ Block, Bandra Kurla Complex, Bandra (E), Mumbai - 400051. Phone: 022 – 66786666. UTI Asset Management
Company Ltd (Investment Manager for UTI Mutual Fund) Email: [email protected] . (CIN-U65991MH2002PLC137867). For more information, please
contact the nearest UTI Financial Centre or your AMFI/NISM certified UTI Mutual Fund Independent Financial Advisor (IFA) for a copy of the
Statement of Additional Information, Scheme Information Document and Key Information Memorandum cum Application Form.
Mutual Fund Investments are subject to market risks, read all scheme related documents carefully