Embed Size (px)
Citation preview

122
International Journal of Academic Research in Accounting, Finance and Management Sciences Vol. 6, No. 4, October 2016, pp. 122–133
E-ISSN: 2225-8329, P-ISSN: 2308-0337 © 2016 HRMARS
www.hrmars.com
Youths’ Unemployment, Migration and NEETs in the Post-Crisis Period
Mariana BĂLAN
Institute for Economic Forecasting, Romanian Academy, Bucharest, Romania, E-mail: [email protected]
Abstract The unemployment rate among youths (22.2%) was more than twice as high as compared with the
unemployment rate for the entire active population in the year 2014 (9%). In the context of increasingly higher levels of unemployment, the youths face increasingly more difficulties in finding a job and many of them could decide to extend their period of inactivity on the labour market or to take up studying again. This could represent an investment for the future, provided that market matching skills are acquired. Nevertheless, the reality is that many youths are neither employed, nor studying and these youths are the representatives of the NEET group. The high unemployment and NEET rate among youths leads to decreasing employment chances for individuals and most times to their decision to emigrate. During the last years, the emigration rate increased at world level and the structure on age groups of the migration flows has changed. Thus, young migrants represented in 2013 a third of total migrants at world level. The main reasons for migration among youths are: unemployment, the NEET status, poverty, poor standards of living, issues related to education and, in some instances, the difficult political situation. The paper presents a comparative analysis of the unemployment development, of the NEET rate and of emigration among youths from Romania and in other EU member-states for the period 2008-2014.
Key words NEET rate, youth emigration, youth unemployment, migration
DOI: 10.6007/IJARAFMS/v6-i4/2328 URL: http://dx.doi.org/10.6007/IJARAFMS/v6-i4/2328
1. Introduction
In the year 2013, according to the estimates of the United Nations1, there were 232 million migrants at world level, representing 3.2% from the total world population (7.2 billion individuals2). From among these, 35 million migrants have ages under 20 years (on increase by approximately 12 pp against the year 2000), and other 40 million are between 20 and 29 years of age. As result, it could be said that the young migrants’ segment represents over 32% from total migrants at world level in the year 2013.
The main reasons of youths’ migration are: unemployment, the NEET status, poverty, poor standard of living, the issues related to education and the difficult political situation.
Unemployment among youths was and still is a world level concern the more so as, in this post-crisis period, the labour market is characterised by high volatility at both European and world level. The age segment 15 to 24 years continues to be one of the segments most affected by the crisis. In the year 2014, at world level, the unemployment rate among youths reached 13.2% and it is almost thrice as high as the unemployment rate among adults. Over 74.5 million youths with ages between 15 and 24 years were unemployed in the year 2013, on increase by approximately 700000 individuals as compared with the previous year. In the same year, on the labour market, were employed 37.1 million youths less than in the year 2007, while the world youths population decreased with only 8.1 million individuals during the same period. The employment rate of youths at world level, of 43.2% in the year 20133, continues to be by approximately 2 percentage points under the level of the same rate before the crisis.
1 The World Youth Report 2013 - Youth &Migration, Published by the United Nations, The Department of Economic and Social Affairs of the United Nations Secretariat, www.UNWorldYouthReport.org 2 Migration and Development Brief 20., (2013), UN, http://siteresources.worldbank.org 3 Global Employment Trends 2013: Global Employment Trends for Youth 2013, A generation at risk; ILO, 2013, www.ilo.org

International Journal of Academic Research in Accounting, Finance and Management Sciences Vol. 6 (4), pp. 122–133, © 2016 HRMARS
123
The unemployment rate for the age segment under 25 years of age, at EU-28 level, was of 22.2% in the year 2014 on increase by 6.6 pp against the year 2007, but on slight decrease (-1.4 percentage points) against the year 2013. For the age group 15 to 29 years, the unemployment rate increased in the period 2007-2014 by 5.5 percentage points, and its diminishment in the year 2014 against the preceding year was of only 1%. Also for Romania in 2014, the unemployment rate among youths with ages between 15 and 24 years was of 24% and for the age group 25 to 29 years of 10.5%, on increase by 5.4 pp, respectively 3.8 pp. against the year 2007. On age groups, unemployment among young women was higher for the age group 15 to 24 years, the increase in 2014 against the year 2007 being for this segment of young women by 6.4 pp (against 4.4 p for the age segment 25 to 29 years.
In the European Union, the number of youths with ages under 30 years who are neither employed nor in education or training (the NEET population) increased to almost 14 million individuals (or 15.3% of the young population).
2. Literature review
The reasons for emigration among youths are varied and they are most time a mix of several major factors that lead to the migration decision. The existing data at the level of the international bodies regarding individual migration are not enough for drawing a conclusion with respect to the reasons for which youths migrate. Based on empirical evidence and on other information, the design was facilitated for a set of factors that determine youths to migrate. Among the identified factors were: looking for a better life for them and their families; the intention to avoid poverty, violence, unemployment, the NEET status or the effects of climatic changes; yet, others wish to study abroad, to reunite with their families or to get married.
The migration flows shaped by youths are not homogenous: they come from various socio-economic environments and represent a wide range of profiles and competences.
In the specialised literature, the negative effects of unemployment and of the NEET status and their correlations with the size and structure of the migration flows among youths were highlighted in various specialised papers. From these, we would like to mention: Chen, Y. W. (2011); Giovanni S. F. B., Marelli E. and Signorelli M., (2013); Hughes D., Borbély-Pecze T.B., (2012); Mroz and Savage, (2006); Schmillen A. and Umkehrer M., (2013); Bell D. N.F. and. Blanchflower D.G. (2011); Contini B., (2010); Zimmermann (2013), Rakauskiene O.G.and Ranceva O. (2014), a.s.o.
This paper intends to make a comparative analysis of the unemployment development, of the NEET rate and of the emigration among youths from Romania and other member-states for the period 2008-2014.
3. Methodology of research
The methodology used in the present paper pursues to fulfil the scientific objectives. Descriptive statistical analysis (graphs, tables) was used mainly for visualising and synthesising information detached from a data set. Classification analysis was employed for defining a typology of employed, unemployed youths, and NEETs on age groups, educational levels and genders in Romania and other member-states.
The performed analyses have made use of the data published by the National Employment Agency (NEA), respectively the Yearly Reports (2007-2015); the Reports regarding unemployment in Romania; Reports on the Realisation Stage of the National Plan for Vocational Training; the Employment Programmes of NEA; documents of the Romanian Government and of the Ministry of Labour, Family, Social Protection and Elderly (the National Employment Strategy 2004-2010; the National Employment Strategy 2013-2020); documents of the Government of Romania and of the Ministry for Youths and Sports (National Strategy for Youths, 2015-2020), reports, studies and statistics of the Agency for Education, Audiovisual and Culture (EACEA) within the European Commission, the Youth Department of the Council of Europe; the studies and analyses realised by the International Labour Office; the Organization for Economic Cooperation and Development; Eurostat, respectively the databank of the European Union, and of the World Bank; also the databank of the National Institute of Statistics and specialised papers published in country and abroad.

International Journal of Academic Research in Accounting, Finance and Management Sciences Vol. 6 (4), pp. 122–123, © 2016 HRMARS
124
4. Unemployment, the NEET status and emigration among youths’ from Romania within the European context
4.1. Characteristics of unemployment among youths
The unemployment rate for the age segment under 25 years, at EU-28 level was of 22.2% in the year 2014, on increase by 6.6 ppt. against the year 2007, but on slight decrease (-1.4 ppt.) against the year 2013 (Figure 1). For the age group15-29 years, the unemployment rate increased in the period 2007-2014 by 5.5 ppt., and its diminishment in 2014 against the preceding year was of only 1%. In Romania, in 2014, the unemployment rate among youths was also of 24% for the age group 15 to 24 years, and for the age group 25-29 years it was of 10.5%, on increase by 5.4 ppt., respectively 3.8 pp against the year 2007. On age groups, unemployment among young women was higher for the age group 15-24 years, the increase in 2014 against 2007 being for this age-group segment of young women of 6.4 ppt. (against 4.4 ppt. for the segment 25 to 29 years of age) (Figure 1a, 1b).
-20
-10
0
10
20
30
40
50
60
70
EU
-28
BE
BG
CZ
DK
GE
EE IE
GR
ES
FR
CR IT CY
LV
LT
LU
HU
MT
NL
AT
PL
PT
RO SI
SK FI
SE
GB
15-24 years 25-29 years
a) 2007-2014
-12
-10
-8
-6
-4
-2
0
2
4
6
8
EU
-28
BE
BG
CZ
DK GE
EE IE GR ES
FR
CR IT CY
LV
LT
LU
HU
MT
NL
AT
PL
PT
RO SI SK FI
SE GB
15-24 years 25-29 years
b) 2013-2014
Data source: Eurostat data, (online data code: [lfsa_urgan])
Figure 1. Percentage changes of the unemployment rate among youths

International Journal of Academic Research in Accounting, Finance and Management Sciences Vol. 6 (4), pp. 122–133, © 2016 HRMARS
125
In the majority of the member-states, the unemployment rate continued to increase also in 2014, as they faced extremely high unemployment rates. If adults registered an unemployment rate of over 9 percents in the year 2014, the youths faced an unemployment rate of 22.2% (Figure 2). This means that the ratio between the youths’ unemployment rate and the one of adults is of 2.47 for EU-28. This ratio was close to 4, or even higher in a series of countries: especially in Great Britain (3.84), Sweden (4.02), Italy (4.03), Romania (4.36) and Luxemburg (4.4) (Figure 2). The value of this ratio in Romania, places the country on the second place among the member-states (after Luxemburg).
UE-28BEBG
CZ
DK
GE
EE
PL
GRES
RO
CRIT
CY
LVLT
LU HU
MT NLAT
PL
PT
FR
SI
SK
FI
SE
GB
0
10
20
30
40
50
60
0 5 10 15 20 25 30
Unemployment rate - adult
Un
emp
loy
met
rat
e -
yo
uth
Data source: Eurostat statistics, (online data code: [lfsa_urgan])
Figure 2. Unemployment rate on age groups, in 2014 (%)
In other countries, the value of this ratio is under 2: Germany (1.64), Lithuania and the Netherlands (1.95) and Latvia (1.96). At the same time, the unemployment rate among youths registered high differences between countries. For instance, in some countries, it this rate was under 10% (Germany (7.7%), Austria (10.3%), Denmark (12.6%, Estonia (15%), and in other it was over 40%: Italy (42.7%), Croatia (45.5%), Greece (52.4%), Spain (53.2%). In the year 2014, in EU-28, the unemployment rate among youths was slightly lower for young women than for young men (in average by 1.4 pp).
The persistence of uncertain and fragile economic conditions, including on the labour market triggered in several countries an unprecedented increase of the unemployment duration. In the year 2014, 49.5% from the unemployed were registered in the long-term unemployment. The highest values were registered in Greece (73.5%), Slovakia (70.2%), Italy (61.4%), and Bulgaria (60.4%). In Romania, the long-term unemployment weight in total unemployed was of 41.1%. By contrast, long-term unemployment was less than 25% only in Sweden (18.9%) and Finland (22.4%), respectively countries with tradition in adopting active labour market policies that aim to diminish long-term unemployment.
The average for long-term unemployment among youths (15-29 years of age) in EU-28 was of 6.9% in most of the member-states, as this rate recorded slight decreases against the preceding year. The long-term unemployment rate among youths continued to increase in Greece (29.4%), Italy (18.5%). In Romania, the long-term unemployment rate among youths was of 6%, on decrease by 0.7 ppt. against the preceding year.
Unemployment among youths depends also on the education level. In general, for the age group 15-24 years, the highest unemployment is recorded among youths with pre-school, primary, and lower-secondary education (levels 0-2). The exceptions are Greece and Cyprus where the unemployment rate among youths with average studies (levels 3 - 4) was by approximately 2.9 ppt. higher, respectively 3,3 ppt. Than the one recoded by youths with pre-school, primary, and lower-secondary education (levels 0-2) (Table 1).

International Journal of Academic Research in Accounting, Finance and Management Sciences Vol. 6 (4), pp. 122–123, © 2016 HRMARS
126
Table 1. Unemployment rate on age groups and educational level in 2014, (%)
Education level 0-2 Education level 3-4 Education level 5-8
15-24 years 25-29 years 15-24 years 25-29 years 15-24 years 25-29 years
UE-28 30.3 26.9 19.9 12.2 16.5 10.5
Belgium 37.8 27.0 21.4 13.1 14.7 6.4
Bulgaria 45.1 32.4 21.2 13.3 19 9.8
Czech R. 32.4 26.4 13.9 6.8 13.3 6.1
Denmark 14.6 13.9 10.1 7.6 14.0 9.4
Germany 11.8 19.4 5.4 4.9 4.5 3.9
Estonia 20.7 18.9 13.6 9.4 12.7 6.6
Ireland 39.1 45.4 24.3 19.0 15.3 9.4
Greece 50.8 42.7 53.7 42.3 49.4 38.7
Spain 61.2 39.3 49.8 27.5 39.4 24.2
France 40.3 28.7 23.0 16.1 14.4 9.5
Croatia 66,9 52,0 45,1 21,8 31,6 22,4
Italy 48,8 28,8 40,8 20,4 34,3 25,7
Cyprus 34.3 18.4 37.6 19.5 34.3 20.4
Latvia 29.4 24.1 18.4 10.7 15.3 6.9
Lithuania 39.7 : 17.8 16.3 14.0 5.1
Luxemburg 24.7 24.5 19.8 : : 6.2
Hungary 34.7 23.7 17.3 9.2 16.8 5.0
Malta 22.2 12.8 8.0 : : :
Netherlands 17.3 14.4 9.6 8.0 7.6 4.4
Austria 14.4 19.1 9.0 6.5 7.2 5.6
Poland 29.8 29.3 23.9 13.0 19.5 8.8
Portugal 39.5 20.6 32.0 17.6 31.7 16.7
Romania 18.7 12.6 25.4 8.7 33.2 12.1
Slovenia 23.5 36.7 19.2 16.2 21.3 18.3
Slovakia 55.7 47.8 26.4 15.4 30.0 11.8
Finland 30.7 19.6 16.4 10.9 : 7.1
Sweden 39.5 25.8 17.0 8.0 14.0 6.4
Great Britain 32.4 17.1 15.4 7.3 9.8 3.8
Data source: Eurostat statistics
Romania is the only country where the differences between the weight of young unemployed with higher education and the one for youths with 0-2 and 3-4 educational levels (ISCED) are significant (Figure 3). For the age group 25-29 years, in the year 2014, in the majority of countries the weight of unemployed with higher education is much lower than the one of unemployed with the educational levels 0-2 or 3-4 (ISCED). In Italy, Romania, Slovenia, Denmark, Cyprus and Croatia for this age segment of youths, as well among those with tertiary education is much higher than for those with average educational level.
0
5
10
15
20
25
30
35
15-24
years
25-29
years
15-24
years
25-29
years
15-24
years
25-29
years
Levels 0-2 Levels 3-4 Levels 5-8
EU-28
RO
Data source: Eurostat statistics, (online data code: [yth_empl_90])
Figure 3. Unemployment rate on educational levels in Romania and EU-28, in the year 2014, (%)

International Journal of Academic Research in Accounting, Finance and Management Sciences Vol. 6 (4), pp. 122–133, © 2016 HRMARS
127
According to the statistics of the National Labour Force Employment Agency, in Romania, by the end of 2014, were registered 78185 youths with ages under 25 years and 39024 youths with ages between 25-29 years. From among these, 5933, respectively 5611 individuals were with higher education, against 33733 and 26796 with primary, lower secondary and vocational education. The weight of youths in long-term unemployment was, by the end of 2014, of 14. 77%.
4.2. Main characteristics of the NEET population
According to the latest Eurostat estimates, in 2014, the percentage of youths who are neither gainfully employed, nor in education or training and do not pursue an educational programme within the EU-28, varied from 6.4% for the age group 15-19 years, to 20.3% for the youths with ages between 25-29 years. This percentage varies significantly from one member-state to the other, for each of the age groups. Thus, for the age group from 15-19 years, the NEET rate varies from 2% in the Netherlands to 14.1% in Bulgaria. Thirteen of the member-states have a NEET rate for this age segment above the EU-28 average of 6.4%. For the age group 20-24 years, the NEET rate is higher than for the age group 15-19 years, and values under 9% are registered only in Slovenia and Romania (7.8%, respectively 8.4%). Belgium, Cyprus, and Great Britain are the only countries where the NEET rate exceeds the European Union average of 25.2%. High values of the NEET rate were recorded for the youths with ages between 25-29 years. In the Netherlands, 7% from the youths in this age segment are NEET and they represent the lowest value of this indicator. The vast majority of member-states registered regarding the NEET rate for this age segment of youth, in 2014, values above the EU-28 average of 20.3 ppt. In Romania, 24.6% from the youths with ages between 25-29 years were included in the NEET category.
Both inside one country, and in other countries, NEET represents a heterogeneous group. In the NEET category are included youths, irrespective of their educational level. The analysis of the educational level of the youths included in the NEET category reveals that those with lower educational levels are overrepresented in the NEET group. The analysis of the data about the structure of the NEET population with ages between 15 and 29 years in the year 2014 shows that in Spain and Malta the youths with lower educational level represented about 63% from total NEET population. If in the year 2013 the NEET rate for youths from the age group 15 to 29 years of age knew some slight increases in the majority of the member states, in the year 2014 the situation changed, respectively in most countries diminishments were registered for this indicator (Figure 4). One of the effects of the economic-financial crisis is also the increase in the NEET rate among youths with ISCED educational levels 3-8. From among the member-states, Greece recorded the highest increase in the weight of the NEET youths with ISCED levels 3-8 in the period 2007-2014 (by 10.5 percentage points) (Figure 4).
-4
-2
0
2
4
6
8
10
12
EU
-28
BE
BG
CZ
DK
GE
EE IE GR
ES
FR
CR IT CY
LV LT
LU
HU
MT
NL
AT
PL
PT
RO SI
SK FI
SE
GB
2014-2007 2014-2013 2013-2012
Data source: Eurostat statistics (online data code: [yth_empl_160]) Figure 4. Percentage changes in the weight of youths with ISCED levels 3-8, included in the NEET category,
2007-2014, 2014-2013, 2013-2014
International Journal of Academic Research in Accounting, Finance and Management Sciences Vol. 6 (4), pp. 122–123, © 2016 HRMARS
128
Countries like Croatia, Italy, and Cyprus have recorded increases between 6.7 and 8.8 percentage points. Decreases in the weight of youths with ISCED levels 3-8 among the NEET population are seen only in Germany (-1.7 percentage points). From the data no trend can be noticed about an increase of the weight in the NEET population of youths with higher educational levels in the countries that were most affected by the crisis (for instance, in Italy, Ireland or Portugal), as the change in the NEET structure is relatively moderate.
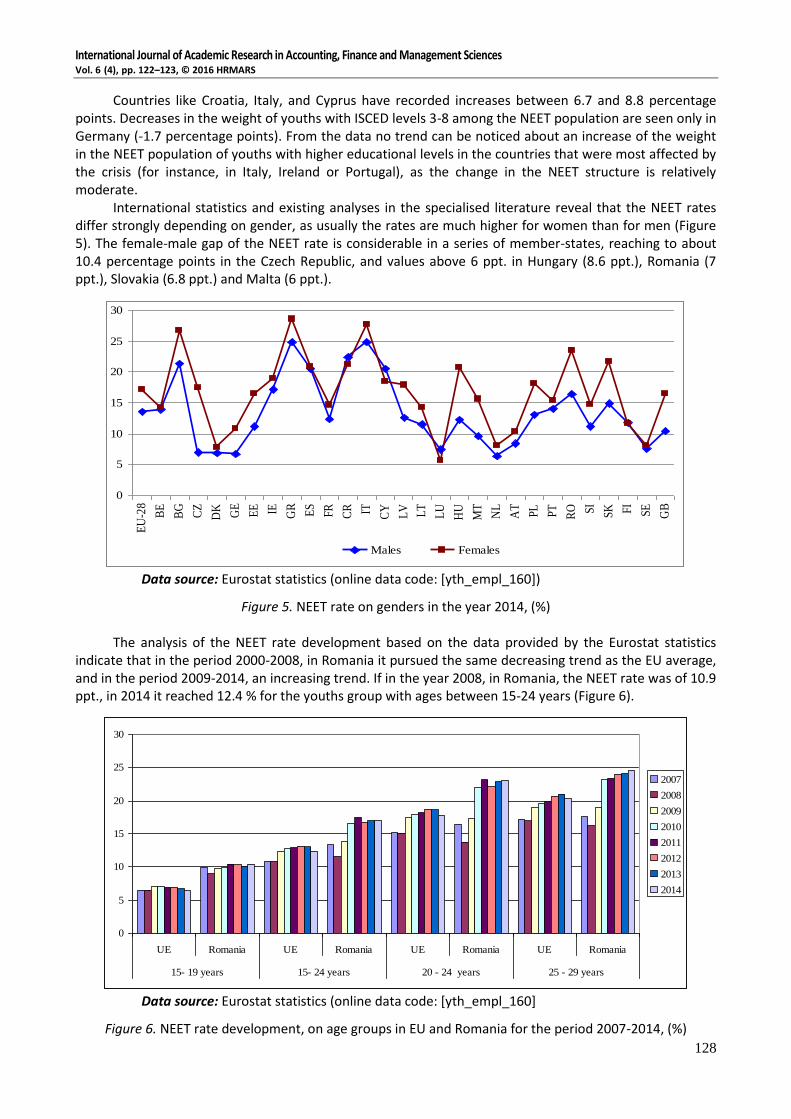
International statistics and existing analyses in the specialised literature reveal that the NEET rates differ strongly depending on gender, as usually the rates are much higher for women than for men (Figure 5). The female-male gap of the NEET rate is considerable in a series of member-states, reaching to about 10.4 percentage points in the Czech Republic, and values above 6 ppt. in Hungary (8.6 ppt.), Romania (7 ppt.), Slovakia (6.8 ppt.) and Malta (6 ppt.).
0
5
10
15
20
25
30
EU
-28
BE
BG
CZ
DK
GE
EE IE GR
ES
FR
CR IT CY
LV LT
LU
HU
MT
NL
AT
PL
PT
RO SI
SK FI
SE
GB
Males Females
Data source: Eurostat statistics (online data code: [yth_empl_160])
Figure 5. NEET rate on genders in the year 2014, (%)
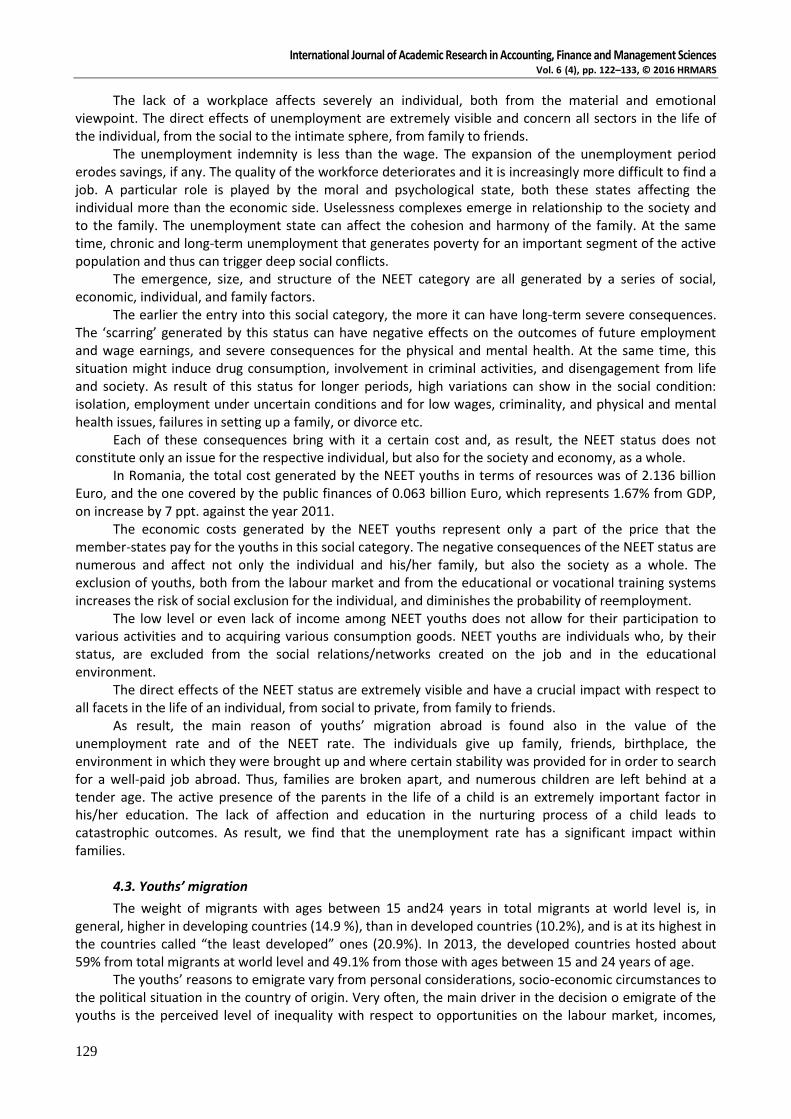
The analysis of the NEET rate development based on the data provided by the Eurostat statistics indicate that in the period 2000-2008, in Romania it pursued the same decreasing trend as the EU average, and in the period 2009-2014, an increasing trend. If in the year 2008, in Romania, the NEET rate was of 10.9 ppt., in 2014 it reached 12.4 % for the youths group with ages between 15-24 years (Figure 6).
0
5
10
15
20
25
30
UE Romania UE Romania UE Romania UE Romania
15- 19 years 15- 24 years 20 - 24 years 25 - 29 years
2007
2008
2009
2010
2011
2012
2013
2014
Data source: Eurostat statistics (online data code: [yth_empl_160]
Figure 6. NEET rate development, on age groups in EU and Romania for the period 2007-2014, (%)
International Journal of Academic Research in Accounting, Finance and Management Sciences Vol. 6 (4), pp. 122–133, © 2016 HRMARS
129
The lack of a workplace affects severely an individual, both from the material and emotional viewpoint. The direct effects of unemployment are extremely visible and concern all sectors in the life of the individual, from the social to the intimate sphere, from family to friends.
The unemployment indemnity is less than the wage. The expansion of the unemployment period erodes savings, if any. The quality of the workforce deteriorates and it is increasingly more difficult to find a job. A particular role is played by the moral and psychological state, both these states affecting the individual more than the economic side. Uselessness complexes emerge in relationship to the society and to the family. The unemployment state can affect the cohesion and harmony of the family. At the same time, chronic and long-term unemployment that generates poverty for an important segment of the active population and thus can trigger deep social conflicts.
The emergence, size, and structure of the NEET category are all generated by a series of social, economic, individual, and family factors.
The earlier the entry into this social category, the more it can have long-term severe consequences. The ‘scarring’ generated by this status can have negative effects on the outcomes of future employment and wage earnings, and severe consequences for the physical and mental health. At the same time, this situation might induce drug consumption, involvement in criminal activities, and disengagement from life and society. As result of this status for longer periods, high variations can show in the social condition: isolation, employment under uncertain conditions and for low wages, criminality, and physical and mental health issues, failures in setting up a family, or divorce etc.
Each of these consequences bring with it a certain cost and, as result, the NEET status does not constitute only an issue for the respective individual, but also for the society and economy, as a whole.
In Romania, the total cost generated by the NEET youths in terms of resources was of 2.136 billion Euro, and the one covered by the public finances of 0.063 billion Euro, which represents 1.67% from GDP, on increase by 7 ppt. against the year 2011.
The economic costs generated by the NEET youths represent only a part of the price that the member-states pay for the youths in this social category. The negative consequences of the NEET status are numerous and affect not only the individual and his/her family, but also the society as a whole. The exclusion of youths, both from the labour market and from the educational or vocational training systems increases the risk of social exclusion for the individual, and diminishes the probability of reemployment.
The low level or even lack of income among NEET youths does not allow for their participation to various activities and to acquiring various consumption goods. NEET youths are individuals who, by their status, are excluded from the social relations/networks created on the job and in the educational environment.
The direct effects of the NEET status are extremely visible and have a crucial impact with respect to all facets in the life of an individual, from social to private, from family to friends.
As result, the main reason of youths’ migration abroad is found also in the value of the unemployment rate and of the NEET rate. The individuals give up family, friends, birthplace, the environment in which they were brought up and where certain stability was provided for in order to search for a well-paid job abroad. Thus, families are broken apart, and numerous children are left behind at a tender age. The active presence of the parents in the life of a child is an extremely important factor in his/her education. The lack of affection and education in the nurturing process of a child leads to catastrophic outcomes. As result, we find that the unemployment rate has a significant impact within families.
4.3. Youths’ migration
The weight of migrants with ages between 15 and24 years in total migrants at world level is, in general, higher in developing countries (14.9 %), than in developed countries (10.2%), and is at its highest in the countries called “the least developed” ones (20.9%). In 2013, the developed countries hosted about 59% from total migrants at world level and 49.1% from those with ages between 15 and 24 years of age.
The youths’ reasons to emigrate vary from personal considerations, socio-economic circumstances to the political situation in the country of origin. Very often, the main driver in the decision o emigrate of the youths is the perceived level of inequality with respect to opportunities on the labour market, incomes,

International Journal of Academic Research in Accounting, Finance and Management Sciences Vol. 6 (4), pp. 122–123, © 2016 HRMARS
130
human rights and standards of living between countries of origin and the countries of destination. In general, the probability to migrate is higher among youths with, at least, upper-secondary education.
Romanians’ decision, in general, and of the Romanian youth, in particular, to migrate is influenced by a series of factors related to the national economic potential of the country which is in a continuous decline for the last two twenty-five years. Other reasons are the incomes of the largest part of the population, the increase in unemployment, increase in the NEET rate, poverty, labour force market liberalisation at world level etc. According to the statistical data supplied by the National Institute of Statistics4, on January 1st 2013, Romania had 2344183 emigrants, from which 19056 Romanian citizens with permanent residence abroad (Figure 7). From total final emigrants, in 2013, 24% represented youths under the age of 18 years, and approximately 22% were those with ages between 18 and 25 years.
0%
10%
20%
30%
40%
50%
60%
70%
80%
90%
100%
2008 2009 2010 2011 2012 2013
61 years and over
51-60 years
41-50 years
26-40 years
18-25 years
Under 18 years
Date source: Statistical yearbook, 2014, National Institute of Statistics
Figure 7. Evolution of Romanian permanent emigrants by age group
The preferred destinations for Romanians remain Italy and Spain (Figure 8), yet, fir the last years they also went to German-speaking Northern countries, which were less affected by the crisis than the “Latin” countries (Figure 8).
Italy, 39.82
Greece, 1.28
Germany, 9.35
Belgium, 2.19
Austria, 2.28Other countries, 6.28
Hungary, 1.48
Spain, 32.83
United Kingdom, 4.49
Austria
Belgium
Germany
Greece
Italy
United Kingdom
Spain
Hungary
Other countries
Date source: Statistical Yearbook, 2014, National Institute of Statistics
Figure 8. Romanian Emigrants, by country of destination, on January 1, 2013
4 Romanian Statistical Yearbook 2014, National Statistical Institute

International Journal of Academic Research in Accounting, Finance and Management Sciences Vol. 6 (4), pp. 122–133, © 2016 HRMARS
131
Even if the weight of young migrants knew a decrease in the period 2008-2013 from 41.38% in 2008 to 28.12% in 2013, still, the number of young migrants continues to be worrying (659115 individuals in 2013). The weights for the youths with ages between 20-24 years and, respectively, 25-29 years are the highest in total young emigrants (Figure 9).
0
50000
100000
150000
200000
250000
300000
350000
400000
2008 2009 2010 2011 2012 2013
Under 15 years 15-19 years 20-24 years 25-29 years
Date source: Statistical Yearbook, 2014, National Institute of Statistics
Figure 9. Evolution of Romanian youth emigrants by age group
The same decreasing trend is recorded, in the analysed period also among young ‘temporary’ migrants (Figure 10), as in 2013 were registered less than half from the number of young migrants from the year 2008.
0
10000
20000
30000
40000
50000
60000
2008 2009 2010 2011 2012 2013
Under 15 years 15-19 years 20-24 years 25-29 years
Date source: Statistical Yearbook, 2014, National Institute of Statistics
Figure 10. Evolution of Romanian youth temporary emigrants by age group
Youths’ migration has both positive consequences and negative ones. Among the most important positive consequences are counted: obtaining higher incomes, the opportunity of developing their knowledge and working skills; career development; gaining expertise in accordance with the requirements on the labour market, and gaining higher standards of living etc.
Some of the most significant negative consequences of youths’ migration from Romania are represented by the more accelerated population ageing process and the failure in recovering investments

International Journal of Academic Research in Accounting, Finance and Management Sciences Vol. 6 (4), pp. 122–123, © 2016 HRMARS
132
in education and vocational training. To these are added: the loss of budgetary taxes and duties that were paid by these youths; diminishment in the quality of the educational and research services, because this type of labour force is required for working in research-development and innovation fields and training takes longer periods of time etc.
5. Conclusions
At global level, even if national economies succeeded to a certain extent in recovering and reaching the increase levels of the pre-crisis period, still the creation of new jobs is not yet enough for diminishing the pressures on the labour force market. Young individuals were most affected by the recent economic-financial crisis, and their employment perspectives diminished as the unemployment rate reached alarmingly high values. In the year 2014, at world level, the unemployment rate among youths reached 13.2, and it was almost three times higher than the unemployment rate among adults. In the same year, in the labour market were employed by less than 37.1 million youths against the year 2007, under the conditions in which the global youth population decreased by only 8.1 million individuals in the same period.
The unemployment rate among youths affected differently the various age segments among youths. Thus, the average unemployment rate, at EU-28 level, was of 22.2% in 2014 for the age group segment 15-24 years, (on increase by 6,6 ppt. against the year 2007, but on slight decrease by 1.4 ppt., against the year 2013). The same average was 13.6% for the age group segment 25-29 years (which increased by 4.9 ppt. in the period 2007-2014, and the diminishment for this segment in the year 2014 against the preceding year was of only 1%). Also in Romania, in 2014, the unemployment rate among youths with ages between 15-24 years was of 24% and for the age group 25-29 years of 10.5%, on increase by 5.4 ppt., respectively 3.8 ppt. against the year 2007. Differentiations of the unemployment rate were recorded also between young men and young women. Thus, unemployment among young women was higher for the age group 15-24 years, the increase in 2014 against 2007 being by 6.4 ppt. (against 4.4 ppt. for the age segment 25-29 years).
In 2014, the percentage of youths who were neither employed, nor in education or training within the EU-28 varied from 6.4% for the age group 15-19 years, to 20.3% for youths with ages between 25-29 years. This percentage varies significantly from one member-state to the other, on each age group. In Romania, 24.6% from the youths with ages between 25-29 years were included in the NEET category.
The migration flows consisting from young migrants are defined and differentiated depending on their socio-economic level, education, and competence profiles, and by their nationality. The motivations to migrate of the youths are almost identical to those of the adults, but young individuals are more flexible regarding their migration for labour: temporary against the long-term migration. Moreover, young individuals tend to assume higher risks, and can migrate even if the opportunity of a job is not certain and are very often motivated not only by the economic gain, but also by the aim of personal development.
References
1. Bell, D.N.F. and. Blanchflower D.G., (2010), “Youth Unemployment: Déjà Vu?”, IZA DP No. 4705, www.iza.org.
2. Bell, D.N.F. and. Blanchflower D.G., (2011), “Young People and the Great Recession”, IZA discussion paper 5674, www.iza.org.
3. Blanchflower, D.G. and Freeman, R. (2000), “Introduction to Youth Employment and Joblessness in Advanced Countries”, NBER Chapters, in: Youth Employment and Joblessness in Advanced Countries, pages 1-16 National Bureau of Economic Research, Inc., www.nber.org.
4. Chen, Y.W. (2011), Once a NEET always a NEET? Experiences of employment and unemployment among youth in a job training programme in Taiwan, International Journal of Social Welfare, Vol. 20, pp. 33–42, www.onlonelibrsry.wiley.com.
5. Contini, B. (2010), “Youth Employment in Europe: Institutions and Social Capital Explain Better than Mainstream Economics”, www.iza.org.
6. Gangl, M. (2003), “Unemployment insurance and the stability of earnings: A comparison of work exits from unemployment in the United States and West Germany”, Schmollers Jahrbuch 123 (1): 83-94.
International Journal of Academic Research in Accounting, Finance and Management Sciences Vol. 6 (4), pp. 122–133, © 2016 HRMARS
133
7. Giovanni, S.F.B., Marelli, E., and Signorelli, M. (2013), Young People in Crisis: NEETs and Unemployed in EU Regions, Paper to be presented at: 53rd ERSA Congress 27-31 August 2013 - Palermo, Italy, http://www-sre.wu.ac.at.
8. Hughes, D., Borbély-Pecze, T.B. (2012), Youth Unemployment: Crisis in Our Midst. The role of lifelong guidance policies in addressing labour supply and demand. The European Lifelong Guidance Policy Network (ELGPN), Printed by Kariteam, Finland.
9. Jimeno, J.F. and Rodríguez-Palenzuela, D. (2002). “Youth unemployment in the OECD: Demographic shifts, labour market institutions, and macroeconomic shocks”, www.ideas.repec.org.
10. Martin, G. (2009), “A Portrait of the Youth Labor Market in 13 Countries, 1980–2007”. In Monthly Labor Review 2009 July: 3–21, www.bls.gov.
11. Mroz and Savage, (2006), The Long-Term Effects of Youth Unemployment, http://www.unc.edu; 12. Puerto, O.S., (2007), Labor Market Impact on Youth: A meta-analysis of the Youth Employment
Inventory, www.siteresources.worldbank.org. 13. Schmillen, A. and Umkehrer, M. (2013), The Scars of Youth-Effects of Early-Career Unemployment
on Future Unemployment Experience, IAB Discussion Paper Articles on labour market issues, 6/2013, www.iab.de.
14. Zimmermann, K.F, Biavaschi, C., Eichhorst, W., Giulietti C., and others, (2013), Youth Unemployment and Vocational Training, Foundations and Trends R©in Microeconomics, Vol. 9, Nos. 1–2 (2013) 1–157, www.iza.org.
15. Anuarul Statistic al României, 2014, Institutul Naţional de Statistică. 16. Baza de date TEMPO-online, Institutul Naţional de Statistică al României, www.insse.ro. 17. Eurofound (2012), Recent policy developments related to those not in employment, education and
training (NEETs), Eurofound, Dublin, http://www.eurofound.europa.eu. 18. Eurofound (2015), Young people and 'NEETs', http://www.eurofound.europa.eu. 19. Eurostat Statistics, www.eu.europe.eu. 20. Global Employment Trends 2013: Global Employment Trends for Youth 2013, A generation at risk;
ILO, 2013, www.ilo.org. 21. International Migration Outlook 2013, www.oecd.org. 22. Migration and Development Brief 20., (2013), UN, http://siteresources. worldbank.org; 23. Situaţia şomajului la 31 decembrie 2014, ANOFM, www.anofm.ro. 24. Statistici, Agenţia Naţională pentru Ocuparea Forţei de Muncă, www. anofm.ro. 25. The World Youth Report 2013 - Youth andMigration, Published by the United Nations, The
Department of Economic and Social Affairs of the United Nations Secretariat, www.UNWorldYouth Report.org.
26. Tinerii competenţi pentru România!, Aliaţa Naţională a Studentilor din România, www.anosr.ro. 27. World Youth Report, 2013, Published by the United Nations. 28. Young people and NEETs in Europe: European Foundation for the Improvement of Living and
Working Conditions, TJ-32-11-956-EN-C, www.eurofound.europa.eu.